Embed Size (px)
Citation preview

Designing a QSAR
for ER Binding

QSAR
Xenobiotic
ER Binding
AlteredProtein
Expression
Altered Hormone Levels,
Ova-testis
Chg 2ndry Sex Char,
AlteredRepro.
Defining Toxicity Pathways Across Levels of Biological Organization:
Direct Chemical Binding to ER
Toxicological Understanding
Risk Assessment Relevance
In vivo AssaysIn vitro Assays
MOLECULARCELLULAR
TISSUE/ORGANINDIVIDUAL
Skewed Sex
Ratios,AlteredRepro.
POPULATION

QSARs for PrioritizationWhat: • Prioritize chemicals based on ability to bind ER (plausibly linked to adverse effect)• Determine which untested chemicals should be tested in assays that will detect this activity, prioritized above very low risk chemicals for this effect• Demonstrate how QSARs are built, for complex problems, and are useful to regulators/risk assessors
Why: •To provide EPA with predictive tools for prioritization of testing requirements and enhanced interpretation of exposure, hazard identification and dose-response information•Develop the means to knows what to test, when to test, how•FQPA - Little of no data for most inerts/antimicrobials; short timeline for assessments;

Lessons Learned from early EPA exercise1) High quality data is critical and should not be assumed
– Models can be no better than the data upon which they are formulated
– Assays should be optimized to determine the adequacy for the types of chemicals found within regulatory lists
• Assumption that assays adequate for high-medium potency chemicals will detect low potency chemicals warrants careful evaluation
– Mechanistic understanding should be sought; new information incorporated when available
• Assumption that ER binding mechanism was well understood warrants careful evaluation
2) Defining a regulatory domain is not a trivial exercise– Assumption that ~6000 HPVCs would represent additional
regulatory domains needs careful evaluation; regulatory lists need to be defined
– Structure verification is needed for all chemicals on regulatory lists
3) Determining coverage of regulatory domain is non-trivial – Using a TrSet of “found” data (which included few chemicals
structures found in regulatory domain) proved to be inadequate to complete QSAR development
– QSAR development is an iterative process that requires systematic testing within regulatory domain of interest
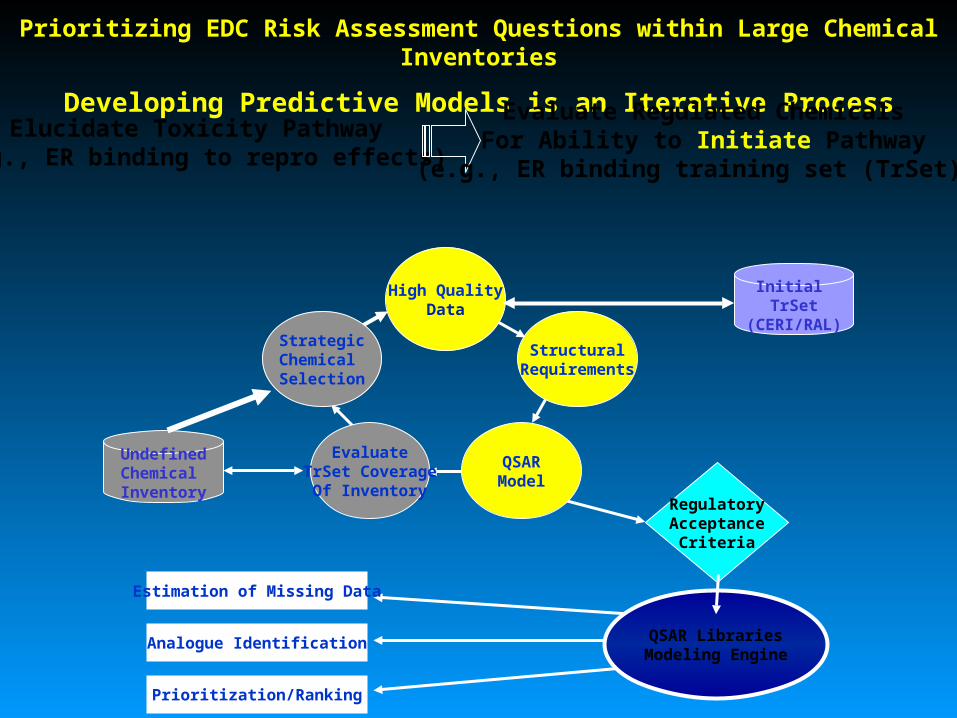
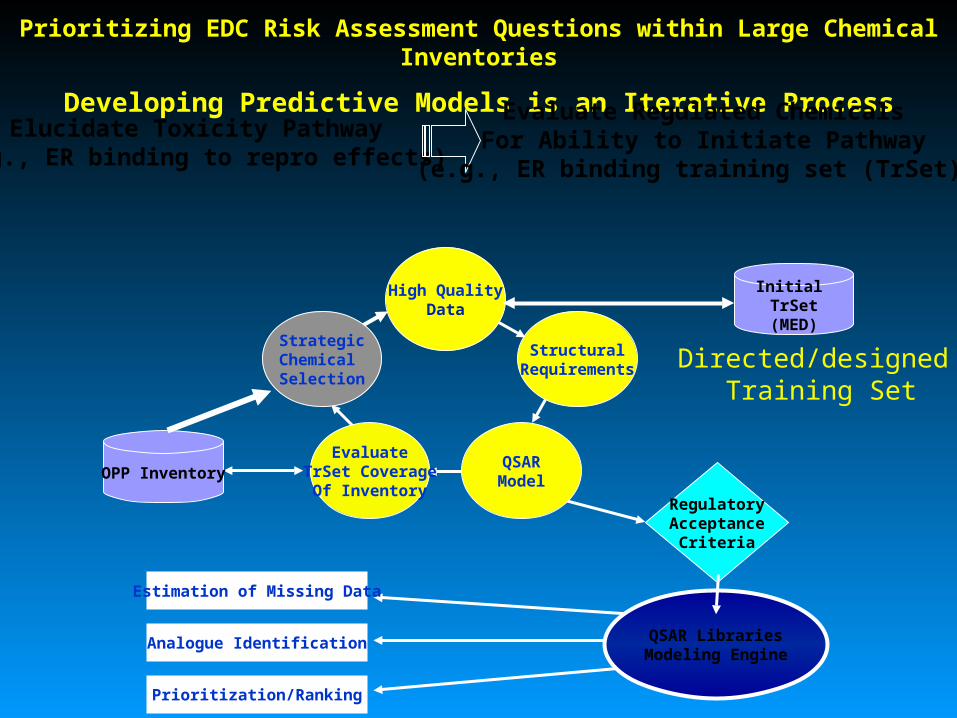
Prioritizing EDC Risk Assessment Questions within Large Chemical Inventories
Developing Predictive Models is an Iterative Process
High QualityData
StrategicChemical Selection
EvaluateTrSet Coverage
Of Inventory
QSARModel
StructuralRequirements
RegulatoryAcceptance
Criteria
QSAR LibrariesModeling Engine
Estimation of Missing Data
Analogue Identification
Prioritization/Ranking
Elucidate Toxicity Pathway(e.g., ER binding to repro effects)
Evaluate Regulated ChemicalsFor Ability to Initiate Pathway
(e.g., ER binding training set (TrSet))
Initial TrSet
(CERI/RAL)
UndefinedChemical Inventory

Prioritizing EDC Risk Assessment Questions within Large Chemical Inventories
Developing Predictive Models is an Iterative Process
High QualityData
StrategicChemical Selection
EvaluateTrSet Coverage
Of Inventory
QSARModel
StructuralRequirements
RegulatoryAcceptance
Criteria
QSAR LibrariesModeling Engine
Estimation of Missing Data
Analogue Identification
Prioritization/Ranking
Elucidate Toxicity Pathway(e.g., ER binding to repro effects)
Evaluate Regulated ChemicalsFor Ability to Initiate Pathway
(e.g., ER binding training set (TrSet))
Initial TrSet(MED)
OPP Inventory
Directed/designed Training Set

High quality data is critical
– Assays should be optimized to determine the adequacy for the types of chemicals on the relevant regulatory list
• Test assays on low potency chemicals• Test to solubility
HOW to test?
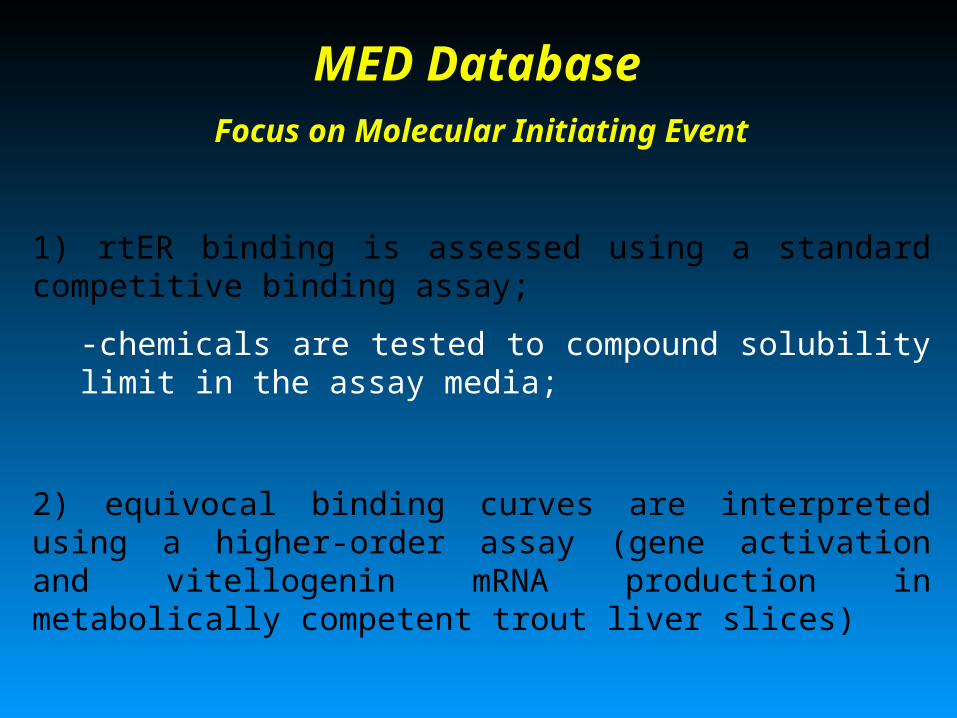
MED Database
Focus on Molecular Initiating Event
1) rtER binding is assessed using a standard competitive binding assay;
-chemicals are tested to compound solubility limit in the assay media;
2) equivocal binding curves are interpreted using a higher-order assay (gene activation and vitellogenin mRNA production in metabolically competent trout liver slices)

0.0001
0.001
0.01
0.1
1
10
100
1000
0.0001 0.001 0.01 0.1 1 10 100 1000
rat ER vs rainbow trout ER for 55 chemicals

-10 -9 -8 -7 -6 -5 -4 -3 -2 -10
0
10
20
30
40
50
60
70
80
90
100
110
E2 100DES 179OHTAM 35GEN 1.7pNP 0.046KMF 0.030RES 0.0006
TBS NBBBC NBBAM NB
RBA (%)
Concentration (Molar)
[3H
]-E
2 B
ind
ing
(%
)

CRTL
0
10
20
30
40
50
60
70
80
90
100
E2 rbtER (cyto)PTOP rbtER (cyto)
Log Concentration (M)-10 -9 -8 -7 -6 -5 -4 -3 -2
E2 hER (recomb-full) FPPTOP hER (recomb-full) FP
125
150
175
200
225
250
275
300
325
350
E2 hER (recomb-LBD)PTOP hER (recomb-LBD)
solubility limit
RBA %
0.075
0.253
0.124
Binding Assaysp-tert-octylphenol
Bin
din
g (%
)
Polarization
(mp
)
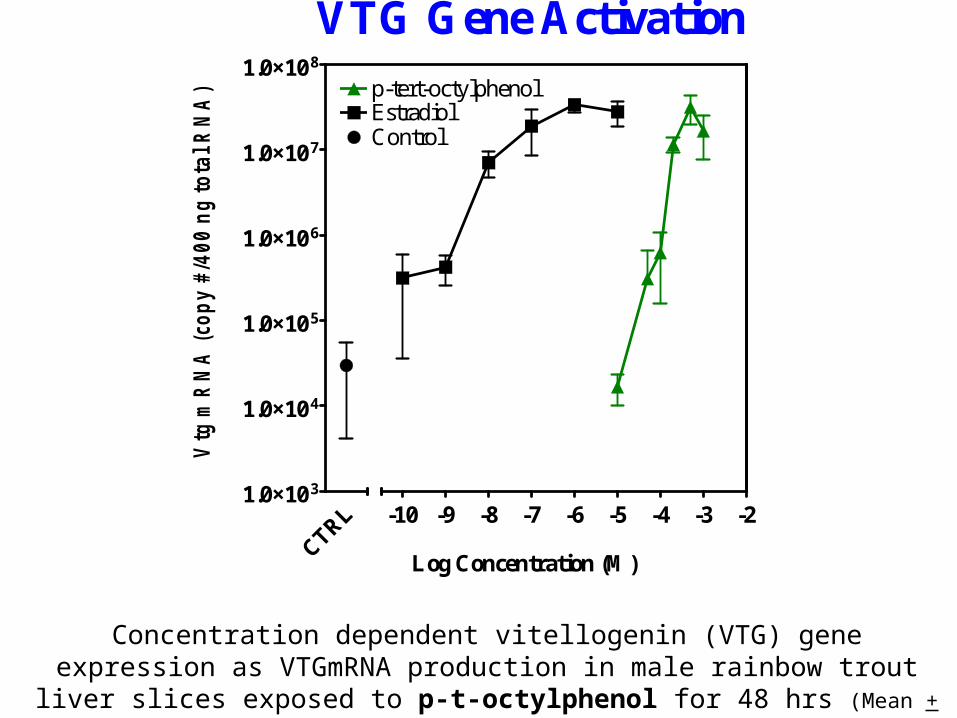
Concentration dependent vitellogenin (VTG) gene expression as VTGmRNA production in male rainbow trout liver slices exposed to p-t-octylphenol for 48 hrs
(Mean + STDS, n=5).
CTRL1.0×10 3
1.0×10 4
1.0×10 5
1.0×10 6
1.0×10 7
1.0×10 8
0.0
0.1
0.2
0.3
0.4
0.5
0.6
0.7
0.8
0.9
1.0
-10 -9 -8 -7 -6 -5 -4 -3 -2
ControlEstradiolp-tert-octylphenol
VTG Gene Activation
Log Concentration (M)
Vtg
mR
NA
(co
py
#/40
0 n
g to
tal R
NA
)

CRTL
0
10
20
30
40
50
60
70
80
90
100
E2 rbtER (cyto)
Log Concentration (M)-10 -9 -8 -7 -6 -5 -4 -3 -2
E2 hER (recomb-full)FP
125
150
175
200
225
250
275
300
325
350
E2 hER (recomb-LBD)PNOP hER (recomb-LBD)
PNOP rbtER (cyto)solubility limit
PNOP hER (recomb-full)FP
Binding Assaysp-n-octylphenol
RBA %
0.027
0.173
ND
Bin
din
g (%
)
Polarization
(mp
)

CRTL
0
10
20
30
40
50
60
70
80
90
100
E2 rbtER (cyto)
Log Concentration (M)-10 -9 -8 -7 -6 -5 -4 -3 -2
E2 hER (recomb-full)FP
150
175
200
225
250
275
300
325
350
E2 hER (recomb-LBD)BA hER (recomb-LBD)
solubility limit BA rbtER (cyto)
BA hER (recomb-full)FP
Binding Assays4-n-butylaniline
RBA %
0.0004
0.007
NB
Bin
din
g (%
)
Polarization
(mp
)

CTRL1.0×10 2
1.0×10 3
1.0×10 4
1.0×10 5
1.0×10 6
1.0×10 7
1.0×10 8
0.0
0.1
0.2
0.3
0.4
0.5
0.6
0.7
0.8
0.9
1.0
-10 -9 -8 -7 -6 -5 -4 -3 -2
VTG Gene Activation
Estradiol4-n-butylaniline
Control
Log Concentration (M)
Vtg
mR
NA
(co
py
#/40
0 n
g to
tal R
NA
)
4-n-butylaniline(Mean + STDS, n=5)

-11 -10 -9 -8 -7 -6 -5 -4 -3 -2 -1-10
0
10
20
30
40
50
60
70
80
90
100
110
E2 rbtER (cyto)SDP rbtER (cyto)E2 hER (recomb-LBD)SDP hER (recomb-LBD)
solubility limit
Binding Assays4,4'-sulfonyldiphenol
RBA %
0.0020
0.0055
Log Concentration (M)
Bin
ding
(%
)
-11 -10 -9 -8 -7 -6 -5 -4 -3 -2 -1-10
0
10
20
30
40
50
60
70
80
90
100
110
E2 rbtER (cyto)SDP rbtER (cyto)E2 hER (recomb-LBD)SDP hER (recomb-LBD)
solubility limit
Binding Assays4,4'-sulfonyldiphenol
RBA %
0.0020
0.0055
Log Concentration (M)
Bin
ding
(%
)
CRTL
0
10
20
30
40
50
60
70
80
90
100
Log Concentration (M)-10 -9 -8 -7 -6 -5 -4 -3 -2
solubility limitRBA %
0.0008
ND
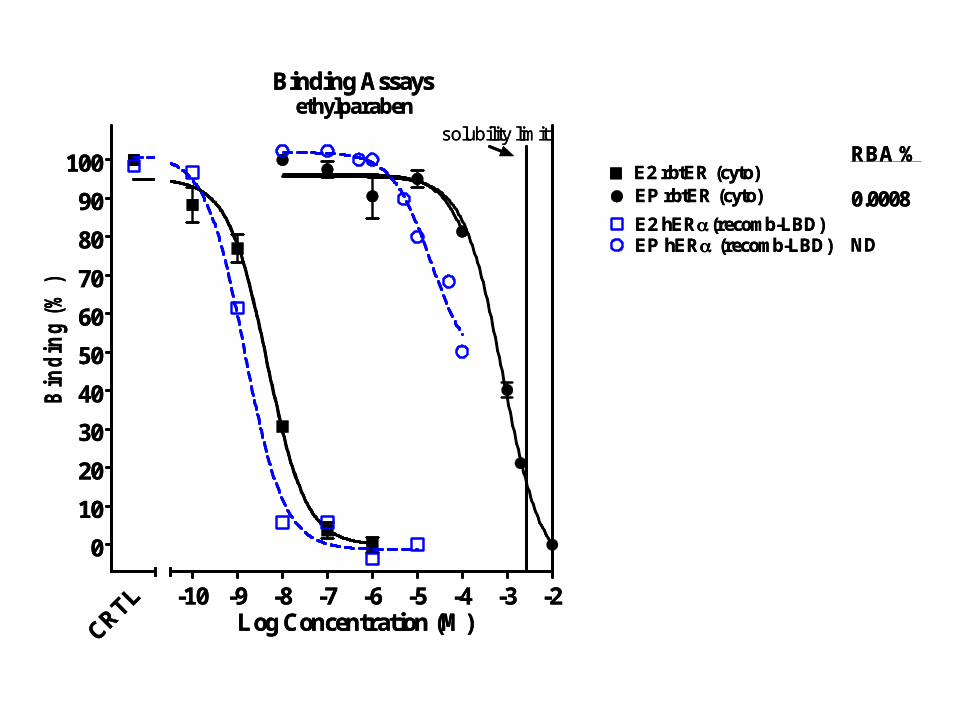
Binding Assays ethylparaben
E2 rbtER (cyto)EP rbtER (cyto)
E2 hER(recomb-LBD)EP hER (recomb-LBD)
Bin
din
g (%
)
CRTL
0
10
20
30
40
50
60
70
80
90
100
Log Concentration (M)-10 -9 -8 -7 -6 -5 -4 -3 -2
solubility limitRBA %
0.0008
ND
Binding Assays ethylparaben
E2 rbtER (cyto)EP rbtER (cyto)
E2 hER(recomb-LBD)EP hER (recomb-LBD)
Bin
din
g (%
)

CRTL
0
10
20
30
40
50
60
70
80
90
100
Log Concentration (M)-10 -9 -8 -7 -6 -5 -4 -3 -2
125
150
175
200
225
250
275
300
325
350RBA %
0.00057
0.0098
Binding Assays resorcinol sulfide
E2 hER (recomb-full)FPRES hER (recomb-full)FP
E2 rbtER (cyto)RES rbtER (cyto)
Bin
din
g (%
)
Polarization
(mp
)
CRTL
0
10
20
30
40
50
60
70
80
90
100
Log Concentration (M)-10 -9 -8 -7 -6 -5 -4 -3 -2
125
150
175
200
225
250
275
300
325
350RBA %
0.00057
0.0098
Binding Assays resorcinol sulfide
E2 hER (recomb-full)FPRES hER (recomb-full)FP
E2 rbtER (cyto)RES rbtER (cyto)
Bin
din
g (%
)
Polarization
(mp
)

CTRL1.0×10 1
1.0×10 2
1.0×10 3
1.0×10 4
1.0×10 5
1.0×10 6
1.0×10 7
1.0×10 8
0.0
0.1
0.2
0.3
0.4
0.5
0.6
0.7
0.8
0.9
1.0
-10 -9 -8 -7 -6 -5 -4 -3 -2
VTG Gene Activation
EstradiolResorcinol sulfide
Control
Resorcinol sulfide
Log Concentration (M)
Vtg
mR
NA
(co
py
#/40
0 n
g to
tal R
NA
)
resorcinol sulfide (Mean + STDS, n=5; dashed line indicates toxic concentrations).

Data collected needs to address the problem
• Expand training set to cover types of chemicals on the relevant regulatory lists
WHAT to test?

Prioritizing EDC Risk Assessment Questions within Large Chemical Inventories
Developing Predictive Models is an Iterative Process
High QualityData
StrategicChemical Selection
EvaluateTrSet Coverage
Of Inventory
QSARModel
StructuralRequirements
RegulatoryAcceptance
Criteria
QSAR LibrariesModeling Engine
Estimation of Missing Data
Analogue Identification
Prioritization/Ranking
Elucidate Toxicity Pathway(e.g., ER binding to repro effects)
Evaluate Regulated ChemicalsFor Ability to Initiate Pathway
(e.g., ER binding training set (TrSet))
Initial TrSet(MED)
OPP Inventory
Directed/designed Training Set

2) Defining a regulatory domain is not a trivial exercise
3) Determining coverage of regulatory domain is non-trivial – Using a TrSet of “found” data (which
included few chemicals structures found in regulatory domain) proved to be inadequate to complete QSAR development
– QSAR development is an iterative process that requires systematic testing within regulatory domain of interest
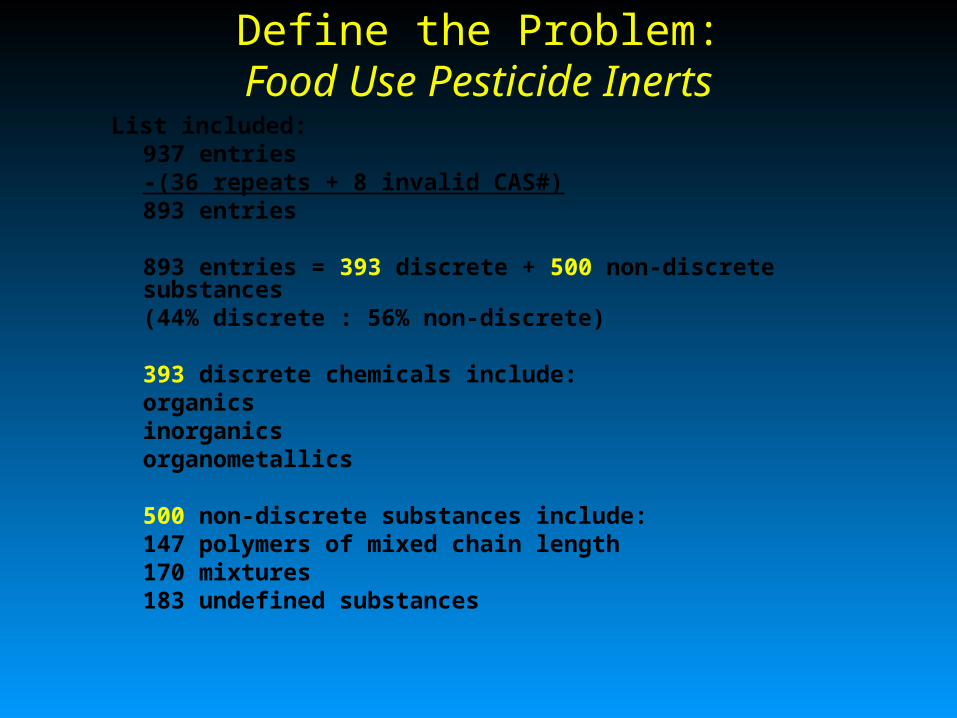
Define the Problem:Food Use Pesticide Inerts
List included: 937 entries
-(36 repeats + 8 invalid CAS#)893 entries
893 entries = 393 discrete + 500 non-discrete substances(44% discrete : 56% non-discrete)
393 discrete chemicals include:organicsinorganicsorganometallics
500 non-discrete substances include:147 polymers of mixed chain length170 mixtures 183 undefined substances

Chemical Category
Total Discrete Defined
Mixtures
Polymers Undefined
Substance
Food Use Inerts
893 393 170 147 183
Antimicrobials 224 169 27 6 22
Sanitizers 104 69 10 19 6
Antimicrobials
+ Sanitizers
299 211 35 25 28
HPV
IUR 2002
2708 1605 284 50 769
Total Inerts* (OPP website,
Aug 2004)
2891 1462 155 579 695
Registered Pesticide
Active Ingredients*
1110 873 33 10 194
OPP Chemical Inventories
* Structure verification in progress
Prioritizing EDC Risk Assessment Questions within Large Chemical Inventories
Developing Predictive Models is an Iterative Process
High QualityData
StrategicChemical Selection
EvaluateTrSet Coverage
Of Inventory
QSARModel
StructuralRequirements
RegulatoryAcceptance
Criteria
QSAR LibrariesModeling Engine
Estimation of Missing Data
Analogue Identification
Prioritization/Ranking
Elucidate Toxicity Pathway(e.g., ER binding to repro effects)
Evaluate Regulated ChemicalsFor Ability to Initiate Pathway
(e.g., ER binding training set (TrSet))
Initial TrSet(MED)
OPP Inventory
Directed/designed Training Set

Original ER Binding Training Sets• Initial focus of ER binding data sets from 1990s - 2004:
– Steroids, anti-estrogens (high potency binders)
– Organochlorines– Alkylphenols
CERI
hER
NCTR
rER
MED
rtER
Food
Use
Inerts
Anti-
microbial
HPV
Inerts
HPV
TSCA
Steroid,
Anti-E2,
OrganoCl
150
(30%)
91
(40%)
37 2
(<1%)
2
(1%)
6
(1%)
178
(3%)
Alkyl-
phenols
35
(7%)
13
(6%)
22 3
(1%)
7
(3%)
6
(1%)
71
(1%)
Covered groups as % of total
37% 46% 2% 4% 2% 4%

Building New Training Sets• New inventories
– Food Use Inerts– Antimicrobials and Sanitizers– HPV inerts– Total Inerts– HPV TSCA chemicals
CERI
(hER)
NCTR
(rER)
ORD-MED
(rtER)
Food Use Inerts
A/S HPV
Inerts
HPV
TSCA
Acyclics 3
(0.6%)
6
(2.6%)
22
(10%)
230
(59%)
121
(57%)
291
(65%)
2655
(41%)
Aromatic
Sulfates
4
(0.8%)
1
(0.4%)
15 88
(22%)
6
(3%)
15
(3%)
347
(5%)

Prioritizing EDC Risk Assessment Questions within Large Chemical Inventories
Developing Predictive Models is an Iterative Process
High QualityData
StrategicChemical Selection
EvaluateTrSet Coverage
Of Inventory
QSARModel
StructuralRequirements
RegulatoryAcceptance
Criteria
QSAR LibrariesModeling Engine
Estimation of Missing Data
Analogue Identification
Prioritization/Ranking
Elucidate Toxicity Pathway(e.g., ER binding to repro effects)
Evaluate Regulated ChemicalsFor Ability to Initiate Pathway
(e.g., ER binding training set (TrSet))
Initial TrSet(MED)
OPP Inventory
Directed/designed Training Set

QSAR Principles for ER interactions • Chemical are “similar” if they produce the same
biological action from the same initiating event– Not all chemicals bind ER in same way, i.e., not all
“similar”– ER binders are “similar” if they have the same type of
interaction within the receptor
• QSARs require a well-defined/well understood biological system; assay strengths and limitations understood
• QSARs for large list of diverse chemicals– require iterative process – test, hypothesize,
evaluate, new hypothesis, test again, etc. – to gain mechanistic understanding to group similar
acting chemicals; build model within a group

R 394
E 353 H 524
BBAA
Estrogen binding pocket Estrogen binding pocket schematic representationschematic representation
CC
T 347
CC
J. Katzenellenbogen

R 394
E 353 H 524
CC
T 347
HOOH
CH3 H
H H
H
AA BB
A-B Mechanism A-B Mechanism
Distance = 10.8 for 17-Estradiol

R 394
E 353 H 524
CC
T 347
HOOH
CH3 H
H H
H
AA BB
A-B Mechanism A-B Mechanism
Distance .
Pro
babi
lity
dens
ity .
Based on 39 CERI Steroidal Structures
9.73<Distance<11.5Akahori; Nakai (CERI)

R 394
E 353 H 524
T 347
BB
A-C MechanismA-C Mechanism
Distance .
Pro
babi
lity
dens
ity .
Based on 21 RAL A-C Structures
9.1 < Distance < 9.6
OH
AA HO
CC
Katzenellenbogen

R 394
E 353
H 524
T 347
AA
CC
A-B-C MechanismA-B-C Mechanism
Distance .
Pro
babi
lity
dens
ity .
Based on 66 RAL A-B-C Structures
HO
OH
BBOH
NN
11.5 < Distance < 13.7
11.5 < Distance < 13.77.6 < D
istance <8
Katzenellenbogen

Hypothesis testing• Hypothesize structural
parameter(s) associated with toxicity
• Select chemicals that satisfy the hypothesis
Hypothesis: Chemicals with interatomic distance between O-atoms satisfying distance criteria for a binding type have the potential to bind ER based on electronic interactions.
• Test, and confirm or modify hypothesis

• Because acyclics are > 50% of inventories, what is the possibility that any acyclics satisfy criteria of high affinity binding types?
• Selected acyclics for testing that met A_B distance; no binders found (charged cmpds – apparent binding but no activation)
• As suspected, most OPP chemicals could not be evaluated with the A_B or A_C mechanism models;
• Need to refine ER binding hypotheses to investigate additional binding types– Chemicals interact with ER in more than one way, influencing
data interpretation and model development; – Need to group chemicals by like activity, then attempt to
model as a group that initiate action through same chemical-biological interaction mechanism, and should have common features
– Find common features and predict which other untested chemicals may have similar activity – prioritize for testing

High quality data is critical
• ER binding hypotheses refined– Chemicals interact with ER in more than
one way, influencing data interpretation and model development
HOW to interpret test results?

R 394
E 353 H 524
CC
T 347
HOOH
CH3 H
H H
H
AA BB
A-B Mechanism A-B Mechanism
Distance = 10.8 for 17-Estradiol

-0.365
-0.345
-0.325
-0.305
-0.285
-0.265
-0.245
-0.225
0 1 2 3 4 5 6 7 8 9
Log(Kow)
Loca
l O o
r N
cha
rge
Alkyl Phenols
Alkyl Anilines
RAL - AC
QOxygen=-0.318
QOxygen=-0.253HO
OHCH3
H H
H
AA BB

R 394
E 353 H 524
CC
T 347
HOAA BB
A Mechanism A Mechanism
CH3

R 394
E 353 H 524
CC
T 347
AA BB
B Mechanism B Mechanism
H3C
NH2

MED Trout Alkyl Phenols
0
0.1
0.2
0.3
0.4
0.5
0.6
0.7
0.8
0.9
1
0 1 2 3 4 5 6 7 8log(KOW)
Act
ive
AP p-n-chainAP p-(t or s)-branchedAP o-(t or s)-branchedAP m-t-branched
MED Trout Alkyl Phenols
0.00001
0.0001
0.001
0.01
0.1
1
0 1 2 3 4 5 6 7 8
log(KOW)
log(
RB
A)
AP p-n-chainAP p-(t or s)-branchedAP o-(t or s)-branchedAP m-t-branched

MED Trout A-type
0
0.1
0.2
0.3
0.4
0.5
0.6
0.7
0.8
0.9
1
0 1 2 3 4 5 6 7 8log(KOW)
Act
ive
alkyl phenols
hindered alkylphenols
Alkyl phenols not pure
MED Trout Alkylphenols
0.00001
0.0001
0.001
0.01
0.1
1
0 1 2 3 4 5 6 7 8
log(KOW)
log
(RB
A)
alkyl phenols
hindered alkylphenols
Alkyl phenols not pure

MED Trout
0
0.2
0.4
0.6
0.8
1
1.2
0 1 2 3 4 5 6 7 8log(KOW)
Act
ive
alkyl phenols
parabens
parabens salicylates
parabens - trihydroxy
MED Trout
0.00001
0.0001
0.001
0.01
0.1
1
0 1 2 3 4 5 6 7 8
log(KOW)
log(
RB
A)
alkyl phenols
parabens
parabens salicylates
parabens - trihydroxy

Anilines & Phthalates
0
0.1
0.2
0.3
0.4
0.5
0.6
0.7
0.8
0.9
1
0 1 2 3 4 5 6 7 8log(KOW)
Act
ive
alkyl anilines
phthalates
Anilines & Phthalates
0.00001
0.0001
0.001
0.01
0.1
1
0 1 2 3 4 5 6 7 8
log(KOW)
log(
RB
A)
alkyl anilines
phthalates
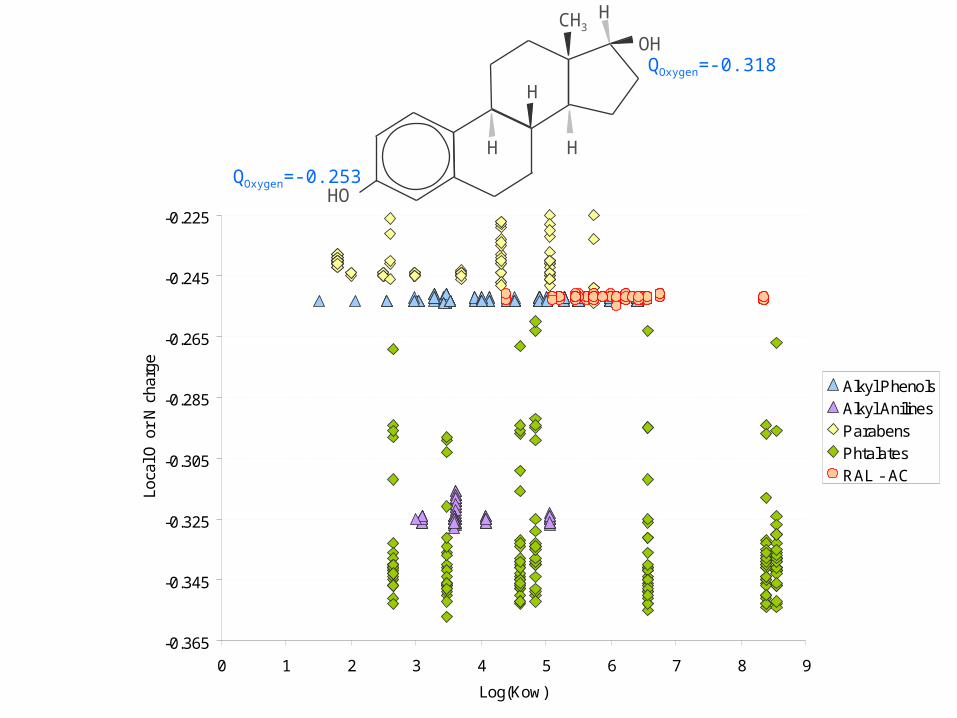
-0.365
-0.345
-0.325
-0.305
-0.285
-0.265
-0.245
-0.225
0 1 2 3 4 5 6 7 8 9
Log(Kow)
Loca
l O o
r N
cha
rge
Alkyl Phenols
Alkyl Anilines
Parabens
Phtalates
RAL - AC
H
QOxygen=-0.318
QOxygen=-0.253HO
OHCH3
H H
H

MED Trout
0
0.2
0.4
0.6
0.8
1
1.2
0 1 2 3 4 5 6 7 8log(KOW)
Act
ive
AB
AC
DDT
A-type
B-Type
MED Trout
0.00001
0.0001
0.001
0.01
0.1
1
10
100
1000
0 1 2 3 4 5 6 7 8
log(KOW)
log(
RB
A)
AB
AC
DDT
A-type
B-Type

ChemicalUniverse
Contains Cycle
Non binder(RBA<0.00001)
Yes Contains two or more nucleophilic
Sites (O or N)
Possible High Affinity,A-B; A-C; or
A-B-C type binder
Steric Exclusion Parameter
Attenuation?
Yes
Yes
No No
High Binding Affinity A-B; A-C; or A-B-C type
No
No
Non binder Ex: ProgesteroneCorticossterone(RBA<0.00001)
Other Mechanisms
A_Type BinderB_Type Binder
No
Non binder(RBA<0.00001)
Activity Rangelog KOW <1.4
Yes
No
Yes
A
B
Low Affinity BinderA-B; A-C; or A-B-C type
Undefined decisionparameter?
Yes
No
Classes with special structural rules
Undefined decisionparameter?
Yes
SignificantBinding Affinity
A or B type ?RBA=a*logP +b
Non binder(RBA<0.00001)
RBA=a*logP +b
•Alkyl Phenols•Benzoate•Parabens•Benzketones
•Anilines•Phthalates
No

Libraries of Toxicological Pathways
ER Binding
ER Transctivation
VTG mRNA
Vitellogenin Induction
Sex Steroids
Altered Reproduction/Development
Molecular Cellular Organ Individual
Chemical 3-DStructure/Properties
Chemical 2-D
Structure
Structure
Init
iati
ng
Eve
nts
Imp
aire
d R
epro
du
ctio
n/D
evel
op
men
t
Mapping Toxicity Pathways to Adverse Outcomes

Libraries of Toxicological Pathways
Init
iati
ng
Eve
nts
Ad
vers
e O
utc
om
es
Mapping Toxicity Pathways to Adverse Outcomes

Acknowledgements:
MED – J. Denny, R. Kolanczyk, B. Sheedy, M. Tapper; SSC – C. Peck; B. Nelson; T. Wehinger, B.
Johnson; L. Toonen; R. MaciewskiNRC Post-doc: H. AladjovBourgus University - LMC: O. Mekenyan, and many othersChemicals Evaluation Research Institute (CERI), Japan
- Y. Akahori, N. NakaiEPA/NERL-Athens: J. JonesEPA/OPP:
EFED - S. Bradbury, J. Holmes RD - B.Shackleford, P. Wagner AD - J. Housenger, D. Smegal HED – L. Scarano
Mentors: G. Veith, L. Weber, and J.M. McKim, III