Embed Size (px)
Citation preview

84
BULGARIAN ACADEMY OF SCIENCES CYBERNETICS AND INFORMATION TECHNOLOGIES • Volume 15, No 1 Sofia • 2015 Print ISSN: 1311-9702; Online ISSN: 1314-4081
DOI: 10.1515/cait-2015-0008
Designing an Efficient and Extensible Robustness Benchmark of a Real-Time Operating System
Zheng-Mao Zhou1, Zhou-Rong Zhu2, Ming Cai1 1School of Computer Science and Technology, Zhejiang University, Hangzhou 310027, China 2Shanghai Aerospace Electronics Technology Institute, Shanghai 201109, China Emails: [email protected] [email protected] [email protected]
Abstract: An important step in the development of a Real-Time Operating System (RTOS) is the validation of its tolerance properties. An abnormal input (fault injection) has become one of the most efficient ways to test the software robustness. In this paper we have designed a comprehensive robustness benchmark to evaluate the current popular RTOSs by faults injection. Firstly, we provide a set of uniform application program interfaces to ensure that the benchmark can be easily ported to a new RTOS. Then a package testing method has been used to improve the testing efficiency. Finally, a comprehensive robustness evaluation model is provided for the quantitative evaluation of RTOS robustness. Three popular RTOSs (Ucos2.62, Vxworks5.4 and Rtems4.10) have been evaluated with the help of our benchmark and we have found that Rtems performs best in robust evaluation, while Vxworks performs worst. Keywords: RTOS, robustness, fault injection, package testing.
1. Introduction
The software developers are generally more concerned with the problem whether or not the system can run properly in a normal environment, leading to the lack of consideration of the abnormal inputs [1]. The robustness of the software is the ability of the software to maintain normal operation under conditions of abnormal inputs or harsh operating environments. It not only includes the ability to shield the errors, but also includes the ability to recover from mistakes [2].
The Real-Time Operating System (RTOS) is now widely used in mission-critical systems, such as the spacecraft systems and the weapons systems [3]. Besides, the RTOS designers are being pressed to use Commercial Off-The-Shelf (COTS) and legacy software components in order to reduce the costs and shorten

85
the development time. However, the risk of the resultant systems may become large. For example, a root cause of the loss of Ariane 5 flight 501 was the reuse of Ariane 4 inertial navigation software, which was proved to have robustness problems when operating under different flight conditions encountered by Ariane 5 [4]. Statistics show that about 70% of the code used is for dealing with the exceptions in a robust system, such as abnormal inputs and abnormal status [5]. Therefore, abnormal inputs have become one of the most efficient ways to test the software robustness.
In this paper we have designed an efficient and extensible robustness benchmark for evaluating the robustness of RTOS in a quantitative manner. First the abnormal inputs are injected into the RTOS by the Application Program Interfaces (APIs) .Then the exceptions handling capabilities are evaluated by our observing system. Last, a quantitative assessment is used to calculate the system’s exceptions handling capabilities. Our robustness benchmark contains the following three characteristics which ensure that it is attractive enough compared to the current mainstream benchmarks, especially in the field of real-time operating systems.
1) Portability − Since many RTOSs (Vxworks5.4, Ucos2.62) usually do not contain a set of uniform APIs, such as POSIX APIs, we define a set of uniform APIs for all the RTOSs and all the faults (abnormal inputs) are injected from these uniform APIs. So mapping the uniform APIs into the original APIs of a new RTOS can ensure that the benchmark is able to evaluate a new RTOS almost without modifications.
2) Efficiency and high coverage − the traditional fault injection method is generally at the expense of efficiency in order to ensure sufficiently high test coverage, such as Ballista Project [11]. We have adopted a method, named package testing in the benchmark and this method can greatly reduce the scale of the cases without sacrificing the coverage.
3) Quantitative robustness evaluation model − a quantitative robustness evaluation model combined with workloads is proposed in our system. The test results are divided into multiple levels and each level is assigned a specific quantitative value. Then the robust value can be calculated with the help of our robustness calculation method.
The paper is organized as follows: Section 2 introduces the related work and Section 3 presents the design of the benchmark. Section 4 gives details about the implementation of our system, followed by experimental results and analysis in Section 5. Section 6 concludes the paper.
2. Related work
During the past thirty years, the researchers have made great efforts to evaluate the robustness of different OSs. Table 1 shows these typical benchmarks. Crashme [6] was the first benchmark to test the robustness of Unix-like OS. The test results of Crashme are divided into only two categories (“pass” or “crash”) and the test coverage is also indefinite. Due to these limitations, it is generally used for a
86
pressure test of OS now. The abnormal inputs of Fuzz [7] are generated with random values which obviously cannot guarantee sufficient coverage. R I D D L E [8] which is familiar to Fuzz is used in Windows NT for robustness evaluation. The abnormal inputs include random values, boundary values and malicious inputs. The test results are divided into finer granularity than the first two. The results consist of an “error code”, “unhandled exception”, “process hang” and “crash”.
F I A T [9] is designed for SunOS in exploring the behaviours of kernel fault propagation and the abnormal inputs consist of the following three categories: 1) zero-a-byte fault, set any eight consecutive bits in a 32-bits word as zeroes; 2) set-a-byte fault, set any eight consecutive bits in a 32-bits word as random values; 3) two-bits compensating fault, set any two bits in a 32-bits word as opposite values. The test results are classified in four categories (“crash”, “task hang”, “abnormal output” and “no error”). F I N E [10] is also used for exploring the fault propagation in the Unix-like OS. There is a special monitor used to observe the kernel error propagation and the test results are classified in seven categories with the finest granularity. Ballista Project [11] which is developed by John De at Carnegie Mellon University, is the most famous robust evaluation benchmark. Faults are injected from the POSIX interfaces and all abnormal combinations of all the parameters in one API can ensure that the test coverage is high enough. However, any combinations of all the parameters lead to significant growth in the scale of the test cases, and then the run time of the benchmark also increases greatly. The test results are classified into six categories (“pass”, “crash”, “hang”, “error code”, “silent error” and “incorrect error code”) to evaluate the robustness of the OS. Since the faults are injected through the POSIX APIs, it can be easily ported to evaluate the robustness of new OS which contain POSIX interfaces.
Table 1. Typical robustness benchmarks
Name OS Portability Coverage Efficient Quantitative Evaluation
Crashme Unix yes indefinite no no Fuzz Unix, Linux yes indefinite no no
RIDDLE Windows NT no high yes no FIAT SunOS no indefinite yes no FINE Unix yes high no no
Ballista Unix, Linux QNX, Lynx, etc. yes high no yes
3. Benchmark design
3.1. Uniform application program interfaces Faults are injected through the application program interfaces, but the set of uniform application program interfaces (such as POSIX interfaces) is not common in current popular RTOSs, especially in the early version of some RTOSs (Vxworks5.4, Ucos 2.62) which are still widely used in many devices. So designing a set of uniform APIs is very useful for porting the benchmark to evaluate a new RTOS [13, 14]. Then the only thing we need to do is just to map the original APIs

87
of the RTOS into the uniform APIs. Table 2 shows the uniform application program interfaces and these interfaces are designed according to the following two rules:
1. All the uniform APIs belong to RTOS’s most basic modules (Task manager, Task Synchronization, Memory Manager and Timer). This ensures that the uniform APIs are generic enough and each uniform API can be mapped into a corresponding original API of each RTOS.
2. The parameters of each uniform API are generic, which means that these parameters are necessary for the API to accomplish their functions.
Table 2. Uniform application program interfaces Module Uniform API Parameters Basic API
Task Manager
(40%)
TaskCreate stack size, task entry, task priority yes TaskSetPriority task id, original priority, new priority no
TaskResume task id no TaskDelay task id, ticks no
TaskUndelay task id no TaskRestart task id no
TaskSuspend task id no TaskDelete task id no
Task Synchronization
(30%)
SemBCreate initial value, options yes SemBPend sem id, ticks of time out no
SemBRelease sem id no SemBDelete sem id no SemCCreate initial value, options yes SemCPend sem id, ticks of time out no
SemCRelease sem id no SemCDelete sem id no SemMCreate options yes SemMPend sem id, ticks of time out no
SemMRelease sem id no SemMDelete sem id no MsgQCreate msg length, msg num, options yes
MsgQTake msg id, ticks of time out, receive point, msg length no
MsgQGive msg id, msg length, send point, ticks of time out, options no
MsgQDelete msg id no
Memory Manager
(20%)
Malloc mem size no Realloc primary point, new size no Calloc number of blocks, size per block no
Memalignalloc mem size no Free memory point no
Timer (10%)
TimerCreate ticks, timer entry yes TimerCancel timer id no TimerDelete timer id no
The first column of Table 2 shows that all the public APIs are based on four
basic modules (Task Manger, Task Synchronization, Memory Manager and Timer) of RTOS. The weight values are used to calculate the robust value of RTOS in Section 3.3 and the bigger value indicates that this module is more important in the RTOS. As the Task Manager module is the basis of all the other modules, its weight

88
is the biggest one with a value of 40%. The weight values of the other modules are also defined according to their importance in the whole RTOS.
The last column indicates whether the corresponding API is a basic API or not. The basic APIs which create basic function structures in the corresponding modules are the foundations of other APIs. The attribute of “basic” is also used for quantitative robustness evaluation.
3.2. Efficient fault injection
Faults are injected by the uniform application program interfaces and the number of parameters of the uniform APIs varies from one up to five. Multiple parameters fault injection is based on a single parameter fault injection. The following will describe these two types of fault injection.
3.2.1. Single parameter fault injection Two faults injection methods (bit-flips and data type-based corruption) are
implemented in the single parameter fault injection. 1. Bit-flips In it a bit in a data word is flipped, from 0 up to 1, or vice versa while the other
bits in the data are not flipped. It is well suited to simulate errors induced by space rations. The number of the test cases depends on the length of the parameter. For example, the parameter “task id” is an integer (32 bits) type, so that the parameter has 32 test cases in the Bit-flips method.
2. Data type-based corruption Data type-based corruption is used, when the value of a parameter is corrupted
according to its data type. The injected values mainly contain boundary values, original value +1, original value −1, 1, −1 and 0. Table 3 shows the test cases for type “int”.
Table 3. Test cases for type “int” Case No Injected value
1 (Previous value) –1 2 (Previous value) +1 3 1 4 0 5 –1 6 INT_MIN 7 INT_MAX
3.2.2. Multiple parameters fault injection Traditional multiple parameters fault injection method is any combinations of all the parameters’ test cases, such as the Ballista project [11], which can guarantee sufficient test coverage. However, the number of the test cases of one API will grow exponentially with the increase of the number of parameters. For example, the uniform API “TaskCreate” contains three parameters and each parameter has 39 test cases. Thus the total number of the test cases of this API reaches 59 319 (393=59319). Obviously, such a large scale of the test cases will lead to inefficiency of the benchmark.
We propose a package testing for RTOS robustness evaluation in our benchmark. The Dimensionality Model [11] is used for generating the test cases.

89
Two dimensions (parameter dimension and actual dimension) are used to distinguish between traditional testing and package testing. Parameter dimension, which is the number of API’s parameters indicates the scale of the test cases of the traditional multiple parameters fault injection method. The actual dimension is obtained by analyzing the relationship of the parameters in one API. For example, the API “TaskSetPriority” has three parameters (“task id”, “original priority”, “new priority”) and the three parameters indicate the task’s ID, the task’s original priority and the task’s new priority to which the task will be adjusted respectively. As only two parameters “original priority” and “new priority” are related, the actual dimension of this API is two. The final total number of the test cases of this API is 1560 ( 239 +39=1560 ). Therefore, the actual dimension indicates the number of related parameters in one API and any combination of no related test cases is not meaningful. So the test cases generated according to the actual dimension can guarantee high test coverage.
3.3. Evaluation model
3.3.1. Error model Since errors are injected through the uniform APIs, we use failure mode
analysis to determine and distinguish the impact of a propagated error. A set of seven models which are more serious is defined as follows:
Level 0. The return value of the API is correct and the system works as usual. Level 1. The injected fault is activated and the error propagates to the test
applications and the return value of the injected API is an error, but the system can still work as usual.
Level 2. The test application terminates abnormally and the error code is correct.
Level 3. No discernible violation is observed and the injected API return value is a success. That is to say, the system cannot detect the violation when the errors have occurred.
Level 4. The test application terminates abnormally and the error code is not correct.
Level 5. The return value of the injected API is not available and the injected API hangs and needs to be restarted.
Level 6. The return value of the injected API is not available and the whole system needs to be rebooted in order to recover from this kind of a failure.
3.3.2. Quantitative evaluation 1. Failure rate of API The failure rate of a special API at Level k, k= 0, 1, 2, 3, 4, 5, 6, is defined as
api ,k
f then apikf is calculated by (1); apik
t is the number of the test cases whose test
results are at Level k of the API and apikn is the total number of the test cases of the
API,
(1) apiapi
api
.k
k
k
tf
n=

90
2. Robust value of API We define the robust value of a specific API as apir ; kw is the weight of Level k
and the value of kw is shown in Table 4; apir is calculated as given in
(2) 6
api api0( . ).
k kk
r f w=
=∑
Table 4. The value of kw with different level results
Level kwLevel 0 100 Level 1 100 Level 2 80 Level 3 60 Level 4 40 Level 5 20 Level 6 0
3. Usage of API
apiw is defined as the usage of API; apif denotes the called times of this API
and if there are m APIs in the module, the value of apiw is calculated by the
expression given below. The value of apif is calculated by (4) if apik is a basic API (all the basic APIs are shown in Table 2).
(3) apiapi
api1
,
j
m
j
fw
f=
=
∑
(4) 1 2api api api apimax( , ,..., ).
k mf f f f=
4. Robust value of one module mod uleR is defined as the robust value of one module and there are n APIs in
this module. Then mod uleR is calculated by expression (5).
(5) mod ule api api1
( . ).i i
n
iR r w
=
=∑
5. Robust value of RTOS rtosR is defined as the robust value of RTOS and mod ulei
w is the weight of the
module which is shown in the first column of Table 2. Then rtosR is calculated as given in
(6)
4
mod ule module1
rtos
( . ).
4
i ii
R wR ==
∑
91
4. System implementation
4.1. System framework
Fig. 1. System framework
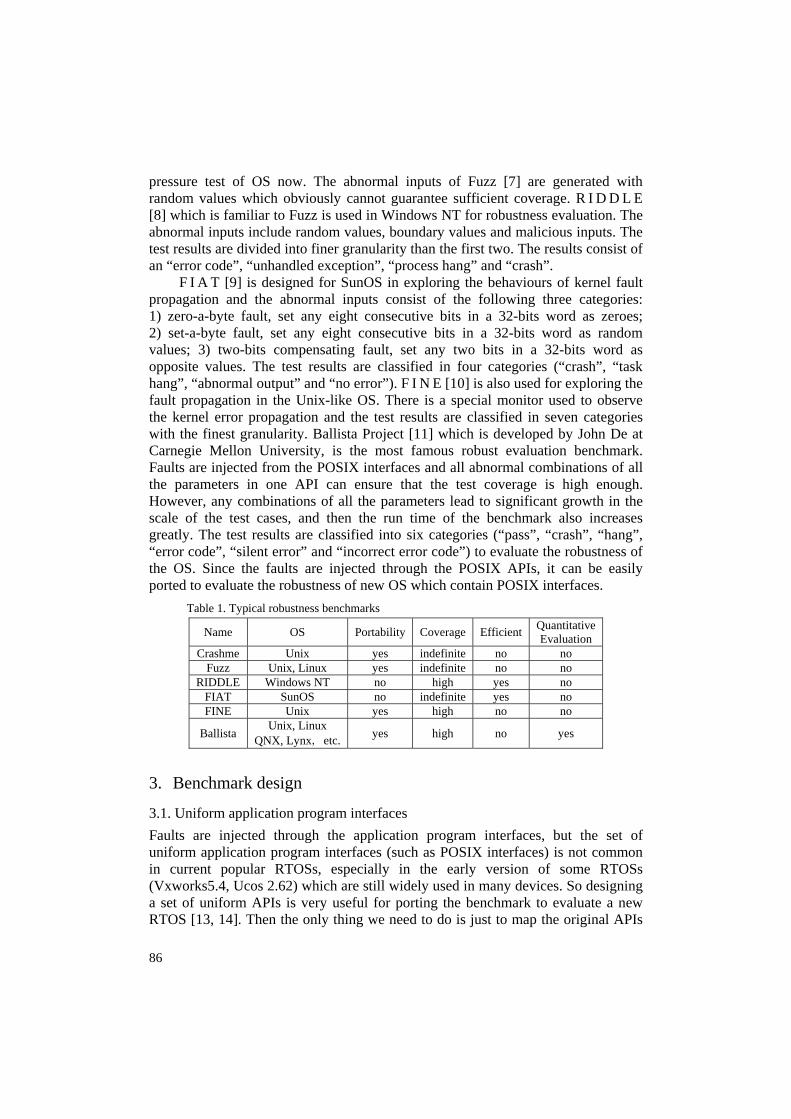
4.1.1. Overview As shown in Fig. 1, our system is composed of a Host Machine and a Target
Machine. The Host Machine controls the operation of the Target Machine through the Manager component which is responsible for data communication and control of the system. Workload Manager is used to manage the workload through three steps: 1) establish the external operating environment according to the current workload; 2) compile the workload; 3) download the executable image to the board. The faults are injected through an Injection Controller component which corrupts the API parameters according to the injecting rules, and then the test results are logged by a Logs component. Finally, the Result Analysis component deals with the result logs automatically with the robust values of all APIs and total RTOS. A Reboot Control component is used to reboot the Target Machine when the Target Machine cannot reboot itself with the internal reboot mechanism.
The Test Manager is the management component of the Target Machine. It receives control commands from the Manager component to control the operation of the Target Machine and sends test results to the Manager component. There are five small function components in the Target Machine: Test Setup is used to initialize the workload and API Call Counter is responsible for the statistics of the number of times each API calls. Faults are injected through the Interception and some of the test results are detected by a Failure Detector. The Self Reboot reboots the Target Machine if the system does not hang up or crashes.
4.1.2. System initialization As the faults are injected into the system, the system needs to reboot after the
fault injection in order to ensure that the system is clean before the start of the next test. There are two mechanisms to ensure that the system restarts automatically. The first one is the Self Reboot component which uses a software method to reboot the system inside the Target Machine. The other one is a Reboot Controller. When the
92
system has crashed and the Self Reboot component cannot work, an external hardware method is conducted by the Reboot Controller to reboot the system.
After the system reboot from the last test, the Manager component initializes all the components of the Host Machine and then starts to run. The main initialization steps are as follows:
• The Injection Controller determines the current API to be tested; • The Injection Controller determines the fault injection method of the
current API; • The Reboot Controller starts to run and waits for information from the
Target Machine ; • The Workload Manager loads the benchmark programs to the Target
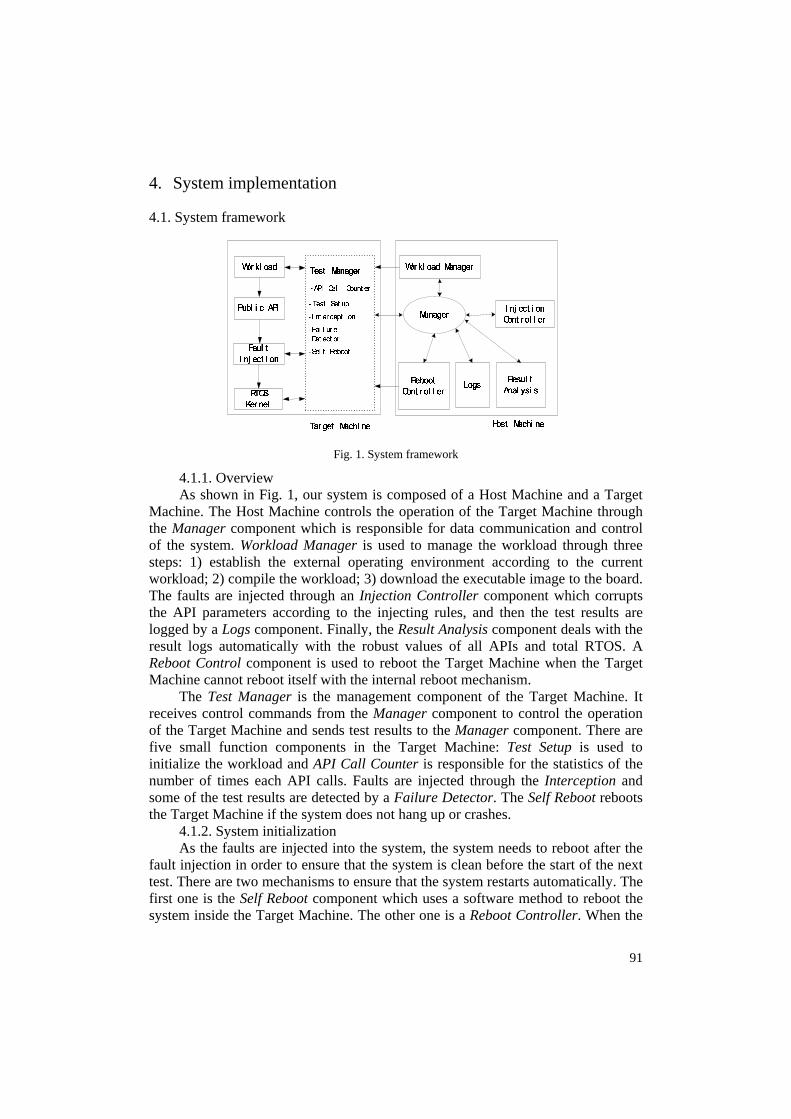
Machine; 4.1.3. Fault injection The fault injection process is shown in Fig. 2 and it is mainly composed of an
Interception component and Injection Controller to function cooperatively. The detailed process is in five steps.
Fig. 2. Fault injection protocol
Step 1. The workload begins to run and then the Interception sends a message “injection start” to the Injection Controller and waits for a response.
Step 2. The Injection Controller receives the message “injection start” and then the current injection information which consists of the API’s name and API’s parameters is responded to the Injection Controller. The current injection information is chosen according to the fault injection rules which are defined in the fault injection profile.
Step 3. The Interception receives the injection information (API’s name and API’s parameters) and a specific API testing scene is constructed according to the received injection information. The original values of the injected API’s parameters
93
are sent to the Injection Controller and the Interception waits for a response from the Injection Controller.
Step 4. The Injection Controller receives the original values of the injected parameters and then these values are corrupted according to the fault injection rules. Finally, these corrupted values are sent back to the Interception.
Step 5. The Interception receives the corrupted values and the injected APIs are called with these corrupted values. Finally, the Interception sends “injection finish” to the Injection Controller in order to finish this fault injection.
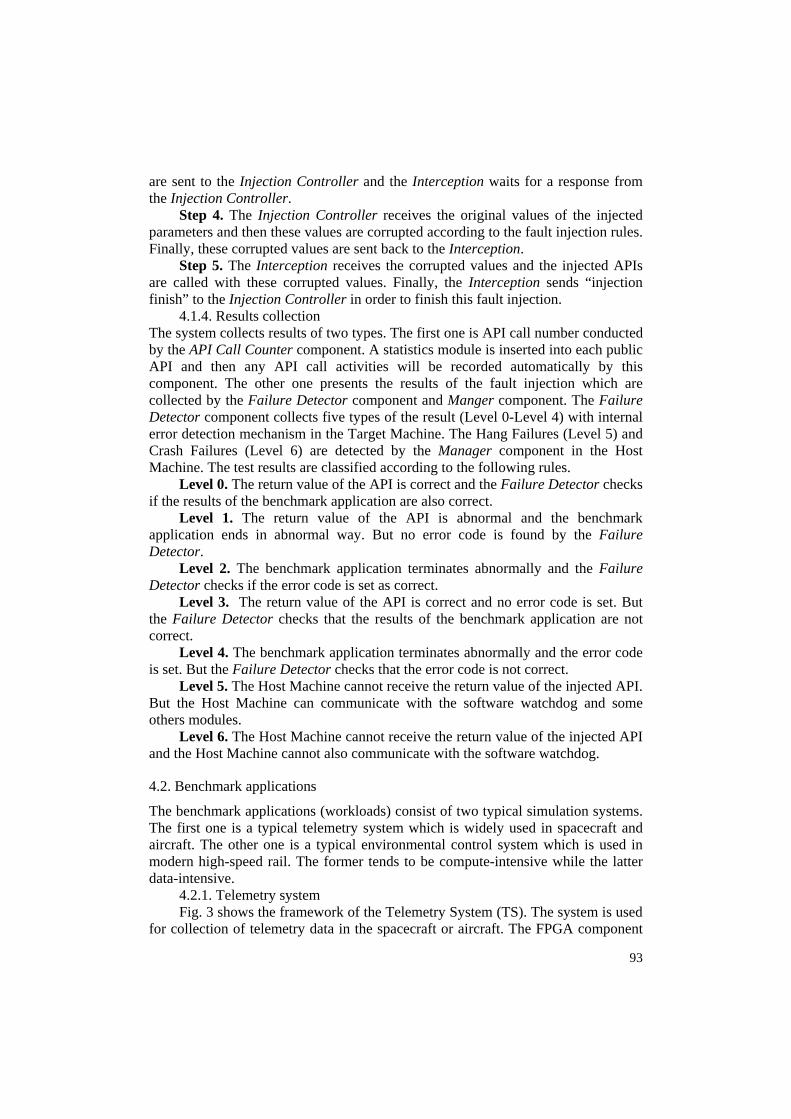
4.1.4. Results collection The system collects results of two types. The first one is API call number conducted by the API Call Counter component. A statistics module is inserted into each public API and then any API call activities will be recorded automatically by this component. The other one presents the results of the fault injection which are collected by the Failure Detector component and Manger component. The Failure Detector component collects five types of the result (Level 0-Level 4) with internal error detection mechanism in the Target Machine. The Hang Failures (Level 5) and Crash Failures (Level 6) are detected by the Manager component in the Host Machine. The test results are classified according to the following rules.
Level 0. The return value of the API is correct and the Failure Detector checks if the results of the benchmark application are also correct.
Level 1. The return value of the API is abnormal and the benchmark application ends in abnormal way. But no error code is found by the Failure Detector.
Level 2. The benchmark application terminates abnormally and the Failure Detector checks if the error code is set as correct.
Level 3. The return value of the API is correct and no error code is set. But the Failure Detector checks that the results of the benchmark application are not correct.
Level 4. The benchmark application terminates abnormally and the error code is set. But the Failure Detector checks that the error code is not correct.
Level 5. The Host Machine cannot receive the return value of the injected API. But the Host Machine can communicate with the software watchdog and some others modules.
Level 6. The Host Machine cannot receive the return value of the injected API and the Host Machine cannot also communicate with the software watchdog.
4.2. Benchmark applications
The benchmark applications (workloads) consist of two typical simulation systems. The first one is a typical telemetry system which is widely used in spacecraft and aircraft. The other one is a typical environmental control system which is used in modern high-speed rail. The former tends to be compute-intensive while the latter data-intensive.
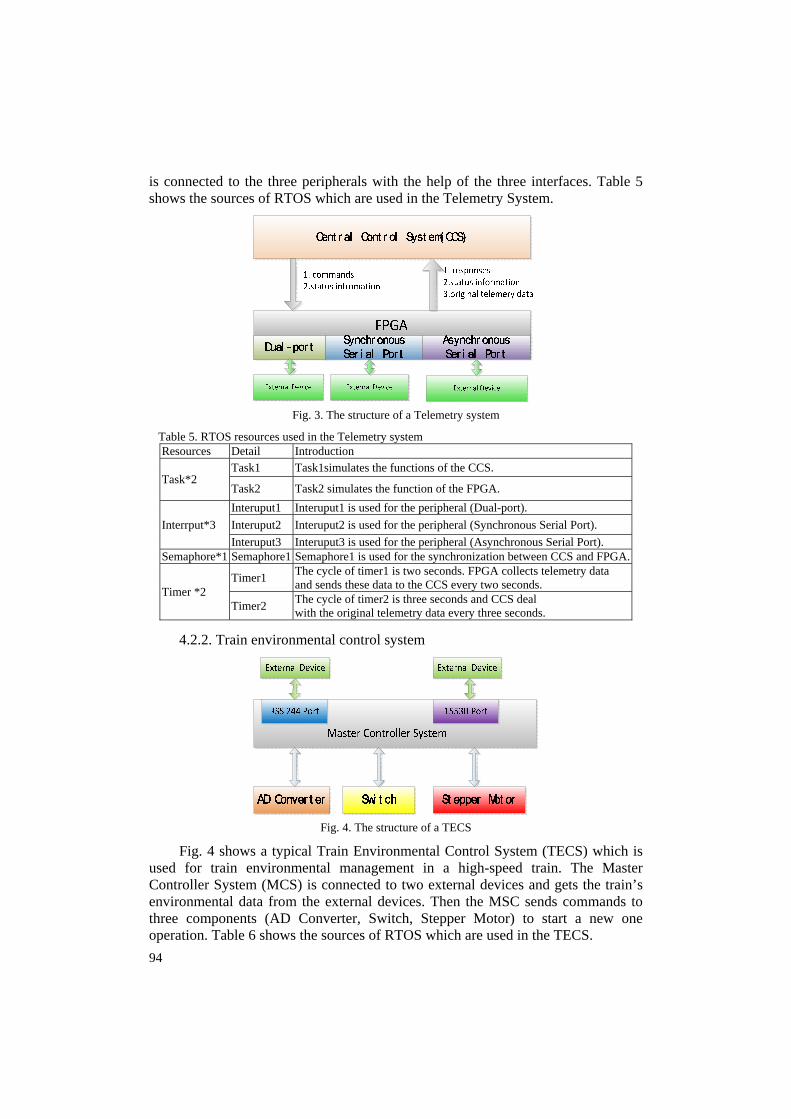
4.2.1. Telemetry system Fig. 3 shows the framework of the Telemetry System (TS). The system is used
for collection of telemetry data in the spacecraft or aircraft. The FPGA component
94
is connected to the three peripherals with the help of the three interfaces. Table 5 shows the sources of RTOS which are used in the Telemetry System.
Fig. 3. The structure of a Telemetry system
Table 5. RTOS resources used in the Telemetry system Resources Detail Introduction
Task*2 Task1 Task1simulates the functions of the CCS.
Task2 Task2 simulates the function of the FPGA.
Interrput*3 Interuput1 Interuput1 is used for the peripheral (Dual-port). Interuput2 Interuput2 is used for the peripheral (Synchronous Serial Port). Interuput3 Interuput3 is used for the peripheral (Asynchronous Serial Port).
Semaphore*1 Semaphore1 Semaphore1 is used for the synchronization between CCS and FPGA.
Timer *2 Timer1 The cycle of timer1 is two seconds. FPGA collects telemetry data
and sends these data to the CCS every two seconds.
Timer2 The cycle of timer2 is three seconds and CCS deal with the original telemetry data every three seconds.
4.2.2. Train environmental control system
Fig. 4. The structure of a TECS
Fig. 4 shows a typical Train Environmental Control System (TECS) which is used for train environmental management in a high-speed train. The Master Controller System (MCS) is connected to two external devices and gets the train’s environmental data from the external devices. Then the MSC sends commands to three components (AD Converter, Switch, Stepper Motor) to start a new one operation. Table 6 shows the sources of RTOS which are used in the TECS.
95
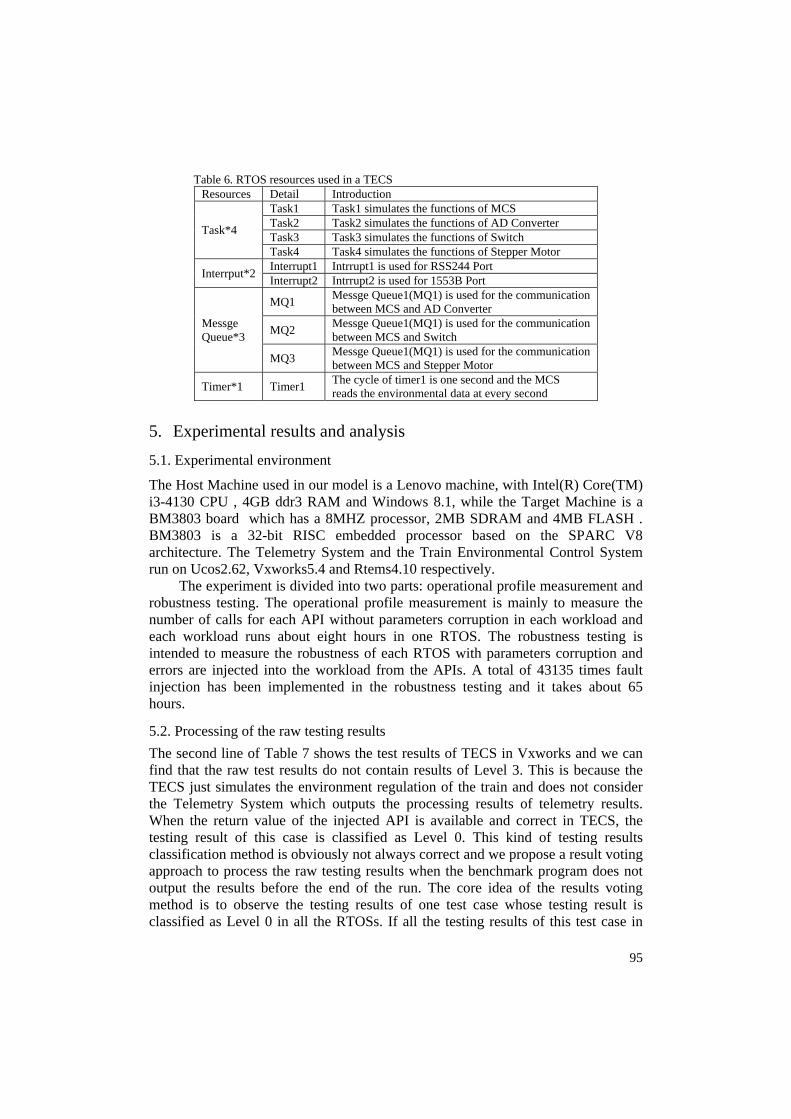
Table 6. RTOS resources used in a TECS Resources Detail Introduction
Task*4
Task1 Task1 simulates the functions of MCS Task2 Task2 simulates the functions of AD Converter Task3 Task3 simulates the functions of Switch Task4 Task4 simulates the functions of Stepper Motor
Interrput*2 Interrupt1 Intrrupt1 is used for RSS244 Port Interrupt2 Intrrupt2 is used for 1553B Port
Messge Queue*3
MQ1 Messge Queue1(MQ1) is used for the communication between MCS and AD Converter
MQ2 Messge Queue1(MQ1) is used for the communication between MCS and Switch
MQ3 Messge Queue1(MQ1) is used for the communication between MCS and Stepper Motor
Timer*1 Timer1 The cycle of timer1 is one second and the MCS reads the environmental data at every second
5. Experimental results and analysis 5.1. Experimental environment
The Host Machine used in our model is a Lenovo machine, with Intel(R) Core(TM) i3-4130 CPU , 4GB ddr3 RAM and Windows 8.1, while the Target Machine is a BM3803 board which has a 8MHZ processor, 2MB SDRAM and 4MB FLASH . BM3803 is a 32-bit RISC embedded processor based on the SPARC V8 architecture. The Telemetry System and the Train Environmental Control System run on Ucos2.62, Vxworks5.4 and Rtems4.10 respectively.
The experiment is divided into two parts: operational profile measurement and robustness testing. The operational profile measurement is mainly to measure the number of calls for each API without parameters corruption in each workload and each workload runs about eight hours in one RTOS. The robustness testing is intended to measure the robustness of each RTOS with parameters corruption and errors are injected into the workload from the APIs. A total of 43135 times fault injection has been implemented in the robustness testing and it takes about 65 hours.
5.2. Processing of the raw testing results The second line of Table 7 shows the test results of TECS in Vxworks and we can find that the raw test results do not contain results of Level 3. This is because the TECS just simulates the environment regulation of the train and does not consider the Telemetry System which outputs the processing results of telemetry results. When the return value of the injected API is available and correct in TECS, the testing result of this case is classified as Level 0. This kind of testing results classification method is obviously not always correct and we propose a result voting approach to process the raw testing results when the benchmark program does not output the results before the end of the run. The core idea of the results voting method is to observe the testing results of one test case whose testing result is classified as Level 0 in all the RTOSs. If all the testing results of this test case in

96
three RTOSs are Level 0, then we determine the testing result of this test case as Level 0. Otherwise, the testing result of this test case is classified as Level 3. The third row of Table 7 shows the testing results which are processed by the result voting method in TECS in Vxworks.
Table 7. Testing results of TECS in Vxworks before and after result voting TECS Level 0 Level 1 Level 2 Level 3 Level 4 Level 5 Level 6 Raw 15493 7705 1098 0 1104 1699 3588 Correction 10778 7705 1098 4715 1104 1699 3588
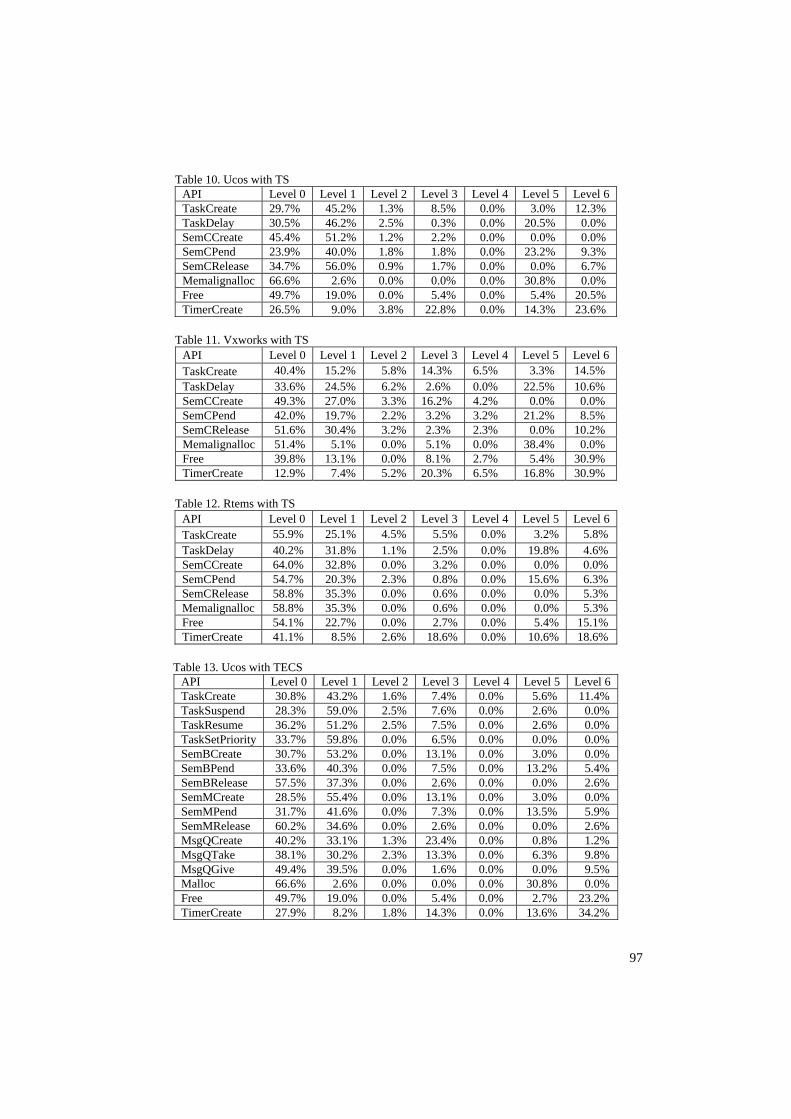
5.3. Experimental results Tables 8 and 9 show the number of test cases and usage of different APIs in TS and TECS respectively. The value in “Usage” column is the percentage of the API called frequency in the corresponding module and the “test Cases” column presents the number of test cases with each API. Tables 10-15 present the test results of three RTOSs in two typical benchmark programs (TS and TECS). The values in “Level 0”, … ,“Level 6” columns are the percentages of seven types of the test results in our experiment.
Figs 5 and 6 present the failure rates of different Level-results in TS and TECS respectively. The robust values of each module and the whole RTOS in two benchmark programs are presented in Figs 7 and 8.
Table 8. The number of test cases and usage of different APIs in TS Module API Usage Test Cases
Task Manager TaskCreate 50.0% 4563 TaskDelay 50.0% 1521
Task Synchronization SemCCreate 33.4% 1521 SemCPend 33.3% 1521
SemCRelease 33.3% 1521
Memory Manger Memalignalloc 50.6% 39 Free 49.4% 37
Timer TimerCreate 100.0% 1521
Table 9. The number of test cases and usage of different APIs in TECS Module API Usage Test Cases
Task Manager
TaskCreate 33.3% 4563 TaskSuspend 16.7% 39 TaskResume 16.7% 39
TaskSetPriority 33.3% 1560
Task Synchronization
SemBCreate 4.8% 1521 SemBPend 4.7% 1521
SemBRelease 4.7% 39 SemMCreate 9.6% 1521 SemMPend 9.6% 1521
SemMRelease 9.5% 39 MsgQCreate 19.1% 3042 MsgQTake 19.0% 6084 MsgQGive 19.0% 7605
Memory Manger Malloc 50.4% 39 Free 49.6% 37
Timer TimerCreate 100.0% 1521
97
Table 10. Ucos with TS API Level 0 Level 1 Level 2 Level 3 Level 4 Level 5 Level 6 TaskCreate 29.7% 45.2% 1.3% 8.5% 0.0% 3.0% 12.3% TaskDelay 30.5% 46.2% 2.5% 0.3% 0.0% 20.5% 0.0% SemCCreate 45.4% 51.2% 1.2% 2.2% 0.0% 0.0% 0.0% SemCPend 23.9% 40.0% 1.8% 1.8% 0.0% 23.2% 9.3% SemCRelease 34.7% 56.0% 0.9% 1.7% 0.0% 0.0% 6.7% Memalignalloc 66.6% 2.6% 0.0% 0.0% 0.0% 30.8% 0.0% Free 49.7% 19.0% 0.0% 5.4% 0.0% 5.4% 20.5% TimerCreate 26.5% 9.0% 3.8% 22.8% 0.0% 14.3% 23.6%
Table 11. Vxworks with TS API Level 0 Level 1 Level 2 Level 3 Level 4 Level 5 Level 6 TaskCreate 40.4% 15.2% 5.8% 14.3% 6.5% 3.3% 14.5% TaskDelay 33.6% 24.5% 6.2% 2.6% 0.0% 22.5% 10.6% SemCCreate 49.3% 27.0% 3.3% 16.2% 4.2% 0.0% 0.0% SemCPend 42.0% 19.7% 2.2% 3.2% 3.2% 21.2% 8.5% SemCRelease 51.6% 30.4% 3.2% 2.3% 2.3% 0.0% 10.2% Memalignalloc 51.4% 5.1% 0.0% 5.1% 0.0% 38.4% 0.0% Free 39.8% 13.1% 0.0% 8.1% 2.7% 5.4% 30.9% TimerCreate 12.9% 7.4% 5.2% 20.3% 6.5% 16.8% 30.9%
Table 12. Rtems with TS API Level 0 Level 1 Level 2 Level 3 Level 4 Level 5 Level 6 TaskCreate 55.9% 25.1% 4.5% 5.5% 0.0% 3.2% 5.8% TaskDelay 40.2% 31.8% 1.1% 2.5% 0.0% 19.8% 4.6% SemCCreate 64.0% 32.8% 0.0% 3.2% 0.0% 0.0% 0.0% SemCPend 54.7% 20.3% 2.3% 0.8% 0.0% 15.6% 6.3% SemCRelease 58.8% 35.3% 0.0% 0.6% 0.0% 0.0% 5.3% Memalignalloc 58.8% 35.3% 0.0% 0.6% 0.0% 0.0% 5.3% Free 54.1% 22.7% 0.0% 2.7% 0.0% 5.4% 15.1% TimerCreate 41.1% 8.5% 2.6% 18.6% 0.0% 10.6% 18.6%
Table 13. Ucos with TECS API Level 0 Level 1 Level 2 Level 3 Level 4 Level 5 Level 6 TaskCreate 30.8% 43.2% 1.6% 7.4% 0.0% 5.6% 11.4% TaskSuspend 28.3% 59.0% 2.5% 7.6% 0.0% 2.6% 0.0% TaskResume 36.2% 51.2% 2.5% 7.5% 0.0% 2.6% 0.0% TaskSetPriority 33.7% 59.8% 0.0% 6.5% 0.0% 0.0% 0.0% SemBCreate 30.7% 53.2% 0.0% 13.1% 0.0% 3.0% 0.0% SemBPend 33.6% 40.3% 0.0% 7.5% 0.0% 13.2% 5.4% SemBRelease 57.5% 37.3% 0.0% 2.6% 0.0% 0.0% 2.6% SemMCreate 28.5% 55.4% 0.0% 13.1% 0.0% 3.0% 0.0% SemMPend 31.7% 41.6% 0.0% 7.3% 0.0% 13.5% 5.9% SemMRelease 60.2% 34.6% 0.0% 2.6% 0.0% 0.0% 2.6% MsgQCreate 40.2% 33.1% 1.3% 23.4% 0.0% 0.8% 1.2% MsgQTake 38.1% 30.2% 2.3% 13.3% 0.0% 6.3% 9.8% MsgQGive 49.4% 39.5% 0.0% 1.6% 0.0% 0.0% 9.5% Malloc 66.6% 2.6% 0.0% 0.0% 0.0% 30.8% 0.0% Free 49.7% 19.0% 0.0% 5.4% 0.0% 2.7% 23.2% TimerCreate 27.9% 8.2% 1.8% 14.3% 0.0% 13.6% 34.2%

98
Table 14. Vxworks with TECS API Level 0 Level 1 Level 2 Level 3 Level 4 Level 5 Level 6 TaskCreate 37.1% 13.1% 5.5% 14.2% 5.9% 8.3% 15.9% TaskSuspend 46.1% 17.2% 5.1% 17.9% 3.5% 0.0% 10.2% TaskResume 48.7% 23.3% 5.1% 12.8% 2.6% 0.0% 7.5% TaskSetPriority 43.1% 26.3% 4.1% 9.6% 4.2% 5.5% 7.2% SemBCreate 34.5% 20.6% 3.2% 35.2% 3.6% 2.9% 0.0% SemBPend 41.0% 31.6% 2.9% 4.2% 3.3% 7.6% 9.4% SemBRelease 46.4% 30.5% 2.6% 5.1% 2.6% 0.0% 12.8% SemMCreate 32.6% 21.8% 3.9% 35.2% 3.6% 2.9% 0.0% SemMPend 42.0% 30.5% 2.8% 3.8% 3.5% 7.9% 9.5% SemMRelease 49.1% 31.2% 2.6% 2.6% 5.1% 0.0% 9.4% MsgQCreate 28.1% 20.6% 6.8% 34.3% 2.3% 6.5% 1.4% MsgQTake 29.2% 23.6% 4.2% 21.3% 3.1% 5.4% 13.2% MsgQGive 42.2% 38.3% 0.9% 2.3% 3.1% 0.9% 12.3% Malloc 51.4% 5.1% 0.0% 2.5% 0.0% 41.0% 0.0% Free 37.1% 13.1% 0.0% 8.1% 5.4% 5.4% 30.9% TimerCreate 11.9% 5.6% 3.4% 12.6% 3.6% 19.6% 43.3%
Table 15. Rtems with TECS API Level 0 Level 1 Level 2 Level 3 Level 4 Level 5 Level 6 TaskCreate 55.3% 25.6% 4.0% 4.6% 0.0% 5.2% 5.3% TaskSuspend 58.9% 31.1% 0.0% 2.5% 0.0% 0.0% 7.5% TaskResume 56.4% 36.0% 0.0% 2.5% 0.0% 0.0% 5.1% TaskSetPriority 57.2% 33.1% 0.0% 2.3% 0.0% 2.8% 4.6% SemBCreate 48.7% 35.3% 0.0% 6.8% 0.0% 9.2% 0.0% SemBPend 53.2% 35.3% 0.0% 5.4% 0.0% 1.8% 4.3% SemBRelease 56.2% 33.6% 0.0% 5.1% 0.0% 0.0% 5.1% SemMCreate 49.5% 34.5% 0.0% 6.8% 0.0% 9.2% 0.0% SemMPend 56.3% 33.2% 0.0% 5.5% 0.0% 1.7% 3.3% SemMRelease 58.7% 33.6% 0.0% 2.6% 0.0% 0.0% 5.1% MsgQCreate 39.3% 37.4% 0.9% 16.8% 0.0% 4.9% 0.7% MsgQTake 36.4% 34.3% 1.5% 15.2% 0.0% 4.3% 8.3% MsgQGive 53.2% 35.3% 0.0% 3.2% 0.0% 1.2% 7.1% Malloc 64.1% 2.6% 0.0% 0.0% 0.0% 33.3% 0.0% Free 54.1% 22.7% 0.0% 2.7% 0.0% 2.7% 17.8% TimerCreate 33.4% 3.6% 2.3% 15.3% 0.0% 14.2% 31.2%
Fig. 5. Failure rate of different Level-results in TS

99
Fig. 6. Failure rate of different Level-results in TECS
Fig. 7. Robust values with TS
Fig. 8. Robust values with TECS
5.4. Experimental analysis
Tables 8 and 9 show the number of test cases and usage of different APIs in TS and TECS respectively. The value in “Usage” column is the percentage of the API called frequency in the corresponding module and the “test Cases” column presents the number of test cases with each API. Tables 10-15 present the test results of three RTOSs in two typical benchmark programs (TS and TECS). The values in “Level 0”, … ,“Level 6” columns are the percentages of seven types of the test results in our experiment. Figs 5 and 6 present the failure rates of different Level-results in TS and TECS respectively. The robust values of each module and the whole RTOS in two benchmark programs are presented in Figs 7 and 8.

100
Table 8 and 9 show that the total number of test cases is 12444 and 30691 in two workloads respectively and this test scale is enough to ensure test coverage. As we can see from Fig. 7 and 8, Rtems achieves the best robustness performance in two benchmark programs, while Vxworks performs worst. The robust values of each RTOS in two benchmark programs are not the same, but they are consistent in the order. Next, a detailed analysis of the test results is presented in the following four parts.
5.4.1. Test coverage and test scale analysis
The traditional single parameter fault injection method usually just contains “data type-based corruption”, such as RIDDLE [8] and Ballista Project [11]. Our single parameter fault injection also contains the “Bit-flips” which can simulate errors induced by space rations. Thus our method can also improve the test coverage compared to the traditional approaches. However, the cost of our approach is to increase the number of test cases in the single parameter fault injection.
From the previous description we know that the package testing is used in our fault injection. The number of the parameters of API exceeds two and there is no correlation between the two parameters. The number of the test cases of this API will greatly reduce with package testing. For example, the number of the test cases of “TaskSetPriority” reduces from 59319 up to 1560. Besides, there is almost no reduction of the test coverage in package testing.
Although the number of the test cases increases from 10 up to 39 in a single parameter fault injection, the total number of the test cases is still less than the traditional methods. The total number of the test cases of TS in traditional methods can reach more than 20 thousands while in our method it is only 12 444. The total number in TECS can also reach more than 100 thousands in traditional methods. So we can make the conclusion that our method not only improves the test coverage but also reduces the scale of the test cases.
5.4.2. Robustness analysis of three RTOS As we can see from Fig. 5 and 6, the ratio of “Level 4” in Vxworks is the
highest in the three RTOSs and the other two RTOSs are nearly zero. This is because only Vxworks has the global error code setting mechanism .Once the error propagates to the other modules; the error code is probably set as not right. The other two RTOSs (Ucos and Rtems) usually set the error code inside the API and the error code is almost impossible to be set as false inside the API.
The “Level 3” ratio of Vxworks is also the highest in the three RTOSs. This is because the parameter type detection mechanism is not perfect. For example, the API “SemBCreate (int options, int initialState)” in Vxworks ignores the detection of the parameter (“initialState”) and only the last bit of the parameter is used in this API. However, the other two RTOSs may check the other bits of the parameter and find that the parameter is invalid. So this situation will lead to producing many “Level 3”-results according to the voting approach.
The “Level 1” ratio of Ucos is higher than the two other RTOSs. This is because there are at most 64 tasks in Ucos and the priority of the Ucos is also from 0 up to 63. The other two RTOSs do not have these limitations. For example, once

101
the parameter of “task priority” is used for a fault injection in Ucos, then the injected value is easier to exceed the reasonable range ([0, 63]). Finally, the “Level 1” results will be more than the other two RTOSs.
The “Level 5” test results in the three RTOSs are mainly due to insufficient resources and the corresponding task has been in a state of waiting for a resource. Memory not aligned is the main cause of “Level 6” and wrong kernel data may also cause “Level 6”.
5.4.3. Benchmark program analysis
As previously mentioned, the Telemetry System (TS) tends to be compute-intensive and TECS tends to be data-intensive. The number of high frequency called API in the two benchmark programs is 8 and 15, respectively. The robust values of each API are almost the same in the two workloads. However, there are still small differences in these two workloads. Table 5 and 6 also show that the use of RTOS resources in TS is less than TECS. The system resources, such as memory, also affect the robustness of the RTOS. For example the API “TaskCreate” will hang when the system memory is not enough in Vxworks. The ratio of “Level 5” of Vxworks is higher in TECS than in TS for TECS does not output the processing results .The raw testing results also need to be processed with a voting approach before calculating the robustness of the RTOS. Combining the workloads to evaluate the robustness of the system would be more comprehensive while the usage of each API is closely related to the workloads.
5.4.4. Test deviation analysis
The test deviation in our system is mainly focused on “Level 3” and “Level 4”. Details about the causes of these deviations are as follows.
As above mentioned, we use a voting approach to find out the “Level 3” test results. The difference between the RTOSs will also probably result in the fact that the voting approach is inaccurate when the workloads do not output processing results. For example, the API “TaskSetPriority (int tasked, int newpriority)” is used to adjust the priority of a task in TECS. The priority range in the three systems is different (Ucos: 0-63, Vxworks: 0-255, Rtems: 0-255). If the parameter “newpriority” is set to a value between 64 and 255, the test result in Ucos will be “Level 1” and the corresponding results in Vxworks and Rtems will be “Level 0”. After processing of the raw test results, the test results in Vxworks and Rtems will be changed to “Level 3”. This situation is obviously not suitable for adopting the voting approach.
The “Level 4” test results are identified by finding that the error code is set as incorrect in Vxworks. However, how to determine whether the error code is correct or not is usually not clear enough. We just check whether the current error code is consistent with the current module. In fact, some APIs may include more than one module. For example, the API “SemBCreate” includes two modules (Task Manger and Task Synchronization).
Briefly said, since each RTOS has its own characteristics, test deviation is always inevitable. Our system reduces these deviations as much as possible during the implementation process.
102
6. Conclusion and future work
We have designed a comprehensive benchmark for robustness evaluation of the RTOS according to the characteristics of the current popular RTOSs. Our benchmark has adopted the advantages of the existing benchmarks and made improvements in three aspects. First, we defined a set of uniform application program interfaces for faults injection to ensure the portability of the benchmark. Then the package testing is used in the fault injection for improving the testing efficiency under the premise without sacrificing the testing coverage. Finally, a quantitative robustness evaluation model combined with workloads is proposed for calculating the robustness value of the RTOS and we have established that Rtems performs best in robust evaluation, while Vxworks performs worst.
Future extensions of our work include two aspects: 1) we can improve the current method of generating test cases to reduce the test bias by analyzing the specific characteristics of each RTOS; 2) The testing results classification method needs improvements in order to become more accurate and autonomous.
Acknowledgements: This work has been supported by China National Natural Science Foundation (No 51175462) and National Defence Research Projects.
R e f e r e n c e s
1. Z h a o, Z. Z., J. H. J i a n g. Research of Robustness Testing Methods for Operation Systems. –Computer Engineering and Applications, Vol. 43, 2007, No 7, pp. 93-97.
2. IEEE Std 610.12-1990 IEEE Standard Glossary of Software Engineering Terminology, 1990. 3. http://www.windriver.com/products/platforms/safety_critical_arinc_653/ 4. K r o p p, N. P., P. J. K o o p m a n, D. P. S i e w i o r e k. Automated Robustness Testing of off-the-
shelf Software Components. – In: Proc. of FTCS’98: Fault Tolerant Computing Symposium, Munich, Germany, 23-25 June 1998. IEEE Computer Society Press: Los Alamitos, CA, 1998, pp. 230-239.
5. G e h a n i, N. H. Exceptional C or C with Exceptions. – Software: Practices and Experience, Vol. 22, 1992, No 10, pp. 827-848.
6. C a r r e t t e, G. Crashme: Random Input Testing. http://people.delphiforums.com/gic/crashme.html
7. M i l l e r, B. P., D. K o s k i, C. P. L e e, V. M a g a n t y, R. M u r t h y, A. N a t a r a j a n, J. S t e i d l. Fuzz Revisited: A Re-Examination of the Reliability of UNIX Utilities and Services. Computer Science Technical Report 1286, Univ. of Wisconsin-Madsion, 1988.
8. G h o s h, A. K., M. S c h m i d, V. S h a h. Testing the Robustness of Windows NT Software. – In: Proc. of Ninth International Symposium on Software Reliability Engineering (ISSRE’98), Los Alamitos, CA, November 1998, pp. 231-235.
9. B a r t o n, J., E. W. C z e c k, Z. Z. S e g a l l. Fault Injection Experiments Using FIAT. – IEEE Trans. on Computers, Vol. 39, 1990, No 4, pp. 575-582.
10. K a o, W., R. L y e r, D. T a n g. FINE: A Fault Injection and Monitoring Environment for Tracing the UNIX System Behavior Under Faults. – IEEE Trans. on Software Engineering, Vol. 19, 1993, No 11, pp. 1105-1118.
11. Carnegie Mellon University. Ballista Project. http://www.cs.cmu.edu/afs/cs/project/edrc-ballista/www/index.html
12. P a n, J., P. K o o p m a n, D. S i e w i o r e k. A Dimensionality Model Approach to Testing and Improving Software Robustness. – In: Proc. of 1999 IEEE AUTOTESTCON, September 1999, IEEE, Piscataway, NJ, USA, 1999, pp. 493-501.

103
13. Z h o u, Z. M., Y. Z h o u, M. C a i. An Approach to Evaluate the Robustness of Real Time Operating System. – In: Proc. of 2nd International Conference on Computer Science and Network Technology, Changchun, China, December 2012, pp. 306-310.
14. Z h o u, Z. M., Y. Z h o u, M. C a i, L. S u n. A Workload Model Based Approach to Evaluate the Robustness of Real-Time Operating System. – In: Proc. of 2013 IEEE International Conference on High Performance Computing and Communications & 2013 IEEE International Conference on Embedded and Ubiquitous Computing, Zhangjiajie, China, November 2013, pp. 2027-2033.