Embed Size (px)
Citation preview

Designing an Integrated Pest Management Strategy for Pollen
beetles in Oilseed rape
Sam Cook AgroEcology Department
Rothamsted Research [email protected]

Pollen beetle pest status
•Most abundant pest of OSR during bud-flowering stages •Feeding damage causes bud abscission & yield loss •Damage susceptible stage = green-yellow bud •When the crop begins to flower, feeding occurs in open flowers and the crop can compensate for damage • Controlled by insecticides

Pyrethroid resistance in pollen beetles
• Resistance to Pyrethroids 1st detected in France 1999 • Resistant populations spread quickly! • Detected in Germany 2001 – monitoring started • Resistance in Germany 2006 led to complete loss of 30,000ha (€22-25 M) • Now widespread across Europe! Need IPM to reduce selection for resistance
2001 2006
Data: Bayer CropScience

‘Development of an integrated pest management strategy for control of pollen beetles in winter oilseed rape’ LK09108 / HGCA RD-2007-3394

Develop an IPM strategy for pollen beetles in OSR based on:
(i) Monitoring development of a baited monitoring trap
(ii) Risk assessment testing of proPlant phenological model to UK climate (iii) Crop management validate trap cropping tactic & identify improved cultivars
Development of an integrated pest management strategy for control of pollen beetles in winter oilseed rape – Project Aims:

(i) Developing a monitoring trap for pollen beetle IPM
• A baited monitoring trap will help growers & advisers to more easily and more accurately identify when spray thresholds have been breached than by plant scouting methods
• Optimal trap colour & volatile bait investigated
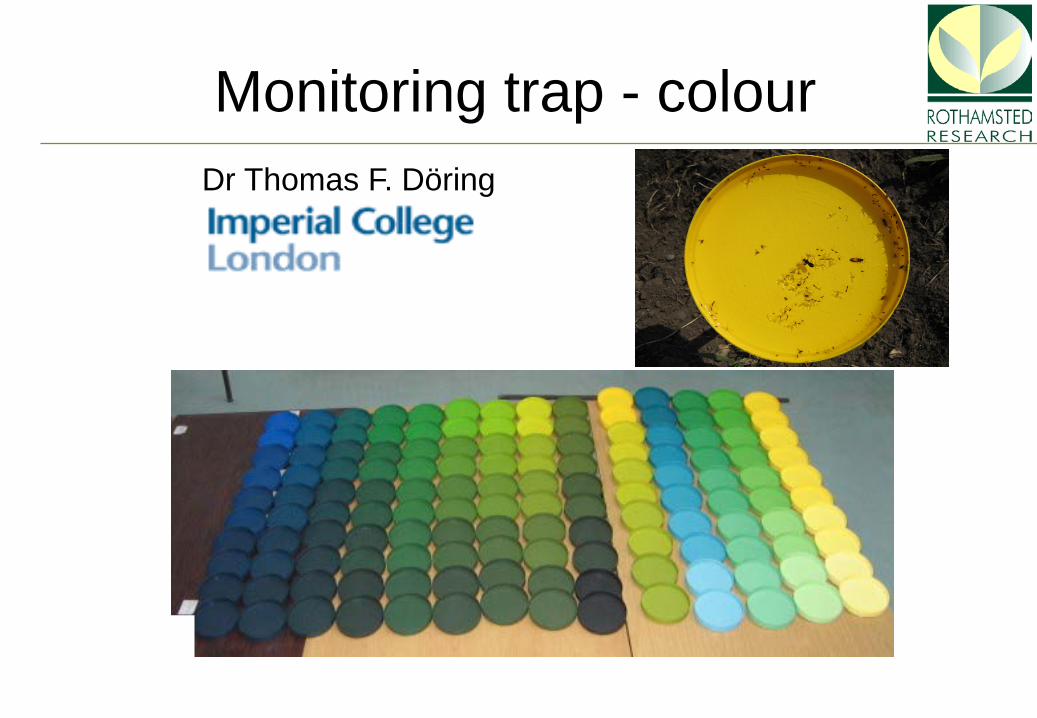
Monitoring trap - colour Dr Thomas F. Döring


Monitoring trap – colour: Behaviour in the field
0
20
40
60
80
100
120
140
160
180
fluorescent yellow green white blue grey red black
Trap colour
Bee
tles
per t
rap

Identification of pollen beetle colour receptors
Electroretinoraphy: Measures voltage change of photoreceptors in response to monochromatic light stimulus
0
0.1
0.2
0.3
0.4
0.5
0.6
0.7
0.8
0.9
1
300 350 400 450 500 550 600 650Wavelength (nm)
Spec
tral s
ensi
tivity
Green receptor model
Overall ERG measurement
Spectral sensitivity: Maximum at ~540 nm (green); also blue and UV
Döring, Skellern, Watts & Cook (2012) Phys. Ent. 37:360-368

0
0.2
0.4
0.6
0.8
1
1.2
1.4
1.6
-0.6 -0.4 -0.2 0 0.2 0.4 0.6 0.8 1 1.2 1.4
Rel
ativ
e nu
mbe
r of i
nsec
ts
Green-blue-COM: log (G) – log (B)
Model of pollen beetle colour choice behaviour
Döring, Skellern, Watts & Cook (2012) Phys Ent 37:360-368

Monitoring trap - Bait In the absence of pollen beetle sex / aggregation pheromones, we
are developed a lure derived from OSR host plant volatiles

Coupled Gas-Chromatography-Electroantennography (GC-EAG)
air N2
sample FID
GC
splitter EAG/SCR

1
2
3
Coupled GC-EAG of pollen beetle and oilseed rape flower volatiles
1 = phenylacetaldehyde, 2 = indole, 3 = (E,E)-α-farnesene

Results of replicated field trials 2008-2011 •15 volatile semiochemicals identified & tested • Phenylacetaldehyde performed most consistently and was chosen for further development as the lure for the field trap
•Lure reduces total no. non-target insects caught • IPS Ltd prototype commercial lure selected
•Oecos carrot fly sticky trap selected
●Available from Oecos 2013 www.oecos.co.uk

Monitoring trap – calibration
Calibration of trap requires an understanding of the relationship between numbers of beetles caught on traps and numbers of beetles on the crop so that a given trap catch can relate to current (or new) threshold levels
# on trap
# in
tran
sect

N
prevailing windfrom WSW
nearest rape crop this
year
nearest rape crop previous
year
woodland
downwind
upwind
sticky traps
plant beating transects
hedgerow
Sticky traps placed upwind and downwind in OSR crops changed 1 or 2/week from green bud – early flowering (~6 weeks) 30m transect conducted at each trap site when traps changed to give mean no. beetles/plant from 10 plants Sticky traps & transects trap calibration analysis (& proPlant test)
Trapping experiment

Pollen beetle trapping experiments run across UK
17 sites 2008 (white)
27 sites 2009 (red) 57 sites 2010 (blue) 77 sites 2011 (yellow) 178 sites
Year Total number of
pollen beetles
caught
Mean (±SE) number
of beetles caught
per trap
Mean (±SE) n
of beetles ca
per trap -upw
2008 3,142 8.12 (0.82) 7.54 (1.32)
2009 16,344 18.85 (1.74) 15.64 (2.01)
2010 60,301 29.46 (2.08) 20.61 (3.04)
2011 75,670 40.49 (2.49) 45.76 (5.05)

Monitoring trap – calibration
● Aim to correlate no. beetles on trap with no. in crop ●NO simple relationship was found
●So trap cannot be used to detect threshold breaches in the crop (yet)
● In any case the trap can provide good indication of local beetle movement !!!

Rothamsted 09.01.2008 (ii) Improved risk assessment for pollen beetle IPM Test proPlant phenological model to UK conditions
proPlant – DSS system used widely in Europe. Its pollen beetle phenological model uses sunshine, rainfall, windspeed, and temperature data to predict immigration up to 3d in advance and could help improve monitoring and management decisions
Migration possible Good conditions for migration Optimum conditions for migration

Rothamsted 09.01.2008 Testing fit of proPlant phenological model
to UK conditions
Compare the output of the proPlant model with the sticky trap data: - start of migration
- peak(s) of migration
- % completion of migration

Zuflug 100%Rapsglanzkäfer
SchädlingeWinterraps
Datum 42
Mai 10
30282624222018161412108642
April 10
302826242220181614121086
März 10
[%]100
80
60
40
20
0
-5
[°C][mm][m/s][h]25
20
15
10
5
0
Temp. Min (°C) 20cm
Regen (h) >0,1mm
Taupunkt (°C) 14°°
Wind Quer (m/s)
Luftfeuchte (%) 2m
Temp.Min.
Temp.Quer (°C) 2m
Temp.Max.
Niederschlag
Sonne (h)WOBURN FARM© by proPlant GmbH Pollen beetle 2010 Woburn
0,75 0,190
2
4
6
8
10
12
14
16
18
20
0
30
60
90
120
150
180
210
240
270
300
08
.03.
10
09
.03.
10
10
.03.
10
11
.03.
10
12
.03.
10
13
.03.
10
14
.03.
10
15
.03.
10
16
.03.
10
17
.03.
10
18
.03.
10
19
.03.
10
20
.03.
10
21
.03.
10
22
.03.
10
23
.03.
10
24
.03.
10
25
.03.
10
26
.03.
10
27
.03.
10
28
.03.
10
29
.03.
10
30
.03.
10
31
.03.
10
01
.04.
10
02
.04.
10
03
.04.
10
04
.04.
10
05
.04.
10
06
.04.
10
07
.04.
10
08
.04.
10
09
.04.
10
10
.04.
10
11
.04.
10
12
.04.
10
13
.04.
10
14
.04.
10
15
.04.
10
16
.04.
10
17
.04.
10
18
.04.
10
19
.04.
10
20
.04.
10
21
.04.
10
22
.04.
10
23
.04.
10
24
.04.
10
25
.04.
10
26
.04.
10
27
.04.
10
28
.04.
10
29
.04.
10
30
.04.
10
01
.05.
10
02
.05.
10
03
.05.
10
04
.05.
10
Tran
sect
(av
./1
Pl.)
Be
etl
es/
1 s
tick
y tr
ap (
av.)
58 Horsepool
Beetles/1 sticky trap Transect (average/1 Plant)
58 Horsepool nr Woburn
Optimal conditions for migration
Good conditions for migration
Migration possible
2010 data; Woburn farm

Zuflug 100%Rapsglanzkäfer
SchädlingeWinterraps
Datum 42
Mai 10
30282624222018161412108642
April 10
302826242220181614121086
März 10
[%]100
80
60
40
20
0
-5
[°C][mm][m/s][h]25
20
15
10
5
0
Temp. Min (°C) 20cm
Regen (h) >0,1mm
Taupunkt (°C) 14°°
Wind Quer (m/s)
Luftfeuchte (%) 2m
Temp.Min.
Temp.Quer (°C) 2m
Temp.Max.
Niederschlag
Sonne (h)WOBURN FARM© by proPlant GmbH Pollen beetle 2010 Woburn
0
2
4
6
8
10
12
14
16
18
20
0
10
20
30
40
50
60
70
80
90
100
08.0
3.10
09.0
3.10
10.0
3.10
11.0
3.10
12.0
3.10
13.0
3.10
14.0
3.10
15.0
3.10
16.0
3.10
17.0
3.10
18.0
3.10
19.0
3.10
20.0
3.10
21.0
3.10
22.0
3.10
23.0
3.10
24.0
3.10
25.0
3.10
26.0
3.10
27.0
3.10
28.0
3.10
29.0
3.10
30.0
3.10
31.0
3.10
01.0
4.10
02.0
4.10
03.0
4.10
04.0
4.10
05.0
4.10
06.0
4.10
07.0
4.10
08.0
4.10
09.0
4.10
10.0
4.10
11.0
4.10
12.0
4.10
13.0
4.10
14.0
4.10
15.0
4.10
16.0
4.10
17.0
4.10
18.0
4.10
19.0
4.10
20.0
4.10
21.0
4.10
22.0
4.10
23.0
4.10
24.0
4.10
25.0
4.10
26.0
4.10
27.0
4.10
28.0
4.10
29.0
4.10
30.0
4.10
01.0
5.10
02.0
5.10
03.0
5.10
04.0
5.10
Tran
sect
(av
./1
Pl.)
Beet
les/
1 st
icky
tra
p (a
v.)
59 Mill Dam
Beetles/1 sticky trap Transect (average/1 Plant)
= Proplant sample point
Risk period (GS ≥ 51-59) between yellow bars
= Temp ≥ 15°C, Crop Monitor sample point
59 Mill Dam Woburn
Predictive ability of proPlant may save insurance sprays?
No need to spray if threshold is near-breach and immigration is predicted to be 100%
Gives confidence to hold off if threshold is near-breach but conditions are predicted poor for migration

Improved risk assessment for pollen beetle
proPlant can accurately forecast start, peaks (risk periods) and end of immigration, focussing monitoring effort to when it is most needed 2012, 2013 ProPlant tool now provided free to UK growers via Bayer CropScience www.bayercropscience.co.uk/ Immigration start Immigration risk % completion immigration

(iii) Crop Management
Validate trap cropping tactic • Early flowering winter turnip rape (Brassica rapa) planted as a trap crop
surrounding the main oilseed rape crop can reduce the population of beetles in the main crop to below spray threshold levels
• Cost:benefit not currently favourable for conventional growers

Future directions – breeding for improved pest tolerance
Approach: • All major insect pests of OSR are crucifer specialists
• Pests locate and select host plants on basis of visual, olfactory, gustatory & tactile plant cues
• Pests show host plant preferences
• Understanding host location / selection behaviours and mechanisms of preferences can contribute to IPM tools for pests AND identify plant traits to inform breeding programmes for resistance (or a reduction in host-finding / selection)

Use of oilseed rape cv. with high proportions of indolyl and low proportions of alkenyl glucosinolates?
Alkenyl GS 3-butenyl isothiocyanate Indolyl GS do not catabolise to form stable ITC
Oilseed rape with low % alkenyl GS high% indolyl GS
Oilseed rape with high % alkenyl GS low % indolyl GS
Cook et al., 2006; Ent. Exp. Appl. 119:221-9

Red oilseed rape? Exploitation of colour preference in pollen beetle IPM
Potted plants of a white petalled oilseed rape line were dyed red, blue or yellow and colonization by pollen beetles observed in the field.
Cook, Skellern, Döring & Pickett (2013) Arthropod-Plant Interactions: in press
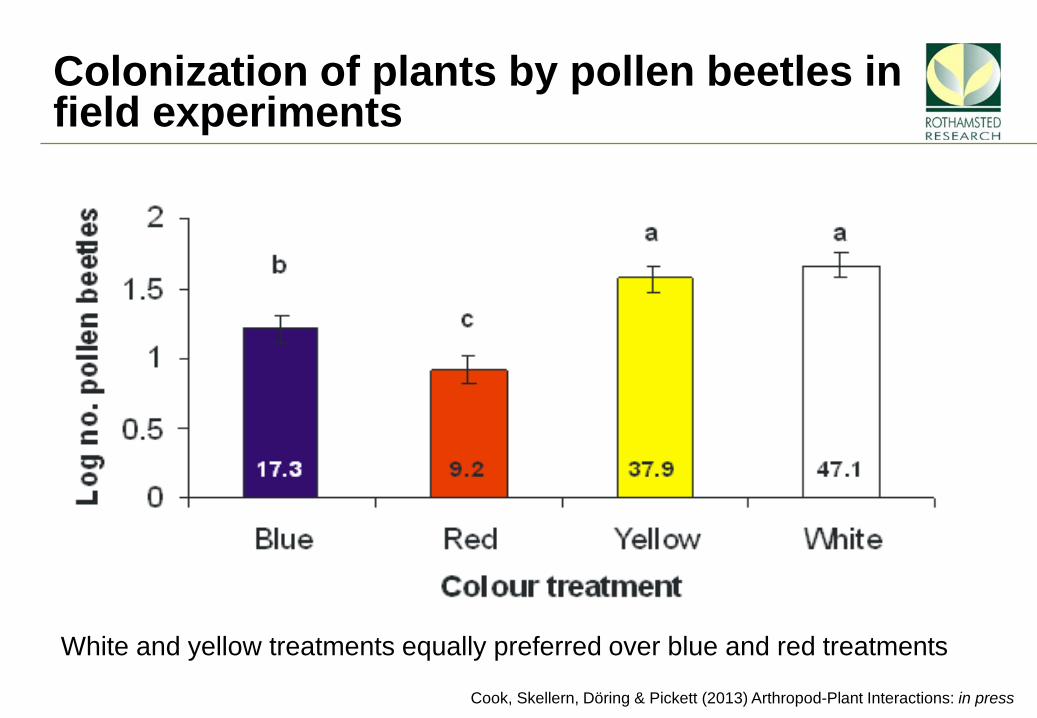
Colonization of plants by pollen beetles in field experiments
White and yellow treatments equally preferred over blue and red treatments
Cook, Skellern, Döring & Pickett (2013) Arthropod-Plant Interactions: in press

Acknowledgements • John Pickett • Lesley Smart • Sue Welham • Christine Woodcock • Janet Martin • Matt Skellern • Nigel Watts
• Darren Murray (VSN International) • Thomas Döring • Peter Taylor • Eileen Bardsley • Michael Tait • Jackie Davies • Andreas Johnen
Nigel Padbury & Sean Burns
Mark Nightingale
Peter Werner
Jo Bowman
Matthew Clark
Richard Jennaway & Colin Patrick


![Terminix integrated pest management [ipm] pest control indonesia](https://img.pdfslide.net/doc/110x75/556c5d50d8b42acc228b5069/terminix-integrated-pest-management-ipm-pest-control-indonesia.jpg)