Embed Size (px)
Citation preview
1
Designing and Maintaininga Pollution-Resilient
Electric Power System
Tom McDermott
IEEE/PES T&D ConferenceApril 21-24, 2008 Chicago, IL
4/23/2008 Pollution-Resilent Electric Power System 2
Managing Pollution Issues
• Define the metrics, and measure them• Use simulation to compare different
designs and maintenance strategies– validate with measurements– how to value pollution?
• Implement system changes– again, validate with measurements

2
4/23/2008 Pollution-Resilent Electric Power System 3
Harmonic Voltage Distortion
• Pollution Rank #1, PQ Rank #3• Standard: IEEE 519• Metric: THD95; level exceeded 5% of time
– limit at MV is 5.0% total, 3.0% any component
4/23/2008 Pollution-Resilent Electric Power System 4
Voltage Flicker
• Pollution Rank #2, PQ Rank #4• Standard: IEEE 1453• Metric: PST; short-term flicker coefficient
– planning limit is 0.9
-100
-50
0
50
100
0.0 0.1 0.2 0.3 0.4 0.5
Step-wise Flicker
Vol
tage
Mag
nitu
de (%
)
Time (s)

3
4/23/2008 Pollution-Resilent Electric Power System 5
Transient Overvoltages
• Pollution Rank #3, PQ Rank #5• Standard: IEEE 1159 (plus EPRI reports)• Metric: SATMORI1.7; annual frequency of voltage
transients at least 1.7 per-unit– typical value of 1 per day?
4/23/2008 Pollution-Resilent Electric Power System 6
RMS Variations (Sags & Swells)
• Pollution Rank #4, PQ Rank #2• Standard: IEEE 1159 (plus EPRI reports)• Metric: SARFI70; annual frequency of sags to 70%
voltage or below– typical value of 20
(Similar to voltage flicker)
4
4/23/2008 Pollution-Resilent Electric Power System 7
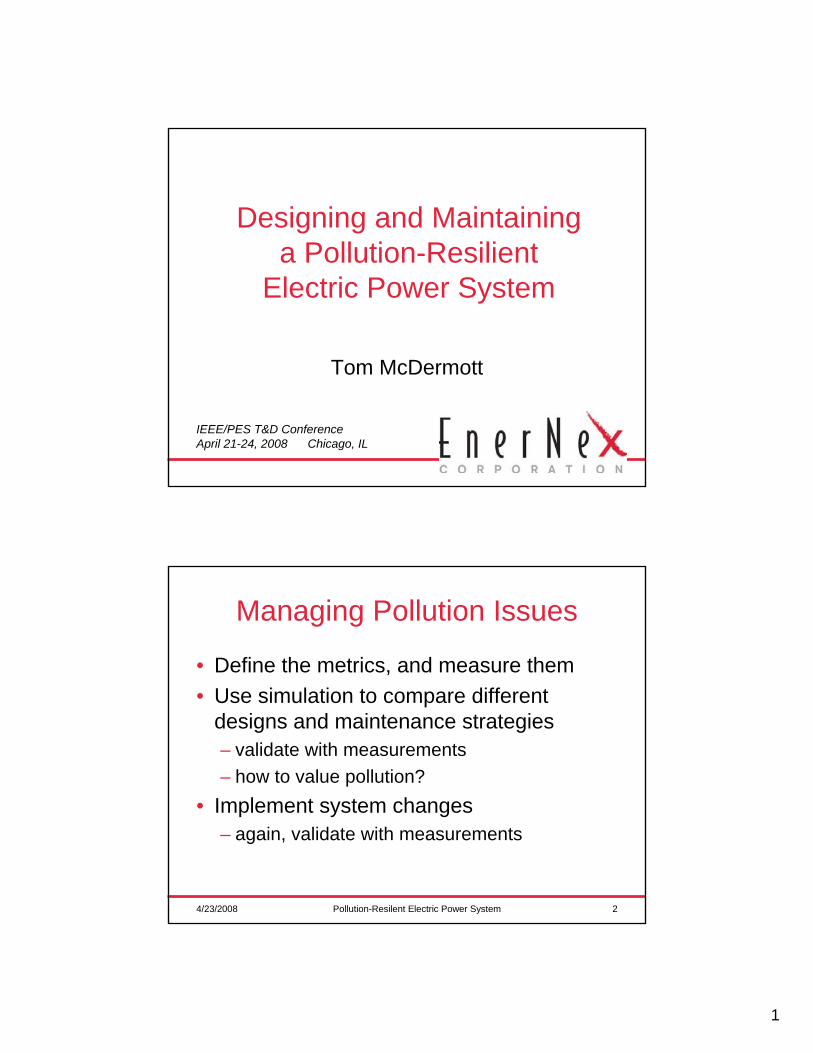
Momentary Interruptions
• Pollution Rank #5, PQ Rank #1• Standard: IEEE 1366• Metric: MAIFI; frequency of interruptions up to 1 or 5 min
– typical value of 6 annually
(Sags below 10% voltage; followed by a voltage recovery transient when the fault clears)
4/23/2008 Pollution-Resilent Electric Power System 8
Benefits of Source Strength
• Reduce voltage sag magnitudes• Absorb more harmonic current injection• Reduce flicker magnitudes• Note: these are probably what you think of
as “pollution”– No inherent effect on interruptions (aka
reliability) or transients (another type of pollution)
5
4/23/2008 Pollution-Resilent Electric Power System 9
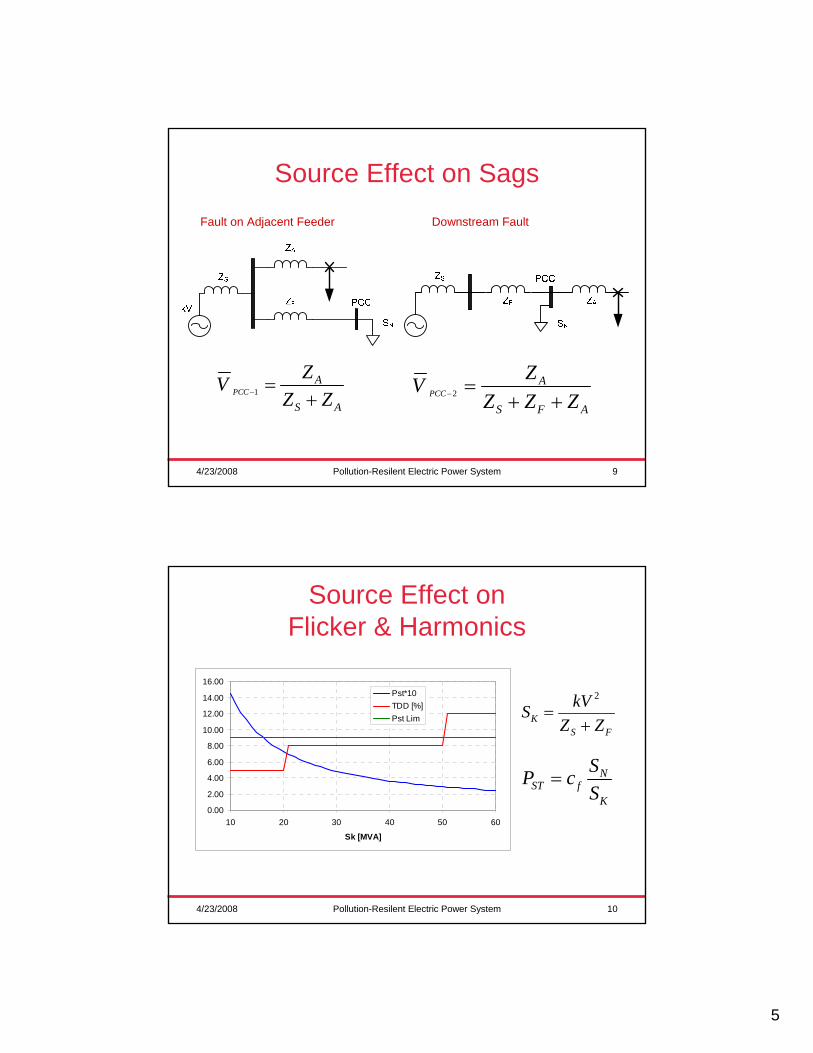
Source Effect on Sags
1PCCA
S A
ZVZ Z− =
+ 2PCCA
S F A
ZVZ Z Z− =
+ +
Fault on Adjacent Feeder Downstream Fault
4/23/2008 Pollution-Resilent Electric Power System 10
0.00
2.00
4.00
6.00
8.00
10.00
12.00
14.00
16.00
10 20 30 40 50 60
Sk [MVA]
Pst*10TDD [%]Pst Lim
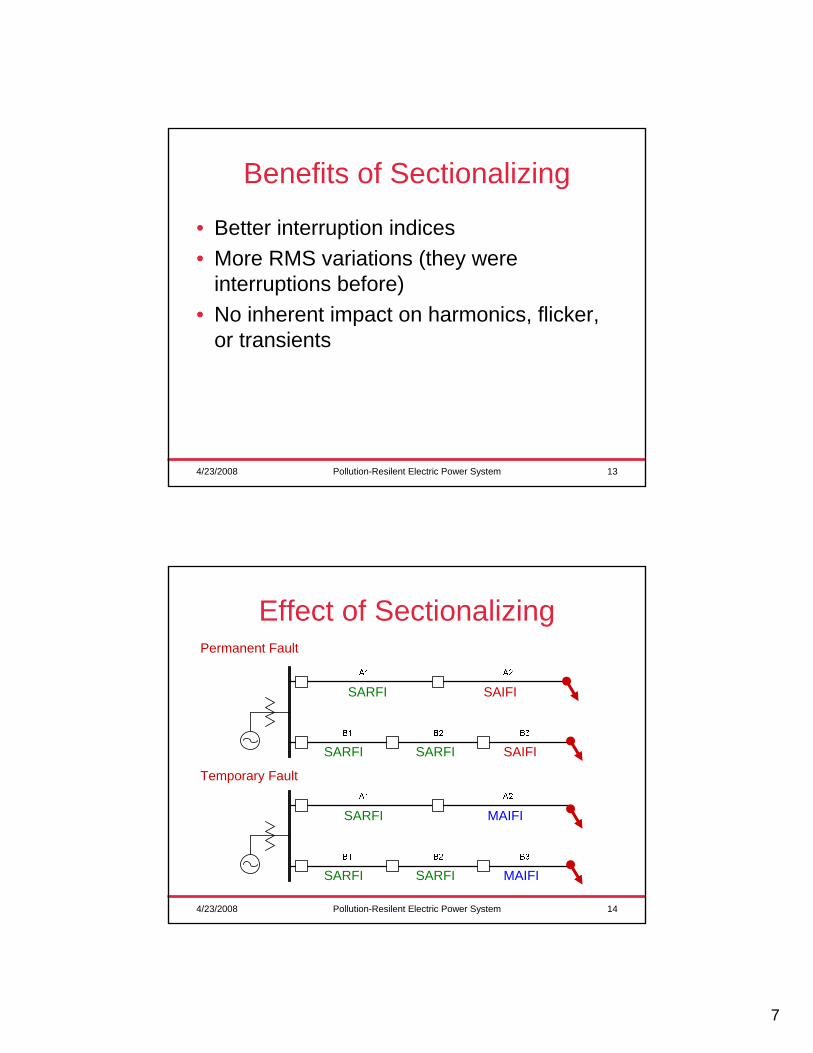
Source Effect on Flicker & Harmonics
2
KS F
kVSZ Z
=+
NST f
K
SP cS
=

6
4/23/2008 Pollution-Resilent Electric Power System 11
Source Effect Parallel Resonance
0
50
100
150
200
250
3 4 5 6 7 8 9
Parallel Resonance of 5 MVA, 13.8-kV CapacitorV
olta
ge (V
)
Frequency (H pu)
20-MVA Transformer 12-MVA Transformer
4/23/2008 Pollution-Resilent Electric Power System 12
How To Increase Source Strength
• Increase conductor sizes• Increase substation transformer capacity• Add a substation transformer• Higher transmission voltage service• Add a transmission line• Express feeders (isolation from other load)• Dedicated transformers (more isolation)
7
4/23/2008 Pollution-Resilent Electric Power System 13
Benefits of Sectionalizing
• Better interruption indices• More RMS variations (they were
interruptions before)• No inherent impact on harmonics, flicker,
or transients
4/23/2008 Pollution-Resilent Electric Power System 14
Effect of SectionalizingPermanent Fault
Temporary Fault
SARFI SAIFI
SARFI SARFI SAIFI
MAIFI
MAIFI
SARFI
SARFISARFI
8
4/23/2008 Pollution-Resilent Electric Power System 15
Impact of Distributed Resources
• The effect is mixed, and benefits may accrue primarily to the DG owner
• Good Impacts:– Higher source strength? Depends on interconnection– Backup source may reduce long-term interruption
indices• Bad Impacts:
– Higher ground fault voltages on healthy phases– May produce more flicker or harmonics
4/23/2008 Pollution-Resilent Electric Power System 16
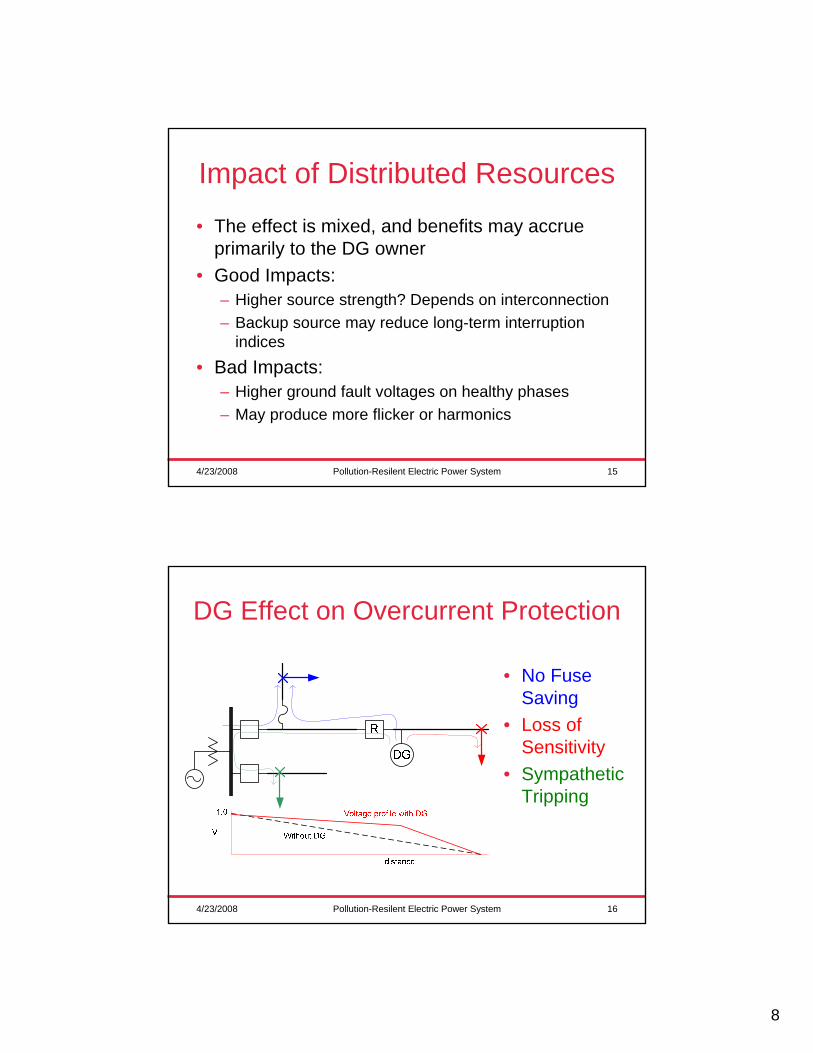
DG Effect on Overcurrent Protection
• No Fuse Saving
• Loss of Sensitivity
• Sympathetic Tripping

9
4/23/2008 Pollution-Resilent Electric Power System 17
DG Impact on Reclosing
• DG has to disconnect early in the reclose interval, may lengthen to 2 – 5 seconds
• Dead time changes from “instantaneous” to “momentary” category of IEEE 1159
Reclose Interval
DG Must Disconnect Here
4/23/2008 Pollution-Resilent Electric Power System 18
Reducing the Event Rate
• Helps both interruptions and RMS variations
• Upgraded lightning protection– Arresters– Overhead shield wires, with better grounding– More insulation
• Vegetation management
10
4/23/2008 Pollution-Resilent Electric Power System 19
Other Measures
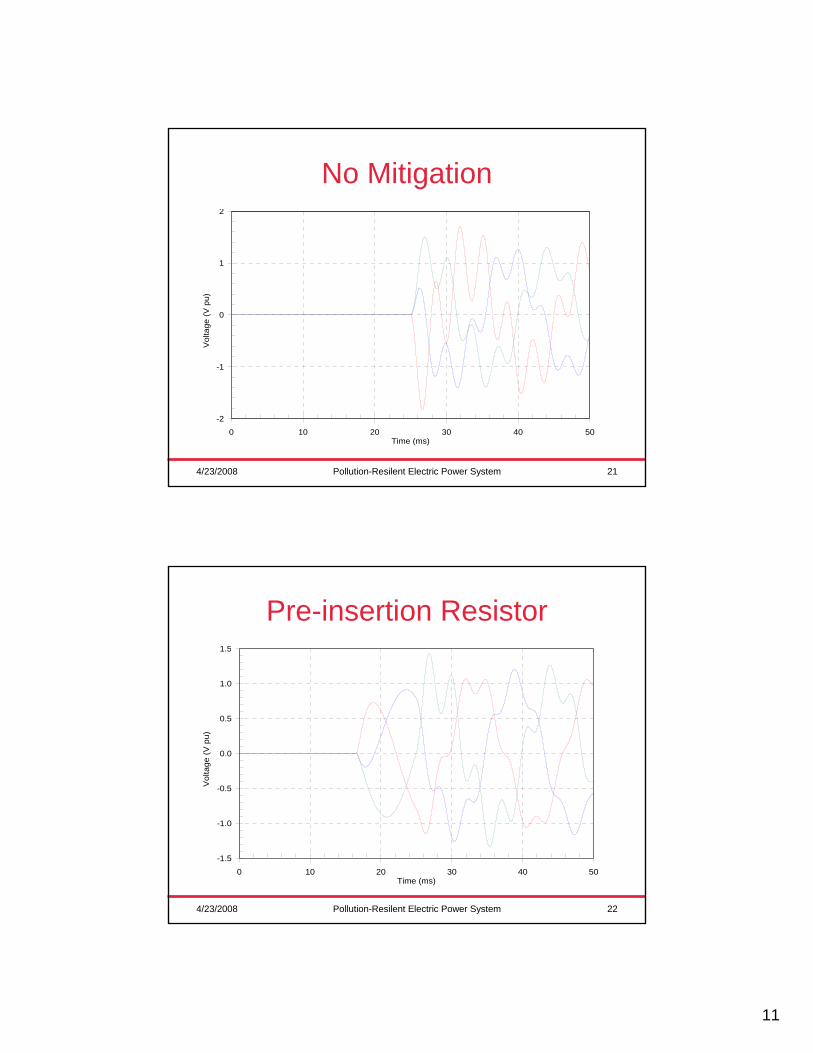
• Capacitor switching surge reduction– Synchronous or zero-voltage control– Preinsertion resistors
• Power electronic devices to reduce flicker or harmonics (STATCOM, DVAR, etc.)
• Passive harmonic filters• PWM converters don’t inject low-order
harmonic currents
4/23/2008 Pollution-Resilent Electric Power System 20
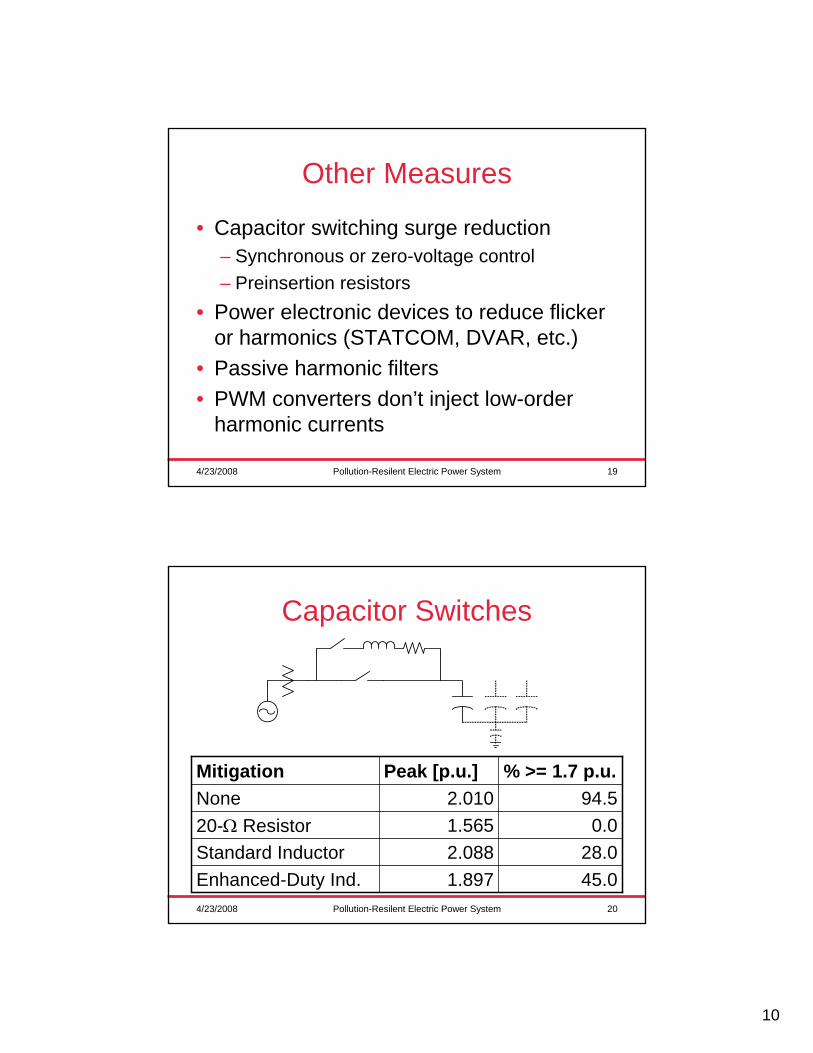
Capacitor Switches
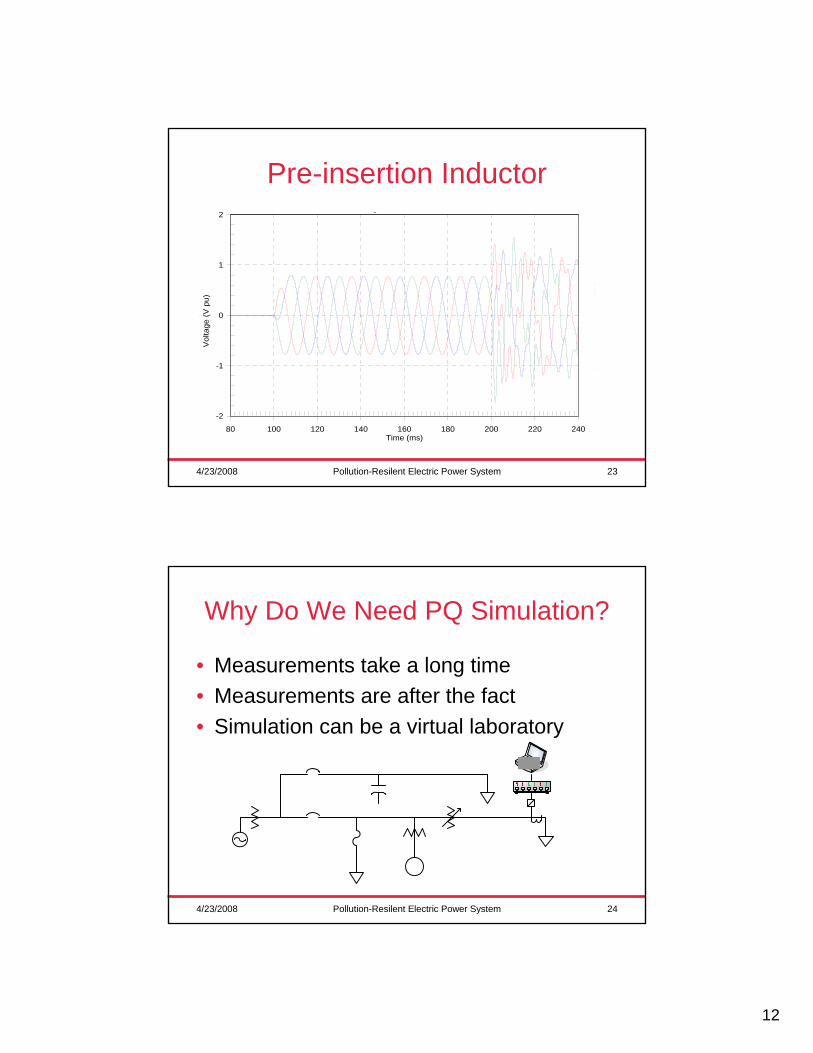
45.01.897Enhanced-Duty Ind.28.02.088Standard Inductor
0.01.56520-Ω Resistor94.52.010None
% >= 1.7 p.u.Peak [p.u.]Mitigation
11
4/23/2008 Pollution-Resilent Electric Power System 21
No Mitigation
-2
-1
0
1
2
0 10 20 30 40 50
gV
olta
ge (V
pu)
Time (ms)
4/23/2008 Pollution-Resilent Electric Power System 22
Pre-insertion Resistor
-1.5
-1.0
-0.5
0.0
0.5
1.0
1.5
0 10 20 30 40 50
Vol
tage
(V p
u)
Time (ms)
12
4/23/2008 Pollution-Resilent Electric Power System 23
Pre-insertion Inductor
-2
-1
0
1
2
80 100 120 140 160 180 200 220 240
yV
olta
ge (V
pu)
Time (ms)
4/23/2008 Pollution-Resilent Electric Power System 24
Why Do We Need PQ Simulation?
• Measurements take a long time• Measurements are after the fact• Simulation can be a virtual laboratory

13
4/23/2008 Pollution-Resilent Electric Power System 25
Stochastic Fault Application
• Rate (0.1 / mile / yr)• Other Variables:
– Phases Involved– Permanent? (20%)– Resistance? (5 Ω)
• Each type makes a weighted contribution to MAIFI and SARFI
4/23/2008 Pollution-Resilent Electric Power System 26
Fault Analysis Flowchart
Coil Pickup
Contact
Time dial
Trip and Reset Times
0.1
1
10
100
0.01 0.1 1 10 100
Multiples of Pickup (M)
Seco
nds
14
4/23/2008 Pollution-Resilent Electric Power System 27
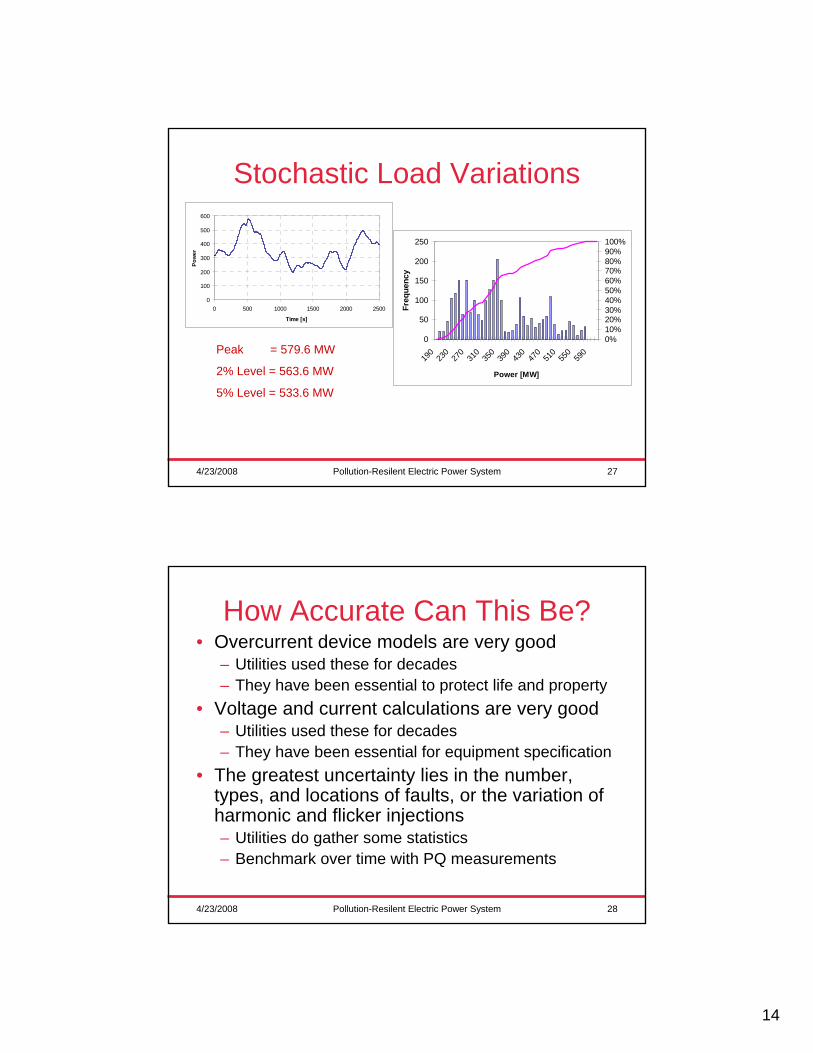
Stochastic Load Variations
0
100
200
300
400
500
600
0 500 1000 1500 2000 2500
Time [s]
Pow
er
0
50
100
150
200
250
190
230
270
310
350
390
430
470
510
550
590
Power [MW]
Freq
uenc
y
0%10%20%30%40%50%60%70%80%90%100%
Peak = 579.6 MW
2% Level = 563.6 MW
5% Level = 533.6 MW
4/23/2008 Pollution-Resilent Electric Power System 28
How Accurate Can This Be?• Overcurrent device models are very good
– Utilities used these for decades– They have been essential to protect life and property
• Voltage and current calculations are very good– Utilities used these for decades– They have been essential for equipment specification
• The greatest uncertainty lies in the number, types, and locations of faults, or the variation of harmonic and flicker injections– Utilities do gather some statistics– Benchmark over time with PQ measurements

15
4/23/2008 Pollution-Resilent Electric Power System 29
Conclusion
• You can’t manage something unless you measure it
• Software tools need to produce figure-of-merit outputs (SARFI, MAIFI, PST, THD95)
• How to assign value to the indices?• EPRI software tools:
– PQ Planner (not used much)– DSS (going open source!!)