Embed Size (px)
Citation preview

Designing effective online examinations:
Guidelines from a HCI evaluation
A paper on assessment of online examination system of Software Engineering course
offered in IIIT Hyderabad.
Project Guide: Prof. Herre Van Oostendorp
Mentor: Saras Chandra
Authors:
Abinash Mohapatra
Himanshu Zade
Kirti Garg

Abstract:
The various set of arguments in favor and in opposition to the introduction of web based
examinations have made it essential to check the skills required to master this transition. It is
this ideology that has made comparison between the earlier (paper based) and current day
(web based) methodologies significant. The paper discusses a study conducted on the online
examination portal used by the software engineering students at IIIT Hyderabad. It consisted of
a survey that gave a basic idea about the student perception of the portal, followed by an
interview with the students to acknowledge their issues and concerns in certain specific
domains with respect to the usability of the portal, and later an experiment supported by talk
aloud assessment. This report therefore discusses the usability techniques that will help us
formulate a set of guidelines to be followed and thus design better online examinations.
Introduction:
Studies have revealed that there is a tremendous impact of the introduction of computer based
examinations; not only on the way examinees prepare for the exams but also on the intellectual
skills required to appear and excel well in the examination. The following studies:
1. Paper-based versus computer-based assessment: key factors associated with the test
mode effect., British Journal of Educational Technology.
2. Comparison of Traditional and Web-Based Course Evaluation Processes in a Required,
Team-Taught Pharmacotherapy Course, Jennifer B. Kasiar, Sara L. Schroeder and
Sheldon G. Holstad.
- indicate how just a shift of medium from paper pen to software enabled systems has
introduced a new challenge, before both the students and the teacher, about how to bridge the
gap that this shift has brought in. We can see the example in the shift of CAT (Common
Aptitude Test) to a web based online pattern, invoking considerable criticism for being unfriendly
to the users, barring not even users proficient in computer use. The paper tries to figure out the
reason behind this change in the user behavior for not being able to welcome this transition
willingly. The study will ultimately result in deeper understanding about designing online
examination systems (software enabled examination systems) so that they are effective on the
usability front.
Objective:
The project aims at comparing the paper pen and computer based examination methodologies
from the usability perspective and to figure out which of these suit the objectives of an effective
and efficient examination system better, and to discover in process, the guidelines for
development of effective online examinations.

Hypothesis:
Almost all the studies pertaining to web based education, puts practice as one of the most
important factors that makes the web based approach a success or a failure. As the students,
since their primary education, are habituated to paper pen scrutiny, they find it difficult to get
used to online examination models. This leads us, to our hypothesis:
Students will find paper based examination more easy to use and less cognitively
intense as compared to online exam when attempting software engineering exams.
Students:
● The experiment was conducted on the students of Software Engineering course in IIIT
Hyderabad.
● The students belonged to different backgrounds like B.Tech, M.Tech and PGSSP and
were unaware of idea that the course will involve online examination.
● As all of these students are associated with regular use of computers and software, they
were well versed with use of computers.
● All of them have significant experience with paper based assessments. However none
had experience with computer based assessment as it was for the first time that such an
examination was conducted in regular academia.
● As they were intimated about the examination involving diagrams to be drawn with the
aid of software tools, they were all were expected to learn and work with software tools
for drawing diagrams.
Measures:
1. Survey
2. Interviews and
3. Pseudo random study.
The study started with a survey on the students in which we tried to see their overall response
to the portal’s effectiveness. The survey questions were distributed in four sections pertaining
usability and self-sufficiency as follows:
1. Usability: It mainly dealt with the ease of use of software tools.
2. Self sufficiency: It dealt with determining if the system required external resources, like
rough sheets, or not.
3. Learnability: It dealt with the ease that the user found to acquaint himself with the use of
the system.
4. Flexibility and efficiency of use: It checked if the system allows the user to have enough
freedom to make efficient use of the system.
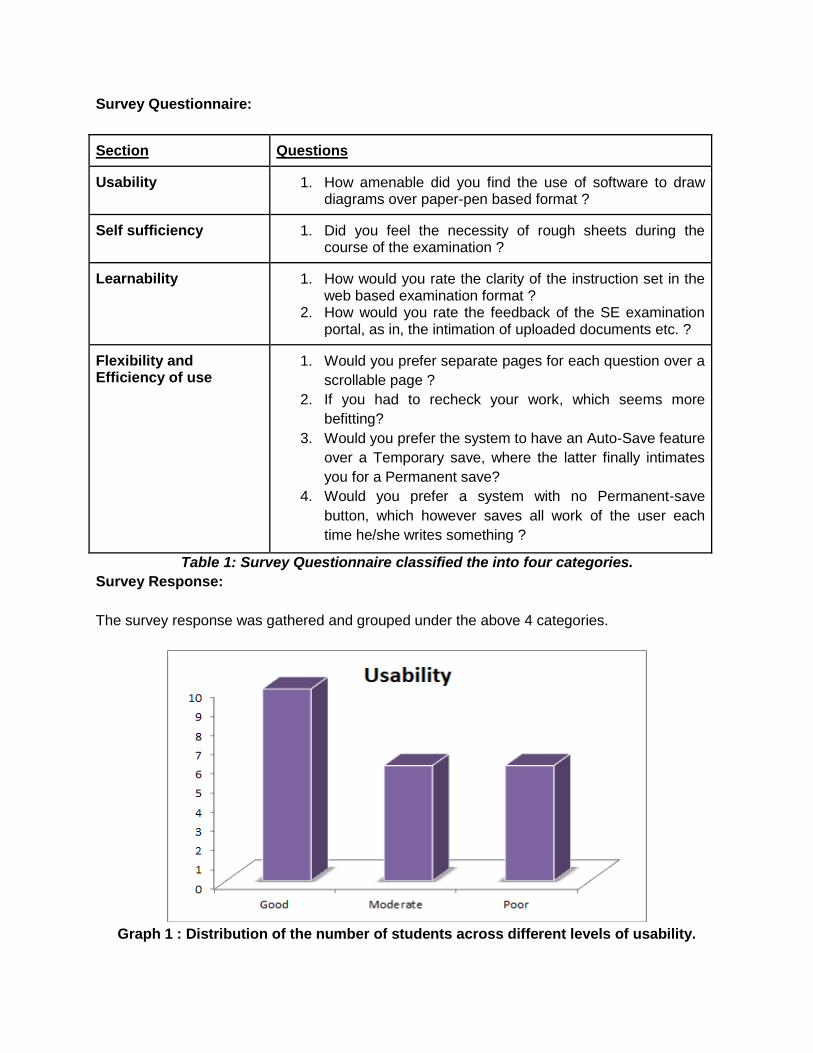
Survey Questionnaire:
Section Questions
Usability 1. How amenable did you find the use of software to draw diagrams over paper-pen based format ?
Self sufficiency 1. Did you feel the necessity of rough sheets during the course of the examination ?
Learnability 1. How would you rate the clarity of the instruction set in the web based examination format ?
2. How would you rate the feedback of the SE examination portal, as in, the intimation of uploaded documents etc. ?
Flexibility and Efficiency of use
1. Would you prefer separate pages for each question over a
scrollable page ?
2. If you had to recheck your work, which seems more
befitting?
3. Would you prefer the system to have an Auto-Save feature
over a Temporary save, where the latter finally intimates
you for a Permanent save?
4. Would you prefer a system with no Permanent-save
button, which however saves all work of the user each
time he/she writes something ?
Table 1: Survey Questionnaire classified the into four categories.
Survey Response:
The survey response was gathered and grouped under the above 4 categories.
Graph 1 : Distribution of the number of students across different levels of usability.

Graph 2 : distribution of the number of students across various levels of self sufficiency.
Graph 3 : distribution of the number of students across various levels of Learnability.

Graph 4 : Distribution of the number of students across various levels of flexibility and
efficiency of use.
How we came to the decisions:
The survey results could be easily quantified into each of the four categories mentioned above.
It came out that though there was a clear majority in each category, with the others at par. Thus
the analysis of the survey results in each of the four categories gave us a clear picture of what
are the domains of our interest that have a large scope for improvement. The survey thus led us
to the following decisions:
Decisions based on the survey response:
1. The survey unveiled that the system is moderately usable, however that it suffers from
certain issues pertaining the ease of use of software tools to draw diagrams.
2. The system challenged its self-sufficiency, which basically entertained whether the
system requires any other resources or not, like rough sheets.
3. Since there was no substantial difference between the majority response and others, in
each category, it was thought better to conduct personal interviews so as to get a better
picture of the situation.
First round of interviews was conducted in order to fetch a detailed information about various
areas of interest in a particular domain following the conclusions of the survey.
First round of interviews:
Aim:
The aim of the first round of interviews was to get inputs from the users to improve the usability
of the portal concentrating on the reason as to why they want to introduce any change if they
want to.

Approach and conduct:
For the conduct of the first round of interviews, we decided to follow a mixed approach
consisting of structured and unstructured format:
1. Structured: It helps us attain knowledge related to the desired objectives.
2. Unstructured: It helps us attain knowledge related to any other issues that the structured
approach does not pertain to.
Questionnaire:
The left column of following table is the domain where we intend to gain knowledge, and the
right column contains the questions, posed before the interviewee, concerned with the particular
domain, on the following paradigms:
1. The advantages that the students saw.
2. Challenges that they faced while using the SE portal.
3. Suggestions on how to improve the portal that existed then.
Student Questionnaire and inferences drawn:
The survey questionnaire mostly involved nominal variables. Hence the inferences have been
drawn by taking into consideration the majority votes for any particular category respectively.
Domain Questions Inference
Learnability: How should the ideal instruction set be?
1. What would have improved the clarity of the instruction set in the web based examination format?
2. Do you feel the need of a paper based instruction set provided to you before the onset of the exam?
3. Did you ask Teaching Assistants of how the system works?
1. The learnability of the system was satisfactory.
2. No.
3. Not needed.
Suggestions for
easy ways to
manage the
diagrams
1. If we give the paper based pattern
a five on a average scale of 10,
how would you rate the use of
software to draw diagrams?
2. Any suggestions for making the
use of software to draw diagrams
better and more efficient?
1. Mostly everyone rated the use of software to draw diagrams much lower than 5, but all supported its use to edit a drawn diagram.
2. More practice of tools and using some methodology to draw diagrams using hand is needed. Also making the diagram

related questions easier would help.
Utility of rough
sheets
1. What was that you used the rough
sheets mainly for?
2. Do you have any other
suggestions that can replace the
rough sheets?
1. To make a rough outline of an answer and finalise diagrams.
2. No. Not unless the inference 2 in above domain is implemented.
Degree of interaction the portal should have with the user
1. How do you think the portal should
interact with the users in terms of
providing intimation about the
uploaded documents?
2. Do you expect the system to ask
for a confirmation before
committing to certain tasks mainly
saving and uploading of
documents?
1. Some option to view, download and delete an uploaded diagram should be provided.
2. Saving: No. Uploading: No if deleting the uploaded files is allowed.
Technique to do
the save
efficiently,
effectively and
satisfactorily
1. Do you support or anticipate the
saving pattern on the portal i.e.
having a temporary save option
and then a permanent save
option?
2. In case you support, what did you
like? (Advantages of current
pattern)
3. In case you anticipate, what is the
reason you did not like it?
(Disadvantages of the
system currently in action)
1. Most of the students were in support.
2. Good as students can work, log out and again continue back when the log in once again.
3. Redirection to start of the single scrollable page.
Preferred
navigation pattern
1. Would you prefer separate pages
for each question or a single
scrollable page ?
2. How do you think, this might affect
the ease a user has while
checking the submission?
3. Which of the two you feel help
final check become an easier
1. Most of them preferred having separate for writing but single for checking.
2. Yes.
3. Single scrollable page got the

task? majority.
Suggestions to
make checking
more user
friendly
1. How can checking the final
submission be made more user
friendly (apart from changing the
navigation pattern in case you feel
it can help)?
1. Wider text box that supports rich text formatting on a single scrollable page would make the final checking a lot easier.
Grading and
feedback
1. Modality: What kind of feedback to
you prefer:
in person or online?
2. Content: Did the feedback
provided by the TAs on your
submission help you some way?
3. Did you go through it carefully and
try to work upon it?
4. What paper distribution scheme
do you find better: the traditional
paper distribution approach and
the online feedback?
1. Online followed by some in person sessions.
2. Mixed
3. Mixed
4. Mixed Here mixed implies to 50% students in favour and the other half in opposition to the proposed argument.
Any changes noticed in the portal
1. Do you notice any change in the portal during Mid 2, from Mid 1:
a) In functionality? b) In usability? 2. Any other changes?
1. No. Not much, apart from an exhaustive instruction set provided in second mid semester.
2. No.
Table 2: Questionnaire of first round of experiment with each question corresponding to
any particular domain along with the inference drawn on the basis of the student
reaction.
Questionnaire was also put up for the Teaching Assistants (TA). This is presented below:
TA Questionnaire:
Domain Questions Inference
Ease of adding
the questions to
the portal
1. How do you find the portal in
terms of the ease it offers you to
add the questions?
2. Any more suggestions?
1. Yes it is pretty easy to use.
2. No.

Major differences
between paper
based and online
grading
1. Which one do you prefer?
2. What advantages you see with
that over the other?
3. Any challenges that you faced
with these?
4. How do you think these
challenges can be overcome?
5. Any other suggestions to improve
the current online grading system?
1. Online pattern.
2. Time efficient, 24X7
accessibility, each
for search of
keywords, checking
against plagiarism.
3. The portal should
provide an option to
interact with
students.
4. Support interaction.
5. No.
Communication
with students for
feedback
1. Do you find it unnecessary to
provide feedback on the portal?
2. Did it help students?
3. Do you prefer online modality or
paper based approach to interact
and solve doubts?
1. No. Find it necessary.
2. Yes. Very much. Reduced number of mails.
3. Online as it reduces time taken.
Table 3: Questionnaire of first round of experiment with each question corresponding to
any particular domain along with the inference drawn on the basis of the Teaching
Assistants’ reaction.
Based on the inferences drawn, we came through to the following experiment design.
Experiment Design:
A design is used to structure the research, to show how all of the major parts of the research
project -- the samples or groups, measures, treatments or programs, and methods of
assignment -- work together to try to address the central research questions. So, in order to
strengthen the internal validity, we need to determine whether some program or treatment
causes some outcome or outcomes to occur. Essentially, you want to assess the proposition:
If X, then Y
However, this is NOT enough. We need to be sure that the cause which affects the outcome is
the ONLY one and that external factors are subdued. So, we need to tackle the following
proposition as well:
If not X, then not Y

Objective:
To identify the factors affecting the below par performance on a web-based platform and
catering the platform so as to make it exhaustively sound.
Subjects:
This experiment was conducted on 25 subjects which were from the set of students mentioned
above.
Theory:
Diagram 1 : Distribution of students into two groups.
The usability issues involved in the portal are more or less unmasked during the 1st round of
interviews. After a brainstorming session, we boiled down to the features of the portal which are
most frequently loathed.
Before the commencement of the experiment, we have tried to revamp the portal by making
amends to these issues.
So, to address these, we divide the subjects into two groups – Group A and Group B, selected
randomly. The groups are categorised into:
1. Control group: A group of subjects or conditions that is matched as closely as possible
with an experimental group, but is not exposed to any experimental treatment.
2. Treatment group : This group is exposed to all manipulations and experimental
treatment.
So, we follow an AB-BA experimental design where
1. In one task, one group is made treatment group and the other is made control group.
2. In second task, the roles are swapped.
Now, following this AB-BA design, we assign them two tasks as follows.
Group A Group B
Exercise 1 Treatment Control
Exercise 2 Control Treatment
Table 4: AB-BA Experiment Design Format

We expose Group A to be the treatment group and Group B as the control group in task 1 and
then flip their roles so as to adhere to the basic propositions of experiment design.
Independent Variables:
In experimentation, independent variables are the variables that are input to the control system.
These are the variables which are regulated during the course of the experiment and which
manoeuvre the entire course of the experiment. The set of independent variables for this
experiment have been identified as follows:
1. Use of software - We provide access to software tools to one group and not to the other.
2. Rough sheets - One group is provided rough sheets while the other is not.
3. Textual/diagram space - the space for writing text is limited in a web-based platform
which is not in a paper based examination.
4. Navigation pattern (the presentation/alignment of the web page) - one can either see all
the questions in one page or could have links to each question.
The survey response (along with the interview response) projected that majority of the
candidates were compatible with software use for drawing diagrams, however there wasn’t a
noticeable difference between the response of the other candidates who were NOT compatible
with the same.
The response for self-sufficiency was self explanatory where the system didn’t prove its utility.
Hence, for the project, we selected
1. use of software and
2. rough sheets
to be our independent variables.
Response variables (Dependent variables):
Now, during the experiment the response variables (dependent variables) are the variables
which are measured against a particular control variable. The set of response variables are
enumerated as:
1. Technical ease of using software - This deals with how easy it was to use software tools.
It was mainly to be determined either by the time devoted by candidates,
comprehensibility of the software tool, consistency of the software tool etc.
2. Self-sufficiency (in terms of # rough sheets) - Here we tried to monitor whether the web
based system was self-sufficient or required external resources.
3. Legibility learn-ability - It was also important to measure if the system was
comprehensible to the students, whether they could make out what to do or not.
4. Navigation design - check whether candidates are comfortable using different hyperlinks
(what are the differences) for each question against a single page which displays all the
questions in one go.
5. Feedback system - when candidates asked to upload documents or diagrams, then the
system is expected to intimate of the successful upload and show them the uploaded
document. Students have faced problems as to whether they have uploaded the right

document or not. Again, since there exists a time frame in which the exam needs to be
completed, the system is expected to intimate the students to check and save their work
when remaining time reaches a certain minimum threshold.
6. Editing and rechecking - the comparative ease with which students find it easy to edit
and check their answers.
Out of the above dependent variables, we have picked up
1. technical ease of using software tools
2. self sufficiency
to be our response variables.
Experiment:
In the experiment, Group A and Group B were given 2 exercises each, namely exercise 1 and
exercise 2. The exercises contained 3 questions in all - 2 theoretical question and 1 diagram
based question. The survey and the interview had revealed that the candidates did not face any
problem attempting theoretical questions online. Hence, we varied the modality only for the
diagram based questions.
During the experiment, we tried to deploy our independent variables in the following manner:
1. Use of software:
Treatment group : The group which was provided with software tools for drawing
diagrams.
Control group : The group which was denied access to software tools and
made to draw on paper.
2. Rough sheets:
Treatment group : The group which was provided with rough sheets for use.
Control group : The group which was not provided with rough sheets for use.
Following the experiment, we have decided to go for a second round of interviews which will
mostly be a think aloud format for the subjects wherein they would be let to talk about their
experience with the portal (revamped) and other issues if any.
Results:
The resulting overall scores of the groups in their respective categories are:

Graph 5: The scores of the students in group A and group B under both the
circumstances namely control condition and treatment condition.
Self sufficiency:
During the course of experiment, we provided the treatment group with rough sheets. Since the
control groups were not provided with rough sheets, we need to examine their performance
during the exercises.
Group A Group B
Control exercise 0 0
Table 5 : Table showing the demand of rough sheets by groups when they were behaving
as Control groups.
Ease of software use:
Here we were able to classify the examinees into two categories:
1. The people who were reluctant to go for software based diagrams. : 10
2. The people who readily used software tools to achieve the goal. : 15
*Note that the above results are calculated only for the performance of groups when they were
attempting the tests as Treatment groups because, in Control groups there was no software
tools provided.

The access to software tools was provided in the following manner:
Task Group allowed to use software tools
Exercise 1 Group A
Exercise 2 Group B
Table 6: Access to software tools for the groups during exercises.
Based on this distribution, we found out that there were certain candidates in each group who
were quite willing to use software tools to draw diagrams, whereas there were a few who were
reluctant to use them. So, we tried to find this ratio of candidates who were willing to use
software and candidates who were not.
Graph 6: Willingness vs reluctance of the students to use software tools during
exercise 1 in Group A.

Graph 7: Willingness vs reluctance of the students to use software tools during
exercise 2 in Group B.
The above plots (Graph 6 and Graph 7) highlight the variations between group A and group B
as observed on the basis of their inclination towards the usage of the modality for drawing
diagrams. However, to avoid confounding, second round of interviews were conducted with the
students. These interviews were think aloud based where the student was allowed to speak his
mind.
Conlcusions:
The conclusions are drawn based on the experimental data and the second round of interviews
with the students. The features studied i.e.
1. Ease of software use
2. Self sufficiency
fall into the category of Flexibility and efficiency of use as a part of the Neilson’s heuristics.
Self sufficiency
During the course of the experiment, we found that there was no demand of extra resources; in
the sense that groups which were made to work online and not provided with any rough sheets
did not face any problems. Every group while working online, when were made to draw using
software also did not demand any sheets thereby proving the self sufficiency of the system.
Conclusion:
Rough sheets are not an issue for to be considered in such exams.

Ease of use of software tools
Upon the second round of interviews, we tried to fathom the cause of willingness and reluctance
to use software tools for drawing diagrams.
The major cause of willingness was:
Ease of editing the diagrams - the candidates found it easy to edit diagrams to inculcate
any change. This was not feasible with the paper-pen methodology.
The cause of reluctance was found to be mainly due to the following aspects:
1. Lack of motivation - The temperament of the students cited the fact that they were not
willing to put in the efforts needed to draw diagrams using software tools. They were
willing to do it on paper instead. Some even agreed to leave the question itself, being
aware of the fact that it was a part of an examination which would be graded.
2. Lacks of acquaintance with any available software tool - The students were given the
freedom to use any software tool for the purpose of drawing diagrams. Thus, it was
expected that the students could use at least one software tool for the same. However,
they could not prove their proficiency in using any of the software tools for drawing
diagrams.
An important resource to strengthen these aspects is that although the candidates were
mostly affirmative about the learnability, yet they found software tools to be a source of
impediment to their performance.
This implies that the students were in favor of the portal being learnable, however not
usable (in terms of usage of software tools).
Conclusion:
As the candidates were given the freedom to choose any software tool that they preferred, the
portal does not lack the usability aspect when it comes to the use of software tools.
Guidelines
We came up with the following set of guidelines that need to be taken care of while coming up
with an online examination (of Software Engineering in specific).
1. One may avoid the use of rough sheets when carrying out an online based curriculum.
2. Students are expected to be proficient in using at least one software tool so as to be
able to draw diagrams online.
Discussion
The above experiment has been carried with 25 students, who undertook the Software
Engineering course at IIIT Hyderabad. Following this, there were suggestions from the students
where they proposed the use of sheets for the diagram based questions. The solutions are to be
photographed using a camera and the images would to be uploaded. This suggestion has been
given consent, which would be deployed during their end semester examinations.
There could be various other solutions to this problem of modality compatibility. However, what
we think the major issue with such a transition is the alien nature of the online curriculum which
needs time and effort to get acclimatized with. Perhaps, a study on such a topic, however, on a
different subject could further elicit the perception of students regarding the online curriculum.
This could help in designing a set of Global guidelines that can be implemented with an online
platform.
References:
1. Paper-based versus computer-based assessment: key factors associated with the test mode effect., British Journal of Educational Technology.
2. Comparison of Traditional and Web-Based Course Evaluation Processes in a Required, Team-Taught Pharmacotherapy Course., Jennifer B. Kasiar, Sara L. Schroeder and Sheldon G. Holstad.
3. Journal of the American College of Surgeons, W Residents' Knowledge of Health Care Business.