Embed Size (px)
Citation preview
DESIGNING, OPTIMIZING, AND SUSTAINING HETEROGENEOUS CHIP
MULTIPROCESSORS TO SYSTEMATICALLY EXPLOIT DARK SILICON
by
Jason M. Allred
A thesis submitted in partial fulfillmentof the requirements for the degree
of
MASTER OF SCIENCE
in
Computer Engineering
Approved:
Dr. Sanghamitra Roy Dr. Koushik ChakrabortyMajor Professor Committee Member
Dr. Chris Winstead Dr. Mark R. McLellanCommittee Member Vice President for Research and
Dean of the School of Graduate Studies
UTAH STATE UNIVERSITYLogan, Utah
2013
ii
Copyright c© Jason M. Allred 2013
All Rights Reserved
iii
Abstract
Designing, Optimizing, and Sustaining Heterogeneous Chip Multiprocessors to
Systematically Exploit Dark Silicon
by
Jason M. Allred, Master of Science
Utah State University, 2013
Major Professor: Dr. Sanghamitra RoyDepartment: Electrical and Computer Engineering
Stalled supply voltage scaling in continued transistor miniaturization has resulted in
the emergence of dark silicon—the portion of a chip that must remain inactive due to power
budget constraints. For Chip Multiprocessors (CMPs), this means that only a portion of on-
chip cores may actively execute at any given time. While dark silicon threatens to degrade
multicore scaling performance benefits, heterogeneous CMPs are poised to significantly
improve energy efficiency, and thus performance, by exploiting growing levels of dark silicon.
This work provides systematic methods to design, optimize, and sustain Dark Silicon-
Aware (DSA) multicore systems to exploit growing dark silicon levels. For simple heteroge-
neous designs, DSA systems can be optimized to potentially provide 11–54% improvement
in energy efficiency. More complex heterogeneous designs can be optimized to provide
5.7–5.8x potential energy efficiency improvement. Differentially-reliable DSA systems can
be sustained in spite of aging to provide 14.4–16.3% lifetime energy efficiency benefits,
and even originally homogeneous systems can manipulate aging with dark silicon to create
differential reliability and sustain a 26.1–31.0% improvement in energy efficiency.
(88 pages)
iv
Public Abstract
Designing, Optimizing, and Sustaining Heterogeneous Chip Multiprocessors to
Systematically Exploit Dark Silicon
by
Jason M. Allred, Master of Science
Utah State University, 2013
Major Professor: Dr. Sanghamitra RoyDepartment: Electrical and Computer Engineering
Over the past several decades, microprocessor chip manufacturers have been able to
continuously shrink the size of internal components for improvements in processing speed,
computational ability, and power efficiency. Recently, however, several factors have begun
to cause an increase in power and thermal density. This increase is expected to continue,
unfortunately resulting in dark silicon—a term used to describe the portion of a chip that
must remain inactive because of power and thermal limitations. This work presents several
methods that allow the chip to take advantage of dark silicon to improve its power efficiency
and performance.
v
To God, family, and country
vi
Acknowledgments
I am grateful for the help and guidance provided by my advisor, Dr. Sanghamitra
Roy. She and Dr. Koushik Chakraborty have spent many hours over the past two years
discussing, reviewing, and improving this work. They have been an example of dedication
to me. I am also grateful for the great work that Dr. Chris Winstead has done as a member
of my thesis committee.
In addition, I thank our Department Head, Professor Todd Moon, and our Graduate
Student Advisor, Ms. Mary Lee Anderson, for their support and guidance throughout the
thesis review process. Trent Johnson has also been a great help with his work as Systems
Administrator, maintaining the computing environments that I utilized for my simulations.
Finally, I acknowledge the past support I received from the faculty of the Computer
Science and Electrical Engineering Department at Brigham Young University–Idaho, where
I received my B.S. in Computer Engineering. I specifically thank my advisor, Brother Ron
Jones, and the Department Head, Brother Eric Karl, who helped me prepare for my grad-
uate studies.
Jason M. Allred
vii
Contents
Page
Abstract . . . . . . . . . . . . . . . . . . . . . . . . . . . . . . . . . . . . . . . . . . . . . . . . . . . . . . . iii
Public Abstract . . . . . . . . . . . . . . . . . . . . . . . . . . . . . . . . . . . . . . . . . . . . . . . . . iv
Acknowledgments . . . . . . . . . . . . . . . . . . . . . . . . . . . . . . . . . . . . . . . . . . . . . . . vi
List of Tables . . . . . . . . . . . . . . . . . . . . . . . . . . . . . . . . . . . . . . . . . . . . . . . . . . . x
List of Figures . . . . . . . . . . . . . . . . . . . . . . . . . . . . . . . . . . . . . . . . . . . . . . . . . . xi
Acronyms . . . . . . . . . . . . . . . . . . . . . . . . . . . . . . . . . . . . . . . . . . . . . . . . . . . . . . xiii
1 Introduction . . . . . . . . . . . . . . . . . . . . . . . . . . . . . . . . . . . . . . . . . . . . . . . . . 11.1 What Is Dark Silicon? . . . . . . . . . . . . . . . . . . . . . . . . . . . . . . 11.2 How Can Dark Silicon Be Exploited? . . . . . . . . . . . . . . . . . . . . . . 21.3 Contributions . . . . . . . . . . . . . . . . . . . . . . . . . . . . . . . . . . . 31.4 Thesis Overview . . . . . . . . . . . . . . . . . . . . . . . . . . . . . . . . . 4
2 Background and Related Works . . . . . . . . . . . . . . . . . . . . . . . . . . . . . . . . . 52.1 The Emergence of Dark Silicon . . . . . . . . . . . . . . . . . . . . . . . . . 5
2.1.1 The Utilization Wall . . . . . . . . . . . . . . . . . . . . . . . . . . . 52.1.2 Extending Pareto Frontiers . . . . . . . . . . . . . . . . . . . . . . . 52.1.3 Emerging Empirical Evidence in Industry . . . . . . . . . . . . . . . 62.1.4 Addressing a Refutation of Dark Silicon . . . . . . . . . . . . . . . . 6
2.2 Related Works on Exploiting Dark Silicon . . . . . . . . . . . . . . . . . . . 72.2.1 Hardware Accelerators in Servers . . . . . . . . . . . . . . . . . . . . 72.2.2 Coprocessor Dominated Architectures . . . . . . . . . . . . . . . . . 72.2.3 GreenDroid . . . . . . . . . . . . . . . . . . . . . . . . . . . . . . . . 82.2.4 QsCores . . . . . . . . . . . . . . . . . . . . . . . . . . . . . . . . . . 8
3 Designing HtCMPs to Exploit Dark Silicon with Specialization . . . . . . . 93.1 The Effect of Dark Silicon on Heterogeneous Chip Multiprocessors . . . . . 9
3.1.1 Projections using Scaling Theory . . . . . . . . . . . . . . . . . . . . 93.1.2 Translating a Power Density Increase into Dark Silicon . . . . . . . . 11
3.2 The Magnified Benefit of Specialization with Dark Silicon . . . . . . . . . . 113.2.1 Improved Hardware-to-Software Mapping . . . . . . . . . . . . . . . 123.2.2 The Penalty of Mismatched Mapping . . . . . . . . . . . . . . . . . . 123.2.3 Decreasing Penalties with Growing Dark Silicon . . . . . . . . . . . 13
3.3 Proposed Dark Silicon Aware Designs . . . . . . . . . . . . . . . . . . . . . 133.4 DSA Systems with Heterogeneous VF Domains (Type-I) . . . . . . . . . . . 13
3.4.1 Temporally Coarse-Grained DVFS Scaling . . . . . . . . . . . . . . . 15
viii
3.4.2 Topologically Homogeneous Power-Performance Heterogeneous Systems 153.4.3 Specifics of Type-I DSA Design . . . . . . . . . . . . . . . . . . . . . 16
3.5 DSA Systems with Heterogeneous Core Microarchitectures (Type-II) . . . . 173.5.1 FabScalar . . . . . . . . . . . . . . . . . . . . . . . . . . . . . . . . . 173.5.2 Conservation Cores . . . . . . . . . . . . . . . . . . . . . . . . . . . . 183.5.3 Specifics of Type-II DSA Design . . . . . . . . . . . . . . . . . . . . 19
3.6 DSA Systems with Voltage Upscaled Differential Reliability (Type-III) . . . 193.6.1 Differentially Reliable (DR) DSA Systems . . . . . . . . . . . . . . . 193.6.2 Specifics of Type-III DSA Design . . . . . . . . . . . . . . . . . . . . 22
3.7 DSA Systems with Instruction Replay Differential Reliability (Type-IV) . . 223.7.1 RAZOR: Instruction Replays . . . . . . . . . . . . . . . . . . . . . . 223.7.2 Specifics of Type-IV DSA Design . . . . . . . . . . . . . . . . . . . . 23
3.8 Implementing DSA Designs . . . . . . . . . . . . . . . . . . . . . . . . . . . 24
4 Optimizing DSA Core Configurations . . . . . . . . . . . . . . . . . . . . . . . . . . . . . 254.1 Case Study: The Importance of Designing for Specific Dark Silicon Levels . 25
4.1.1 Methodology . . . . . . . . . . . . . . . . . . . . . . . . . . . . . . . 254.1.2 Results . . . . . . . . . . . . . . . . . . . . . . . . . . . . . . . . . . 26
4.2 The Range of Optimality of a Specialized Core . . . . . . . . . . . . . . . . 274.3 Specialization Versus Utilization . . . . . . . . . . . . . . . . . . . . . . . . 28
4.3.1 Dark Silicon Utilization (UDS) . . . . . . . . . . . . . . . . . . . . . 284.3.2 Core-level Efficiency (Ecores) . . . . . . . . . . . . . . . . . . . . . . 29
4.4 Design Optimization . . . . . . . . . . . . . . . . . . . . . . . . . . . . . . . 314.4.1 Defining the Solution Space . . . . . . . . . . . . . . . . . . . . . . . 324.4.2 A Simulated Annealing Approach . . . . . . . . . . . . . . . . . . . . 32
4.5 Optimization Analysis . . . . . . . . . . . . . . . . . . . . . . . . . . . . . . 33
5 Sustaining the Energy Efficiency Benefits of Dark Silicon . . . . . . . . . . . . 345.1 Case Study: The Importance of Maintaining the Heterogeneity Profile . . . 34
5.1.1 Case Study Overview . . . . . . . . . . . . . . . . . . . . . . . . . . 345.1.2 Methodology . . . . . . . . . . . . . . . . . . . . . . . . . . . . . . . 355.1.3 Results . . . . . . . . . . . . . . . . . . . . . . . . . . . . . . . . . . 365.1.4 The Sustainability Challenge . . . . . . . . . . . . . . . . . . . . . . 36
5.2 A Sustainability Control System (SCS) . . . . . . . . . . . . . . . . . . . . . 385.2.1 Design Overview . . . . . . . . . . . . . . . . . . . . . . . . . . . . . 395.2.2 The Aging Controller . . . . . . . . . . . . . . . . . . . . . . . . . . 395.2.3 The WAC Controller . . . . . . . . . . . . . . . . . . . . . . . . . . . 405.2.4 The Reliability Predictor . . . . . . . . . . . . . . . . . . . . . . . . 41
5.3 The Thread-to-Core Mapper (TCM) . . . . . . . . . . . . . . . . . . . . . . 415.3.1 The Sustainability Mapping (SM) Objective . . . . . . . . . . . . . . 415.3.2 The Energy Efficiency Mapping (EEM) Objective . . . . . . . . . . 42
5.4 Resolving Mapping Objective Conflicts . . . . . . . . . . . . . . . . . . . . . 425.4.1 Sustainability-Oblivious (SO) Mapping . . . . . . . . . . . . . . . . 425.4.2 Sustainability-Controlled (SC) Mapping . . . . . . . . . . . . . . . . 425.4.3 Sustainability-Aware (SA) Mapping . . . . . . . . . . . . . . . . . . 42
5.5 Sustainability Analysis . . . . . . . . . . . . . . . . . . . . . . . . . . . . . . 44
ix
6 Experimental Methodology . . . . . . . . . . . . . . . . . . . . . . . . . . . . . . . . . . . . . 456.1 The Design and Optimization of Type-I DSA Systems . . . . . . . . . . . . 45
6.1.1 Physical Design Flow . . . . . . . . . . . . . . . . . . . . . . . . . . 456.1.2 Architectural Simulation . . . . . . . . . . . . . . . . . . . . . . . . . 46
6.2 The Design and Optimization of Type-II DSA Systems . . . . . . . . . . . . 486.2.1 Physical Design Flow . . . . . . . . . . . . . . . . . . . . . . . . . . 486.2.2 Architectural Simulation . . . . . . . . . . . . . . . . . . . . . . . . . 48
6.3 The Design and Sustention of Type-III DSA Systems . . . . . . . . . . . . . 506.3.1 Modeling Differential Reliability . . . . . . . . . . . . . . . . . . . . 506.3.2 Hardware Aging Model . . . . . . . . . . . . . . . . . . . . . . . . . 506.3.3 Software Workload Characteristics . . . . . . . . . . . . . . . . . . . 516.3.4 Simulation Setup . . . . . . . . . . . . . . . . . . . . . . . . . . . . . 53
6.4 The Design and Sustention of Type-IV DSA Systems . . . . . . . . . . . . . 536.4.1 Modeling Differential Reliability . . . . . . . . . . . . . . . . . . . . 536.4.2 Software Workload Characteristics . . . . . . . . . . . . . . . . . . . 54
7 Experimental Results . . . . . . . . . . . . . . . . . . . . . . . . . . . . . . . . . . . . . . . . . . 557.1 Results of Optimizing Variable VF Domain (Type-I) DSA Systems . . . . . 55
7.1.1 Core Configurations . . . . . . . . . . . . . . . . . . . . . . . . . . . 557.1.2 Average Energy Efficiency . . . . . . . . . . . . . . . . . . . . . . . . 557.1.3 Energy Efficiency (80% Yield) . . . . . . . . . . . . . . . . . . . . . 567.1.4 Throughput . . . . . . . . . . . . . . . . . . . . . . . . . . . . . . . . 567.1.5 Reliability . . . . . . . . . . . . . . . . . . . . . . . . . . . . . . . . . 59
7.2 Results of Optimizing Variable Microarchitecture (Type-II) DSA Systems . 607.2.1 Core Configurations . . . . . . . . . . . . . . . . . . . . . . . . . . . 607.2.2 Energy Efficiency . . . . . . . . . . . . . . . . . . . . . . . . . . . . . 617.2.3 Throughput and Reliability . . . . . . . . . . . . . . . . . . . . . . . 61
7.3 Results of Sustaining Voltage Upscaling Differentially Reliable (Type-III)DSA Systems . . . . . . . . . . . . . . . . . . . . . . . . . . . . . . . . . . . 647.3.1 Hardware Configurations . . . . . . . . . . . . . . . . . . . . . . . . 647.3.2 Lifetime Average Energy Efficiency . . . . . . . . . . . . . . . . . . . 64
7.4 Results of Sustaining Instruction Replay Differentially Reliable (Type-IV)DSA Systems . . . . . . . . . . . . . . . . . . . . . . . . . . . . . . . . . . . 677.4.1 Hardware Configurations . . . . . . . . . . . . . . . . . . . . . . . . 677.4.2 Lifetime Average Energy Efficiency . . . . . . . . . . . . . . . . . . . 67
8 Conclusion . . . . . . . . . . . . . . . . . . . . . . . . . . . . . . . . . . . . . . . . . . . . . . . . . . . 70
References . . . . . . . . . . . . . . . . . . . . . . . . . . . . . . . . . . . . . . . . . . . . . . . . . . . . . . 71
x
List of Tables
Table Page
5.1 Case Study: Supply voltages of the clusters in each system. Lighter shadesrepresent higher reliability. . . . . . . . . . . . . . . . . . . . . . . . . . . . . 36
5.2 Mapping objectives and policies. . . . . . . . . . . . . . . . . . . . . . . . . 43
6.1 Average power consumption of Alpha 21264 core components, synthesized atvarious frequencies, normalized to the scheduler. . . . . . . . . . . . . . . . 46
6.2 Design parameters of the various FabScalar cores provided by Choudhary etal. . . . . . . . . . . . . . . . . . . . . . . . . . . . . . . . . . . . . . . . . . 49
7.1 Core configurations (Type-I): number of cores designed at each frequency. . 56
7.2 Normalized peak and average power for Type-I systems (lower is better). . 60
7.3 Standard deviation of core utilization for Type-I systems (lower is better). . 60
7.4 Core configurations (Type-II): number of cores of each architecture. . . . . 61
7.5 Normalized peak and average power for Type-II systems (lower is better). . 63
7.6 Standard deviation of core utilization for Type-II systems (lower is better). 63
7.7 Core configurations (Type-III): supply voltages of each core. . . . . . . . . . 65
7.8 Core configurations (Type-IV): assigned relative core target error rates. . . 67
xi
List of Figures
Figure Page
1.1 Projected relative core-level dark silicon levels for future technology nodesbased on current scaling projections. . . . . . . . . . . . . . . . . . . . . . . 2
3.1 Comparison of workloads without dark silicon. The efficiency of an HtCMPis jeopardized by certain workloads in the absence of dark silicon. . . . . . . 14
3.2 Comparison of workloads with 50% dark silicon. With dark silicon, the sys-tem can select active cores for optimal mapping. . . . . . . . . . . . . . . . 14
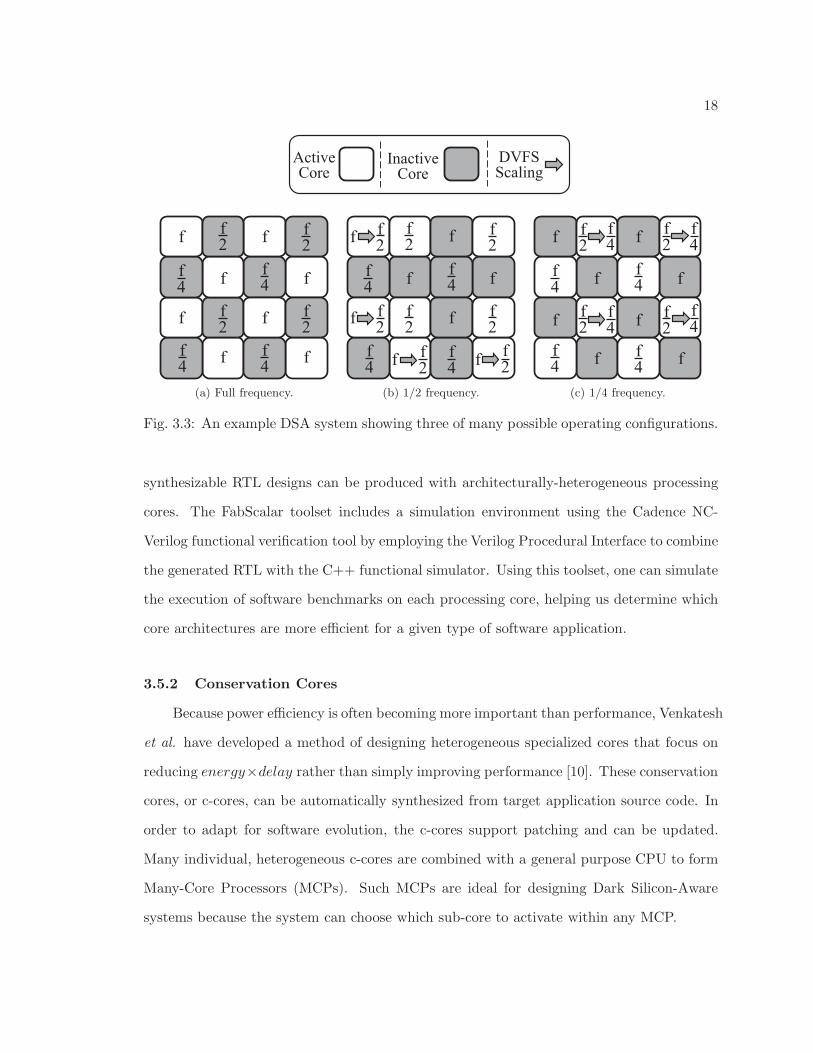
3.3 An example DSA system showing three of many possible operating configu-rations. . . . . . . . . . . . . . . . . . . . . . . . . . . . . . . . . . . . . . . 18
3.4 The rising cost of ensuring reliability (not to scale). . . . . . . . . . . . . . . 19
3.5 A multicore system with differential reliability. . . . . . . . . . . . . . . . . 20
4.1 Case Study: Energy efficiency change with dark silicon, normalized to theconventional multicore system (higher is better). . . . . . . . . . . . . . . . 27
4.2 Core RoOs for various target frequency levels. . . . . . . . . . . . . . . . . . 29
4.3 Splitting the RoO of a set of cores (50% dark silicon, two cores). . . . . . . 30
4.4 Decreasing the RoO of an over-utilized core (50% dark silicon, two cores). . 31
5.1 Case Study: Energy efficiency, normalized to the tape-out efficiency of thecorresponding homogeneous system. . . . . . . . . . . . . . . . . . . . . . . 37
5.2 Affect of aging on differential reliability (System A). . . . . . . . . . . . . . 38
5.3 Long-term sustainability of a DR-DSA system using a Sustainability ControlSystem (SCS) and a Thread-to-Core Mapper (TCM). . . . . . . . . . . . . 39
6.1 Aging models: Calculation of circuit propagation delay distributions. . . . . 52
6.2 Error modeling with statistical timing violation probability (µ = mean, σ =standard deviation). . . . . . . . . . . . . . . . . . . . . . . . . . . . . . . . 52
7.1 Average energy efficiency for the near term (Type-I). . . . . . . . . . . . . . 57
xii
7.2 Average energy efficiency for the long term (Type-I). . . . . . . . . . . . . . 57
7.3 80% yield energy efficiency for the near term (Type-I). . . . . . . . . . . . . 58
7.4 80% yield energy efficiency for the long term (Type-I). . . . . . . . . . . . . 58
7.5 Alternative throughput improvement with Mixed IPCs (Type-I). . . . . . . 59
7.6 Average energy efficiency (Type-II). . . . . . . . . . . . . . . . . . . . . . . 62
7.7 80% yield energy efficiency (Type-II). . . . . . . . . . . . . . . . . . . . . . 62
7.8 Alternative throughput improvement (Type-II). . . . . . . . . . . . . . . . . 63
7.9 Mapping policy comparison for Type-III systems at each dark silicon level(higher is better). . . . . . . . . . . . . . . . . . . . . . . . . . . . . . . . . . 66
7.10 Mapping policy comparison for Type-IV systems at each dark silicon level(higher is better). . . . . . . . . . . . . . . . . . . . . . . . . . . . . . . . . . 68
xiii
Acronyms
CMP chip multiprocessor
HmCMP homogeneous CMP
HtCMP heterogeneous CMP
DSA dark silicon-aware
RoO range of optimality
DSU dark silicon utilization-efficiency metric
Uds dark silicon utilization metric
Ecores core-level efficiency metric
DR differential reliability (noun)/differentially reliable (adjective)
DR-DSA system differentially-reliable dark silicon-aware system
SCS sustainability control system
TCM thread-to-core mapper
OS operating system
WAC workload acceptance capacity
SM sustainability mapping
EEM energy efficiency mapping
SO sustainability-oblivious
SC sustainability-controlled
SA sustainability-aware
CoDAs coprocessor dominated architectures
QsCores quasi-specific cores
VF voltage-frequency
THPH topologically homogeneous, power-performance heterogeneous
DVFS dynamic voltage-frequency scaling
CPU central processing unit
RTL register-transfer level
xiv
MCP many-core processor
ERSA error resilient system architecture
SRC super reliable core
RRC relaxed reliable core
ALU arithmetic logic unit
1
Chapter 1
Introduction
Microprocessor performance increases each technology generation as the result of con-
tinued transistor miniaturization. Over the past several years, such transistor scaling has
resulted in multicore microprocessors capable of executing several software threads simul-
taneously. However, scaling projections indicate that power density will increase exponen-
tially, substantially limiting the portion of on-chip cores that can simultaneously execute.
This inactive chip portion—referred to as dark silicon—threatens to degrade the ben-
efits that traditionally accompany transistor scaling. Intriguingly, this work shows that
heterogeneous microprocessors can actually exploit growing dark silicon levels by increasing
the availability of specialized, power efficient hardware, allowing the system to regain much
of the lost benefits.
1.1 What Is Dark Silicon?
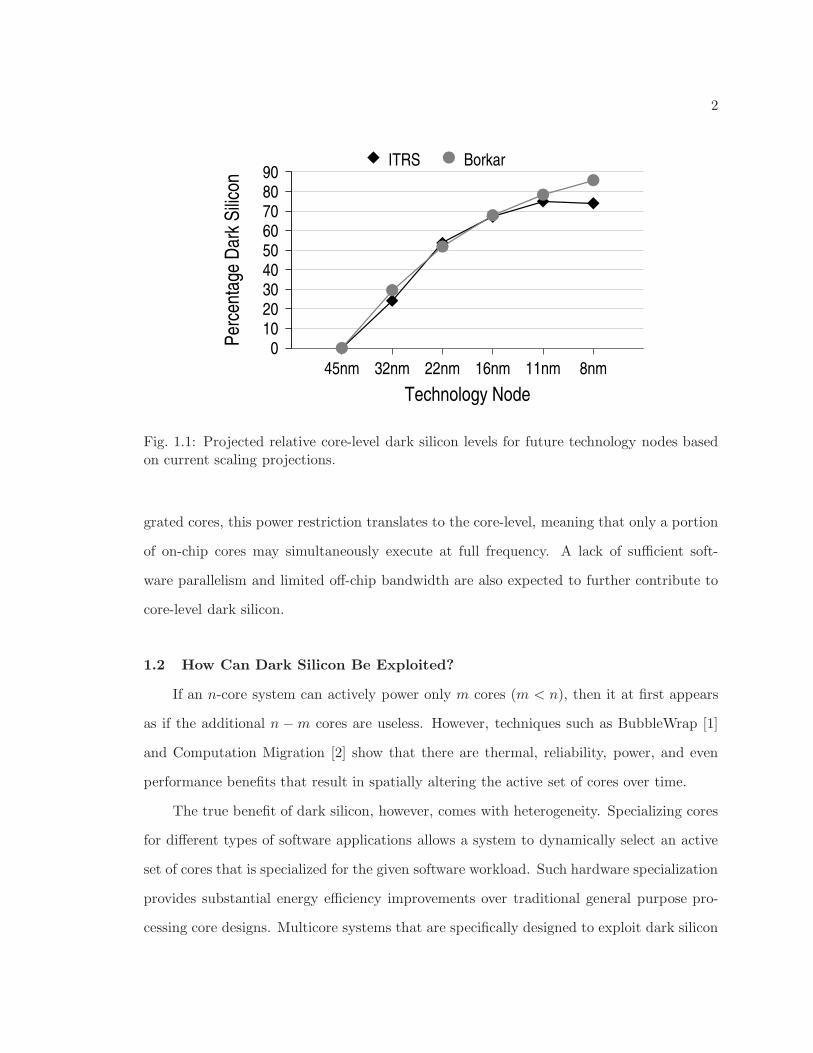
Dark silicon is the fraction of a chip that must be powered down. Traditionally, ideal
transistor scaling has resulted in fairly constant power density as the increase in transistor
count is balanced by improved energy efficiency. However, certain emerging trends exponen-
tially increase power density in integrated circuits, causing thermal-induced power budgets
to become increasingly more restrictive. These restrictive power budgets limit the number
of transistors that can simultaneously switch at full frequency. ITRS and Borkar scaling
projections imply that power-restricted dark silicon levels may reach 75-85% by 8nm, rel-
ative to 45nm levels. (See Fig. 1.1. These projections and their implications are further
discussed in Sec. 3.1.)
Currently, large areas within a single processing core already experience significantly
low switching rates. Therefore, for Chip Multiprocessors (CMPs) with many on-chip inte-
2
0102030405060708090
Technology Node
45nm 32nm 22nm 16nm 11nm 8nm
Per
cent
age
Dar
k S
ilico
n
ITRS Borkar
Fig. 1.1: Projected relative core-level dark silicon levels for future technology nodes basedon current scaling projections.
grated cores, this power restriction translates to the core-level, meaning that only a portion
of on-chip cores may simultaneously execute at full frequency. A lack of sufficient soft-
ware parallelism and limited off-chip bandwidth are also expected to further contribute to
core-level dark silicon.
1.2 How Can Dark Silicon Be Exploited?
If an n-core system can actively power only m cores (m < n), then it at first appears
as if the additional n −m cores are useless. However, techniques such as BubbleWrap [1]
and Computation Migration [2] show that there are thermal, reliability, power, and even
performance benefits that result in spatially altering the active set of cores over time.
The true benefit of dark silicon, however, comes with heterogeneity. Specializing cores
for different types of software applications allows a system to dynamically select an active
set of cores that is specialized for the given software workload. Such hardware specialization
provides substantial energy efficiency improvements over traditional general purpose pro-
cessing core designs. Multicore systems that are specifically designed to exploit dark silicon
3
with heterogeneity are referred to in this work as Dark Silicon-Aware (DSA) systems.
Since the research in this work began, a handful of other works have been published that
corroborate the idea of exploiting dark silicon with specialized hardware [3–6]. However,
very little research has been done on systems that actually employ this principle. This work
seeks not only to detail DSA system design, but also how such designs can be optimized
for specific levels of dark silicon and how the energy efficiency benefits of these systems can
be sustained throughout the lifetime of the chip. This three-fold approach of designing,
optimizing, and sustaining Dark Silicon-Aware systems provides an encompassing view of
how the potential of dark silicon exploitation can be realized.
1.3 Contributions
This work makes several specific contributions. It demonstrates the need for multicore
systems to be designed for specific levels of dark silicon and proposes a new metric for
measuring dark silicon exploitation. Using this metric, a stochastic optimization algorithm
is presented for efficient Dark Silicon-Aware multicore design. This work further analyzes
the difficulty of sustaining the energy efficiency benefits of low power, heterogeneous designs
in the face of long-term lifetime component aging. To solve this problem, a DSA feedback
control-based thread-to-core mapping framework is designed to control multicore aging.
Within this framework, three new mapping algorithms are delineated and considered.
These contributions are evaluated with four types of DSA multicore design techniques.
The corresponding experiments use cross-layer methodologies that employ physical design
flow consisting of SPICE-level process variation and aging analysis, circuit-level statistical
timing analysis, and synthesized component-level power consumption measurements. These
are coupled with full system architectural simulations to accurately provide the experimental
results that validate this work.
Portions of this work have been previously published or have been accepted for publi-
cation in an upcoming conference or journal. These works are as follows:
4
• Published: Designing for Dark Silicon: A Methodological Perspective on Energy Ef-
ficient Systems. The Proceedings of the 2012 ACM International Symposium of Low
Power Electronic Devices [7],
• Accepted for publication: Dark Silicon Aware Multicore Systems: Employing De-
sign Automation with Architectural Insight. IEEE Transactions on Very Large Scale
Integration (VLSI) Systems, 2013 [8],
• Accepted for publication: Long Term Sustainability of Differentially Reliable Systems
in the Dark Silicon Era. The Proceedings of the 2013 IEEE International Conference
on Computer Design [9].
1.4 Thesis Overview
Chapter 2 reviews necessary background information and related recent research. The
subsequent three chapters present the main body of thesis research which is organized into
the design (Chapter 3), optimization (Chapter 4), and sustention (Chapter 5) of Dark
Silicon-Aware multicore systems. Four types of DSA systems are analyzed. Chapter 6
details the methodology of these four analytical experiments, and Chapter 7 provides the
experimental results of each. Finally, Chapter 8 concludes.
5
Chapter 2
Background and Related Works
This chapter provides necessary background information on the emergence of dark
silicon, as well as a review of related works.
2.1 The Emergence of Dark Silicon
The growing threat of dark silicon has been researched by recent studies that provide
evidence of dark silicon from varying viewpoints.
2.1.1 The Utilization Wall
Several researchers have coined the term utilization wall to describe the technology-
imposed limitation of transistor switching. Goulding-Hotta et al. provide an in depth
discussion of the causes and magnitude of this utilization wall [4]. Their experiments validate
the scaling theory calculations that the active portion of a chip drops exponentially by 2×
each generation.
Venkatesh et al. also discuss the utilization wall and claim that the inability to dissipate
sufficient heat limits the percentage of full-switching transistors to 3.5% at 32nm [10]. This
number is so low because it evaluates dark silicon at the transistor-level, not the core-level,
and a large portion of current processing cores already remains inactive. Throughout this
work, the term dark silicon implies the core-level interpretation, indicating the portion of
on-chip cores that must remain inactive.
2.1.2 Extending Pareto Frontiers
Substantial research on the emergence of dark silicon was recently done by Esmaeilzadeh
et al. [11]. Their work develops complex comprehensive models that combine empirical data,
6
scaling projections, and application behavior to extend Pareto frontiers. These Pareto fron-
tiers represent the empirical limit of the tradeoff curve between power, performance, and
area. Their models indicate the optimal number of operating cores over the next several
technology generations. The results show a significant gap between this number and the
actual number of expected cores resulting from multicore scaling. This gap represents a
core-level dark silicon portion of 21% at 22nm and more than 50% at 8nm. Another impor-
tant finding in their work is that the lack of sufficient software parallelism can also add to
dark silicon as future commodity microprocessors may never need thousands of active cores
for standard software workloads.
2.1.3 Emerging Empirical Evidence in Industry
There is also growing evidence of the affects of dark silicon in current commodity
microprocessors [4, 10]. Dark silicon is cleverly being hid by industry using three design
techniques.
• Since 2005, the frequency curve has begun to flatten. While transistor switching
speeds continue to increase exponentially, processor frequencies have not. Dark silicon
is being thus hid by extending dim silicon (under-clocked cores).
• Intel and AMD are promoting new turbo boost features. This allows maximum oper-
ating frequency only if other cores are inactive.
• More chip area is being dedicated to cache and other low-switching components.
2.1.4 Addressing a Refutation of Dark Silicon
One recent study claims that dark silicon is sub-optimal and avoidable [12]. In it,
researchers correctly deduce that overall chip throughput is improved by operating all cores
at a sub-nominal frequency rather that operating only a portion of cores at full frequency.
However, this approach is most desirable in server chips that have an large number of
simultaneous jobs to perform, trading response time for throughput.
7
Contrarily, commodity software workloads are often better served with improved single-
thread performance. Limited parallelism means that they receive little benefit in having
thousands of available cores. In addition, this approach only spreads out dark silicon as
dim silicon [13]. A system designed for dark silicon levels, such as those proposed in this
thesis, can always decrease the frequency of active cores to power on additional cores when
desired, achieving a similar benefit. Without dark silicon, however, the system degrades
single-thread performance and bypasses the potential benefit of heterogeneity.
2.2 Related Works on Exploiting Dark Silicon
If the CMP consists of a heterogeneous core composition, the system can exploit dark
silicon to adapt to specific software workloads and provide superior energy efficiency through
hardware specialization [14]. This section outlines several recent works that discuss or
employ this concept.
2.2.1 Hardware Accelerators in Servers
One of the first works to discuss the exploitation of dark silicon with specialization was
published by Hardavalles et al. [5]. In addition to power constraints, they mention limited
off-chip bandwidth as a significant cause of dark silicon in future server CMPs. Their
suggestion is to populate the die area of server CMPs with a larger number of diverse,
application-specific heterogeneous cores. These specialized CMPs achieve superior energy
efficiency by dynamically powering only a portion of on-chip cores at a time. The system
chooses a set of active cores that is specifically designed for the given workload.
2.2.2 Coprocessor Dominated Architectures
Taylor discusses several responses to dark silicon, one of which is specialized hard-
ware [13]. Specialized hardware is significantly more power efficient than general purpose
processing cores. In his work, Taylor discusses how dark silicon causes area to be an increas-
ingly cheaper resource as power becomes more expensive. Specialized hardware mitigates
this affect by trading area for energy efficiency.
8
As a specific example, Taylor mentions Coprocessor Dominated Architectures (CoDAs).
These architectures consist of general purpose processing cores that are paired with more
smaller, more efficient specialized cores. Depending on the software workload, execution
may shift between the general purpose core and the specialized cores for more increased
efficiency. An example CoDA is the GreenDroid, discussed next.
2.2.3 GreenDroid
The GreenDroid architecture is a state-of-the-art mobile multicore architecture de-
signed specifically to exploit dark silicon [4]. The GreenDroid architecture consisted of 16
non-identical tiles. Each tile has a general purpose CPU and various conservation-cores (see
Sec. 3.5.2).
The computation flow transfers between these specialized cores and the general purpose
CPU, meaning that only one core in the tile is active at once. This allows all of the cores on
a tile to share L1 cache. Their exploitation of dark silicon achieves up to 11× improvement
in energy efficiency. They have successfully emulated their design and are in the process of
prototyping a GreenDroid chip at 32nm.
2.2.4 QsCores
Venkatesh et al. recently proposed Quasi-specific Cores or QsCores as a method of
trading dark silicon for energy efficiency [15]. The QsCore design methodology is based
on the fact that similar code patterns exist between software applications. Similar code
patterns are mined to create smaller, more specialized QsCores that accompany a general
purpose CPU. Their design is very similar to the GreenDroid architecture and achieves
13.5× improvement in energy efficiency.
9
Chapter 3
Designing HtCMPs to Exploit Dark Silicon with
Specialization
Dark silicon—the portion of a chip that must remain powered down due to restrictive
power constraints—threatens to degrade the traditional benefits of transistor scaling. How-
ever, as shown, several recent studies have suggested that CMPs with specialized hardware
may be a natural response to emerging dark silicon levels because of their increased ability
to provide energy efficient computation.
Significant research is yet to be done on implementing this concept, especially at the
core level. This section explains how power efficient heterogeneous chip multiprocessors are
ideal candidates for creating Dark Silicon-Aware (DSA) multicore systems and presents the
details of four DSA designs that are utilized later in this work.
3.1 The Effect of Dark Silicon on Heterogeneous Chip Multiprocessors
In order to create a Dark Silicon-Aware system, it is first necessary to determine the
specific dark silicon constraint. Relative dark silicon levels can be projected by determining
the relative power density increase associated with scaling theory.
3.1.1 Projections using Scaling Theory
Technology scaling has been the major driver in producing faster chips in the past
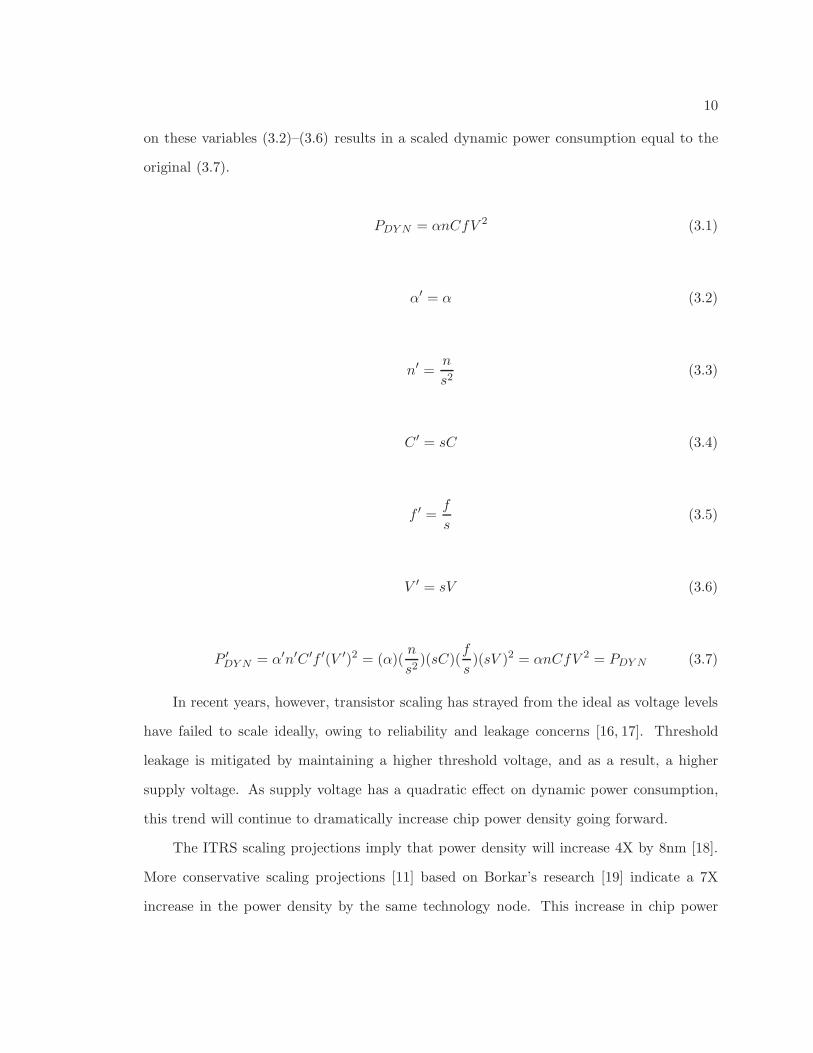
three decades. Ideal transistor scaling results in constant power density. Dynamic power
consumption (3.1) is proportional to the average switching activity (α), the total number
of transistors (n), the average gate load capacitance (C), the switching frequency (f), and
the square of the supply voltage (V ). For a constant chip area, these variables are scaled
by a scaling factor (s), which is traditionally idealized as 1√2≈ 0.7. The ideal scaling effect
10
on these variables (3.2)–(3.6) results in a scaled dynamic power consumption equal to the
original (3.7).
PDY N = αnCfV 2 (3.1)
α′ = α (3.2)
n′ =n
s2(3.3)
C ′ = sC (3.4)
f ′ =f
s(3.5)
V ′ = sV (3.6)
P ′DY N = α′n′C ′f ′(V ′)2 = (α)(
n
s2)(sC)(
f
s)(sV )2 = αnCfV 2 = PDY N (3.7)
In recent years, however, transistor scaling has strayed from the ideal as voltage levels
have failed to scale ideally, owing to reliability and leakage concerns [16, 17]. Threshold
leakage is mitigated by maintaining a higher threshold voltage, and as a result, a higher
supply voltage. As supply voltage has a quadratic effect on dynamic power consumption,
this trend will continue to dramatically increase chip power density going forward.
The ITRS scaling projections imply that power density will increase 4X by 8nm [18].
More conservative scaling projections [11] based on Borkar’s research [19] indicate a 7X
increase in the power density by the same technology node. This increase in chip power
11
density forces current and future designs to be power limited. Such limitation is the key
factor in creating dark silicon.
3.1.2 Translating a Power Density Increase into Dark Silicon
The percentage of dark silicon in a chip is projected to increase with every forthcoming
technology generation specifically because of these scaling issues. Insufficient progress in
affordable cooling capabilities limits microprocessor power budgets. Other power limiting
factors include finite energy storage in mobile devices and global efforts to reduce energy
consumption. With rising power density (powerarea
), the area allowed to consume power must
decrease to keep the chip within a fairly constant power budget.
Assuming such a relationship, scaling projections indicate that the percentage of dark
silicon may reach 75–85% by 8nm. This expected relative dark silicon increase based on
these scaling projections was previously shown in Fig. 1.1. For chip multiprocessors with
multiple integrated on-chip processing cores, the level of dark silicon directly correlates with
the fraction of on-chip cores that must remain inactive.
3.2 The Magnified Benefit of Specialization with Dark Silicon
A multicore system with dark silicon can be modeled as a set of active cores A and
a set of inactive cores I. A system with n total on-chip cores will have |A| = (1 − γ) × n
active cores and |I| = γ × n inactive cores, where γ is the portion of dark silicon. For any
given software workload, the system can choose at most any |A| out of n cores to execute
the workload, while the other |I| cores remain power-gated or in a low-power sleep mode.
The key to exploiting dark silicon is to view the inactive cores I as extra resources, any
of which can be swapped with a core from the active set. This alters the configuration of the
current operating mode. For homogeneous multicore systems, the efficiency of the system is
unaffected by the choice of which cores populate the active set A, except for spacial benefits
such as temperature dispersion. If all n cores are identical, then every possible active set
A is identical. However, heterogeneous multicore chips with specialized processing cores
12
provide a variety of possible active sets. This increases the flexibility of the system to map
software threads onto appropriately specialized hardware cores.
3.2.1 Improved Hardware-to-Software Mapping
The flexibility of choosing which cores to activate increases the ability of the system
to map the current set of software threads onto a more appropriate set of cores. Without
dark silicon, heterogeneous multicore designs are at a serious disadvantage. Depending on
the workload, a thread is more likely to be forced to execute on a processing core that
is suboptimal for that type of thread. These suboptimal software-to-hardware mappings
result in a penalty of a decrease in overall system energy efficiency.
This observation considers the scenario that every core is capable of executing any
thread, incurring efficiency penalties when mismatched mapping occurs. For systems in
which specialized cores may only execute a subset of all threads, there are similar efficiency
penalties as threads must wait for suitable cores to become available. However, any such
penalties are reduced and eventually eliminated as dark silicon levels increase. Without loss
of generality, the following simplified example illustrates this concept.
3.2.2 The Penalty of Mismatched Mapping
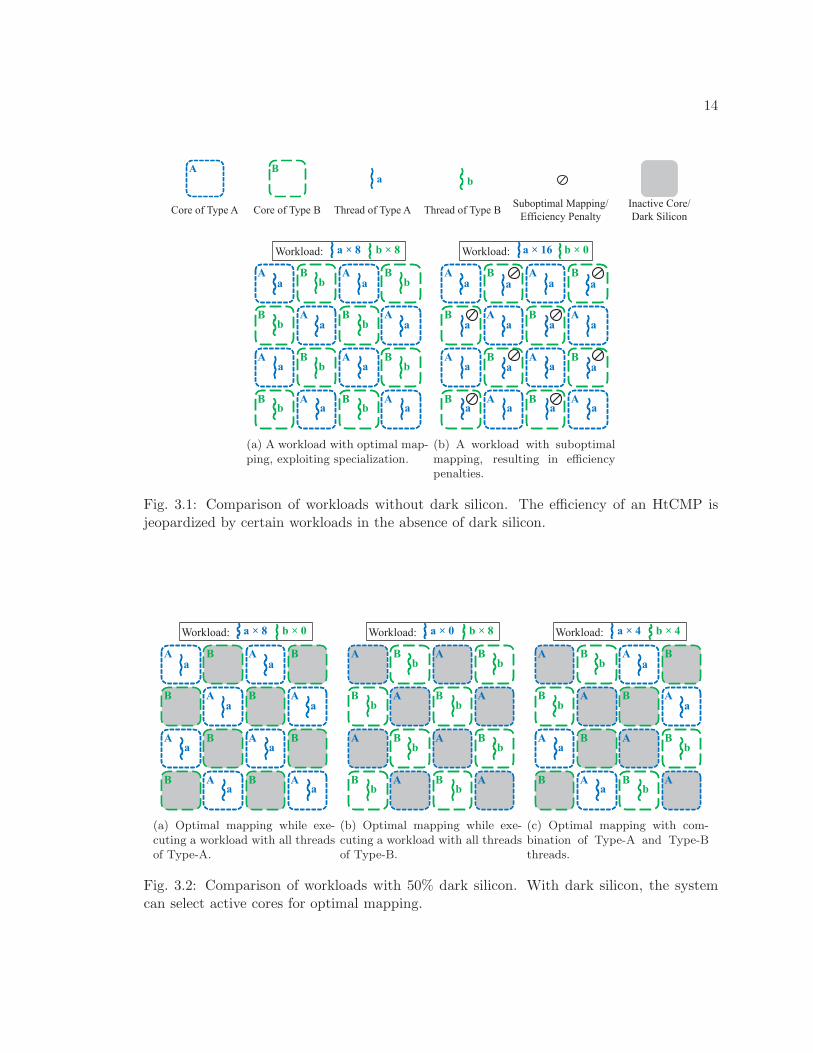
Consider this simplified example. Assume that the spectrum of software threads is
divided into two types, Thread Type-A and Thread Type-B, such that every thread is cate-
gorized into one of these two types according to one or more attributes (e.g. CPU intensive
versus memory intensive threads). Assume further that due to these attributes, each type of
thread is more efficiently executed on a certain corresponding type of specialized processing
core, Core Type-A and Core Type-B, each of which are respectively designed specifically for
one of these two types of threads. Now, consider a 16-core Heterogeneous Chip Multipro-
cessor (HtCMP) with 8 cores of Type-A and 8 cores of Type-B. This specialization provides
an increase in efficiency for workloads that mirror the hardware configuration (Fig. 3.1(a)).
Without dark silicon, however, such a heterogeneous CMP incurs efficiency penalties in
scenarios when there are not enough cores of a certain type to optimally execute the current
13
workload. For example, the OS may simultaneously schedule 16 threads of Type-A, forcing
half of these threads to be mapped to Type-B cores and suffer sub-optimal thread-to-core
mappings, executing less efficiently (Fig. 3.1(b)). Without dark silicon, the benefits of
specialization are reduced by the penalties of suboptimal thread-to-core mapping.
3.2.3 Decreasing Penalties with Growing Dark Silicon
Now consider the same example but with dark silicon. Assume that power budget
constraints limit the number of active cores to 8, i.e. 50% dark silicon. The 16-core HtCMP
with 8 cores of Type-A and 8 cores of Type-B will never incur these penalties. This is because
no matter what workload the OS schedules, the system will always be able to choose a set
of active cores such that each thread executes on its optimal choice of hardware. This is
true whether the OS schedules 8 threads of Type-A (Fig. 3.2(a)) or 8 threads of Type-B
(Fig. 3.2(b)) or any combination of the two (Fig. 3.2(c)).
As dark silicon increases, the number of suboptimal thread-to-core mappings decreases,
justifying higher degrees and a wider diversity of hardware specialization. This concept may
be generalized to any n-core heterogeneous CMP with m types of specialized processing
cores (1 < m ≤ n). Dark silicon increases the efficiency of a heterogeneous system and
justifies larger degrees of variation between cores.
3.3 Proposed Dark Silicon Aware Designs
In this work, four proposed types Dark Silicon-Aware (DSA) designs are analyzed
(Type-I, Type-II, Type-III, and Type-IV). These DSA systems vary in their mode of het-
erogeneity. Type-I and Type-II systems are designed with heterogeneous core-level energy
efficiency while Type-III and Type-IV systems are designed with heterogeneous computa-
tional reliability. The following four sections describe how these DSA systems are designed.
3.4 DSA Systems with Heterogeneous VF Domains (Type-I)
Processing cores are significantly more power efficient when operating in sub-nominal
Voltage-Frequency (VF) domains. As the frequency is scaled down, the supply voltage can
14
A B
a b
Core of Type A Core of Type B Thread of Type A Thread of Type B Suboptimal Mapping/
Efficiency Penalty
Inactive Core/
Dark Silicon
B
B
B
B
B
B
B
B
A
A
A
A
A
A
A
A
b b
b b
b b
b b
a a
a a
a a
a a
Workload: b × 8 a × 8
(a) A workload with optimal map-ping, exploiting specialization.
B
B
B
B
B
B
B
B
A
A
A
A
A
A
A
A
a a
a a
a a
a a
Workload: b × 0 a × 16
a a
a a
a a
a a
(b) A workload with suboptimalmapping, resulting in efficiencypenalties.
Fig. 3.1: Comparison of workloads without dark silicon. The efficiency of an HtCMP isjeopardized by certain workloads in the absence of dark silicon.
B
B
B
B
B
B
B
B
A
A
A
A
A
A
A
A
a a
a a
a a
a a
Workload: b × 0 a × 8
(a) Optimal mapping while exe-cuting a workload with all threadsof Type-A.
B
B
B
B
B
B
B
B
A
A
A
A
A
A
A
A
b b
b b
b b
b b
Workload: b × 8 a × 0
(b) Optimal mapping while exe-cuting a workload with all threadsof Type-B.
A
B
B
B
B
B
B
B
B
A
A
A
A
A
A
A
b
b
b
b
a
a
a
a
Workload: b × 4 a × 4
(c) Optimal mapping with com-bination of Type-A and Type-Bthreads.
Fig. 3.2: Comparison of workloads with 50% dark silicon. With dark silicon, the systemcan select active cores for optimal mapping.
15
also be decreased without sacrificing timing requirements. Dynamic power consumption
is linearly proportional to frequency and quadratically proportional to the supply voltage.
A lower operating frequency severely degrades the performance of CPU-intensive threads.
However, memory-intensive threads with lower IPCs do not experience as significant per-
formance degradation with lower operating frequencies. This diversity allows us to achieve
substantial energy efficiency improvements by allowing low-IPC and memory-bound threads
to operate in sub-nominal VF domains.
3.4.1 Temporally Coarse-Grained DVFS Scaling
Dynamic Voltage-Frequency Scaling (DVFS) adjusts the VF domain of on-chip pro-
cessing cores. Its dynamic nature allows it to adapt for current workload characteristics to
provide ideal energy efficiency. However, altering the VF domain of a core incurs power
and performance overheads. In addition, process variation results in some cores being more
efficient at certain VF domains than others [20]. Thus, temporally coarse-grained DVFS
scaling is a common approach to minimize the occurrence of these overhead costs. Rather
than adjusting the VF domain of a specific core, the thread can be migrated to a core that
already operates in the desired VF domain. This allows cores to remain in their current VF
domain for larger periods of time, acting as a heterogeneous system. However, dark silicon
is best exploited by true heterogeneity, such as the following design technique.
3.4.2 Topologically Homogeneous Power-Performance Heterogeneous Systems
The recently proposed Topologically Homogeneous Power-Performance Heterogeneous
(THPH) multicore system [21] improves on this concept. A THPH system is composed
of architecturally identical cores designed to be power-performance optimal for different
voltage-frequency (VF) domains. Such ground-up design approach has been shown to offer
better energy efficiency than the DVFS technique as lower frequency cores can use less leaky
device saving substantial static power, as well as reduce the gate sizes to save dynamic power.
The drawback of THPH design is that the low frequency cores are stuck at the lower
frequencies and cannot increase them further. This results in serious performance penal-
16
ties for workloads that consist entirely of CPU-intensive software threads. However, these
penalties are reduced with dark silicon, as discussed in Sec. 3.2, making the THPH system
design ideal for designing Dark Silicon-Aware multicore systems.
3.4.3 Specifics of Type-I DSA Design
Using a combination of temporally coarse-grained DVFS Scaling and THPH system de-
sign, a Dark Silicon-Aware (DSA) system can be designed with varying design-time voltage-
frequency domains. The CMP is divided into core clusters, designed from the ground up
to meet timing requirements within varying VF domains. Threads are mapped to the core
cluster that is most efficient for its characteristics.
When the ideal core cluster is unavailable, the thread must either be mapped to a core
cluster with a higher-than-ideal VF domain, consuming more energy than required even
though the VF domain is appropriately scaled down, or be mapped to a core cluster with a
lower-than-ideal VF domain, experiencing the increased execution delay resultant from the
lower operating frequency.
DVFS and Power Control
Type-I DSA systems employ the style of DVFS power control system presented by Wang
et al. [22] and Yan et al. [23]. These systems use feedback control theory to determine the
VF domains of individual cores based on their current performance and power consumption
levels. The goal of these control systems is to maximize chip-level performance while staying
withing chip-level power and thermal budgets.
An Example Type-I System
Figure 3.3 explains the operation of such a DSA multicore system. A 16-core multicore
system that must maintain a dark silicon level of 50% (i.e. at most 8 active cores at any
time) is shown as an example. The system has 8 cores designed to operate optimally at the
nominal frequency (f), 4 cores designed optimally at 50% of the nominal frequency (f2), and
17
4 cores designed at 25% of the nominal frequency (f4). This is in contrast to a conventional
system that has all 16 cores designed for the nominal frequency (f).
The 8 active threads are allowed to choose any 8 of the 16 cores to optimize energy
efficiency. Figure 3.3 shows three of the many possible scenarios: all threads can be exe-
cuted at the nominal frequency (Fig. 3.3(a)), at half frequency (Fig. 3.3(b)), or at quarter
frequency (Fig. 3.3(c)). If not enough of the lower-frequency cores are available, as in
scenarios 3.3(b) and 3.3(c), the higher performance cores can be DVFS scaled to the ap-
propriate level. However, the cores that are designed for sub-nominal frequencies provide
significant power benefits as compared to DVFS scaling on a high frequency core.
As shown in Sec. 3.2.3, the penalties of these sub-optimal mappings decrease as dark
silicon levels rise. In order to exploit dark silicon to its fullest, however, the max VF domains
of the core clusters must be optimally designed for the specific levels of dark silicon. Chapter
4 details this optimization process. The energy efficiency results of optimized Type-I DSA
systems are provided later in Sec. 7.1.
3.5 DSA Systems with Heterogeneous Core Microarchitectures (Type-II)
A larger benefit of specialization comes from variable circuit topology. Historically,
designing cores with varying microarchitectures has been a significant engineering challenge.
Further, CMPs have traditionally had sufficient power budgets to actively execute all on-chip
cores simultaneously, making a general-purpose homogeneous design more efficient across all
workload types. However, emerging techniques are simplifying the heterogeneous core design
process. These techniques, coupled with rising dark silicon levels, make heterogeneous core
microarchitectures both feasible and extremely desirable.
3.5.1 FabScalar
Choudhary et al. recently developed the FabScalar system design toolset which allows
one to quickly design and verify single-ISA CMPs consisting of heterogeneous processing
cores with varying microarchitectures [24]. These cores vary in characteristics such as
issue width, pipeline depth, and register file size. With the FabScalar toolset, dozens of
18
Active Core
Inactive Core
DVFS Scaling
f
f
f
f
f f
f f
f 4
f 4
f 4
f 4
f 2
f 2
f 2
f 2
(a) Full frequency.
f f 2
f 2
f 2
f 2
f 2
f f 2
f f 2
f f 2
f
f
f
f f 4
f 4
f 4
f 4
(b) 1/2 frequency.
f
f
f
f
f
f f
f
f 4
f 4
f 4
f 4
f 4
f 4
f 4
f 4
f 2
f 2
f 2
f 2
(c) 1/4 frequency.
Fig. 3.3: An example DSA system showing three of many possible operating configurations.
synthesizable RTL designs can be produced with architecturally-heterogeneous processing
cores. The FabScalar toolset includes a simulation environment using the Cadence NC-
Verilog functional verification tool by employing the Verilog Procedural Interface to combine
the generated RTL with the C++ functional simulator. Using this toolset, one can simulate
the execution of software benchmarks on each processing core, helping us determine which
core architectures are more efficient for a given type of software application.
3.5.2 Conservation Cores
Because power efficiency is often becoming more important than performance, Venkatesh
et al. have developed a method of designing heterogeneous specialized cores that focus on
reducing energy×delay rather than simply improving performance [10]. These conservation
cores, or c-cores, can be automatically synthesized from target application source code. In
order to adapt for software evolution, the c-cores support patching and can be updated.
Many individual, heterogeneous c-cores are combined with a general purpose CPU to form
Many-Core Processors (MCPs). Such MCPs are ideal for designing Dark Silicon-Aware
systems because the system can choose which sub-core to activate within any MCP.
19
3.5.3 Specifics of Type-II DSA Design
This work focuses on core-level dark silicon and core-level heterogeneity. Therefore,
the FabScalar toolset is utilized to design DSA systems with varying microarchitectures.
However, the same principles that this work employs to optimize inter-core heterogeneity
(Chapter 4) can be used to optimize intra-core heterogeneity with Conservation Core MCPs
or other power efficient hardware accelerators. The energy efficiency results of optimized
Type-II DSA systems are provided later in Sec. 7.2.
3.6 DSA Systems with Voltage Upscaled Differential Reliability (Type-III)
Type-III systems are Differentially Reliable (DR) systems consisting of cores that differ
in their intrinsic computational reliability due to varying degrees of voltage upscaling.
3.6.1 Differentially Reliable (DR) DSA Systems
As transistor scaling augments power density and process variation while reducing
circuit reliability, approximate computing is receiving unprecedented attention in contem-
porary research because of the potential power savings. Nanometer devices age rapidly
and have a wider degree of process variation, requiring large power, performance, and area
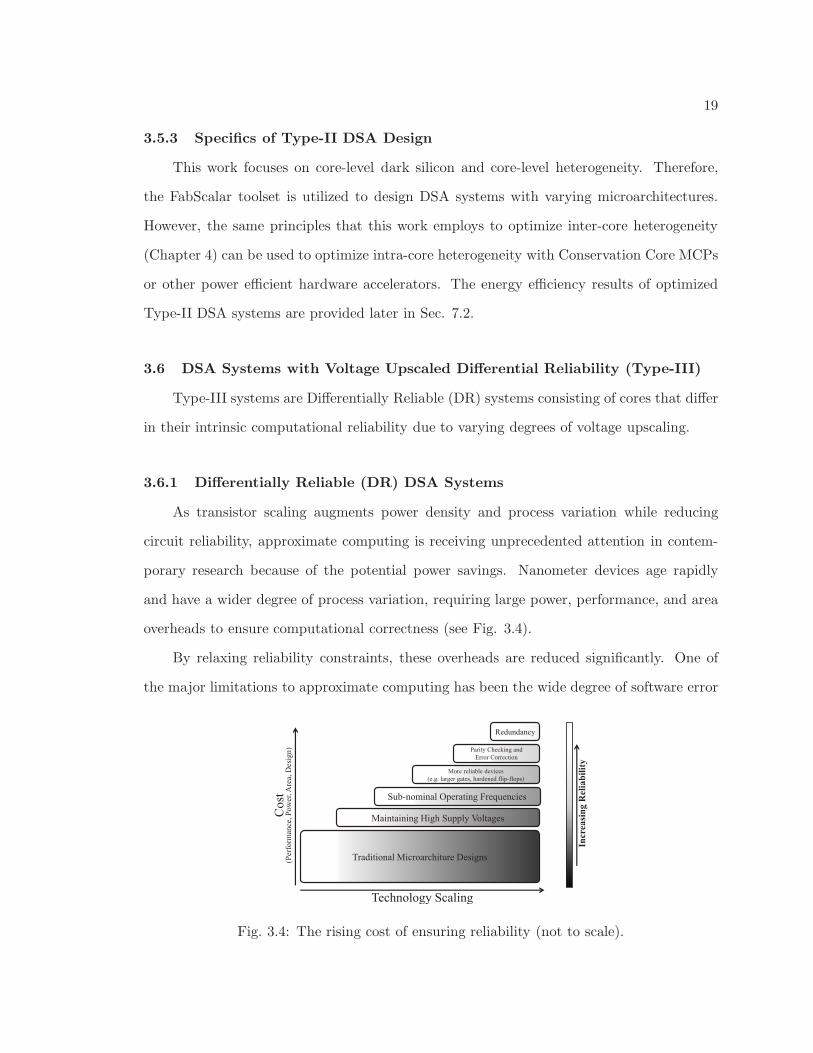
overheads to ensure computational correctness (see Fig. 3.4).
By relaxing reliability constraints, these overheads are reduced significantly. One of
the major limitations to approximate computing has been the wide degree of software error
Traditional Microarchiture Designs
Maintaining High Supply Voltages
Sub-nominal Operating Frequencies
More reliable devices
(e.g. larger gates, hardened flip-flops)
Parity Checking and
Error Correction
Redundancy
Cost
(P
erfo
rman
ce, P
ow
er, A
rea,
Des
ign
)
Technology Scaling
Incr
easi
ng R
elia
bil
ity
Fig. 3.4: The rising cost of ensuring reliability (not to scale).
20
tolerance; most software applications assume correct computation. However, dark silicon
allows a system to meet the needs of a large range of software applications.
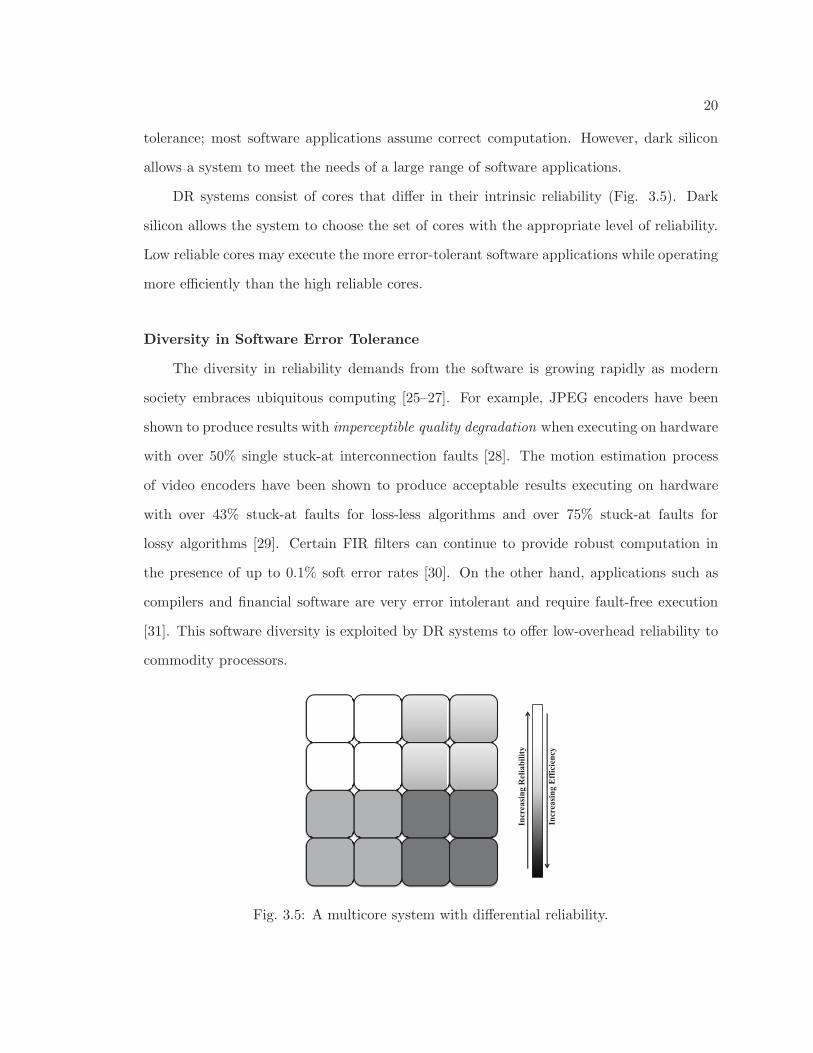
DR systems consist of cores that differ in their intrinsic reliability (Fig. 3.5). Dark
silicon allows the system to choose the set of cores with the appropriate level of reliability.
Low reliable cores may execute the more error-tolerant software applications while operating
more efficiently than the high reliable cores.
Diversity in Software Error Tolerance
The diversity in reliability demands from the software is growing rapidly as modern
society embraces ubiquitous computing [25–27]. For example, JPEG encoders have been
shown to produce results with imperceptible quality degradation when executing on hardware
with over 50% single stuck-at interconnection faults [28]. The motion estimation process
of video encoders have been shown to produce acceptable results executing on hardware
with over 43% stuck-at faults for loss-less algorithms and over 75% stuck-at faults for
lossy algorithms [29]. Certain FIR filters can continue to provide robust computation in
the presence of up to 0.1% soft error rates [30]. On the other hand, applications such as
compilers and financial software are very error intolerant and require fault-free execution
[31]. This software diversity is exploited by DR systems to offer low-overhead reliability to
commodity processors.
Incr
easi
ng
Rel
iab
ilit
y
Incr
easi
ng
Eff
icie
ncy
Fig. 3.5: A multicore system with differential reliability.
21
Variable Computational Reliability in Hardware
Esmaeilzadeh et al. identify relaxed reliability constraints as a promising response to
dark silicon because of the potential energy efficiency improvements [32]. They discuss
disciplined approximate computing as a method of reducing power consumption while still
providing acceptable quality in computed results. One way that this may be done is through
approximate accelerators. This method exploits dark silicon by off-loading computation
from high reliable CPUs onto less reliable accelerators. Several similar approaches, such
as the following, have been proposed to provide a degree of power efficient heterogeneity
through differential reliability.
Voltage-Induced Differential Reliability: Reducing the supply voltage generally results
in a sudden, large increase in errors as timing violations begin to occur. However, Kahng et
al. recently proposed a new methodology that gradually extends the increase in errors by
designing processors from the ground up to allow for voltage/reliability trade-offs [33]. Their
method uses slack redistribution to create soft architectures—designs that decrease power
consumption by reducing voltage to the point that produces maximum allowable errors.
In an HtCMP, each core may be assigned a different supply voltage to create different
reliability environments that can be exploited by dark silicon and the diversity in software
error tolerance.
Architecture-Induced Differential Reliability: Probabilistic applications are generally
quite error tolerant. However, the quality of their results depends on the error location.
Error in low-order bits are more tolerable than those in high-order bits or control lines.
Leem et al. proposed ERSA: Error Resilient System Architecture, a system that provide
acceptable results while operating in a faulty environment [25]. ERSA is designed with a
Super Reliable Core (SRC) and several accompanying Relaxed Reliability Cores (RRCs).
The SRC executes error-intolerance instructions and performs memory-boundary checks on
the results of the RRCs. Error-tolerant instructions are offloaded to the RRCs, which are
much more energy efficient. Such a combination of high-reliable and low-reliable cores is
an ideal candidate for Dark Silicon-Aware architectures because the system may choose to
22
activate high or low-reliable cores based on current workload demands.
Redundancy-Induced Differential Reliability: Srinivasan et al. discuss exploiting al-
ready existing structural duplication to provide varying levels of reliability [34]. This con-
cept can be used to create Dark Silicon-Aware multicore systems where the various cores
use different levels of structural redundancy to provide varying levels of reliability.
3.6.2 Specifics of Type-III DSA Design
Any of the previously mentioned methods may be used to design DR systems that pro-
vide substantial power efficiency benefits. To illustrate the importance of sustaining these
benefits, Type-III systems are designed with a fairly simple form of differential reliability:
voltage upscaling. Upscaling voltages is a common method of ensuring reliable computa-
tion. With differential reliability, the less-reliable cores avoid upscaled voltages, permitting
occasional errors as a result. Chapter 5 discusses how these power savings are sustained
throughout the lifetime of the chip. The sustained energy efficiency benefits of Type-III
DSA systems are provided in Sec. 7.3.
3.7 DSA Systems with Instruction Replay Differential Reliability (Type-IV)
Many chip designers are hesitant to devote the multiplied engineering resources that
are necessary to create heterogeneous systems. However, manufacturing process variation
and asymmetric circuit aging cause initially homogeneous systems to become heterogeneous,
specifically in their degree of computational reliability. The rising dark silicon level only
magnifies this affect as it can cause unbalanced core-level utilization. This work presents
Instruction Replay DR systems to illustrate how even unintended heterogeneity can be
exploited by dark silicon.
3.7.1 RAZOR: Instruction Replays
In order to avoid timing violations, circuits are typically designed with a timing gaurd-
band—an added cycle delay that acts as a buffer. NBTI and HCI aging increase transistor
threshold voltage, and therefore transistor switching delay, which in turn increases the
23
overall circuit propagation delay. Aging, therefore, requires an even larger timing gaurd-
band, reducing the operating frequency of the processor and thus the software performance.
However, these timing violations are dependent on the sensitized critical path, which is in-
fluenced heavily by the executing instruction. The wide timing range between instructions
means that not all instructions require such a large timing gaurdband. To take advantage of
this distribution, Das et al. have proposed RAZOR circuitry which uses shadow flip-flops to
identify timing violations and trigger instruction replays when necessary [35]. The benefit
of RAZOR circuitry is that the timing gaurdband can be significantly reduced. However,
instruction replays require a pipeline flush, incurring several penalty cycles to correct a
timing violation.
3.7.2 Specifics of Type-IV DSA Design
To illustrate how an originally homogeneous system can be guided to exploit dark
silicon over time, Type-IV DSA systems are designed with a level of differential reliability
created by modifying RAZOR circuitry and controlling core-level utilization.
Modifying RAZOR for Differential Reliability
In Type-IV systems, RAZOR circuitry is modified to allow the propagation of some
errors without a corrective instruction replay. A small error counter is added to keep track
of the frequency with which errors are tolerated. The error tolerance level is specified by the
executing software thread. With this modification, these systems can provide the benefits
of differential reliability, dynamically adjusting to the current software workload.
Providing Dark Silicon Exploitable Heterogeneity
While these systems are initially homogeneous, controlled utilization can guide aging
to create a level of heterogeneity that can be exploited by dark silicon. This control process
is presented in Chapter 5. As the reliability difference between cores widens, more error-
prone cores can mask a larger portion of their timing violations by executing error-tolerant
software threads. Over time, this process decreases the number of instruction replays that
24
must occur, improving the overall energy efficiency. The sustained energy efficiency benefits
of Type-IV DSA systems are provided in Sec. 7.3.
3.8 Implementing DSA Designs
In addition to controlling operating modes of active cores, DSA systems need to be able
to control which cores are active and which are inactive through power gating and utilization
balancing. PGCapping is an affective mechanism for implementing this design requirement
[36]. For scalable, many-core CMP designs, DSA systems implement this control at coarser
granularity, grouping cores into controllable clusters, similar to the design proposed by Ma
et al. [37].
25
Chapter 4
Optimizing DSA Core Configurations
As shown, Dark Silicon-Aware systems can exploit growing dark silicon levels to provide
improved energy efficiency through specialization. However, this ability depends on two
key aspects of the chip design: first the degree of hardware specialization, and second the
availability of this specialization to competing threads in a software workload. Correctly
designing the individual processing cores of an HtCMP is the fundamental design challenge
of providing the correct degree of specialization that can be ideally exploited by dark silicon.
4.1 Case Study: The Importance of Designing for Specific Dark Silicon Levels
In this motivational case study, a conventional Homogeneous Chip Multiprocessor (Hm-
CMP) and a handful of Heterogeneous Chip Multiprocessors (HtCMPs) are analyzed at
several increasing levels of dark silicon. The results demonstrate the critical need to adopt
a Dark Silicon-Aware design for specific forthcoming technology nodes. A simplified Type-I
design is employed, based on ALUs to represent the HtCMPs in the case study.
4.1.1 Methodology
Each system includes 16 ALUs for this motivational study using 32-bit ALUs from
the ISCAS benchmark suite (c7552). Each ALU belongs to a separate core in the multi-
core system. This simplified ALU model is used to highlight key concepts. Further in this
work, more complete models are employed, synthesizing the major portions of entire pro-
cessing cores. The level of dark silicon is varied between 0% and 62.5% representing several
forthcoming technology generations. The following design styles are synthesized using the
Synopsys Design Compiler and a TSMC 45nm technology library to measure their power
and performance.
26
• Conventional: All 16 ALUs are designed for the nominal frequency.
• Style A: Eight ALUs are designed for nominal and eight are designed for 50% of
nominal frequency.
• Style B: Four are designed for nominal, four for 75%, four for 50%, and four for 25%
of nominal frequency.
• Style C: Six are designed for nominal, six for 75%, two for 50%, and two for 25% of
nominal frequency.
• Style D: Three are designed for nominal, five for 75%, five for 50%, and three for 25%
of nominal frequency.
• Style E: Five are designed for nominal, five for 75%, three for 50%, and three for 25%
of nominal frequency.
On each design style, 1000 workloads are simulated, each consisting of a set of software
threads with frequency demands chosen from a Gaussian distribution with a mean at 75%
of the nominal frequency. This distribution captures the application diversity in typical
workloads. The number of threads in each set is equal to the total number of active cores
(ALUs). Thread-to-core assignment is based on maximizing the system energy efficiency.
4.1.2 Results
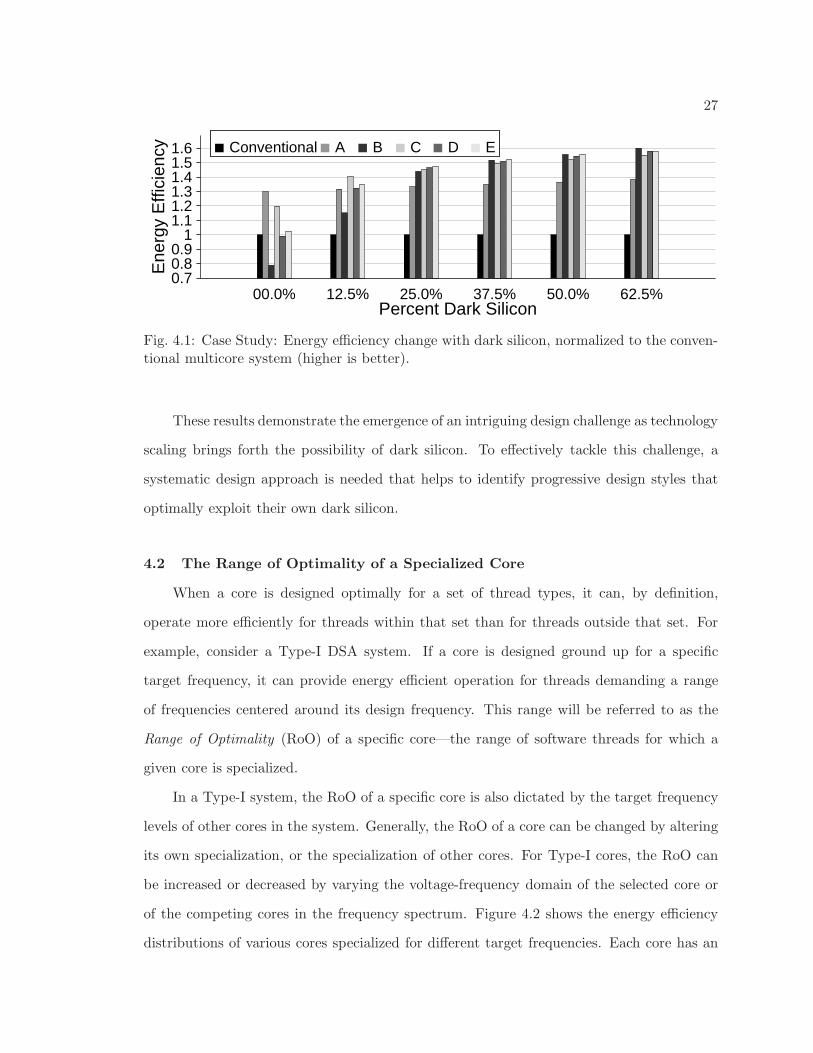
Figure 4.1 presents data for the improvement in energy efficiency over a conventional
multicore measured using the inverse of Energy × Delayλ (here λ = 4 due to the strict
timing requirements of the ALU). Two key observations are made from this figure. First,
energy efficiency over a conventional system improves with higher levels of dark silicon.
This is because increasing levels of dark silicon provide the system with greater flexibility in
choosing a set of cores that better matches the software demands. Second, it can be observed
that a design style is optimal for 0% dark silicon (Style A) can become sub-optimal for 62.5%
dark silicon with respect to traditional design objectives like energy efficiency. On the other
hand, a design style (such as Style B) that shows limited promise in low levels of dark
silicon, can outperform with growing levels of dark silicon.
27
0.70.80.9
11.11.21.31.41.51.6
Ene
rgy
Effi
cien
cy
Percent Dark Silicon00.0% 12.5% 25.0% 37.5% 50.0% 62.5%
Conventional A B C D E
Fig. 4.1: Case Study: Energy efficiency change with dark silicon, normalized to the conven-tional multicore system (higher is better).
These results demonstrate the emergence of an intriguing design challenge as technology
scaling brings forth the possibility of dark silicon. To effectively tackle this challenge, a
systematic design approach is needed that helps to identify progressive design styles that
optimally exploit their own dark silicon.
4.2 The Range of Optimality of a Specialized Core
When a core is designed optimally for a set of thread types, it can, by definition,
operate more efficiently for threads within that set than for threads outside that set. For
example, consider a Type-I DSA system. If a core is designed ground up for a specific
target frequency, it can provide energy efficient operation for threads demanding a range
of frequencies centered around its design frequency. This range will be referred to as the
Range of Optimality (RoO) of a specific core—the range of software threads for which a
given core is specialized.
In a Type-I system, the RoO of a specific core is also dictated by the target frequency
levels of other cores in the system. Generally, the RoO of a core can be changed by altering
its own specialization, or the specialization of other cores. For Type-I cores, the RoO can
be increased or decreased by varying the voltage-frequency domain of the selected core or
of the competing cores in the frequency spectrum. Figure 4.2 shows the energy efficiency
distributions of various cores specialized for different target frequencies. Each core has an
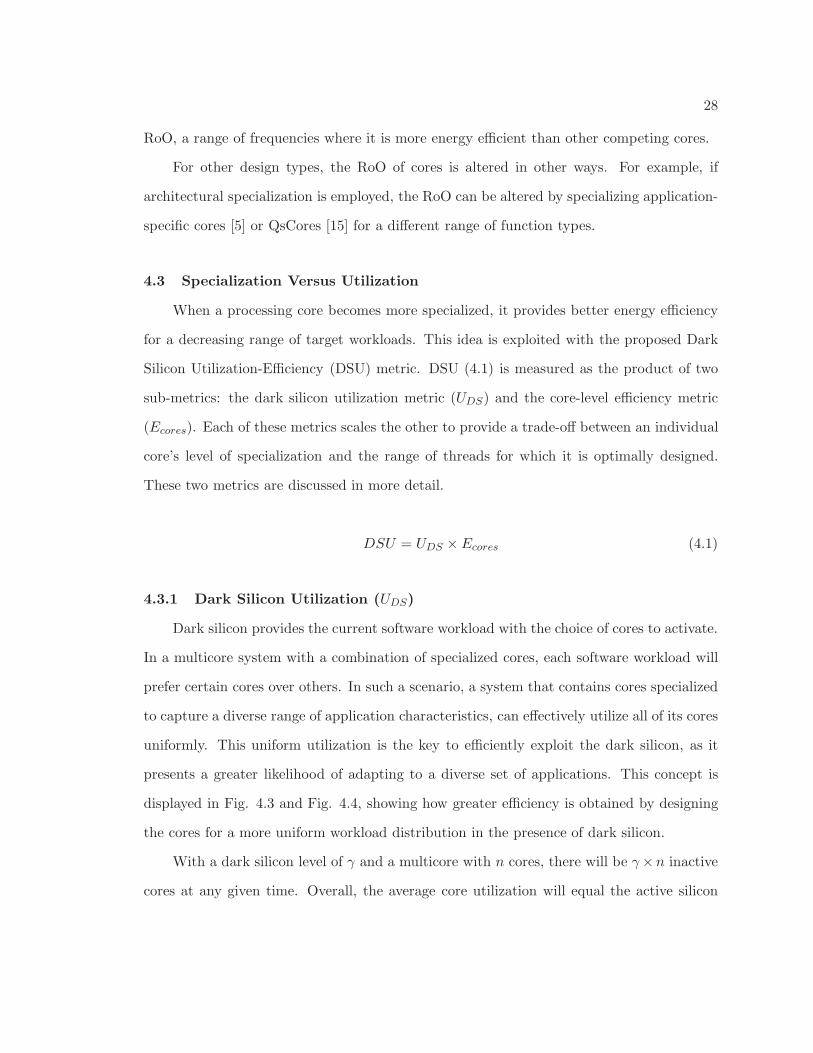
28
RoO, a range of frequencies where it is more energy efficient than other competing cores.
For other design types, the RoO of cores is altered in other ways. For example, if
architectural specialization is employed, the RoO can be altered by specializing application-
specific cores [5] or QsCores [15] for a different range of function types.
4.3 Specialization Versus Utilization
When a processing core becomes more specialized, it provides better energy efficiency
for a decreasing range of target workloads. This idea is exploited with the proposed Dark
Silicon Utilization-Efficiency (DSU) metric. DSU (4.1) is measured as the product of two
sub-metrics: the dark silicon utilization metric (UDS) and the core-level efficiency metric
(Ecores). Each of these metrics scales the other to provide a trade-off between an individual
core’s level of specialization and the range of threads for which it is optimally designed.
These two metrics are discussed in more detail.
DSU = UDS × Ecores (4.1)
4.3.1 Dark Silicon Utilization (UDS)
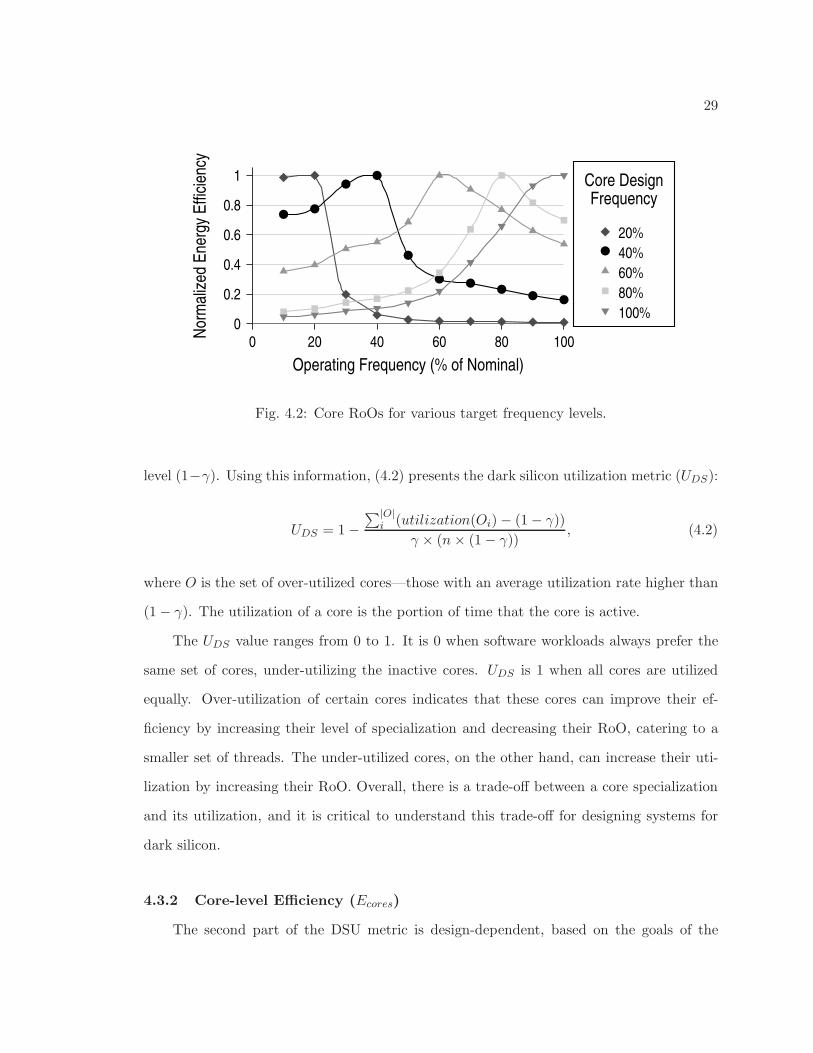
Dark silicon provides the current software workload with the choice of cores to activate.
In a multicore system with a combination of specialized cores, each software workload will
prefer certain cores over others. In such a scenario, a system that contains cores specialized
to capture a diverse range of application characteristics, can effectively utilize all of its cores
uniformly. This uniform utilization is the key to efficiently exploit the dark silicon, as it
presents a greater likelihood of adapting to a diverse set of applications. This concept is
displayed in Fig. 4.3 and Fig. 4.4, showing how greater efficiency is obtained by designing
the cores for a more uniform workload distribution in the presence of dark silicon.
With a dark silicon level of γ and a multicore with n cores, there will be γ×n inactive
cores at any given time. Overall, the average core utilization will equal the active silicon
29
0 20 40 60 80 1000
0.2
0.4
0.6
0.8
1
Operating Frequency (% of Nominal)
Nor
mal
ized
Ene
rgy
Effi
cien
cy
20%
40%
60%
80%
100%
Core DesignFrequency
Fig. 4.2: Core RoOs for various target frequency levels.
level (1−γ). Using this information, (4.2) presents the dark silicon utilization metric (UDS):
UDS = 1−
∑|O|i (utilization(Oi)− (1− γ))
γ × (n× (1− γ)), (4.2)
where O is the set of over-utilized cores—those with an average utilization rate higher than
(1− γ). The utilization of a core is the portion of time that the core is active.
The UDS value ranges from 0 to 1. It is 0 when software workloads always prefer the
same set of cores, under-utilizing the inactive cores. UDS is 1 when all cores are utilized
equally. Over-utilization of certain cores indicates that these cores can improve their ef-
ficiency by increasing their level of specialization and decreasing their RoO, catering to a
smaller set of threads. The under-utilized cores, on the other hand, can increase their uti-
lization by increasing their RoO. Overall, there is a trade-off between a core specialization
and its utilization, and it is critical to understand this trade-off for designing systems for
dark silicon.
4.3.2 Core-level Efficiency (Ecores)
The second part of the DSU metric is design-dependent, based on the goals of the
30
1 2 3 4 5 6 7 8 9 10
Thread Types
Fre
que
ncy o
f O
ccu
rren
ce
= 1% of Threads
(a) Sample workload distribution.
1 2 3 4 5 6 7 8 9 10
Core A: Utilization = 100%
Core B: Utilization = 0%
(b) Scenario 1: Core A and Core B are identical.One core is effectively wasted.
1 2 3 4 5 6 7 8 9 10
Core A
Utilization = 50%
Core B Utilization = 50%
(c) Scenario 2: Core A is specialized for threadtypes 1-5. Core B for thread types 6-10.
Fig. 4.3: Splitting the RoO of a set of cores (50% dark silicon, two cores).
multicore design. It is a measure of the efficiency of the system as compared to the efficiency
of an ideal system, which always allows each thread to execute on a core optimally designed
for that thread. In this study, energy efficiency is the target metric, resulting in the following
efficiency metric:
Ecores =[Energy Efficiency]actual
[Energy Efficiency]ideal
. (4.3)
Energy efficiency is measured as being inversely proportional to the Energy ×Delayλ
product. The ideal energy efficiency is measured by simulating a system where each thread
can be assigned to the core of its choice, regardless of conflict with other threads or whether
or not that core is even available in the current design. The Ecores value ranges from 0 to
1 and is higher for thread-to-core assignments that provide a better software-to-hardware
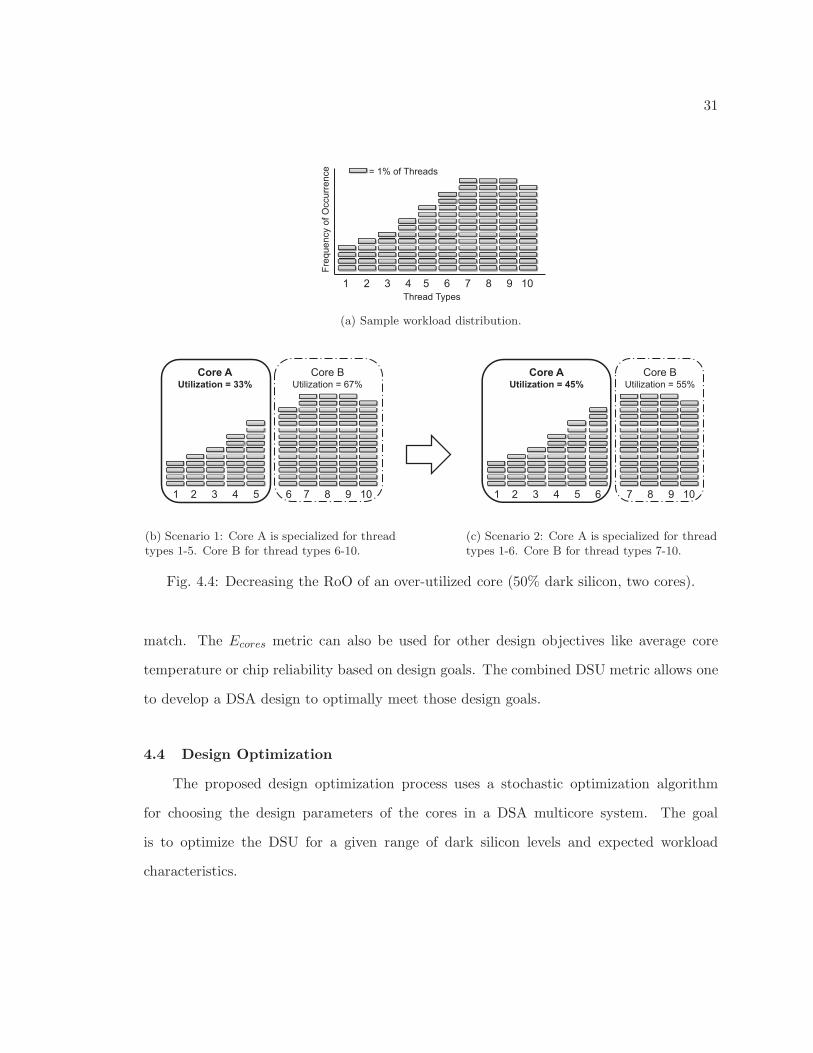
31
1 2 3 4 5 6 7 8 9 10
Thread Types
Fre
que
ncy o
f O
ccu
rren
ce
= 1% of Threads
(a) Sample workload distribution.
1 2 3 4 5 6 7 8 9 10
Core A
Utilization = 33%
Core B Utilization = 67%
(b) Scenario 1: Core A is specialized for threadtypes 1-5. Core B for thread types 6-10.
1 2 3 4 5 6 7 8 9 10
Core A
Utilization = 45%
Core B Utilization = 55%
(c) Scenario 2: Core A is specialized for threadtypes 1-6. Core B for thread types 7-10.
Fig. 4.4: Decreasing the RoO of an over-utilized core (50% dark silicon, two cores).
match. The Ecores metric can also be used for other design objectives like average core
temperature or chip reliability based on design goals. The combined DSU metric allows one
to develop a DSA design to optimally meet those design goals.
4.4 Design Optimization
The proposed design optimization process uses a stochastic optimization algorithm
for choosing the design parameters of the cores in a DSA multicore system. The goal
is to optimize the DSU for a given range of dark silicon levels and expected workload
characteristics.
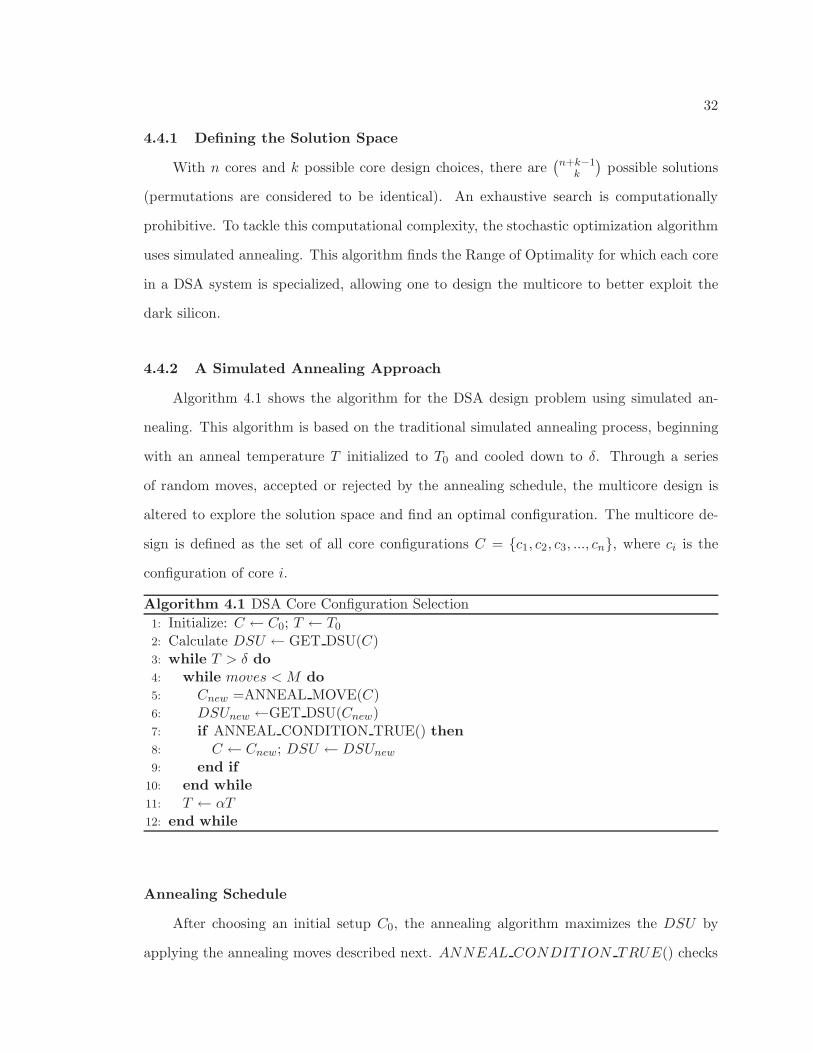
32
4.4.1 Defining the Solution Space
With n cores and k possible core design choices, there are(
n+k−1
k
)
possible solutions
(permutations are considered to be identical). An exhaustive search is computationally
prohibitive. To tackle this computational complexity, the stochastic optimization algorithm
uses simulated annealing. This algorithm finds the Range of Optimality for which each core
in a DSA system is specialized, allowing one to design the multicore to better exploit the
dark silicon.
4.4.2 A Simulated Annealing Approach
Algorithm 4.1 shows the algorithm for the DSA design problem using simulated an-
nealing. This algorithm is based on the traditional simulated annealing process, beginning
with an anneal temperature T initialized to T0 and cooled down to δ. Through a series
of random moves, accepted or rejected by the annealing schedule, the multicore design is
altered to explore the solution space and find an optimal configuration. The multicore de-
sign is defined as the set of all core configurations C = {c1, c2, c3, ..., cn}, where ci is the
configuration of core i.
Algorithm 4.1 DSA Core Configuration Selection
1: Initialize: C ← C0; T ← T0
2: Calculate DSU ← GET DSU(C)3: while T > δ do4: while moves < M do5: Cnew =ANNEAL MOVE(C)6: DSUnew ←GET DSU(Cnew)7: if ANNEAL CONDITION TRUE() then8: C ← Cnew; DSU ← DSUnew
9: end if10: end while11: T ← αT
12: end while
Annealing Schedule
After choosing an initial setup C0, the annealing algorithm maximizes the DSU by
applying the annealing moves described next. ANNEAL CONDITION TRUE() checks
33
whether DSUnew is greater than DSU , or smaller with a probability decreasing with the
annealing temperature. This allows occasional uphill moves to better explore the solution
space.
Annealing Moves
ANNEAL MOV E() randomly applies a move selected from the following four moves
that combine to explore the entire solution space.
• Decrease the RoO to increase the level of specialization for a set of over-utilized cores.
• Increase the RoO to decrease the level of specialization for a set of under-utilized
cores.
• Split a set of cores into two randomly-sized sets of cores and divide its RoO between
the two.
• Merge two sets of cores, designing the new set to be optimal for the combined RoOs
of the original sets.
4.5 Optimization Analysis
This optimization process is analyzed for two different DSA design techniques: Type-I
(Sec. 3.4) and Type-II (Sec. 3.5), respectively. The experimental results of optimizing these
two designs are presented in Sec. 7.1 and Sec. 7.2, respectively.
34
Chapter 5
Sustaining the Energy Efficiency Benefits of Dark Silicon
The previous chapter showed how the effectiveness of a DSA system depends on the
specific variation between cores. However, process variation and asymmetric aging between
components can disrupt the essential thread-to-core mapping process by altering the in-
trinsic degree of heterogeneity. The degree of heterogeneity can be maintained by guiding
circuit aging throughout the lifetime. Aging, in turn, is guided by manipulating core-level
utilization with controlled core activation decisions. Because dark silicon itself provides us
with this needed guaranteed level of choice in dynamically selecting which cores are actively
utilized, core-level aging can be guided to maintain precise heterogeneity and sustain the
benefits of dark silicon exploitation. Without loss of generality, this chapter uses the ex-
ample of differentially reliable DSA systems—HtCMPs that provide heterogeneity through
varying computational reliability between cores (see Sec. 3.6.1).
5.1 Case Study: The Importance of Maintaining the Heterogeneity Profile
This section demonstrates the challenges of long term sustainability of differentially
reliable DSA systems through a detailed case study.
5.1.1 Case Study Overview
The case study shows the challenge of sustaining the benefits of differential reliability.
Four DR systems (A, B, C, and D) are modeled along with a comparative homogeneous
multicore system (H), each with eight clusters of cores. Each system is analyzed at various
upcoming technology nodes, represented by increasing levels of dark silicon. The results
show three important concepts: first, the energy efficiency benefits of a DR system increase
with dark silicon; second, a higher degree of differential reliability provides better efficiency;
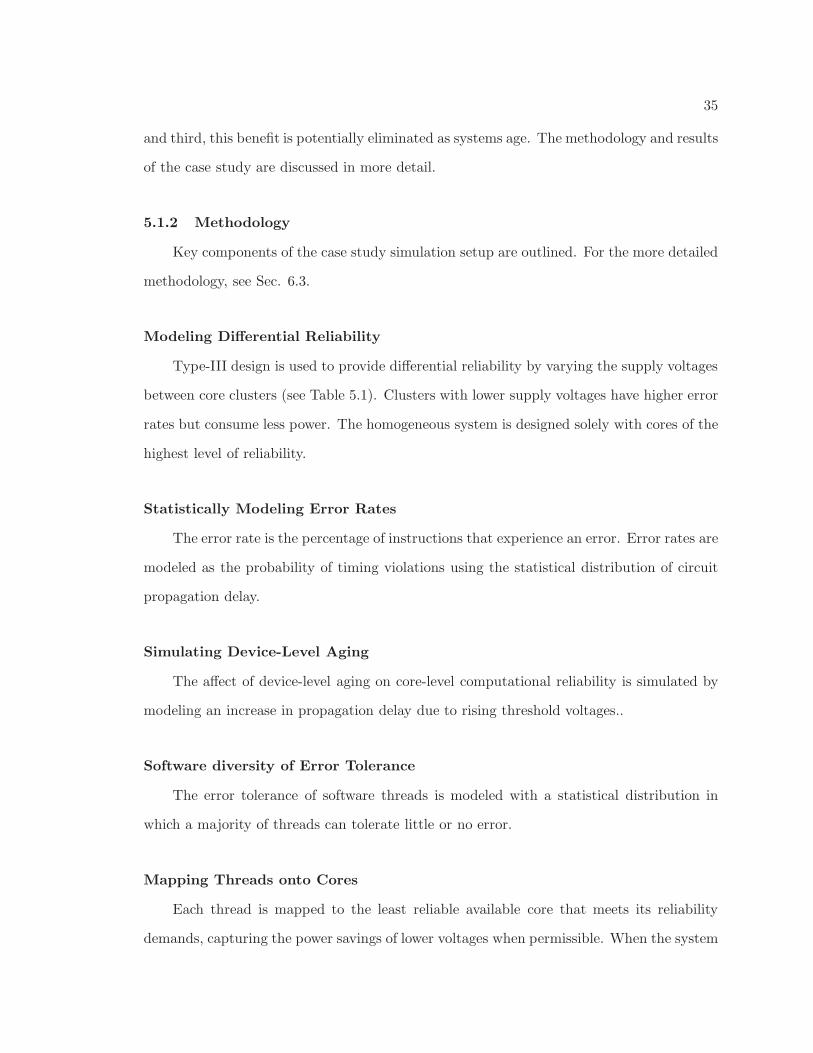
35
and third, this benefit is potentially eliminated as systems age. The methodology and results
of the case study are discussed in more detail.
5.1.2 Methodology
Key components of the case study simulation setup are outlined. For the more detailed
methodology, see Sec. 6.3.
Modeling Differential Reliability
Type-III design is used to provide differential reliability by varying the supply voltages
between core clusters (see Table 5.1). Clusters with lower supply voltages have higher error
rates but consume less power. The homogeneous system is designed solely with cores of the
highest level of reliability.
Statistically Modeling Error Rates
The error rate is the percentage of instructions that experience an error. Error rates are
modeled as the probability of timing violations using the statistical distribution of circuit
propagation delay.
Simulating Device-Level Aging
The affect of device-level aging on core-level computational reliability is simulated by
modeling an increase in propagation delay due to rising threshold voltages..
Software diversity of Error Tolerance
The error tolerance of software threads is modeled with a statistical distribution in
which a majority of threads can tolerate little or no error.
Mapping Threads onto Cores
Each thread is mapped to the least reliable available core that meets its reliability
demands, capturing the power savings of lower voltages when permissible. When the system
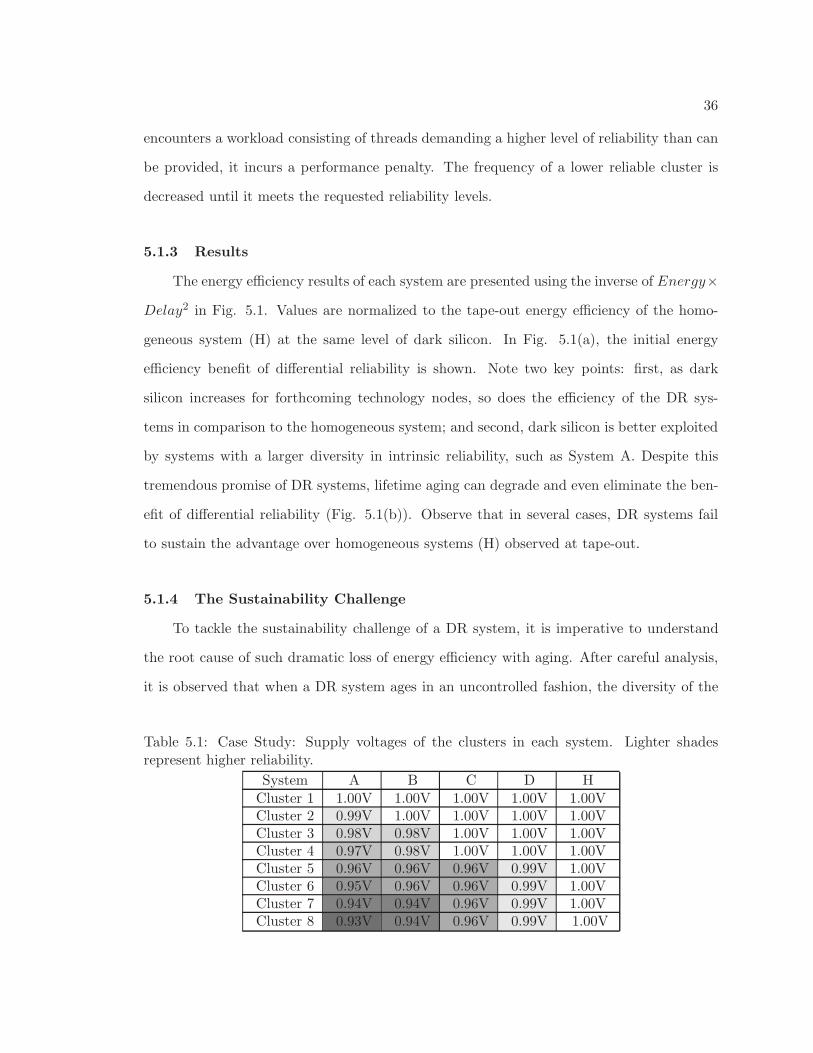
36
encounters a workload consisting of threads demanding a higher level of reliability than can
be provided, it incurs a performance penalty. The frequency of a lower reliable cluster is
decreased until it meets the requested reliability levels.
5.1.3 Results
The energy efficiency results of each system are presented using the inverse of Energy×
Delay2 in Fig. 5.1. Values are normalized to the tape-out energy efficiency of the homo-
geneous system (H) at the same level of dark silicon. In Fig. 5.1(a), the initial energy
efficiency benefit of differential reliability is shown. Note two key points: first, as dark
silicon increases for forthcoming technology nodes, so does the efficiency of the DR sys-
tems in comparison to the homogeneous system; and second, dark silicon is better exploited
by systems with a larger diversity in intrinsic reliability, such as System A. Despite this
tremendous promise of DR systems, lifetime aging can degrade and even eliminate the ben-
efit of differential reliability (Fig. 5.1(b)). Observe that in several cases, DR systems fail
to sustain the advantage over homogeneous systems (H) observed at tape-out.
5.1.4 The Sustainability Challenge
To tackle the sustainability challenge of a DR system, it is imperative to understand
the root cause of such dramatic loss of energy efficiency with aging. After careful analysis,
it is observed that when a DR system ages in an uncontrolled fashion, the diversity of the
Table 5.1: Case Study: Supply voltages of the clusters in each system. Lighter shadesrepresent higher reliability.
System A B C D HCluster 1 1.00V 1.00V 1.00V 1.00V 1.00VCluster 2 0.99V 1.00V 1.00V 1.00V 1.00VCluster 3 0.98V 0.98V 1.00V 1.00V 1.00VCluster 4 0.97V 0.98V 1.00V 1.00V 1.00VCluster 5 0.96V 0.96V 0.96V 0.99V 1.00VCluster 6 0.95V 0.96V 0.96V 0.99V 1.00VCluster 7 0.94V 0.94V 0.96V 0.99V 1.00VCluster 8 0.93V 0.94V 0.96V 0.99V 1.00V
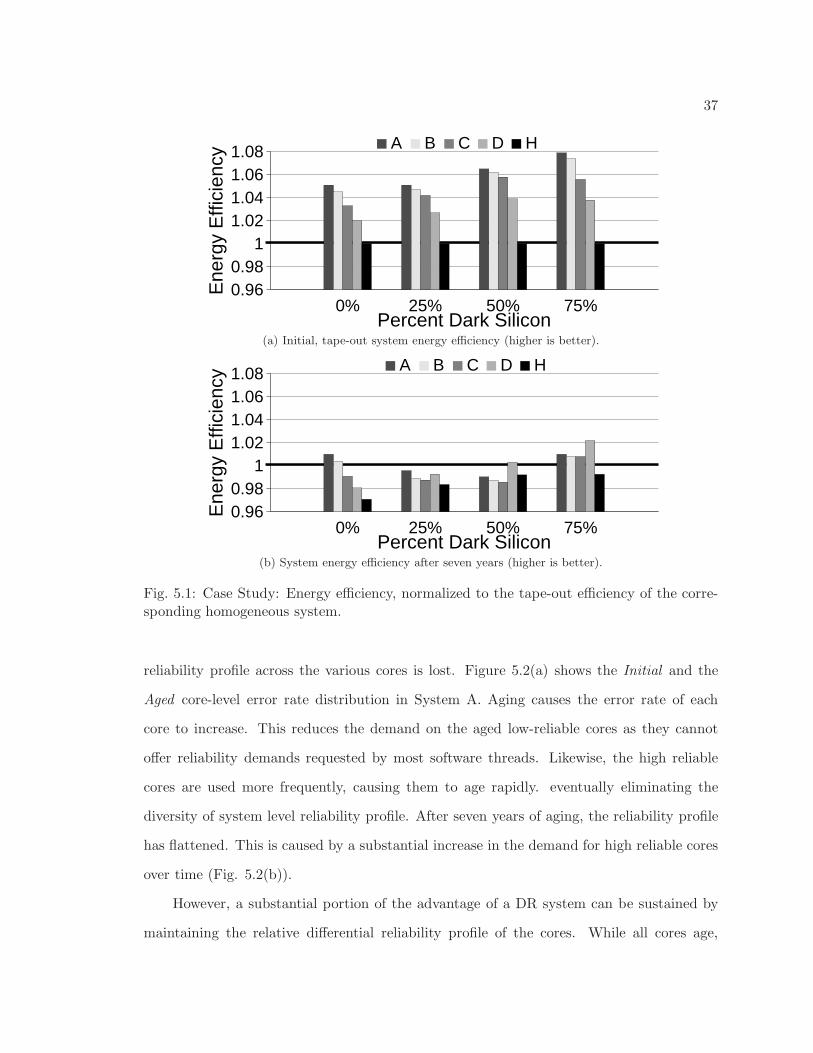
37
0.960.98
11.021.041.061.08
Ene
rgy
Effi
cien
cy
Percent Dark Silicon0% 25% 50% 75%
A B C D H
(a) Initial, tape-out system energy efficiency (higher is better).
0.960.98
11.021.041.061.08
Ene
rgy
Effi
cien
cy
Percent Dark Silicon0% 25% 50% 75%
A B C D H
(b) System energy efficiency after seven years (higher is better).
Fig. 5.1: Case Study: Energy efficiency, normalized to the tape-out efficiency of the corre-sponding homogeneous system.
reliability profile across the various cores is lost. Figure 5.2(a) shows the Initial and the
Aged core-level error rate distribution in System A. Aging causes the error rate of each
core to increase. This reduces the demand on the aged low-reliable cores as they cannot
offer reliability demands requested by most software threads. Likewise, the high reliable
cores are used more frequently, causing them to age rapidly. eventually eliminating the
diversity of system level reliability profile. After seven years of aging, the reliability profile
has flattened. This is caused by a substantial increase in the demand for high reliable cores
over time (Fig. 5.2(b)).
However, a substantial portion of the advantage of a DR system can be sustained by
maintaining the relative differential reliability profile of the cores. While all cores age,
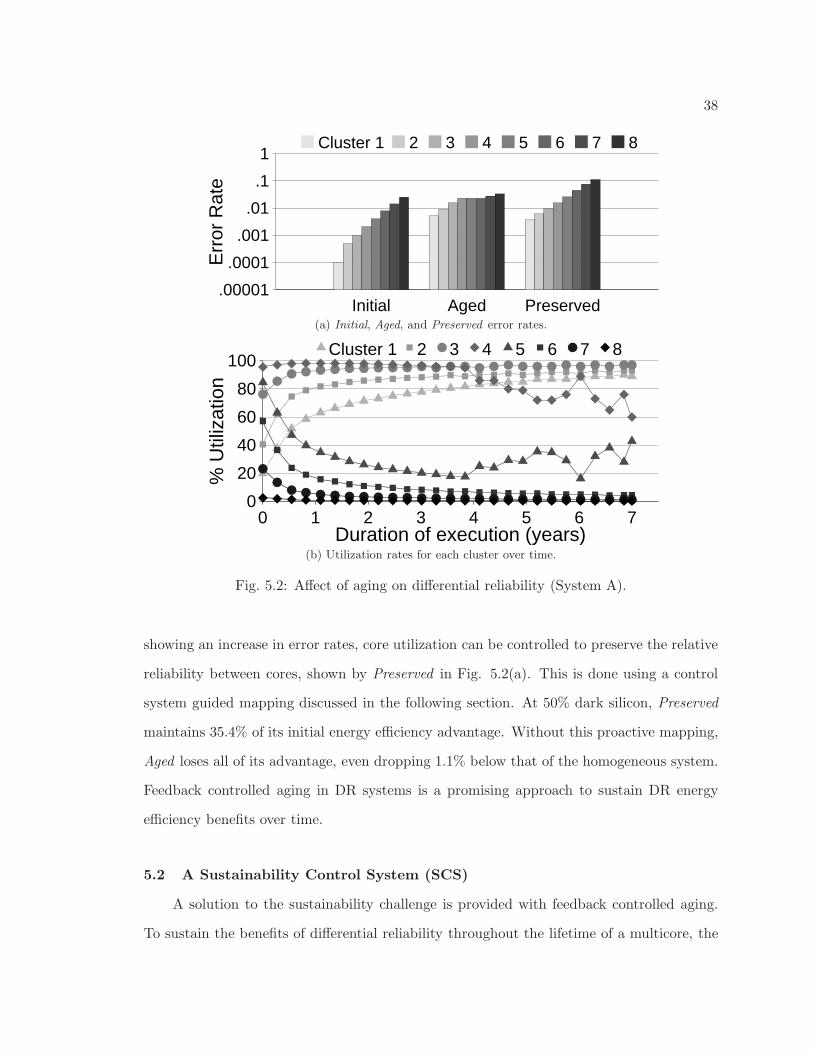
38
Err
or R
ate
.00001
.0001
.001
.01
.1
1
Initial Aged Preserved
Cluster 1 2 3 4 5 6 7 8
(a) Initial, Aged, and Preserved error rates.
0 1 2 3 4 5 6 70
20
40
60
80
100
Duration of execution (years)
% U
tiliz
atio
n
Cluster 1 2 3 4 5 6 7 8
(b) Utilization rates for each cluster over time.
Fig. 5.2: Affect of aging on differential reliability (System A).
showing an increase in error rates, core utilization can be controlled to preserve the relative
reliability between cores, shown by Preserved in Fig. 5.2(a). This is done using a control
system guided mapping discussed in the following section. At 50% dark silicon, Preserved
maintains 35.4% of its initial energy efficiency advantage. Without this proactive mapping,
Aged loses all of its advantage, even dropping 1.1% below that of the homogeneous system.
Feedback controlled aging in DR systems is a promising approach to sustain DR energy
efficiency benefits over time.
5.2 A Sustainability Control System (SCS)
A solution to the sustainability challenge is provided with feedback controlled aging.
To sustain the benefits of differential reliability throughout the lifetime of a multicore, the
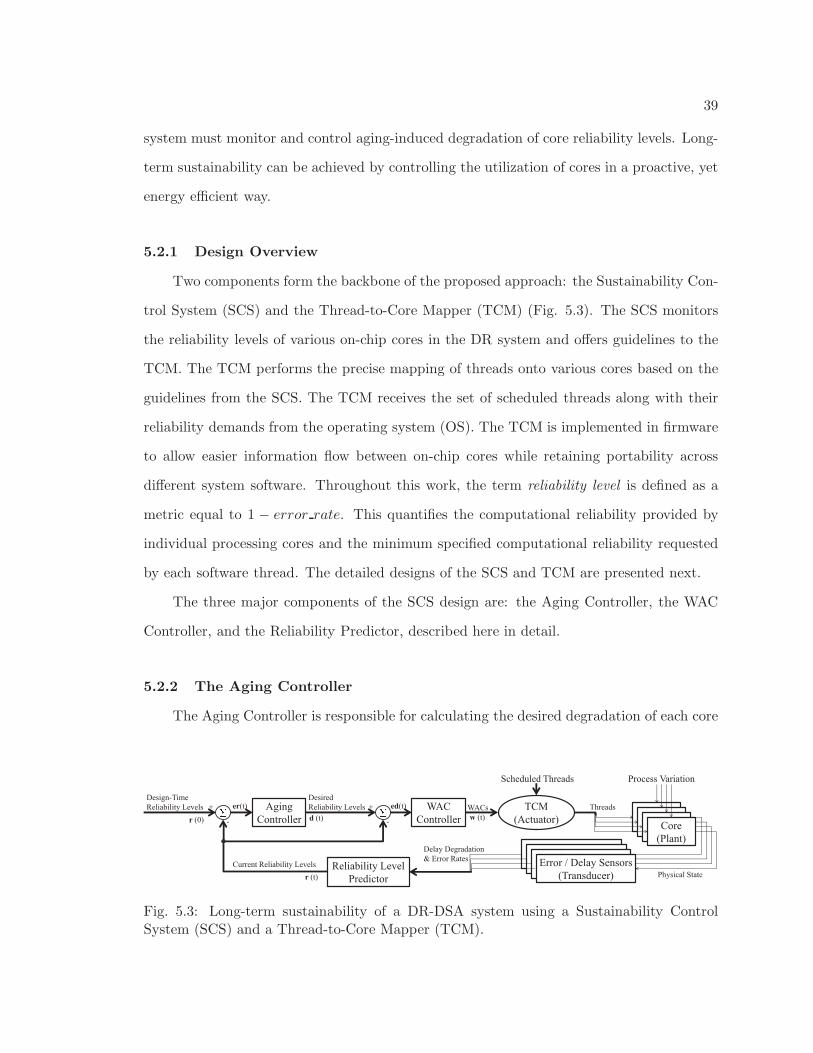
39
system must monitor and control aging-induced degradation of core reliability levels. Long-
term sustainability can be achieved by controlling the utilization of cores in a proactive, yet
energy efficient way.
5.2.1 Design Overview
Two components form the backbone of the proposed approach: the Sustainability Con-
trol System (SCS) and the Thread-to-Core Mapper (TCM) (Fig. 5.3). The SCS monitors
the reliability levels of various on-chip cores in the DR system and offers guidelines to the
TCM. The TCM performs the precise mapping of threads onto various cores based on the
guidelines from the SCS. The TCM receives the set of scheduled threads along with their
reliability demands from the operating system (OS). The TCM is implemented in firmware
to allow easier information flow between on-chip cores while retaining portability across
different system software. Throughout this work, the term reliability level is defined as a
metric equal to 1 − error rate. This quantifies the computational reliability provided by
individual processing cores and the minimum specified computational reliability requested
by each software thread. The detailed designs of the SCS and TCM are presented next.
The three major components of the SCS design are: the Aging Controller, the WAC
Controller, and the Reliability Predictor, described here in detail.
5.2.2 The Aging Controller
The Aging Controller is responsible for calculating the desired degradation of each core
Core
(Plant)
WAC
Controller
Aging
Controller
Reliability Level
Predictor
TCM
(Actuator)
Process Variation
Physical State
Delay Degradation
& Error Rates
Desired
Reliability Levels
Current Reliability Levels
� +
-
WACs Threads
Scheduled Threads
Error/ Delay Sensors
(Transducer)
Core
(Plant) Core
(Plant)
� +
-
Design-Time
Reliability Levels
r (0)
r (t)
d (t) w (t)
er(t) ed(t)
Error/ Delay Sensors
(Transducer) Error/ Delay Sensors
(Transducer) Error / Delay Sensors
(Transducer)
Core
(Plant)
Fig. 5.3: Long-term sustainability of a DR-DSA system using a Sustainability ControlSystem (SCS) and a Thread-to-Core Mapper (TCM).
40
with respect to the other cores. At design time, each core i is assigned a reliability level
ri. For a system with n cores, the vector r of size n contains the reliability levels of each
core. As the cores age over time, their reliability levels decrease. The Aging Controller
uses the difference between the initial reliability levels r(0) and current reliability levels r(t)
to determine the desired reliability level d(t) of each core at any given time. The desired
reliability levels are calculated using to the following equation:
d(t) = r(0) −n
∑
i=1
eri(t)×1− r(0)
n−n∑
i=1
ri(0)
, (5.1)
where er(t) is the error vector (the difference between the initial r(0) and the current r(t)
reliability levels), 1 is a ones vector, and d(t) is the aging controller output vector, which
consists of the desired reliability levels. This data is necessary to determine how far the
aging of each core has diverged from the ideal aging that preserves the differential reliability
profile.
5.2.3 The WAC Controller
The WAC Controller uses the data from the Aging Controller to influence decisions
made by the TCM using a new metric called the Workload Acceptance Capacity (WAC).
The WAC values range from 0 to 1 and tells the TCM how frequently each core should be
utilized during the current epoch. The current WAC values, represented by vector w, are
determined by the following equation:
w(t) = (1− γ)1−Kped(t), (5.2)
where γ is the dark silicon level, ed(t) is the error vector (the difference between the
desired d(t) and current r(t) reliability levels), Kp is the proportional gain constant, and
w(t) is the WAC Controller output vector containing the WAC values for each core. The
WAC Controller scales the reliability level error vector by the gain constant, employing
proportional control for simple hardware implementation. A gain constant is chosen for a
41
fast response while maintaining control stability. Note that the ideal gain constant may
vary based on sampling rates. The product is then subtracted from the maximum average
utilization (1− γ) which is equal to the fraction of cores that can be simultaneously active.
This results in a below average WAC for cores that are aging too fast and an above average
WAC for cores that are aging relatively too slow. At the beginning of each epoch, the WAC
values are updated and passed on to the TCM.
5.2.4 The Reliability Predictor
The SCS requires aging feedback from the hardware. This can be implemented using
aging and error sensors on each core that measure delay degradation and errors. This
information is then converted by the Reliability Predictor into the current reliability levels
r(t).
5.3 The Thread-to-Core Mapper (TCM)
The TCM receives the set of scheduled threads from the OS scheduler and is responsible
for mapping these onto a set of available cores. In the dark silicon era, there are more
processing cores than can be active simultaneously. This means that the TCM has to
determine which cores will be utilized and which will power-gated, remaining inactive. In
doing so, the TCM has two objectives: Sustainability Mapping (SM), and Energy Efficiency
Mapping (EEM), described next.
5.3.1 The Sustainability Mapping (SM) Objective
The TCM utilizes cores in a way that maintains the desired differential reliability profile
using the WAC values provided by the control system. It maintains a record of the utilization
of each core, which is reinitialized at the beginning of each epoch—an arbitrary interval of
time. If the utilization of a core reaches its workload acceptance capacity, that core is locked
and removed from the list of available cores, remaining inactive for the remainder of the
epoch. Sustainability mapping is a proactive way of ensuring symmetric and graceful aging
in the cores, sustaining energy efficiency benefits throughout the system’s lifetime.
42
5.3.2 The Energy Efficiency Mapping (EEM) Objective
The system aims to maximize the energy efficiency by mapping according to software
reliability demands. This avoids the power-performance penalties and overhead that occur
with mismatched mapping. In order to respect reliability levels while optimizing energy
efficiency, the TCM maps each thread to the least reliable available core offering the re-
quested reliability level or higher. However, inherent in a DR system are occasional resource
conflicts when there is an insufficient number of high reliable cores to meet current software
demands. These conflicts decrease with dark silicon but increase with aging.
5.4 Resolving Mapping Objective Conflicts
SM and EEM objectives often conflict. SM policies may wish to deactivate a certain
core to control aging for long-term benefits while EEM policies may wish to utilize that
same core for immediate power-performance benefits. Three approaches that resolve these
mapping conflicts are presented next and then compared and constrasted in Table 5.2.
5.4.1 Sustainability-Oblivious (SO) Mapping
In this method, EEM policies are given precedence, allowing the system to use any set
of cores for the current workload, regardless of the WAC values. (See Algorithm 5.1.)
5.4.2 Sustainability-Controlled (SC) Mapping
For this method, SM policies are given precedence, allowing the TCM to utilize only
those cores that have not yet met their WAC for the current epoch. Cores that reach their
WAC value are power-gated and locked, meaning that they are unavailable for the remainder
of the epoch. (See Algorithm 5.2.)
5.4.3 Sustainability-Aware (SA) Mapping
This method combines SM and EEM policies, allowing the system to utilize a core be-
yond its capacity when the potential power-performance benefit exceeds a certain threshold.
(See Algorithm 5.3.)
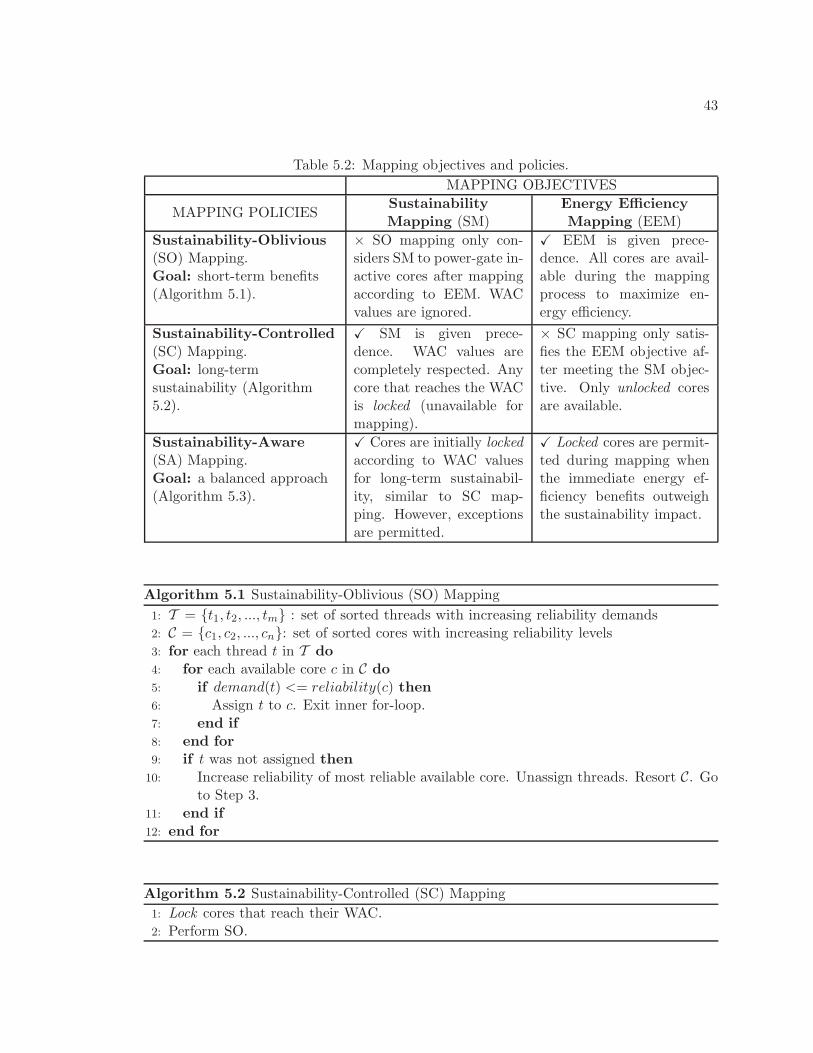
43
Table 5.2: Mapping objectives and policies.
MAPPING OBJECTIVES
MAPPING POLICIESSustainabilityMapping (SM)
Energy EfficiencyMapping (EEM)
Sustainability-Oblivious(SO) Mapping.Goal: short-term benefits(Algorithm 5.1).
× SO mapping only con-siders SM to power-gate in-active cores after mappingaccording to EEM. WACvalues are ignored.
X EEM is given prece-dence. All cores are avail-able during the mappingprocess to maximize en-ergy efficiency.
Sustainability-Controlled(SC) Mapping.Goal: long-termsustainability (Algorithm5.2).
X SM is given prece-dence. WAC values arecompletely respected. Anycore that reaches the WACis locked (unavailable formapping).
× SC mapping only satis-fies the EEM objective af-ter meeting the SM objec-tive. Only unlocked coresare available.
Sustainability-Aware(SA) Mapping.Goal: a balanced approach(Algorithm 5.3).
X Cores are initially lockedaccording to WAC valuesfor long-term sustainabil-ity, similar to SC map-ping. However, exceptionsare permitted.
X Locked cores are permit-ted during mapping whenthe immediate energy ef-ficiency benefits outweighthe sustainability impact.
Algorithm 5.1 Sustainability-Oblivious (SO) Mapping
1: T = {t1, t2, ..., tm} : set of sorted threads with increasing reliability demands2: C = {c1, c2, ..., cn}: set of sorted cores with increasing reliability levels3: for each thread t in T do4: for each available core c in C do5: if demand(t) <= reliability(c) then6: Assign t to c. Exit inner for-loop.7: end if8: end for9: if t was not assigned then
10: Increase reliability of most reliable available core. Unassign threads. Resort C. Goto Step 3.
11: end if12: end for
Algorithm 5.2 Sustainability-Controlled (SC) Mapping
1: Lock cores that reach their WAC.2: Perform SO.
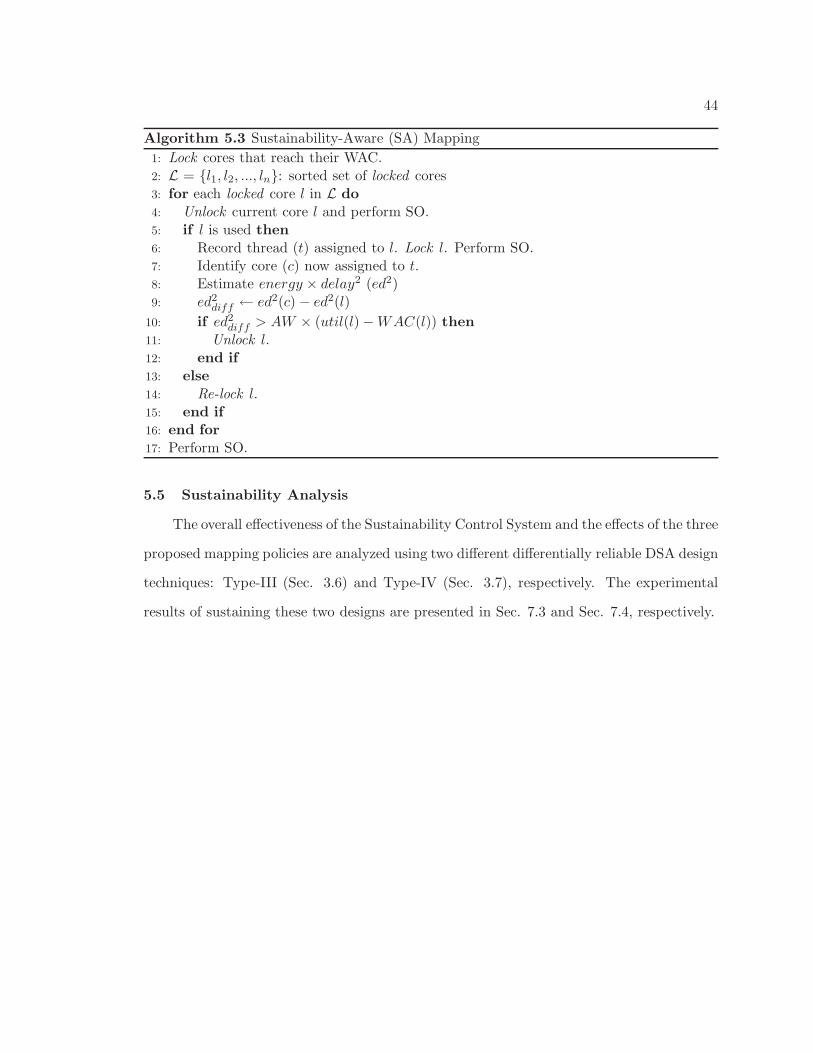
44
Algorithm 5.3 Sustainability-Aware (SA) Mapping
1: Lock cores that reach their WAC.2: L = {l1, l2, ..., ln}: sorted set of locked cores3: for each locked core l in L do4: Unlock current core l and perform SO.5: if l is used then6: Record thread (t) assigned to l. Lock l. Perform SO.7: Identify core (c) now assigned to t.8: Estimate energy × delay2 (ed2)9: ed2
diff ← ed2(c) − ed2(l)
10: if ed2diff > AW × (util(l)−WAC(l)) then
11: Unlock l.12: end if13: else14: Re-lock l.15: end if16: end for17: Perform SO.
5.5 Sustainability Analysis
The overall effectiveness of the Sustainability Control System and the effects of the three
proposed mapping policies are analyzed using two different differentially reliable DSA design
techniques: Type-III (Sec. 3.6) and Type-IV (Sec. 3.7), respectively. The experimental
results of sustaining these two designs are presented in Sec. 7.3 and Sec. 7.4, respectively.
45
Chapter 6
Experimental Methodology
Four types of DSA systems are designed and analyzed to evaluate this work’s proposed
optimization and sustention techniques. This chapter delineates the physical design flow
and architectural simulations that comprise the corresponding experimental methodologies.
6.1 The Design and Optimization of Type-I DSA Systems
Type-I systems are designed with varying voltage-frequency domains (see Sec. 3.4).
The following subsections describe the physical design flow and simulation process of ana-
lyzing these Type-I DSA systems.
6.1.1 Physical Design Flow
The critical datapath and control components of the Alpha 21264 microprocessor [38]
are synthesized to precisely model the power-performance characteristics of the hardware.
This synthesis process uses the RTL available from the Illinois Verilog Model, the Synopsys
Design Compiler, and the 45nm TSMC library. Each of the following components is syn-
thesized: L1 Caches, Scheduler, Register File, and the ALUs (both complex and simple).
Collectively, these components consume bulk of the power in the microprocessor core.
The component are synthesized for several target frequencies using the Synopsys Design
Compiler. Table 6.1 shows the normalized power estimations of the Alpha 21264 processor
components synthesized for the various target frequencies. A larger number of voltage-
frequency design points allows the system to be designed with finer granularity, and thus
more efficiency. Therefore, it would be ideal to have infinitely many possible VF design
points; however, the actual number is limited by design cost and hardware complexity. For
this design process, eight different VF design points are chosen, ranging from 3.5 GHz down
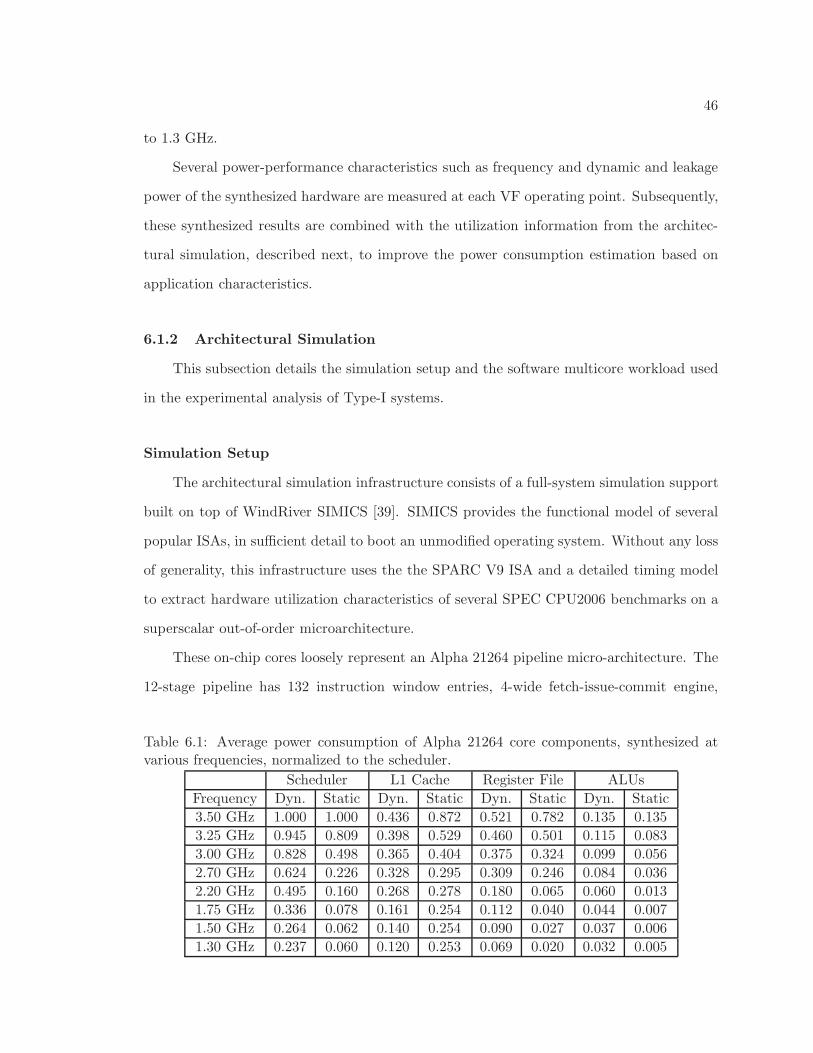
46
to 1.3 GHz.
Several power-performance characteristics such as frequency and dynamic and leakage
power of the synthesized hardware are measured at each VF operating point. Subsequently,
these synthesized results are combined with the utilization information from the architec-
tural simulation, described next, to improve the power consumption estimation based on
application characteristics.
6.1.2 Architectural Simulation
This subsection details the simulation setup and the software multicore workload used
in the experimental analysis of Type-I systems.
Simulation Setup
The architectural simulation infrastructure consists of a full-system simulation support
built on top of WindRiver SIMICS [39]. SIMICS provides the functional model of several
popular ISAs, in sufficient detail to boot an unmodified operating system. Without any loss
of generality, this infrastructure uses the the SPARC V9 ISA and a detailed timing model
to extract hardware utilization characteristics of several SPEC CPU2006 benchmarks on a
superscalar out-of-order microarchitecture.
These on-chip cores loosely represent an Alpha 21264 pipeline micro-architecture. The
12-stage pipeline has 132 instruction window entries, 4-wide fetch-issue-commit engine,
Table 6.1: Average power consumption of Alpha 21264 core components, synthesized atvarious frequencies, normalized to the scheduler.
Scheduler L1 Cache Register File ALUs
Frequency Dyn. Static Dyn. Static Dyn. Static Dyn. Static
3.50 GHz 1.000 1.000 0.436 0.872 0.521 0.782 0.135 0.135
3.25 GHz 0.945 0.809 0.398 0.529 0.460 0.501 0.115 0.083
3.00 GHz 0.828 0.498 0.365 0.404 0.375 0.324 0.099 0.056
2.70 GHz 0.624 0.226 0.328 0.295 0.309 0.246 0.084 0.036
2.20 GHz 0.495 0.160 0.268 0.278 0.180 0.065 0.060 0.013
1.75 GHz 0.336 0.078 0.161 0.254 0.112 0.040 0.044 0.007
1.50 GHz 0.264 0.062 0.140 0.254 0.090 0.027 0.037 0.006
1.30 GHz 0.237 0.060 0.120 0.253 0.069 0.020 0.032 0.005
47
with 64KB 2-way instruction and data caches, respectively. The multicore consists of 16
cores, with a 16 MB backing L2. The pertinent hardware utilization characteristics of
several SPEC CPU2006 benchmarks are collected through cycle accurate simulation of their
representative SimPoint phases [40]. In addition to the nominal frequency, each benchmark
application is simulated at the different frequencies within the range of 3.5-1.3 GHz. Since
the memory is off-chip, it is assumed that with processor clock frequency scaling, memory
latencies do not scale (thus returning data at the same wall-clock time throughout).
Multicore Workload
To efficiently study a wide range of multicore workloads, the simulation framework uses
several SimPoint phases of SPEC CPU2006 applications. Based on their intrinsic charac-
teristics, the chosen workloads demand a range of target frequencies (1.3GHz–3.5GHz) for
their respective optimal energy efficiencies (Energy × Delayλ, where λ=2). The specific
applications used are: gcc, astar, bzip2, dealII, GemsFDTD, gobmk, h264, hmmer, libquan-
tum, mcf, milc, omnetpp, perlbench, povray, sjeng, sphinx3, and xalancbmk. In the 16-core
system, these applications are randomly combined to create a wide pool of workloads.
The optimization process (Chapter 4) uses 1000 workloads in a Monte Carlo simulation,
each comprising a random mix of the SPEC CPU2006 applications. In the final experimental
simulation, each Type-I system is analyzed using four groups of workload sets, each of
consisting of 3000 workloads. These workloads within a given set are uniformly spread
across multiple technology generations, covering the associated range of dark silicon levels.
The first workload set, referred as High, comprises high IPC benchmarks. The second
group consists of medium IPC benchmarks, and hence referred as Medium. The third group,
termed as Low consists of low IPC benchmarks. Finally, the fourth group, termed as Mixed,
comprises benchmarks from all IPC ranges. Overall, each Type-I system in analyzed using
12000 multicore workloads, covering a spectrum of benchmark combinations. Note that
none of the workload sets used for final evaluation match the set chosen for driving the
optimization algorithm.
48
6.2 The Design and Optimization of Type-II DSA Systems
Type-II systems are designed with varying core microarchitectures (see Sec. 3.5). The
following subsections describe the physical design flow and simulation process of analyzing
these Type-II DSA systems.
6.2.1 Physical Design Flow
The FabScalar toolset is used to produce synthesizable RTL designs of the 12 architect-
urally-heterogeneous processing cores proposed by Choudhary et al. [24]. These cores vary
in characteristics such as issue width, pipeline depth, and register file size. Table 6.2 shows
a detailed comparison of the varying design choices for each core.
The different experimental multicore systems are designed using various combinations
of these core types. The static and dynamic power consumption of each of these processing
cores is modeled using the Synopsys Design Compiler, synthesizing each core type with
the FreePDK 45nm standard cell library [41]. This average power consumption data is
combined with the core-level performance data, described next, to accurately model system
energy efficiency using the inverse of the Energy ×Delayλ (λ = 2). Note that any λ may
be used, depending on the desired power versus performance tradeoff. In addition, other
power efficiency metrics (e.g. Energy Per Instruction [42]) may also be used depending on
optimization goals.
6.2.2 Architectural Simulation
This subsection details the simulation setup and the software multicore workload used
to analyze the efficiency of optimizing Type-II DSA systems using the proposed metric and
algorithm.
Simulation Setup
The FabScalar toolset includes a simulation environment using the Cadence NC-Verilog
functional verification tool by employing the Verilog Procedural Interface to combine the
generated RTL with the C++ functional simulator. Using this toolset, the execution of
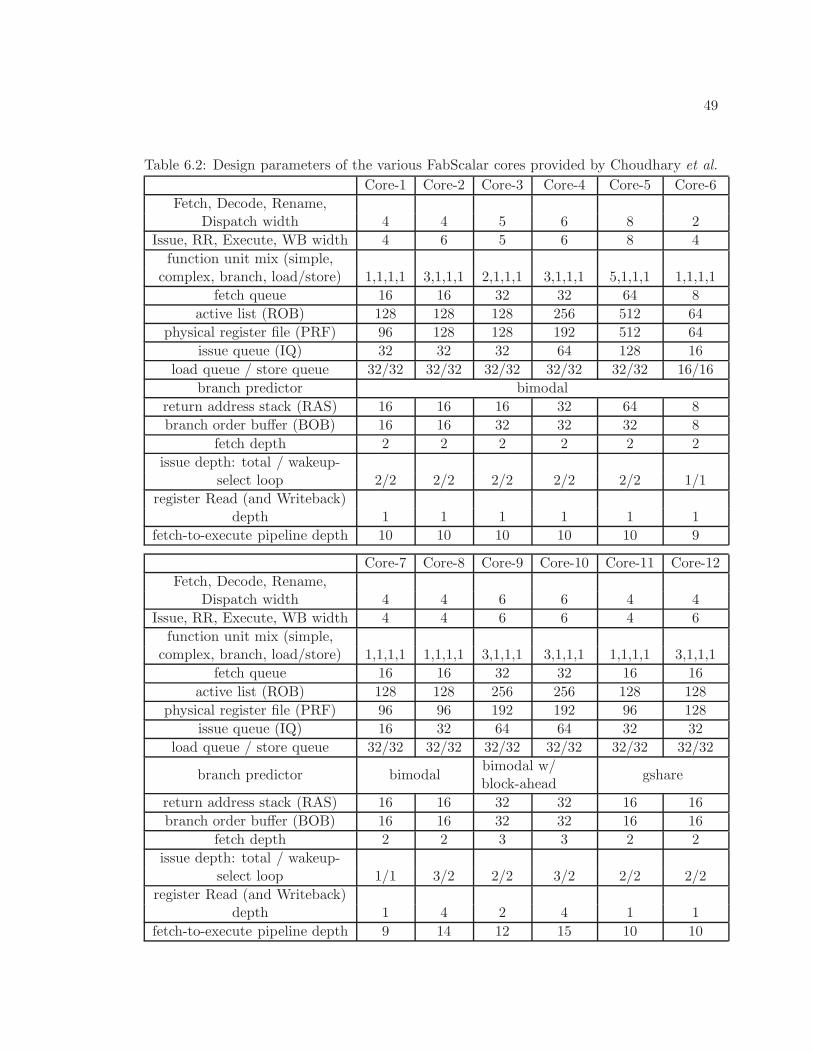
49
Table 6.2: Design parameters of the various FabScalar cores provided by Choudhary et al.
Core-1 Core-2 Core-3 Core-4 Core-5 Core-6
Fetch, Decode, Rename,Dispatch width 4 4 5 6 8 2
Issue, RR, Execute, WB width 4 6 5 6 8 4
function unit mix (simple,complex, branch, load/store) 1,1,1,1 3,1,1,1 2,1,1,1 3,1,1,1 5,1,1,1 1,1,1,1
fetch queue 16 16 32 32 64 8
active list (ROB) 128 128 128 256 512 64
physical register file (PRF) 96 128 128 192 512 64
issue queue (IQ) 32 32 32 64 128 16
load queue / store queue 32/32 32/32 32/32 32/32 32/32 16/16
branch predictor bimodal
return address stack (RAS) 16 16 16 32 64 8
branch order buffer (BOB) 16 16 32 32 32 8
fetch depth 2 2 2 2 2 2
issue depth: total / wakeup-select loop 2/2 2/2 2/2 2/2 2/2 1/1
register Read (and Writeback)depth 1 1 1 1 1 1
fetch-to-execute pipeline depth 10 10 10 10 10 9
Core-7 Core-8 Core-9 Core-10 Core-11 Core-12
Fetch, Decode, Rename,Dispatch width 4 4 6 6 4 4
Issue, RR, Execute, WB width 4 4 6 6 4 6
function unit mix (simple,complex, branch, load/store) 1,1,1,1 1,1,1,1 3,1,1,1 3,1,1,1 1,1,1,1 3,1,1,1
fetch queue 16 16 32 32 16 16
active list (ROB) 128 128 256 256 128 128
physical register file (PRF) 96 96 192 192 96 128
issue queue (IQ) 16 32 64 64 32 32
load queue / store queue 32/32 32/32 32/32 32/32 32/32 32/32
branch predictor bimodalbimodal w/block-ahead
gshare
return address stack (RAS) 16 16 32 32 16 16
branch order buffer (BOB) 16 16 32 32 16 16
fetch depth 2 2 3 3 2 2
issue depth: total / wakeup-select loop 1/1 3/2 2/2 3/2 2/2 2/2
register Read (and Writeback)depth 1 4 2 4 1 1
fetch-to-execute pipeline depth 9 14 12 15 10 10
50
several SPEC2000 integer benchmarks is simulated on each of the 12 processing cores.
Each simulation is run for 10 million instructions with several SimPoint phases to accurately
measure the performance of each benchmark on each core type.
Multicore Workload
The specific SPEC2000 applications used are: bzip, gap, gzip, mch, parser, and vortex.
These applications are randomly combined into workload sets to create a pool of workloads.
One thousand of these workloads are used in the iterations of the optimization design process
and 3000 more are used in the final experimental analysis of each Type-II system.
6.3 The Design and Sustention of Type-III DSA Systems
Type-III systems are designed with Differential Reliability (DR) through varying de-
grees of core-level voltage upscaling (see Sec. 3.6). Several Type-III systems are simulated
over the lifetime of the chip to evaluate the Sustainability Control System (SCS) and the as-
sociated mapping policies presented in Chapter 5. The experimental methodology includes
a physical design tool flow to acquire circuit timing characteristics coupled with device-level
aging models and the performance characteristics of cycle-accurate architectural simulation.
6.3.1 Modeling Differential Reliability
Maintaining high supply voltages is a common method of avoiding timing violations.
Low-reliable cores avoid upscaled voltages by permitting occasional errors. If a low reliable
core is forced to execute a thread demanding a higher reliability, it must compensate for
the discrepancy. These Type-III systems scale down the frequency to lower the error rate
when necessary.
6.3.2 Hardware Aging Model
Process variation and circuit aging create a distribution of propagation delays. Using
Synopsis HSPICE, PV and NBTI analysis is performed with Predictive Technology Models
[43]. On each gate, 1000 Monte Carlo simulations are run to determine the gate delay
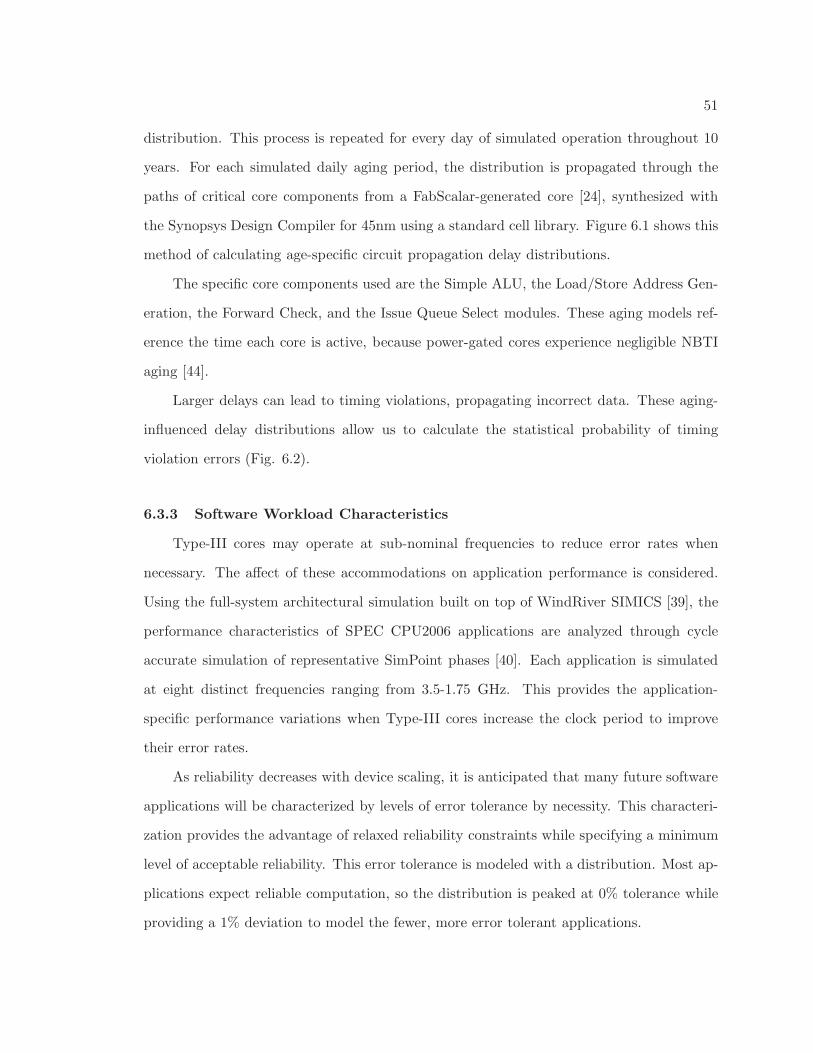
51
distribution. This process is repeated for every day of simulated operation throughout 10
years. For each simulated daily aging period, the distribution is propagated through the
paths of critical core components from a FabScalar-generated core [24], synthesized with
the Synopsys Design Compiler for 45nm using a standard cell library. Figure 6.1 shows this
method of calculating age-specific circuit propagation delay distributions.
The specific core components used are the Simple ALU, the Load/Store Address Gen-
eration, the Forward Check, and the Issue Queue Select modules. These aging models ref-
erence the time each core is active, because power-gated cores experience negligible NBTI
aging [44].
Larger delays can lead to timing violations, propagating incorrect data. These aging-
influenced delay distributions allow us to calculate the statistical probability of timing
violation errors (Fig. 6.2).
6.3.3 Software Workload Characteristics
Type-III cores may operate at sub-nominal frequencies to reduce error rates when
necessary. The affect of these accommodations on application performance is considered.
Using the full-system architectural simulation built on top of WindRiver SIMICS [39], the
performance characteristics of SPEC CPU2006 applications are analyzed through cycle
accurate simulation of representative SimPoint phases [40]. Each application is simulated
at eight distinct frequencies ranging from 3.5-1.75 GHz. This provides the application-
specific performance variations when Type-III cores increase the clock period to improve
their error rates.
As reliability decreases with device scaling, it is anticipated that many future software
applications will be characterized by levels of error tolerance by necessity. This characteri-
zation provides the advantage of relaxed reliability constraints while specifying a minimum
level of acceptable reliability. This error tolerance is modeled with a distribution. Most ap-
plications expect reliable computation, so the distribution is peaked at 0% tolerance while
providing a 1% deviation to model the fewer, more error tolerant applications.
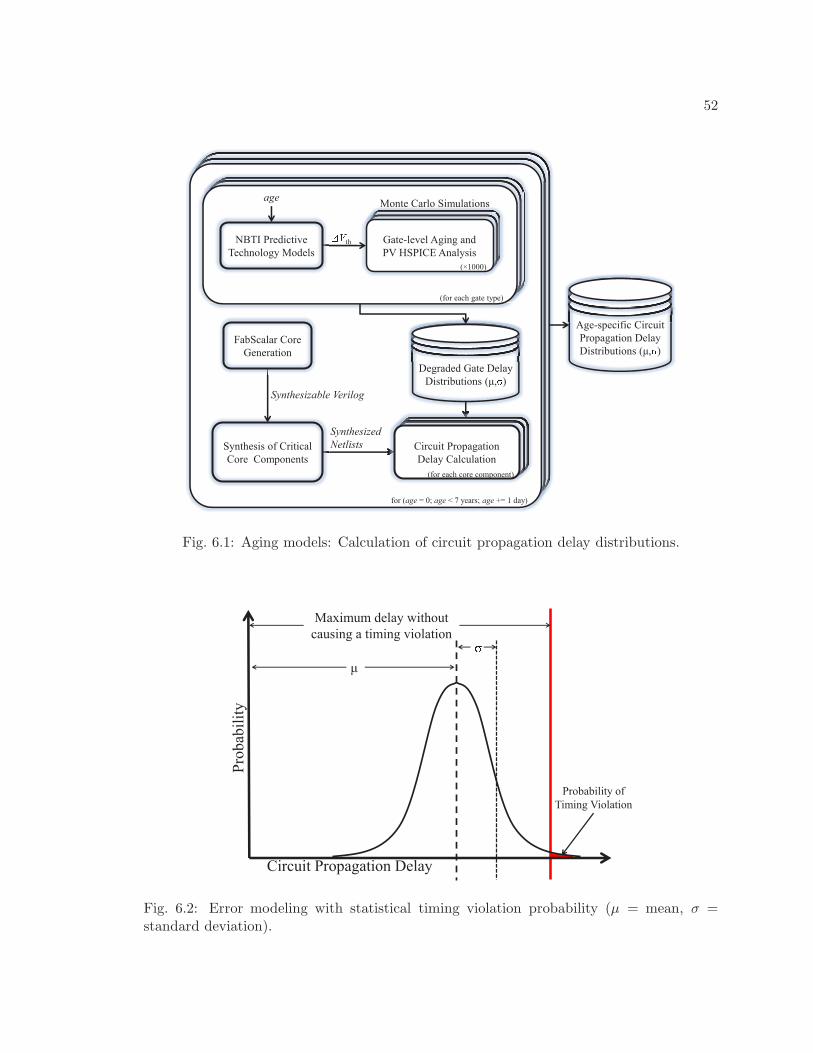
52
Synthesized
Netlists
Gate-level Aging and
PV HSPICE Analysis
Monte Carlo Simulations
��th
Synthesis of Critical
Core Components
FabScalar Core
Generation
Synthesizable Verilog
Age-specific Circuit
Propagation Delay
Distributions (�,�)
A iiffii Ci it
NBTI Predictive
Technology Models
age
for (age = 0; age < 7 years; age += 1 day)
Degraded Gate Delay
Distributions (�,�)
(for each gate type)
(×1000)
Circuit Propagation
Delay Calculation
(for each core component)
Fig. 6.1: Aging models: Calculation of circuit propagation delay distributions.
Pro
bab
ilit
y
Circuit Propagation Delay
�
Maximum delay without
causing a timing violation
Probability of
Timing Violation
Fig. 6.2: Error modeling with statistical timing violation probability (µ = mean, σ =standard deviation).
53
6.3.4 Simulation Setup
The simulations cover 10 years of operation at several upcoming dark silicon levels
using each discussed mapping policy. As an outside comparison, an additional mapping
policy is implemented, one loosely correlated with the recently proposed Race-to-Idle (RI)
core selection technique which uses computation sprinting to provide cores with periodic
intervals of recovery to maximize MTTF [45]. The race-to-idle policy represents the absence
of the Sustainability Control System, but is still allowed the power efficiency benefits of
approximate computing to provide a fair comparison.
Core-level utilization is interpolated between the one-day increments for practical simu-
lation time. Each one-day increment throughout the 10-year lifetime includes 1000 workload
simulations. At each increment, core-level utilization data is used to calculate circuit aging
and update each core’s reliability level.
Specific software applications used are: astar, bzip2, dealII, gcc, GemsFDTD, gobmk,
h264, hmmer, libquantum, mcf, milc, omnetpp, perlbench, povray, sjeng, sphinx3, and
xalancbmk. Multiprogramming workloads are represented as randomized collections of
threads from these benchmarks.1
6.4 The Design and Sustention of Type-IV DSA Systems
Type-IV systems are designed with modified RAZOR circuitry to allow an error rate
that is acceptable to the currently executing software thread (see Sec. 3.7). The hardware
aging models and simulation setup are the same as in Type-III systems, and are therefore
not included here. This section includes the methodology modifications that are used to
simulate Type-IV systems.
6.4.1 Modeling Differential Reliability
Instruction replays are triggered for only a portion of all errors, depending on the re-
liability level of the executing thread. While all cores are identically designed, they are
1Multithreaded applications are also suitable representative workloads. However analyzing the affectof heterogeneity on multithreaded programs is a separate research issue that has been extensively coveredelsewhere and is not within the scope of this work.
54
assigned varying target reliability levels that are used to shape the relative differential relia-
bility profile of the system. The SCS systematically ages cores accordingly. As asymmetric
aging is guided, the resulting heterogeneity can be exploited by dark silicon to mask errors
and avoid instruction replays.
6.4.2 Software Workload Characteristics
Because Type-IV cores may adjust the portion of errors that pass without triggering
an instruction replay, there is an affect on performance and power consumption. Each
SPEC CPU2006 application benchmark is also simulated while incurring pipeline penalties
of eight distinct instruction replay rates, ranging from 0% (no replays) to 12.5%. Depending
on the currently executing thread and the degree of circuit aging, each Type-IV core triggers
sufficient instruction replays to respect the specified software reliability level.
55
Chapter 7
Experimental Results
This chapter presents the results of optimizing Type-I (Sec. 7.1) and Type-II (Sec. 7.2)
DSA systems and of sustaining Type-III (Sec. 7.3) and Type-IV (Sec. 7.4) DSA systems.
7.1 Results of Optimizing Variable VF Domain (Type-I) DSA Systems
Type-I DSA systems are optimized for specific ranges of dark silicon. First, the op-
timized VF Domains are presented (Sec. 7.1.1). Then, the remaining sections present
the several metrics used to compare the various Type-I systems, including average energy
efficiency (Sec. 7.1.2), 80% yield energy efficiency (Sec. 7.1.3), throughput (Sec. 7.1.4),
and reliability metrics (Sec. 7.1.5). The methodology for these experiments was detailed
previously in Sec. 6.1.
7.1.1 Core Configurations
The optimization process presented in Chapter 4 is used to optimize two Type-I vary-
ing VF domain designs: one for near-term technology generations, with dark silicon ranging
from 12.5% to 37.5%, and the other for long-term technology generations, with dark silicon
ranging from 50.0% to 75.0%. These two systems, DSA-near and DSA-long are compared
with a conventional, homogeneous system and two other Type-I systems (System A and Sys-
tem B) with core configurations chosen ad-hoc, rather than with the optimization process.
The core configurations of each system is presented in Table 7.1.
7.1.2 Average Energy Efficiency
Figure 7.1 and Fig. 7.2 show the average energy efficiency in the near term and long
term, respectively, normalized to the conventional system. Observe that in the near term,
the optimized DSA design consistently out-performs all other schemes across a range of
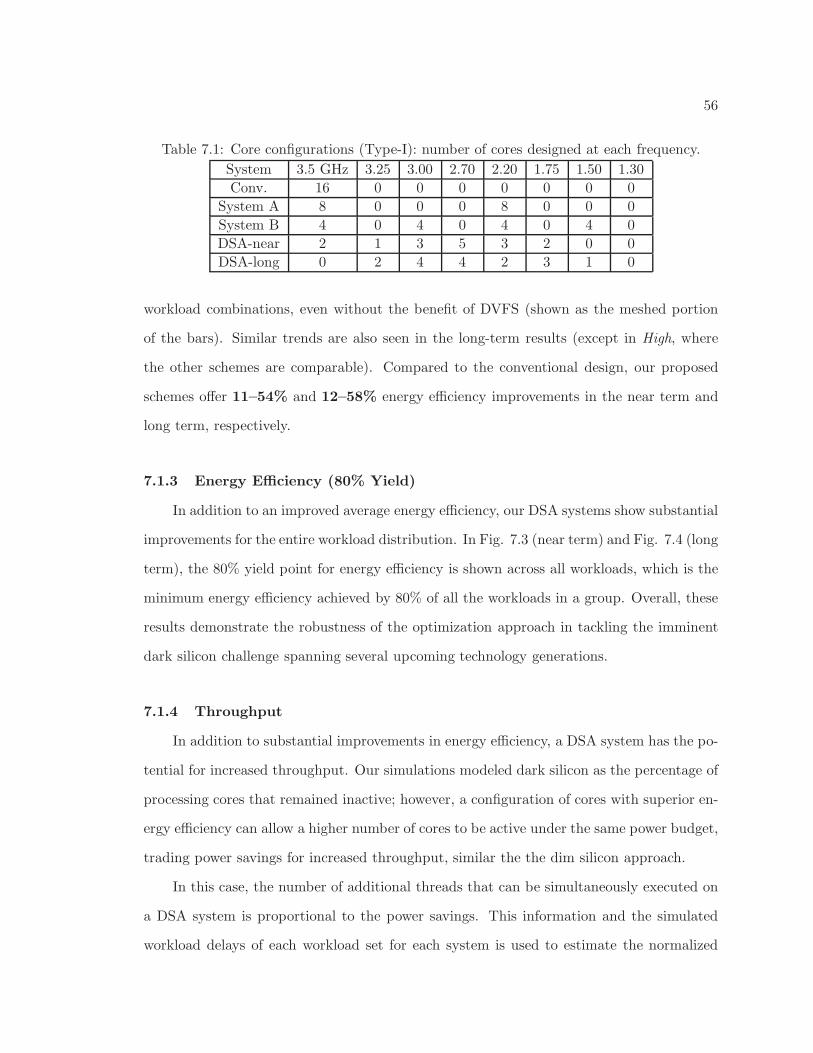
56
Table 7.1: Core configurations (Type-I): number of cores designed at each frequency.
System 3.5 GHz 3.25 3.00 2.70 2.20 1.75 1.50 1.30
Conv. 16 0 0 0 0 0 0 0
System A 8 0 0 0 8 0 0 0
System B 4 0 4 0 4 0 4 0
DSA-near 2 1 3 5 3 2 0 0
DSA-long 0 2 4 4 2 3 1 0
workload combinations, even without the benefit of DVFS (shown as the meshed portion
of the bars). Similar trends are also seen in the long-term results (except in High, where
the other schemes are comparable). Compared to the conventional design, our proposed
schemes offer 11–54% and 12–58% energy efficiency improvements in the near term and
long term, respectively.
7.1.3 Energy Efficiency (80% Yield)
In addition to an improved average energy efficiency, our DSA systems show substantial
improvements for the entire workload distribution. In Fig. 7.3 (near term) and Fig. 7.4 (long
term), the 80% yield point for energy efficiency is shown across all workloads, which is the
minimum energy efficiency achieved by 80% of all the workloads in a group. Overall, these
results demonstrate the robustness of the optimization approach in tackling the imminent
dark silicon challenge spanning several upcoming technology generations.
7.1.4 Throughput
In addition to substantial improvements in energy efficiency, a DSA system has the po-
tential for increased throughput. Our simulations modeled dark silicon as the percentage of
processing cores that remained inactive; however, a configuration of cores with superior en-
ergy efficiency can allow a higher number of cores to be active under the same power budget,
trading power savings for increased throughput, similar the the dim silicon approach.
In this case, the number of additional threads that can be simultaneously executed on
a DSA system is proportional to the power savings. This information and the simulated
workload delays of each workload set for each system is used to estimate the normalized
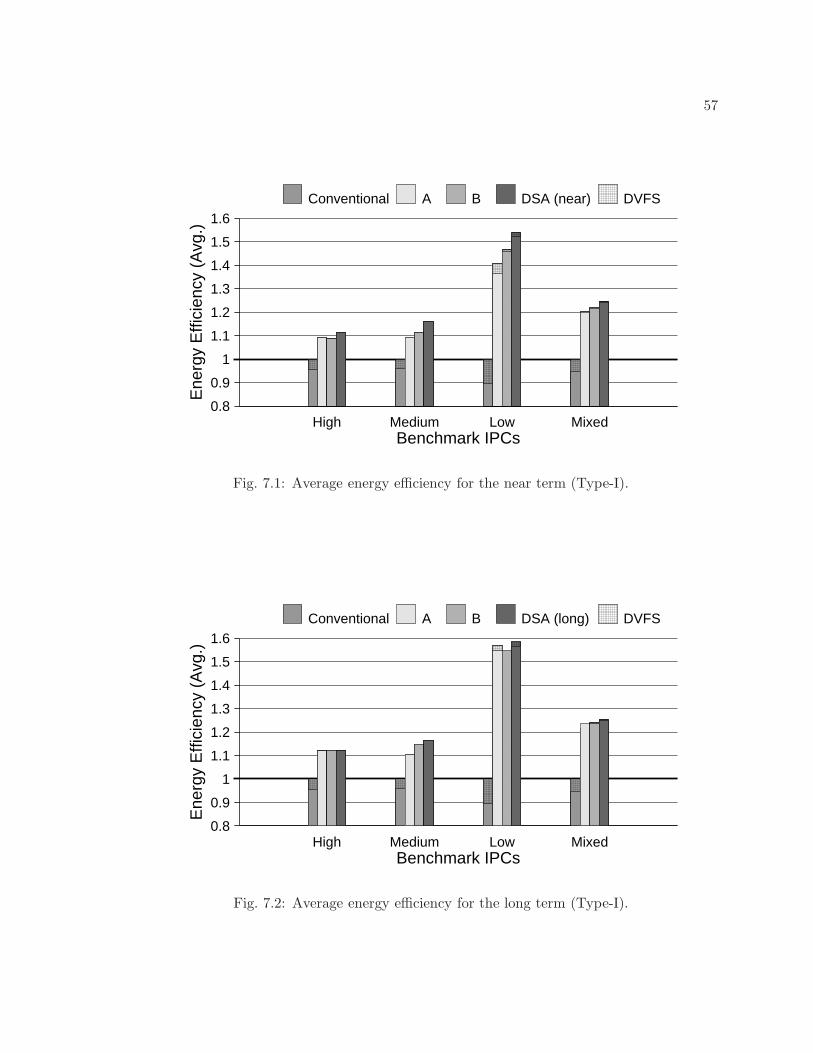
57
0.8
0.9
1
1.1
1.2
1.3
1.4
1.5
1.6
Ene
rgy
Effi
cien
cy (
Avg
.)
Benchmark IPCsHigh Medium Low Mixed
Conventional A B DSA (near) DVFS
Fig. 7.1: Average energy efficiency for the near term (Type-I).
0.8
0.9
1
1.1
1.2
1.3
1.4
1.5
1.6
Ene
rgy
Effi
cien
cy (
Avg
.)
Benchmark IPCsHigh Medium Low Mixed
Conventional A B DSA (long) DVFS
Fig. 7.2: Average energy efficiency for the long term (Type-I).
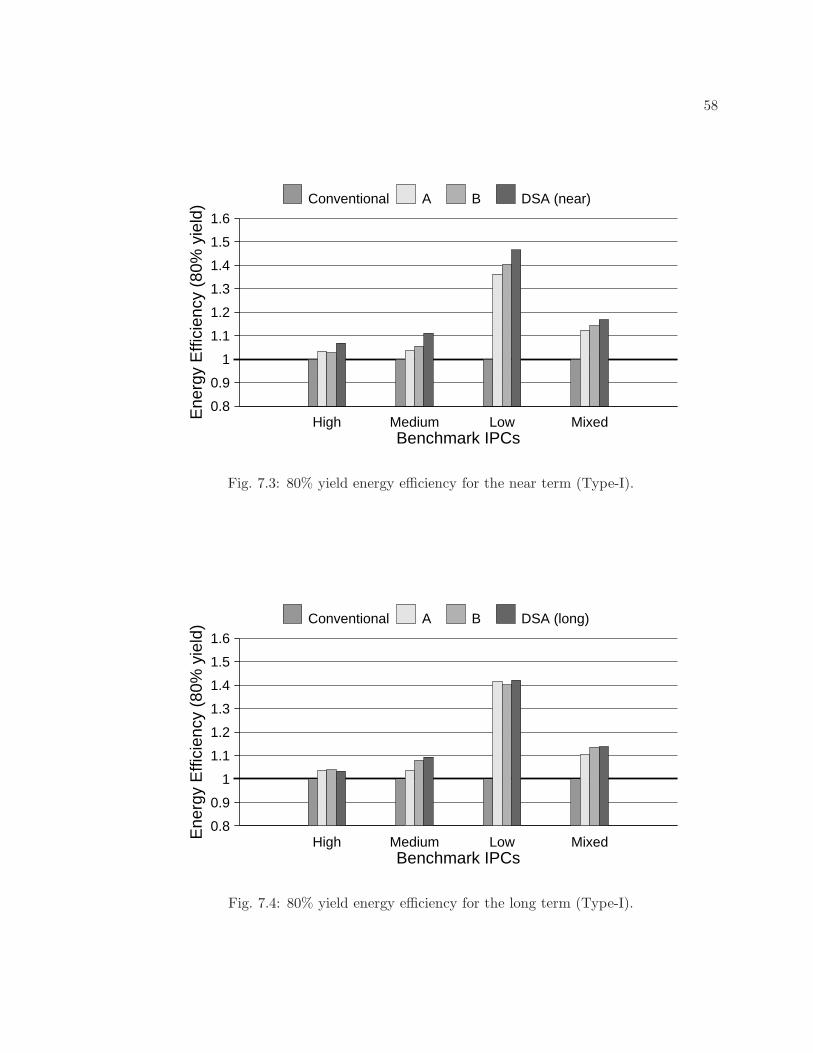
58
0.8
0.9
1
1.1
1.2
1.3
1.4
1.5
1.6
Ene
rgy
Effi
cien
cy (
80%
yie
ld)
Benchmark IPCsHigh Medium Low Mixed
Conventional A B DSA (near)
Fig. 7.3: 80% yield energy efficiency for the near term (Type-I).
0.8
0.9
1
1.1
1.2
1.3
1.4
1.5
1.6
Ene
rgy
Effi
cien
cy (
80%
yie
ld)
Benchmark IPCsHigh Medium Low Mixed
Conventional A B DSA (long)
Fig. 7.4: 80% yield energy efficiency for the long term (Type-I).
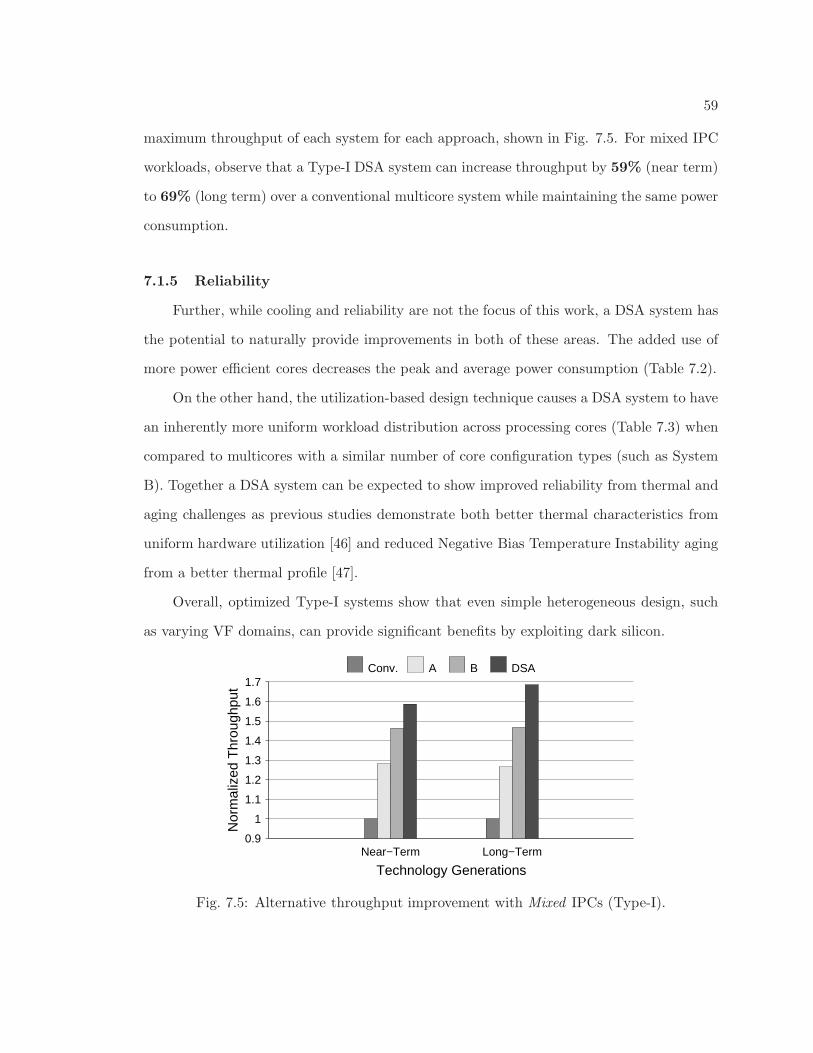
59
maximum throughput of each system for each approach, shown in Fig. 7.5. For mixed IPC
workloads, observe that a Type-I DSA system can increase throughput by 59% (near term)
to 69% (long term) over a conventional multicore system while maintaining the same power
consumption.
7.1.5 Reliability
Further, while cooling and reliability are not the focus of this work, a DSA system has
the potential to naturally provide improvements in both of these areas. The added use of
more power efficient cores decreases the peak and average power consumption (Table 7.2).
On the other hand, the utilization-based design technique causes a DSA system to have
an inherently more uniform workload distribution across processing cores (Table 7.3) when
compared to multicores with a similar number of core configuration types (such as System
B). Together a DSA system can be expected to show improved reliability from thermal and
aging challenges as previous studies demonstrate both better thermal characteristics from
uniform hardware utilization [46] and reduced Negative Bias Temperature Instability aging
from a better thermal profile [47].
Overall, optimized Type-I systems show that even simple heterogeneous design, such
as varying VF domains, can provide significant benefits by exploiting dark silicon.
0.9
1
1.1
1.2
1.3
1.4
1.5
1.6
1.7
Nor
mal
ized
Thr
ough
put
Technology GenerationsNear−Term Long−Term
Conv. A B DSA
Fig. 7.5: Alternative throughput improvement with Mixed IPCs (Type-I).
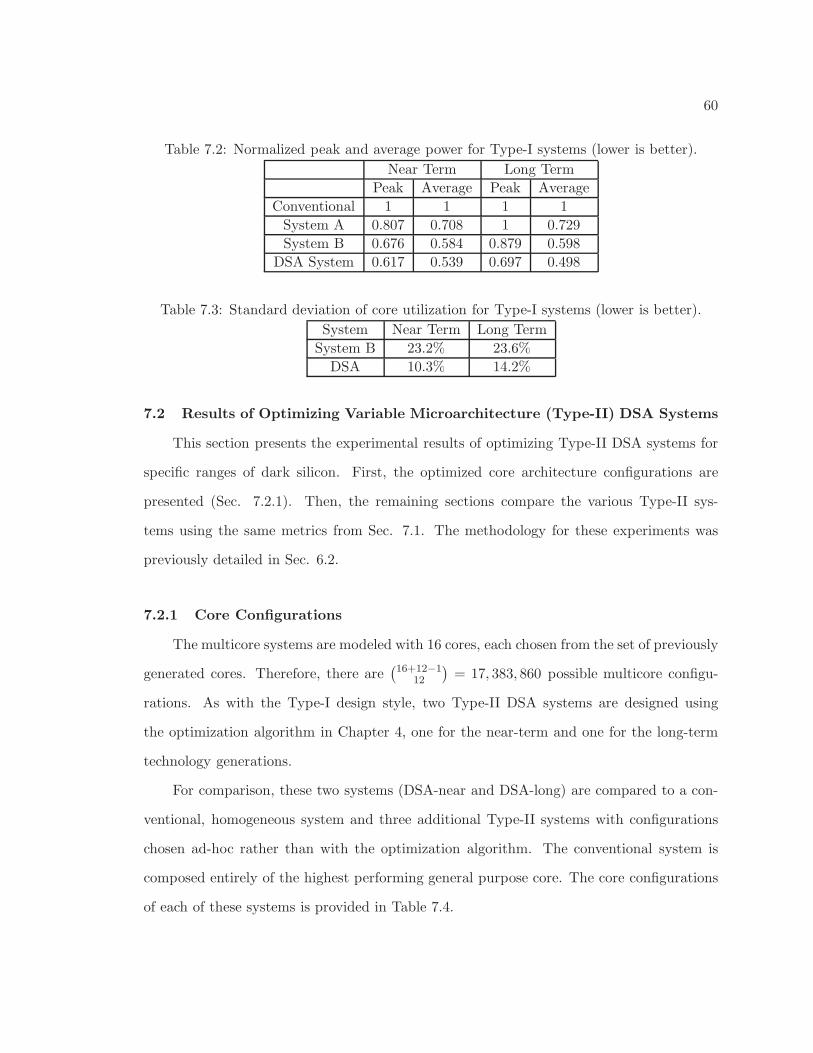
60
Table 7.2: Normalized peak and average power for Type-I systems (lower is better).
Near Term Long Term
Peak Average Peak Average
Conventional 1 1 1 1
System A 0.807 0.708 1 0.729
System B 0.676 0.584 0.879 0.598
DSA System 0.617 0.539 0.697 0.498
Table 7.3: Standard deviation of core utilization for Type-I systems (lower is better).
System Near Term Long Term
System B 23.2% 23.6%
DSA 10.3% 14.2%
7.2 Results of Optimizing Variable Microarchitecture (Type-II) DSA Systems
This section presents the experimental results of optimizing Type-II DSA systems for
specific ranges of dark silicon. First, the optimized core architecture configurations are
presented (Sec. 7.2.1). Then, the remaining sections compare the various Type-II sys-
tems using the same metrics from Sec. 7.1. The methodology for these experiments was
previously detailed in Sec. 6.2.
7.2.1 Core Configurations
The multicore systems are modeled with 16 cores, each chosen from the set of previously
generated cores. Therefore, there are(
16+12−1
12
)
= 17, 383, 860 possible multicore configu-
rations. As with the Type-I design style, two Type-II DSA systems are designed using
the optimization algorithm in Chapter 4, one for the near-term and one for the long-term
technology generations.
For comparison, these two systems (DSA-near and DSA-long) are compared to a con-
ventional, homogeneous system and three additional Type-II systems with configurations
chosen ad-hoc rather than with the optimization algorithm. The conventional system is
composed entirely of the highest performing general purpose core. The core configurations
of each of these systems is provided in Table 7.4.
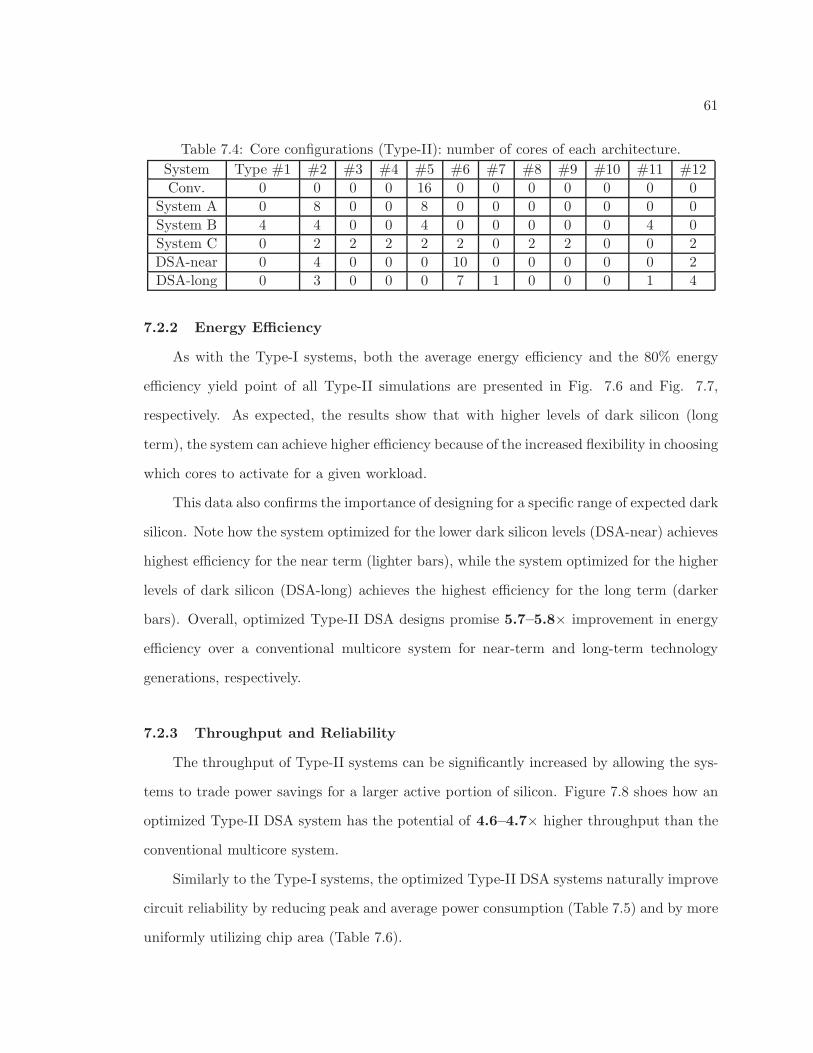
61
Table 7.4: Core configurations (Type-II): number of cores of each architecture.
System Type #1 #2 #3 #4 #5 #6 #7 #8 #9 #10 #11 #12
Conv. 0 0 0 0 16 0 0 0 0 0 0 0
System A 0 8 0 0 8 0 0 0 0 0 0 0
System B 4 4 0 0 4 0 0 0 0 0 4 0
System C 0 2 2 2 2 2 0 2 2 0 0 2
DSA-near 0 4 0 0 0 10 0 0 0 0 0 2
DSA-long 0 3 0 0 0 7 1 0 0 0 1 4
7.2.2 Energy Efficiency
As with the Type-I systems, both the average energy efficiency and the 80% energy
efficiency yield point of all Type-II simulations are presented in Fig. 7.6 and Fig. 7.7,
respectively. As expected, the results show that with higher levels of dark silicon (long
term), the system can achieve higher efficiency because of the increased flexibility in choosing
which cores to activate for a given workload.
This data also confirms the importance of designing for a specific range of expected dark
silicon. Note how the system optimized for the lower dark silicon levels (DSA-near) achieves
highest efficiency for the near term (lighter bars), while the system optimized for the higher
levels of dark silicon (DSA-long) achieves the highest efficiency for the long term (darker
bars). Overall, optimized Type-II DSA designs promise 5.7–5.8× improvement in energy
efficiency over a conventional multicore system for near-term and long-term technology
generations, respectively.
7.2.3 Throughput and Reliability
The throughput of Type-II systems can be significantly increased by allowing the sys-
tems to trade power savings for a larger active portion of silicon. Figure 7.8 shoes how an
optimized Type-II DSA system has the potential of 4.6–4.7× higher throughput than the
conventional multicore system.
Similarly to the Type-I systems, the optimized Type-II DSA systems naturally improve
circuit reliability by reducing peak and average power consumption (Table 7.5) and by more
uniformly utilizing chip area (Table 7.6).
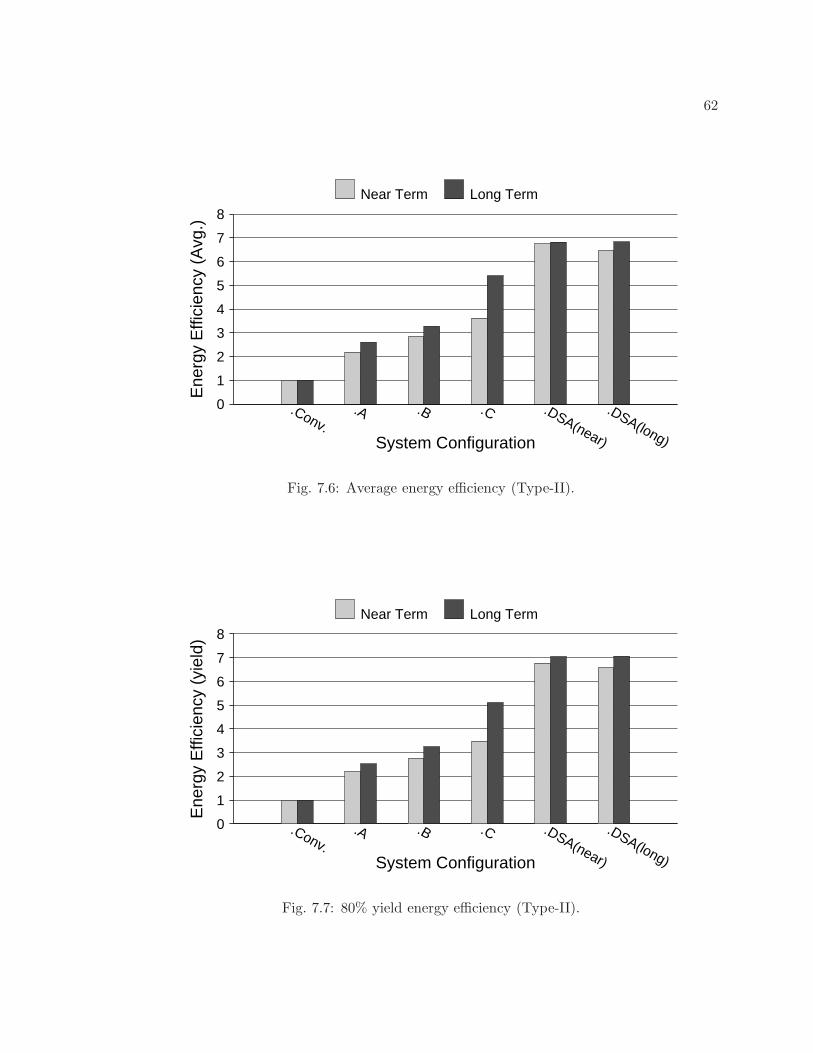
62
0
1
2
3
4
5
6
7
8E
nerg
y E
ffici
ency
(A
vg.)
System Configuration
.Conv..A .B .C .DSA(near)
.DSA(long)
Near Term Long Term
Fig. 7.6: Average energy efficiency (Type-II).
0
1
2
3
4
5
6
7
8
Ene
rgy
Effi
cien
cy (
yiel
d)
System Configuration
.Conv..A .B .C .DSA(near)
.DSA(long)
Near Term Long Term
Fig. 7.7: 80% yield energy efficiency (Type-II).
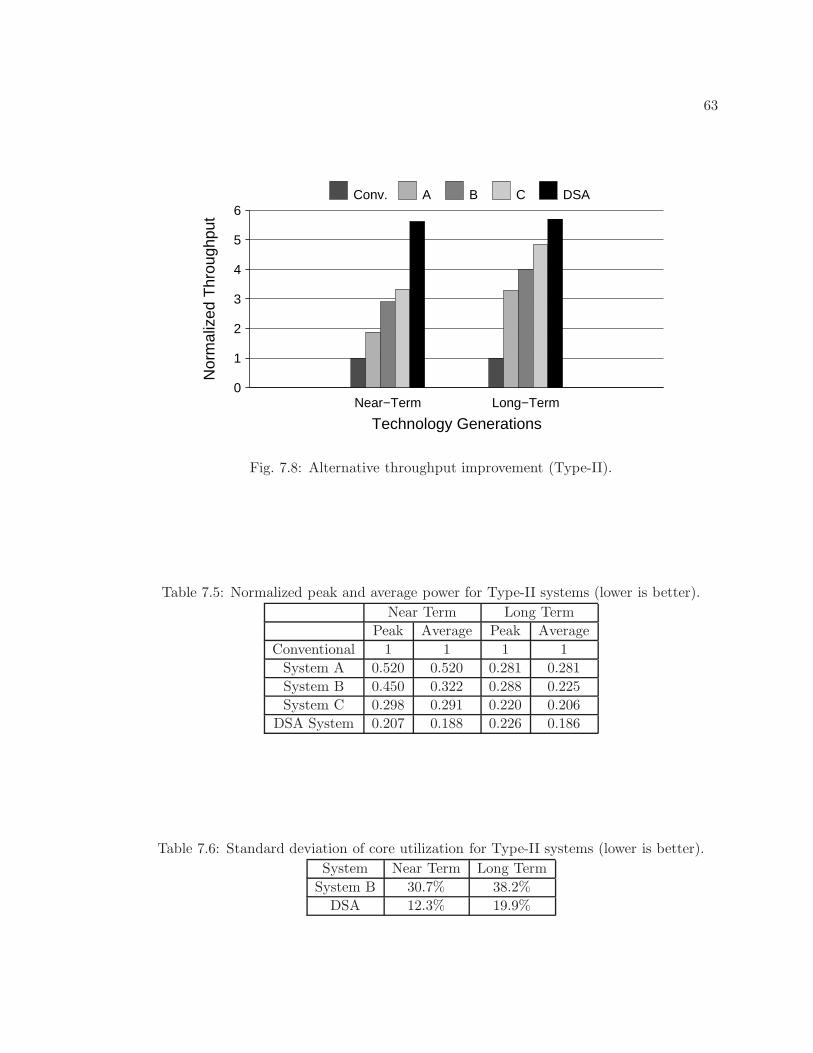
63
0
1
2
3
4
5
6N
orm
aliz
ed T
hrou
ghpu
t
Technology GenerationsNear−Term Long−Term
Conv. A B C DSA
Fig. 7.8: Alternative throughput improvement (Type-II).
Table 7.5: Normalized peak and average power for Type-II systems (lower is better).
Near Term Long Term
Peak Average Peak Average
Conventional 1 1 1 1
System A 0.520 0.520 0.281 0.281
System B 0.450 0.322 0.288 0.225
System C 0.298 0.291 0.220 0.206
DSA System 0.207 0.188 0.226 0.186
Table 7.6: Standard deviation of core utilization for Type-II systems (lower is better).
System Near Term Long Term
System B 30.7% 38.2%
DSA 12.3% 19.9%
64
Overall, the results of optimized Type-II DSA systems show how microarchitecture
heterogeneity can provide substantial improvements through dark silicon exploitation.
7.3 Results of Sustaining Voltage Upscaling Differentially Reliable (Type-III)
DSA Systems
This section presents the results of the experimental analysis of sustaining Type-III
systems throughout the lifetime of the chip. The core configurations (Sec. 7.3.1) and
simulated results (Sec. 7.3.2) are provided to compare the various proposed mapping policies
within the Sustainability Control System. Refer to Sec. 6.3 for the methodology used to
obtaining these results.
7.3.1 Hardware Configurations
Three Type-III systems (A, B, and C) are simulated and compared them with a conven-
tional, error-intolerant homogeneous system (H) that employs round-robin mapping. (See
Table 7.7.)
7.3.2 Lifetime Average Energy Efficiency
Energy efficiency is measured as the inverse of Energy×Delayλ(λ = 2), averaged over
the 10-year system lifetime. Values are normalized to the homogeneous system (H). Figure
7.9 compares the various mapping policies on each Type-III system at various dark silicon
levels. System A, which had the most diverse reliability profile, consistently achieved a
higher efficiency than the other systems.
The sustainability-controlled and sustainability-aware mapping techniques results in
significantly higher efficiency than the sustainability-oblivious and race-to-idle techniques.
This observation is especially true for the larger, more severe dark silicon constraints. Both
SO and RI mapping fail to sustain an equal advantage because they disregard the sustain-
ability mapping objective for immediate power-performance and MTTF benefits, respec-
tively.
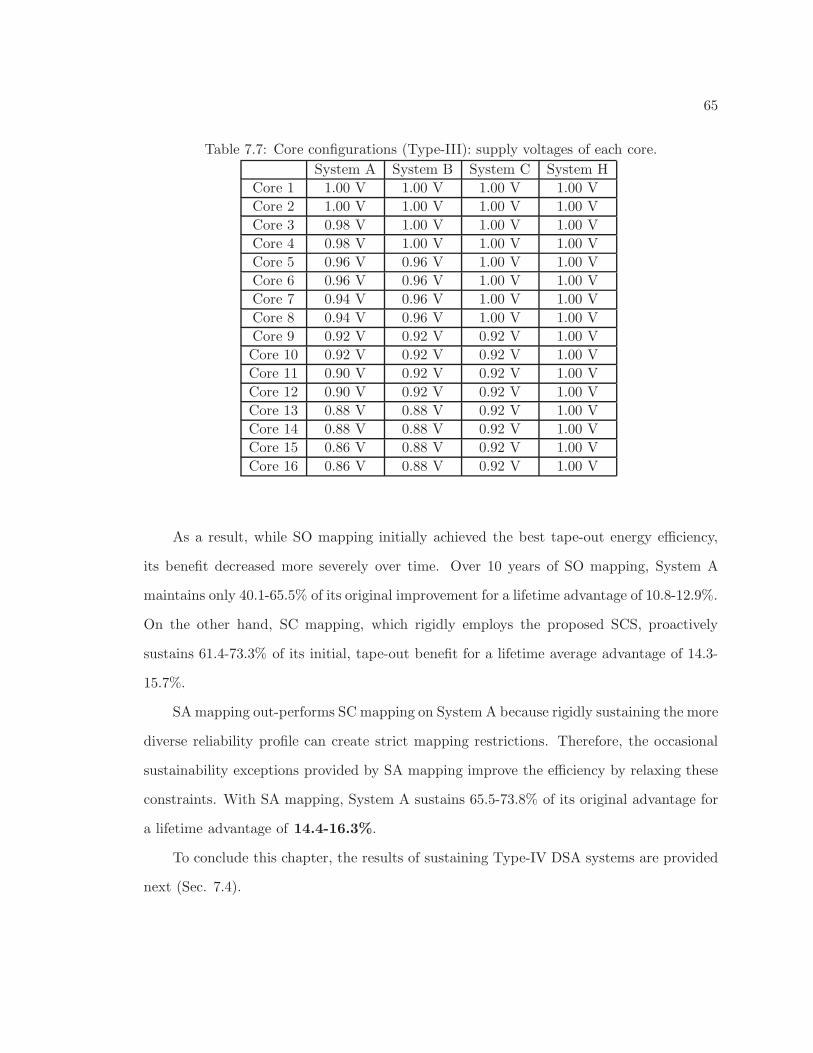
65
Table 7.7: Core configurations (Type-III): supply voltages of each core.
System A System B System C System H
Core 1 1.00 V 1.00 V 1.00 V 1.00 V
Core 2 1.00 V 1.00 V 1.00 V 1.00 V
Core 3 0.98 V 1.00 V 1.00 V 1.00 V
Core 4 0.98 V 1.00 V 1.00 V 1.00 V
Core 5 0.96 V 0.96 V 1.00 V 1.00 V
Core 6 0.96 V 0.96 V 1.00 V 1.00 V
Core 7 0.94 V 0.96 V 1.00 V 1.00 V
Core 8 0.94 V 0.96 V 1.00 V 1.00 V
Core 9 0.92 V 0.92 V 0.92 V 1.00 V
Core 10 0.92 V 0.92 V 0.92 V 1.00 V
Core 11 0.90 V 0.92 V 0.92 V 1.00 V
Core 12 0.90 V 0.92 V 0.92 V 1.00 V
Core 13 0.88 V 0.88 V 0.92 V 1.00 V
Core 14 0.88 V 0.88 V 0.92 V 1.00 V
Core 15 0.86 V 0.88 V 0.92 V 1.00 V
Core 16 0.86 V 0.88 V 0.92 V 1.00 V
As a result, while SO mapping initially achieved the best tape-out energy efficiency,
its benefit decreased more severely over time. Over 10 years of SO mapping, System A
maintains only 40.1-65.5% of its original improvement for a lifetime advantage of 10.8-12.9%.
On the other hand, SC mapping, which rigidly employs the proposed SCS, proactively
sustains 61.4-73.3% of its initial, tape-out benefit for a lifetime average advantage of 14.3-
15.7%.
SA mapping out-performs SC mapping on System A because rigidly sustaining the more
diverse reliability profile can create strict mapping restrictions. Therefore, the occasional
sustainability exceptions provided by SA mapping improve the efficiency by relaxing these
constraints. With SA mapping, System A sustains 65.5-73.8% of its original advantage for
a lifetime advantage of 14.4-16.3%.
To conclude this chapter, the results of sustaining Type-IV DSA systems are provided
next (Sec. 7.4).
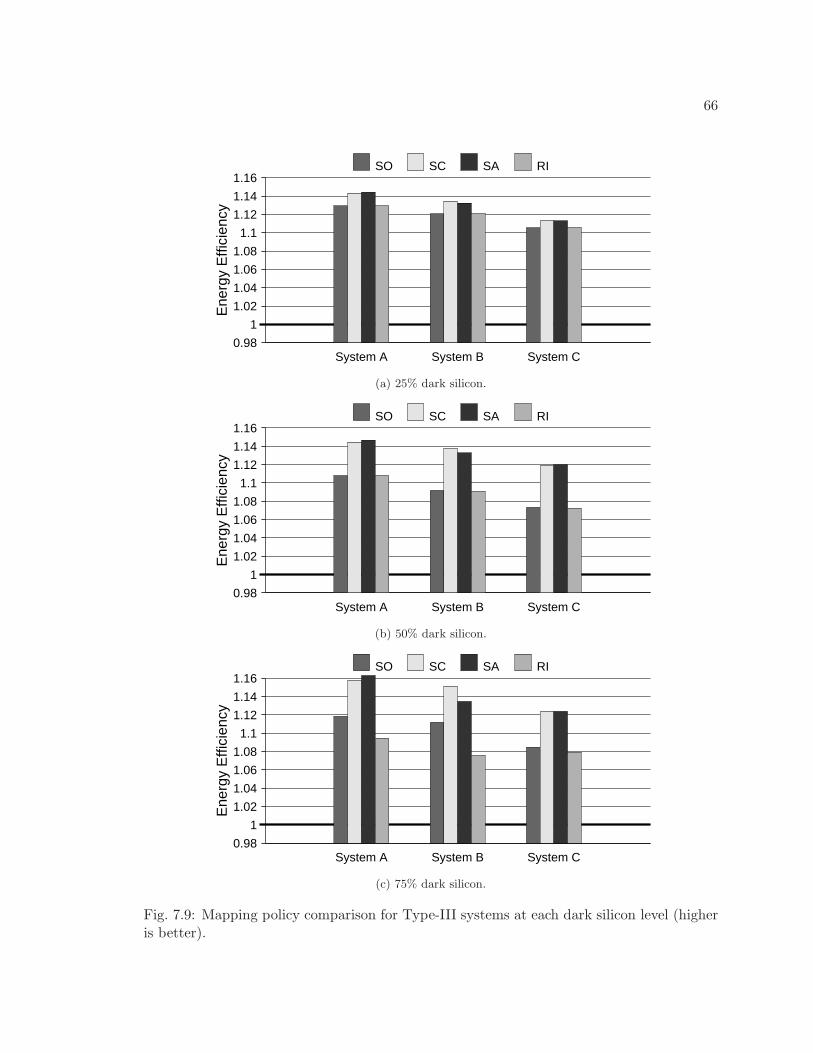
66
0.98
1
1.02
1.04
1.06
1.08
1.1
1.12
1.14
1.16
Ene
rgy
Effi
cien
cy
System A System B System C
SO SC SA RI
(a) 25% dark silicon.
0.98
1
1.02
1.04
1.06
1.08
1.1
1.12
1.14
1.16
Ene
rgy
Effi
cien
cy
System A System B System C
SO SC SA RI
(b) 50% dark silicon.
0.98
1
1.02
1.04
1.06
1.08
1.1
1.12
1.14
1.16
Ene
rgy
Effi
cien
cy
System A System B System C
SO SC SA RI
(c) 75% dark silicon.
Fig. 7.9: Mapping policy comparison for Type-III systems at each dark silicon level (higheris better).
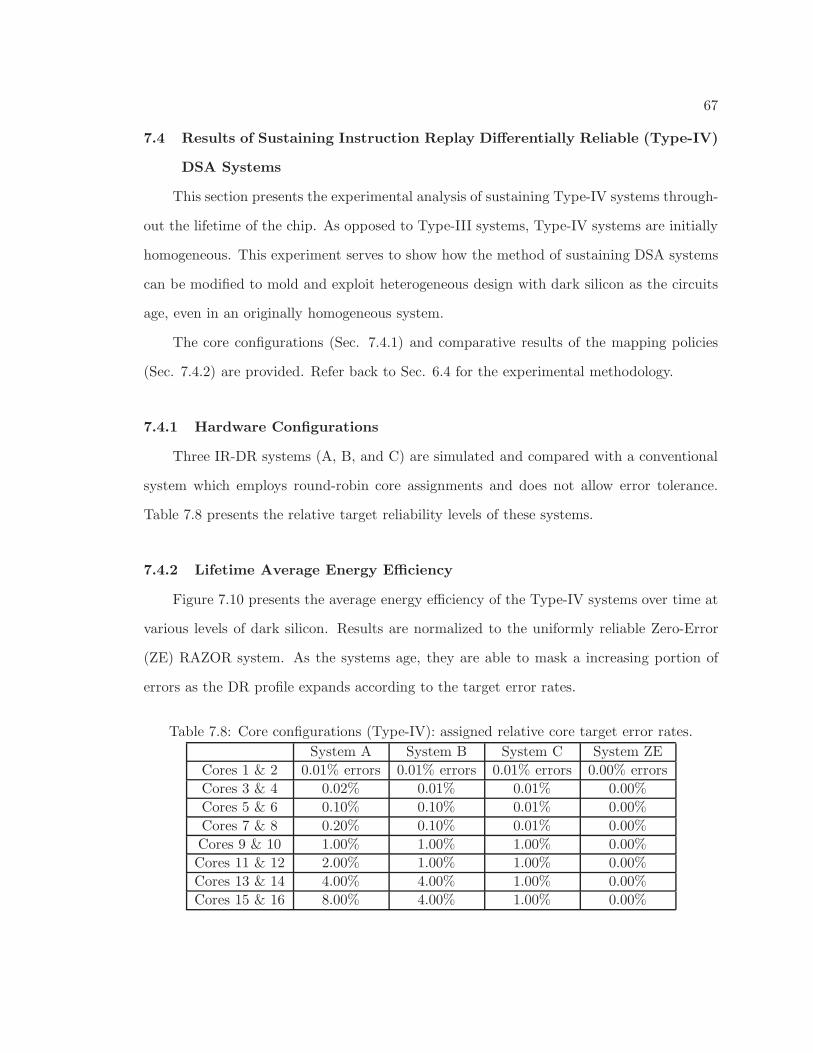
67
7.4 Results of Sustaining Instruction Replay Differentially Reliable (Type-IV)
DSA Systems
This section presents the experimental analysis of sustaining Type-IV systems through-
out the lifetime of the chip. As opposed to Type-III systems, Type-IV systems are initially
homogeneous. This experiment serves to show how the method of sustaining DSA systems
can be modified to mold and exploit heterogeneous design with dark silicon as the circuits
age, even in an originally homogeneous system.
The core configurations (Sec. 7.4.1) and comparative results of the mapping policies
(Sec. 7.4.2) are provided. Refer back to Sec. 6.4 for the experimental methodology.
7.4.1 Hardware Configurations
Three IR-DR systems (A, B, and C) are simulated and compared with a conventional
system which employs round-robin core assignments and does not allow error tolerance.
Table 7.8 presents the relative target reliability levels of these systems.
7.4.2 Lifetime Average Energy Efficiency
Figure 7.10 presents the average energy efficiency of the Type-IV systems over time at
various levels of dark silicon. Results are normalized to the uniformly reliable Zero-Error
(ZE) RAZOR system. As the systems age, they are able to mask a increasing portion of
errors as the DR profile expands according to the target error rates.
Table 7.8: Core configurations (Type-IV): assigned relative core target error rates.
System A System B System C System ZE
Cores 1 & 2 0.01% errors 0.01% errors 0.01% errors 0.00% errors
Cores 3 & 4 0.02% 0.01% 0.01% 0.00%
Cores 5 & 6 0.10% 0.10% 0.01% 0.00%
Cores 7 & 8 0.20% 0.10% 0.01% 0.00%
Cores 9 & 10 1.00% 1.00% 1.00% 0.00%
Cores 11 & 12 2.00% 1.00% 1.00% 0.00%
Cores 13 & 14 4.00% 4.00% 1.00% 0.00%
Cores 15 & 16 8.00% 4.00% 1.00% 0.00%
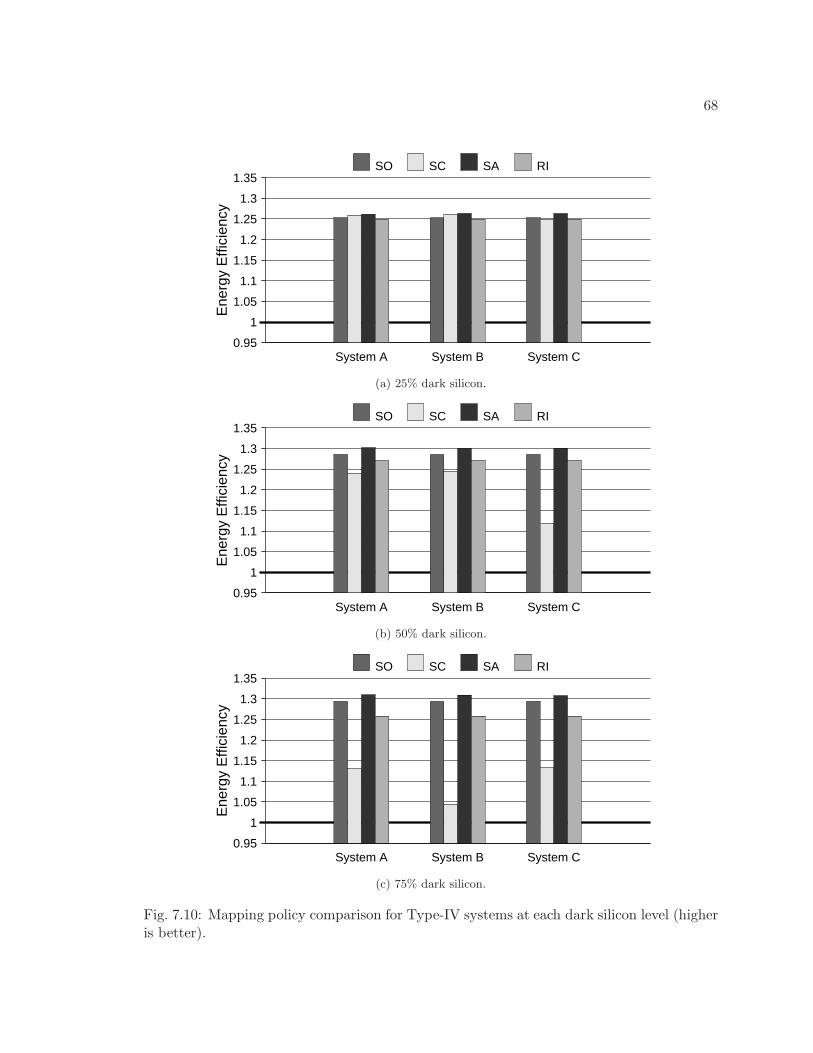
68
0.95
1
1.05
1.1
1.15
1.2
1.25
1.3
1.35
Ene
rgy
Effi
cien
cy
System A System B System C
SO SC SA RI
(a) 25% dark silicon.
0.95
1
1.05
1.1
1.15
1.2
1.25
1.3
1.35
Ene
rgy
Effi
cien
cy
System A System B System C
SO SC SA RI
(b) 50% dark silicon.
0.95
1
1.05
1.1
1.15
1.2
1.25
1.3
1.35
Ene
rgy
Effi
cien
cy
System A System B System C
SO SC SA RI
(c) 75% dark silicon.
Fig. 7.10: Mapping policy comparison for Type-IV systems at each dark silicon level (higheris better).
69
RI mapping receives an advantage from this error-tolerance, however it under performs
because it attempts to maintain the homogeneity to balance MTTFs, making it unable to
efficiently exploit the dark silicon. Surprisingly, SO mapping does significantly well because
these systems are initially homogeneous and the natural asymmetric aging happens to create
a desirable differential profile. In fact, SC mapping actually becomes very restrictive against
this natural asymmetry as it decreases mapping flexibility.
However, when the aging guidelines of SC mapping are allowed the exceptions of SA
mapping, the system achieves superior energy efficiency, showing the effectiveness of DR
sustainability control, even in an originally homogeneous system. Using SA mapping, Sys-
tem D is on average 26.1–31.0% more efficient than the conventional Zero Error system
over a 10-year lifetime.
70
Chapter 8
Conclusion
Over the past several decades, microprocessor manufacturers have diligently striven to
follow Moore’s law and provide faster, more power efficient chips at each technology node.
It appears, however, as if Moore’s law is being threatened on several levels, including the
emergence of dark silicon. As power constraints limit area usage, heterogeneous multicore
designs appear as a promising response, turning a negative into a positive. When inactive
components are viewed as extra components, a heterogeneous multicore system can improve
efficiency by dynamically utilizing specialized hardware with an unprecedented degree of
freedom.
Such Dark Silicon-Aware designs face many obstacles, however, including new design
criteria, significantly asymmetric aging, and dynamically fluctuating resource conflicts. This
work presents an encompassing approach to design, optimize, and sustain Dark Silicon-
Aware multicore systems in a way that maximizes dark silicon exploitation. Specifically, a
new design metric is proposed to optimize progressive multicore designs in the dark silicon
era and a mapping-based control system is designed to sustain these benefits in the face of
rapid transistor aging.
Overall, the contributions of this work show that proper design can proactively regain
lost scaling benefits. Perhaps more importantly, the presented principles can be readily
adapted and applied to generalized heterogeneous design, providing similar and perhaps
more substantial benefits with infinitely many other design techniques.
71
References
[1] U. Karpuzcu, B. Greskamp, and J. Torrellas, “The BubbleWrap many-core: Poppingcores for sequential acceleration,” in IEEE/ACM International Symposium on Microar-chitecture (MICRO), pp. 447–458, Dec. 2009.
[2] K. Chakraborty, P. Wells, and G. Sohi, “Computation spreading: Employing hardwaremigration to specialize CMP cores on-the-fly,” in Architectural Support for Program-ming Languages and Operating Systems (ASPLOS), pp. 283–292, 2006.
[3] M. B. Taylor, “Is dark silicon useful? harnessing the four horsemen of the coming darksilicon apocalypse,” in IEEE/ACM Design Automation Conference (DAC), 2012.
[4] N. Goulding-Hotta, J. Sampson, Q. Zheng, V. Bhatt, J. Auricchio, S. Swanson, andM. Taylor, “GreenDroid: An architecture for the dark silicon age,” in Proceedings ofAsia-Pacific Design Automation Conference (ASP-DAC), pp. 100–105, 2012.
[5] N. Hardavellas, M. Ferdman, B. Falsafi, and A. Ailamaki, “Toward dark siliconin servers,” IEEE/ACM International Symposium on Microarchitecture (MICRO),vol. 31, pp. 6–15, Jul.-Aug. 2011.
[6] Y. Zhang, L. Peng, X. Fu, and Y. Hu, “Lighting the dark silicon by exploiting hetero-geneity on future processors,” in IEEE/ACM Design Automation Conference (DAC),2013.
[7] J. Allred, S. Roy, and K. Chakraborty, “Designing for dark silicon: A methodologicalperspective on energy efficient systems,” in ACM International Symposium on LowPower Electronic Devices (ISLPED), pp. 255–260, 2012.
[8] J. Allred, S. Roy, and K. Chakraborty, “Dark silicon aware multicore systems: Em-ploying design automation with architectural insight,” IEEE Transactions on VLSISystems (TVLSI), 2013.
[9] J. Allred, S. Roy, and K. Chakraborty, “Long term sustainability of differentially reli-able systems in the dark silicon era,” in IEEE International Conference on ComputerDesign (ICCD), 2013.
[10] G. Venkatesh, J. Sampson, N. Goulding, S. Garcia, V. Bryksin, J. Lugo-Martinez,S. Swanson, and M. B. Taylor, “Conservation cores: reducing the energy of maturecomputations,” in Architectural Support for Programming Languages and OperatingSystems (ASPLOS), pp. 205–218, 2010.
[11] H. Esmaeilzadeh, E. Blem, R. S. Amant, K. Sankaralingam, and D. Burger, “Darksilicon and the end of multicore scaling,” in International Symposium on ComputerArchitecture (ISCA), pp. 365–367, 2011.
72
[12] H. B. Sohail, M. Thottethodi, and T. N. Vijaykumar, “Dark silicon is sub-optimal andavoidable,” Technical Report, Purdue University, 2011.
[13] M. B. Taylor, “Is dark silicon useful?: harnessing the four horsemen of the coming darksilicon apocalypse,” in IEEE/ACM Design Automation Conference (DAC), pp. 1131–1136, 2012.
[14] N. Hardavellas, “Exploiting dark silicon for energy efficiency,” in Sustainable Energy-Efficient Data Management Workshop (SEEDM), 2011.
[15] G. Venkatesh, J. Sampson, N. Goulding-Hotta, S. K. Venkata, M. B. Taylor, andS. Swanson, “QsCores: trading dark silicon for scalable energy efficiency with quasi-specific cores,” in IEEE/ACM International Symposium on Microarchitecture (MI-CRO), pp. 163–174, 2011.
[16] S. Borkar, “Design perspectives on 22nm cmos and beyond,” in Proceedings of 46thIEEE/ACM Design Automation Conference (DAC), pp. 93–94, 2009.
[17] J. Lee and N. S. Kim, “Optimizing total power of many-core processors consideringvoltage scaling limit and process variations,” in ACM International Symposium on LowPower Electronic Devices (ISLPED), pp. 201–206, 2009.
[18] “International technology roadmap for semiconductors, 2010 update,” Technical Re-port, International Technology Roadmap for Semiconductors (ITRS), 2011.
[19] S. Borkar, “The exascale challenge,” in International Symposium on VLSI Design,Automation and Test (VLSI-DAT), 2010.
[20] S. Dighe, S. Vangal, P. Aseron, S. Kumar, T. Jacob, K. Bowman, J. Howard,J. Tschanz, V. Erraguntla, N. Borkar, V. De, and S. Borkar, “Within-die variation-aware dynamic-voltage-frequency-scaling with optimal core allocation and thread hop-ping for the 80-core teraflops processor,” Journal of Solid-State Circuits (JSSC), vol. 46,pp. 184–193, Jan. 2011.
[21] K. Chakraborty and S. Roy, “Topologically homogeneous power-performance hetero-geneous multicore systems,” in IEEE/ACM Design Automation & Test in Europe(DATE), pp. 1–6, Mar. 2011.
[22] X. Wang, K. Ma, and Y. Wang, “Adaptive power control with online model estimationfor chip multiprocessors,” IEEE Transactions on Parallel and Distrubuted Systems(TPDS), vol. 22, pp. 1681–1696, Oct. 2011.
[23] G. Yan, Y. Li, Y. Han, X. Li, M. Guo, and X. Liang, “AgileRegulator: A hybridvoltage regulator scheme redeeming dark silicon for power efficiency in a multicorearchitecture,” in Proceedings of High Performance Computer Architecture (HPCA),pp. 1–12, Feb. 2012.
[24] N. K. Choudhary, S. V. Wadhavkar, T. A. Shah, H. Mayukh, J. Gandhi, B. H. Dwiel,S. Navada, H. H. Najaf-abadi, and E. Rotenberg, “FabScalar: composing synthesizablertl designs of arbitrary cores within a canonical superscalar template,” in InternationalSymposium on Computer Architecture (ISCA), pp. 11–22, 2011.
73
[25] L. Leem, H. Cho, J. Bau, Q. Jacobson, and S. Mitra, “ERSA: Error-resilient systemarchitecture for probabilistic applications,” in IEEE/ACM Design Automation & Testin Europe (DATE), pp. 1560–1565, 2010.
[26] X. Li and D. Yeung, “Application-level correctness and its impact on fault tolerance,” inProceedings of High Performance Computer Architecture (HPCA), pp. 181–192, 2007.
[27] D. Nowroth, I. Polian, and B. Becker, “A study of cognitive resilience in a jpeg com-pressor,” in IEEE Dependable Systems and Networks (DSN), pp. 32–41, 2008.
[28] I. S. Chong and A. Ortega, “Hardware testing for error tolerant multimedia compressionbased on linear transforms,” in Defect and Fault-Tolerance in VLSI Systems (DFT),pp. 523–531, 2005.
[29] H. Chung and A. Ortega, “Analysis and testing for error tolerant motion estimation,”in Defect and Fault-Tolerance in VLSI Systems (DFT), pp. 514–522, 2005.
[30] B. Shim and N. Shanbhag, “Energy-efficient soft error-tolerant digital signal process-ing,” IEEE Transactions on VLSI Systems (TVLSI), vol. 14, pp. 336–348, Apr. 2006.
[31] M. Dimitrov, M. Mantor, and H. Zhou, “Understanding software approaches forGPGPU reliability,” in Proceedings of General Purpose Processing on Graphics Pro-cessing Units (GPGPU), pp. 94–104, 2009.
[32] H. Esmaeilzadeh, A. Sampson, M. Ringenburg, L. Ceze, D. Grossman, and D. Burger,“Addressing dark silicon challenges with disciplined approximate computing,” in DarkSilicon Workshop (DaSi), 2012.
[33] A. Kahng, S. Kang, R. Kumar, and J. Sartori, “Designing a processor from the groundup to allow voltage/reliability tradeoffs,” in Proceedings of High Performance ComputerArchitecture (HPCA), pp. 1–11, Jan. 2010.
[34] J. Srinivasan, S. V. Adve, P. Bose, and J. A. Rivers, “Exploiting structural duplicationfor lifetime reliability enhancement,” Special Interest Group on Computer Architecture(SIGARCH) Computer Architecture News, vol. 33, pp. 520–531, May 2005.
[35] S. Das, C. Tokunaga, S. Pant, W.-H. Ma, S. Kalaiselvan, K. Lai, D. Bull, andD. Blaauw, “RazorII: In situ error detection and correction for PVT and SER tol-erance,” Journal of Solid-State Circuits (JSSC), vol. 44, pp. 32–48, Jan. 2009.
[36] K. Ma and X. Wang, “PGCapping: Exploiting power gating for power capping andcore lifetime balancing in CMPs,” in IEEE Parallel Architectures and CompilationTechniques (PACT), ACM, 2012.
[37] K. Ma, X. Li, M. Chen, and X. Wang, “Scalable power control for many-core architec-tures running multi-threaded applications,” in International Symposium on ComputerArchitecture (ISCA), pp. 449–460, ACM, 2011.
[38] R. Kessler, “The alpha 21264 microprocessor,” IEEE/ACM International Symposiumon Microarchitecture (MICRO), vol. 19, no. 2, pp. 24 –36, 1999.
74
[39] P. S. Magnusson, M. Christensson, J. Eskilson, D. Forsgren, G. Hallberg, J. Hogberg,F. Larsson, A. Moestedt, and B. Werner, “Simics: A full system simulation platform,”IEEE Computer, vol. 35, pp. 50–58, Feb. 2002.
[40] T. Sherwood, E. Perelman, and B. Calder, “Basic block distribution analysis to findperiodic behavior and simulation points in applications,” in IEEE Parallel Architecturesand Compilation Techniques (PACT), pp. 3–14, 2001.
[41] J. E. Stine, I. Castellanos, M. Wood, J. Henson, F. Love, W. R. Davis, P. D. Fran-zon, M. Bucher, S. Basavarajaiah, J. Oh, and R. Jenkal, “FreePDK: An open-sourcevariation-aware design kit,” in IEEE International Conference on Microelectronic Sys-tems Education (MSE), pp. 173–174, IEEE, 2007.
[42] E. Grochowski and M. Annavaram, “Energy per instruction trends in intel micropro-cessors,” Technology@Intel Magazine, pp. 1–8, Mar. 2006.
[43] S. Bhardwaj, W. Wang, R. Vattikonda, Y. Cao, and S. Vrudhula, “Predictive modelingof the NBTI effect for reliable design,” in Proceedings of IEEE Custom IntegratedCircuits Conference (CICC), pp. 189–192, 2006.
[44] A. Calimera, E. Macii, and M. Poncino, “NBTI-aware power gating for concurrentleakage and aging optimization,” in ACM International Symposium on Low PowerElectronic Devices (ISLPED), pp. 127–132, 2009.
[45] W. Song, S. Mukhopadhyay, and S. Yalamanchili, “Reliability implications of powerand thermal constrained operations in asymmetric multicore processors,” in Dark Sil-icon Workshop (DaSi), 2012.
[46] S. Heo, K. Barr, and K. Asanovic, “Reducing power density through activity migra-tion,” in ACM International Symposium on Low Power Electronic Devices (ISLPED),pp. 217–222, ACM, 2003.
[47] D. K. Schroder and J. A. Babcock, “Negative bias temperature instability: Road tocross in deep submicron silicon semiconductor manufacturing,” Journal of AppliedPhysics, vol. 94, no. 1, pp. 1–18, 2003.