Embed Size (px)
Citation preview
Vol. 31, No. 3, May–June 2012, pp. 493–520ISSN 0732-2399 (print) � ISSN 1526-548X (online) http://dx.doi.org/10.1287/mksc.1110.0700
© 2012 INFORMS
Designing Ranking Systems for Hotels onTravel Search Engines by Mining User-Generated
and Crowdsourced Content
Anindya Ghose, Panagiotis G. Ipeirotis, Beibei LiStern School of Business, New York University, New York, New York 10012
{[email protected], [email protected], [email protected]}
User-generated content on social media platforms and product search engines is changing the way consumersshop for goods online. However, current product search engines fail to effectively leverage information
created across diverse social media platforms. Moreover, current ranking algorithms in these product searchengines tend to induce consumers to focus on one single product characteristic dimension (e.g., price, starrating). This approach largely ignores consumers’ multidimensional preferences for products. In this paper,we propose to generate a ranking system that recommends products that provide, on average, the best valuefor the consumer’s money. The key idea is that products that provide a higher surplus should be ranked higheron the screen in response to consumer queries. We use a unique data set of U.S. hotel reservations made overa three-month period through Travelocity, which we supplement with data from various social media sourcesusing techniques from text mining, image classification, social geotagging, human annotations, and geomapping.We propose a random coefficient hybrid structural model, taking into consideration the two sources of consumerheterogeneity the different travel occasions and different hotel characteristics introduce. Based on the estimatesfrom the model, we infer the economic impact of various location and service characteristics of hotels. We thenpropose a new hotel ranking system based on the average utility gain a consumer receives from staying in aparticular hotel. By doing so, we can provide customers with the “best-value” hotels early on. Our user studies,using ranking comparisons from several thousand users, validate the superiority of our ranking system relativeto existing systems on several travel search engines. On a broader note, this paper illustrates how social mediacan be mined and incorporated into a demand estimation model in order to generate a new ranking systemin product search engines. We thus highlight the tight linkages between user behavior on social media andsearch engines. Our interdisciplinary approach provides several insights for using machine learning techniquesin economics and marketing research.
Key words : user-generated content; social media; search engines; hotels; ranking system; structural models;text mining; crowdsourcing
History : Received: January 15, 2010; accepted: November 13, 2011; Peter Fader served as the special issueeditor and Jean-Pierre Dubé served as associate editor for this article. Published online in Articles in AdvanceApril 10, 2012.
1. IntroductionAs social media and user-generated content (UGC)become increasingly ubiquitous, consumers rely on alarge variety of Internet-based sources prior to mak-ing a purchase. However, although product searchengines have access to lots of UGC (not only ontheir own site but also across other social mediachannels), they typically fail to effectively lever-age and present such product information goingbeyond simple numerical ratings. Moreover, exist-ing ranking algorithms typically induce consumersto focus on only one single product characteristicdimension (e.g., price, star rating, number of reviews).This rudimentary approach largely ignores consumerheterogeneity and their multidimensional productpreferences.
In this paper, we propose a new ranking systemfor product search engines that aims to maximizethe expected utility gain for consumers from a pur-chase. We instantiate our study by looking into thehotel industry. According to a study by comScore(Lipsman 2007), more than 87% of customers relyon the online UGC to make purchase decisions forhotels, higher than any other product category. Thissituation motivates the need for a robust rankingmechanism on travel search engines that can moreefficiently incorporate the publicly available knowl-edge within and across a large variety of social mediaplatforms. Toward this goal, we propose a system thatranks each hotel according to the expected utility gainacross the consumer population. The advantage ofthis system is that it uses consumer utility theory and
493

Ghose, Ipeirotis, and Li: Designing Ranking Systems for Hotels Using UGC494 Marketing Science 31(3), pp. 493–520, © 2012 INFORMS
characteristics theory (e.g., Fader and Hardie 1996)to design a scalar utility score with which to rankhotels while incorporating all the dimensions of hotelquality observed from diverse information sources.No established measures currently exist that quantifythe economic impact of various internal (service) andexternal (location) characteristics on hotel demand.By analyzing UGC from social media, we are able toestimate consumer preferences toward different hotelcharacteristics and recommend products that providethe best value for money on an average.
We use a unique data set of hotel reservationsfrom Travelocity.com. The data set contains completeinformation on transactions conducted over a three-month period, from November 2008 to January 2009,for 1,497 hotels in the United States. We have dataon UGC from three sources: (i) user-generated hotelreviews from two well-known travel search engines,Travelocity.com and TripAdvisor.com; (ii) social geo-tags generated by users identifying different geo-graphic attributes of hotels from GeoNames.org; and(iii) user-contributed opinions on important hotelcharacteristics based on user surveys from AmazonMechanical Turk (AMT). Moreover, because somelocation-based characteristics are not directly mea-surable based on UGC, we use image classificationtechniques to infer such features from the satelliteimages of the area. We then merge these differentdata sources to create one comprehensive data set thatsummarizes the location and service characteristics ofall the hotels.
In the first step of our analysis, we determinethe particular hotel characteristics customers valuemost and thus influence the aggregate demand of thehotels. Beyond the directly observable characteristics(e.g., the “number of stars”) most third-party travelwebsites provide, many users also tend to value spe-cific location characteristics, such as proximity to thebeach or downtown. We incorporate satellite imageclassification techniques and use both human andcomputer intelligence (in the form of social geotag-ging and text mining of reviews) to infer these loca-tion features. In the second step, we use demandestimation techniques (Berry et al. 1995, Berry andPakes 2007, Song 2011) to quantify the economic influ-ence and relative importance of location and servicecharacteristics. Our empirical modeling and analysesenable us to compute the “expected utility gain” froma particular hotel based on the estimation of priceelasticities and average utilities. In the third step, weuse this measure of expected utility gain to propose anew ranking system in which a hotel that provides acomparably higher average utility gain would appearat the top of the list displayed by a travel searchengine. By doing so, we can provide customers withthe “best-value” hotels early on, thereby improving
the quality of online hotel search. In the final step,we validate the superiority of our proposed rankingsystem by conducting online experiments across 7,800users on AMT, across six different cities based on anumber of benchmark systems.
Our key results are as follows:1. Five location-based characteristics have a posi-
tive impact on hotel demand: the number of exter-nal amenities, presence near a beach, presence nearpublic transportation, presence near a highway, andpresence near a downtown area. The textual con-tent and style of reviews also demonstrate a statis-tically significant association with demand. Reviewsthat are less complex, have shorter words, and havefewer spelling errors influence demand positively, asdo reviews with more characters and those writtenin simple language. Consumers prefer hotels withreviews that contain objective information (such asfactual descriptions of hotels) rather than subjectiveinformation, indicating they trust third-party infor-mation over descriptions provided by the hotels.Consumers also prefer to stay in hotels with reviewswritten in a “consistent objective style” rather than amix of objective and subjective sentences.
2. We examine interaction effects between travelpurpose, price, and hotel characteristics. Businesstravelers are the least price sensitive, whereas touristsare the most price sensitive. In addition, businesstravelers have the highest marginal valuation forhotels located closer to a highway and with easyaccess to public transportation. In contrast, romancetravelers have the highest marginal valuation forhotels located closer to a beach and those with a highservice rating.
3. A comparison between the model that condi-tions on the UGC variables and a model that doesnot shows that the former outperforms the latterin both in-sample and out-of-sample analyses. Addi-tional model fit comparisons suggest that the model’spredictive power is weakest when excluding all thelocation variables, followed by the service variables,and then the UGC variables. Moreover, within the setof UGC variables, we find textual information (e.g.,text features, review subjectivity, readability) has asignificantly higher impact than numerical informa-tion on the model’s predictive power.
There are three key contributions of this paper.First, we illustrate how researchers can mine UGCfrom multiple and diverse sources on the Internetto examine the economic value of different prod-uct attributes, using a structural model of demandestimation. Customers today make their decisions inan environment with a plethora of available data.Some consumers might research a hotel using tourguides and mapping applications, or they may con-sult online review sites to determine a hotel’s qual-ity and amenities. To replicate this decision-making

Ghose, Ipeirotis, and Li: Designing Ranking Systems for Hotels Using UGCMarketing Science 31(3), pp. 493–520, © 2012 INFORMS 495
environment, we construct an exhaustive data set,collecting information from a variety of sources andusing a variety of methodologies, such as text mining,on-demand annotations, and image classification. Wedemonstrate the marginal contribution from differentinformation sources by conducting model fit compar-isons between models that condition for one set ofvariables versus another.
Second, our empirical estimates enable us to pro-pose a new ranking system for hotel search based onthe computation of each hotel’s expected utility gain,which measures the “net value” a consumer gets fromthe transaction. The key notion is that in response toa search query, the system would take into accountconsumers’ multidimensional preferences in order torecommend and rank higher those hotels that providea higher “value for money.” Thus, our paper showshow businesses can leverage UGC in social media togenerate a ranking system in product search enginesthat improves the quality of choices available to con-sumers. The methodological approach used in thispaper can be applied toward ranking any productor service that has multiple attributes, and hence theapplicability of this paper is very wide. This is alsothe first study that demonstrates the linkages betweenuser behavior on social media platforms and searchengines.
Third, to evaluate the quality of our rankingtechnique, we conducted several user studies basedon online surveys on AMT across six differentmarkets in the United States. Using 7,800 uniqueuser responses for comparing different rankings, weunequivocally demonstrate that our proposed rank-ing system performs significantly better than sev-eral baseline-ranking systems currently used by travelsearch engines. A follow-up survey reveals thatusers strongly preferred the diversity of the retrievedresults, given that the list produced by our methodconsisted of a mix of hotels cutting across severalprice and quality ranges. This finding indicates thatcustomers prefer a list of hotels with each specializ-ing in a variety of characteristics, rather than a varietyof hotels with each specializing in only one char-acteristic. Besides providing consumers with directeconomic gains, such a ranking system can lead tonontrivial reductions in consumer search costs. Fur-thermore, directing customers to hotels that are bettermatches for their interests can lead to increased usageof travel search engines.
The rest of this paper is organized as follows. Sec-tion 2 discusses related work and places our workin the context of prior literature. Section 3 discussesthe work related to the data preparation, includingthe methods used to identify important hotel charac-teristics, the steps undertaken to conduct the surveyson AMT to elicit user opinions, and the text-mining
techniques used to parse user-generated reviews.Sections 4 and 5 provide an overview of our econo-metric approach and discuss empirical results, respec-tively. Section 6 discusses how one can apply ourapproach to design a real-world application, such as aranking system for hotel search. Section 7 concludes.
2. Prior LiteratureOur paper draws from multiple streams of work.A key challenge is to bridge the gap between the tex-tual and qualitative nature of review content and thequantitative nature of discrete choice models. Withthe rapid growth and popularity of the UGC onthe Web, a new area of research has emerged thatapplies text-mining techniques to product reviews.The first stream of this research focused on the senti-ment analysis of product reviews (Hu and Liu 2004,Pang and Lee 2004, Das and Chen 2007). This focusstimulated additional research on identifying prod-uct features in which consumers expressed their opin-ions (Hu and Liu 2004, Scaffidi et al. 2007). Theautomated extraction of product attributes has alsoreceived attention in the recent marketing literature(Lee and Bradlow 2011).
Meanwhile, the hypothesis that product reviewsaffect product sales has received strong support inprior empirical studies (e.g., Godes and Mayzlin 2004,Chevalier and Mayzlin 2006, Liu 2006, Dellarocaset al. 2007, Duan et al. 2008, Forman et al. 2008,Moe 2009). However, these studies focus only onnumeric review ratings (e.g., the valence and volumeof reviews) in their empirical analysis. Researchersusing only numeric ratings have to deal with issuessuch as self-selection bias (Li and Hitt 2008) andbimodal distribution of reviews (Hu et al. 2006). Moreimportantly, the matching of consumers to hotels innumerical rating systems is not random. A consumeronly rates the hotel she frequents (i.e., the one thatmaximizes her utility). Consequently, the average starrating for each hotel need not reflect the population’saverage utility. Because of the above drawbacks, theaverage numerical star rating a product receives maynot convey a lot of information to a prospective buyer.
To the best of our knowledge, only a handful ofempirical studies have formally tested whether thetextual information embedded in online UGC canhave an economic impact. Ghose et al. (2009) estimatethe impact of buyer textual feedback on price pre-miums sellers charge in online secondhand markets.Eliashberg et al. (2007) combine natural-language pro-cessing techniques and statistical learning methods toforecast the return on investment for a movie, usingshallow textual features from movie scripts. Netzeret al. (2012) combine text mining and semantic net-work analysis to understand the brand associative
Ghose, Ipeirotis, and Li: Designing Ranking Systems for Hotels Using UGC496 Marketing Science 31(3), pp. 493–520, © 2012 INFORMS
network and the implied market structure. Deckerand Trusov (2010) use text mining to estimate the rel-ative effect of product attributes and brand names onthe overall evaluation of the products.
None of these studies focuses on estimating theimpact of user-generated product reviews on influ-encing product sales beyond the effect of numericreview ratings, which is one of the key research objec-tives of this paper. Controlling for the volume of blogposts, Dhar and Chang (2009) show that changes inthe number of friends of an artist are correlated withsales of music albums. The papers closest to ours areGhose and Ipeirotis (2011) and Archak et al. (2011),who explore multiple aspects of review text to iden-tify important text-based features and to study theirimpact on review helpfulness (Ghose and Ipeirotis2011) and product sales (Ghose and Ipeirotis 2011,Archak et al. 2011). However, these studies do nothave data on actual product demand and do notuse structural models, nor do they examine the useof UGC in developing a ranking system for productsearch in online markets.
Our work is related to models of demandestimation such as BLP (Berry et al. 1995). Becauseof the limitations of the product-level “taste shock”in logit models, Berry and Pakes (2007) proposeda new model based on pure product characteristics.The pure characteristics model (hereafter, PCM) dif-fers from the BLP model in the sense that it does notcontain the product-level taste shock. It describes theconsumer heterogeneity, based purely on consumers’different tastes toward individual product character-istics, without consideration of the tastes of certainproducts as a whole (i.e., brand preferences). How-ever, as Song (2011) points out, whether one shouldintroduce the product-level taste shock depends onthe context of the market. Keeping in mind the twolevels of consumer heterogeneity introduced by dif-ferent travel categories (i.e., family trip, romantic trip,or business trip) and different hotel characteristics,we propose a random coefficients-based hybrid struc-tural model to identify the latent weight distribu-tion consumers assign to each hotel characteristic.The outcome of our analysis enables us to computeeach hotel’s expected utility gain and rank the hotelsaccordingly on a travel search engine.
Finally, our paper is related to the work in onlinerecommender systems. By generating a novel rank-ing approach for hotels, we aim to improve therecommendation strategy for travel search enginesand provide customers with the “best-value” hotelsearly on in the search process. The marketing litera-ture has proposed several model-based recommenda-tion systems to predict preferences for recommendeditems (Ansari et al. 2000, Ying et al. 2006, Bodapati2008). A more recent trend along this line is adaptive
personalization systems (Ansari and Mela 2003, Rustand Chung 2006, Chung et al. 2009).
3. Data DescriptionOur data set, compiled from various sources, con-sists of observations from 1,497 hotels in the UnitedStates. We have three months of hotel transactiondata from Travelocity.com (November 1, 2008 to Jan-uary 31, 2009) that contains the average transactionprice per room per night and the total number ofrooms sold per transaction.
Our work leverages three types of UGC data:• on-demand user-contributed opinions through
Amazon Mechanical Turk (AMT),• location description based on user-generated
geotagging and image classification, and• service description based on user-generated
product reviews.We first discuss how we leverage AMT to collect
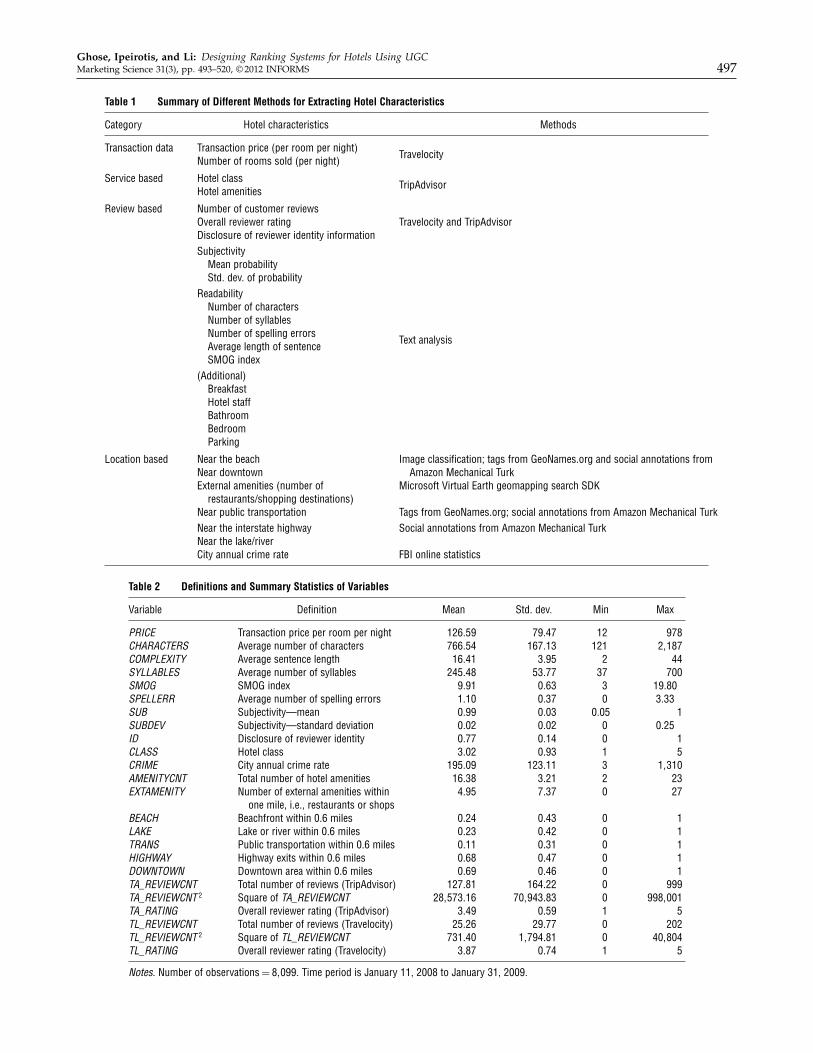
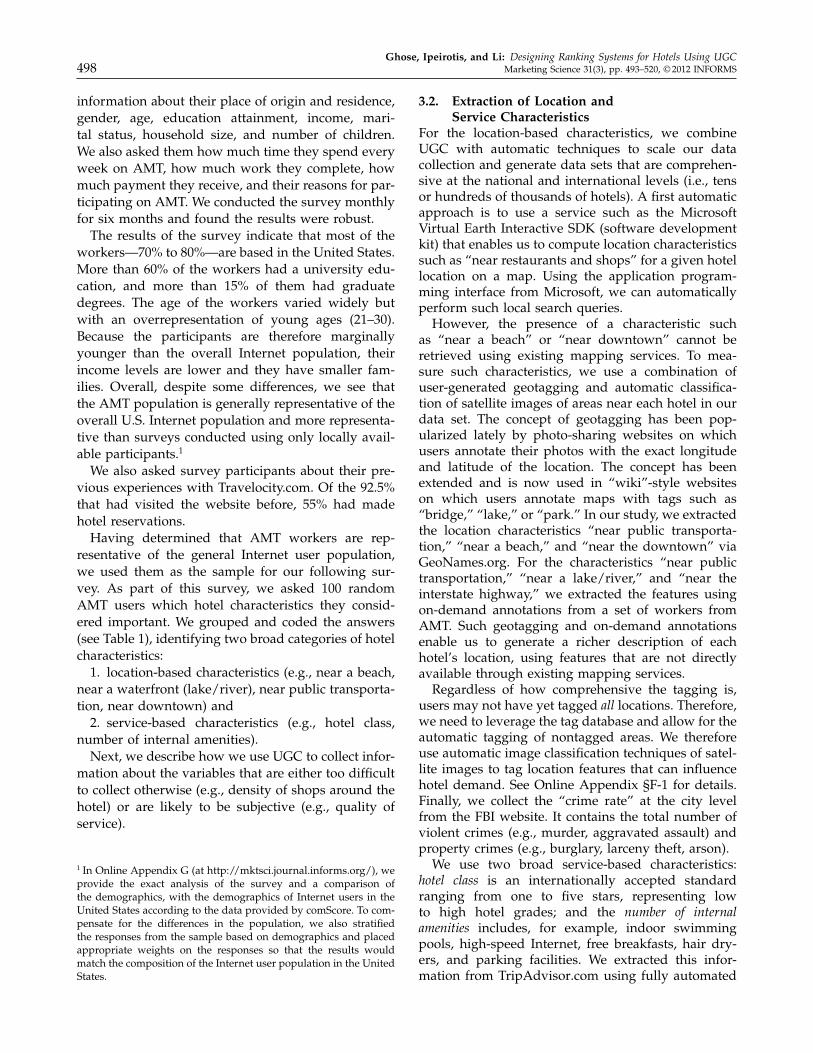
information on user preferences for different hotelcharacteristics. Their responses suggest we can lumpthese characteristics into two groups: location and ser-vice. Once we identify the set of consumer prefer-ences, we use other UGC to infer the external locationcharacteristics, the internal service characteristics, andthe textual characteristics of hotel reviews that caninfluence consumer purchases. We present the datasources, definitions, and summary statistics of all vari-ables in Tables 1 and 2.
3.1. Identification of Hotel CharacteristicsOur analysis first requires knowledge of whichaspects of a hotel are most important to consumersand therefore determine the aggregate prices of thehotels. We use a survey of potential hotel customersto identify these aspects.
To reach a wide demographic, we relied on AMT, anonline marketplace used to automate the execution ofmicro tasks that require human intervention (i.e., can-not be fully automated using data-mining tools). Taskrequesters post simple micro tasks, known as hits(human intelligence tasks), in the marketplace. Themarketplace provides proper control over the task exe-cution, such as validation of the submitted answers orthe ability to assign the same task to several differentworkers. It also ensures the proper randomization ofthe assignments of tasks to workers within a singletask type. Each user receives a small monetary com-pensation for completing the task.
Our main goal was to obtain a diversity of con-sumer opinions. Therefore, we wanted to first ensurethe participants were representative of the overallInternet population. Therefore, we constructed a sur-vey in which we asked AMT workers to provide
Ghose, Ipeirotis, and Li: Designing Ranking Systems for Hotels Using UGCMarketing Science 31(3), pp. 493–520, © 2012 INFORMS 497
Table 1 Summary of Different Methods for Extracting Hotel Characteristics
Category Hotel characteristics Methods
Transaction data Transaction price (per room per night)Travelocity
Number of rooms sold (per night)
Service based Hotel classTripAdvisor
Hotel amenities
Review based Number of customer reviewsOverall reviewer rating Travelocity and TripAdvisorDisclosure of reviewer identity informationSubjectivity
Mean probabilityStd. dev. of probability
ReadabilityNumber of charactersNumber of syllablesNumber of spelling errors
Text analysisAverage length of sentenceSMOG index
(Additional)BreakfastHotel staffBathroomBedroomParking
Location based Near the beach Image classification; tags from GeoNames.org and social annotations fromAmazon Mechanical TurkNear downtown
External amenities (number of Microsoft Virtual Earth geomapping search SDKrestaurants/shopping destinations)
Near public transportation Tags from GeoNames.org; social annotations from Amazon Mechanical TurkNear the interstate highway Social annotations from Amazon Mechanical TurkNear the lake/riverCity annual crime rate FBI online statistics
Table 2 Definitions and Summary Statistics of Variables
Variable Definition Mean Std. dev. Min Max
PRICE Transaction price per room per night 126059 79047 12 978CHARACTERS Average number of characters 766054 167013 121 21187COMPLEXITY Average sentence length 16041 3095 2 44SYLLABLES Average number of syllables 245048 53077 37 700SMOG SMOG index 9091 0063 3 19.80SPELLERR Average number of spelling errors 1010 0037 0 3.33SUB Subjectivity—mean 0099 0003 0.05 1SUBDEV Subjectivity—standard deviation 0002 0002 0 0.25ID Disclosure of reviewer identity 0077 0014 0 1CLASS Hotel class 3002 0093 1 5CRIME City annual crime rate 195009 123011 3 11310AMENITYCNT Total number of hotel amenities 16038 3021 2 23EXTAMENITY Number of external amenities within 4095 7037 0 27
one mile, i.e., restaurants or shopsBEACH Beachfront within 0.6 miles 0024 0043 0 1LAKE Lake or river within 0.6 miles 0023 0042 0 1TRANS Public transportation within 0.6 miles 0011 0031 0 1HIGHWAY Highway exits within 0.6 miles 0068 0047 0 1DOWNTOWN Downtown area within 0.6 miles 0069 0046 0 1TA_REVIEWCNT Total number of reviews (TripAdvisor) 127081 164022 0 999TA_REVIEWCNT 2 Square of TA_REVIEWCNT 281573016 701943083 0 9981001TA_RATING Overall reviewer rating (TripAdvisor) 3049 0059 1 5TL_REVIEWCNT Total number of reviews (Travelocity) 25026 29077 0 202TL_REVIEWCNT 2 Square of TL_REVIEWCNT 731040 11794081 0 401804TL_RATING Overall reviewer rating (Travelocity) 3087 0074 1 5
Notes. Number of observations = 81099. Time period is January 11, 2008 to January 31, 2009.
Ghose, Ipeirotis, and Li: Designing Ranking Systems for Hotels Using UGC498 Marketing Science 31(3), pp. 493–520, © 2012 INFORMS
information about their place of origin and residence,gender, age, education attainment, income, mari-tal status, household size, and number of children.We also asked them how much time they spend everyweek on AMT, how much work they complete, howmuch payment they receive, and their reasons for par-ticipating on AMT. We conducted the survey monthlyfor six months and found the results were robust.
The results of the survey indicate that most of theworkers—70% to 80%—are based in the United States.More than 60% of the workers had a university edu-cation, and more than 15% of them had graduatedegrees. The age of the workers varied widely butwith an overrepresentation of young ages (21–30).Because the participants are therefore marginallyyounger than the overall Internet population, theirincome levels are lower and they have smaller fam-ilies. Overall, despite some differences, we see thatthe AMT population is generally representative of theoverall U.S. Internet population and more representa-tive than surveys conducted using only locally avail-able participants.1
We also asked survey participants about their pre-vious experiences with Travelocity.com. Of the 92.5%that had visited the website before, 55% had madehotel reservations.
Having determined that AMT workers are rep-resentative of the general Internet user population,we used them as the sample for our following sur-vey. As part of this survey, we asked 100 randomAMT users which hotel characteristics they consid-ered important. We grouped and coded the answers(see Table 1), identifying two broad categories of hotelcharacteristics:
1. location-based characteristics (e.g., near a beach,near a waterfront (lake/river), near public transporta-tion, near downtown) and
2. service-based characteristics (e.g., hotel class,number of internal amenities).
Next, we describe how we use UGC to collect infor-mation about the variables that are either too difficultto collect otherwise (e.g., density of shops around thehotel) or are likely to be subjective (e.g., quality ofservice).
1 In Online Appendix G (at http://mktsci.journal.informs.org/), weprovide the exact analysis of the survey and a comparison ofthe demographics, with the demographics of Internet users in theUnited States according to the data provided by comScore. To com-pensate for the differences in the population, we also stratifiedthe responses from the sample based on demographics and placedappropriate weights on the responses so that the results wouldmatch the composition of the Internet user population in the UnitedStates.
3.2. Extraction of Location andService Characteristics
For the location-based characteristics, we combineUGC with automatic techniques to scale our datacollection and generate data sets that are comprehen-sive at the national and international levels (i.e., tensor hundreds of thousands of hotels). A first automaticapproach is to use a service such as the MicrosoftVirtual Earth Interactive SDK (software developmentkit) that enables us to compute location characteristicssuch as “near restaurants and shops” for a given hotellocation on a map. Using the application program-ming interface from Microsoft, we can automaticallyperform such local search queries.
However, the presence of a characteristic suchas “near a beach” or “near downtown” cannot beretrieved using existing mapping services. To mea-sure such characteristics, we use a combination ofuser-generated geotagging and automatic classifica-tion of satellite images of areas near each hotel in ourdata set. The concept of geotagging has been pop-ularized lately by photo-sharing websites on whichusers annotate their photos with the exact longitudeand latitude of the location. The concept has beenextended and is now used in “wiki”-style websiteson which users annotate maps with tags such as“bridge,” “lake,” or “park.” In our study, we extractedthe location characteristics “near public transporta-tion,” “near a beach,” and “near the downtown” viaGeoNames.org. For the characteristics “near publictransportation,” “near a lake/river,” and “near theinterstate highway,” we extracted the features usingon-demand annotations from a set of workers fromAMT. Such geotagging and on-demand annotationsenable us to generate a richer description of eachhotel’s location, using features that are not directlyavailable through existing mapping services.
Regardless of how comprehensive the tagging is,users may not have yet tagged all locations. Therefore,we need to leverage the tag database and allow for theautomatic tagging of nontagged areas. We thereforeuse automatic image classification techniques of satel-lite images to tag location features that can influencehotel demand. See Online Appendix §F-1 for details.Finally, we collect the “crime rate” at the city levelfrom the FBI website. It contains the total number ofviolent crimes (e.g., murder, aggravated assault) andproperty crimes (e.g., burglary, larceny theft, arson).
We use two broad service-based characteristics:hotel class is an internationally accepted standardranging from one to five stars, representing lowto high hotel grades; and the number of internalamenities includes, for example, indoor swimmingpools, high-speed Internet, free breakfasts, hair dry-ers, and parking facilities. We extracted this infor-mation from TripAdvisor.com using fully automated
Ghose, Ipeirotis, and Li: Designing Ranking Systems for Hotels Using UGCMarketing Science 31(3), pp. 493–520, © 2012 INFORMS 499
parsing. Because the website does not explicitly listhotel amenities, we retrieved them by following thelink provided on the hotel Web page directing usersto one of the hotel’s partner websites (i.e., Travelo-city.com, Orbitz.com, Expedia.com, Priceline.com, orHotels.com).
3.3. Extraction of Linguistic Style ofCustomer Reviews
We collected customer reviews from Travelocity.com.We also collected reviews from a neutral, third-partysite and the world’s largest online travel community,TripAdvisor.com, to account for the indirect influenceof word of mouth. We collected all available onlinereviews and reviewers’ information up to January 31,2009 (the last date of transactions in our database).
Consistent with prior work, we use the total num-ber of reviews and the numeric reviewer rating tocontrol for word-of-mouth effects. In addition, giventhat the actual quality of reviews affects product sales,we looked into two text style features—subjectivityand readability, both of which can influence con-sumers’ purchase decisions (Ghose and Ipeirotis2011). For more details, see Online Appendix §F-2.
Five broad types of characteristics are present inthis category: (i) total number of reviews, (ii) over-all review rating, (iii) review subjectivity (mean andvariance), (iv) review readability (the number of char-acters, syllables, and spelling errors; complexity; andSMOG index), and (v) disclosure of the reviewer’sidentity.
4. ModelIn this section, we will discuss our randomcoefficients-based structural model and how we applyit to estimate the distribution of consumer preferencestoward different hotel characteristics. The estimatesfrom these analyses are then used toward comput-ing the expected utility gain from each hotel, which,in turn, is used in designing the ranking systemdescribed in §6.
4.1. Model SetupOur model is motivated directly by Song (2011), whoproposes a hybrid discrete choice model of differ-entiated product demand. Whereas Song (2011) hasone random coefficient on price, we have multiplerandom coefficients on price as well as hotel charac-teristics. Note that his hybrid model is a combina-tion of the BLP and PCM approaches. It is called ahybrid model because it resembles the random coeffi-cient logit demand model in describing a brand choice(BLP) and the pure characteristics demand model indescribing a within-brand product choice (PCM). Thishybrid model is a discrete choice model of differen-tiated product demand in which product groups are
horizontally differentiated, whereas products withina given group are vertically differentiated condi-tional on product characteristics. These two typesof differentiation are distinguished by a group-level“taste shock,” which is assumed to be indepen-dently and identically distributed with a Type Iextreme value distribution. This taste shock representseach consumer’s specific preference toward a prod-uct group that product characteristics—both observedand unobserved—do not capture. Song (2011) refersto a product group that contains vertically differ-entiated products as a “brand.” This hybrid modelidentifies the preference for product characteristics ina similar way as the PCM, the main difference beingthat the hybrid model compares products of eachbrand on the quality ladder separately, whereas thePCM compares all products on it at the same time.Hence, the quality space is much less crowded in thehybrid model.2
In our context, a hotel “travel category” representsa “brand,” and the hotels within each travel categoryrepresent “products.” In particular, the market sharefunction of hotel jk within travel category k can bewritten as the product of the probability that travelcategory k is chosen and the probability that hotel jk
is chosen given that travel category k is chosen. Theformer probability is similar to the choice probabilityin BLP and the latter to that of the PCM.
We define a consumer’s decision-making behav-ior as follows. A consumer needs to locate the hotelwhose location and service characteristics best matchher travel purpose. For instance, if a consumer wantsto go on a romantic trip with a partner, she will beinterested in the set of hotels located close to a beachas well as to a downtown area with such amenitiesas nightclubs and restaurants. She is also aware thathotels specializing in the romance category are morelikely to satisfy such location and service needs. Eachhotel can belong to one of the following eight types oftravel categories: family trip, business trip, romantictrip, tourist trip, trip with kids, trip with seniors, pet-friendly trip, and disability-friendly trip. Each travelcategory is defined and chosen according to the infor-mation gleaned from TripAdvisor.com, which allows
2 This hybrid model provides more efficient substitution patternsaccording to its basic assumptions and model foundations. As Song(2011) describes, it distinguishes between two types of cross sub-stitutions: within-travel and between-travel category substitution.The former is confined to hotels within the same travel categoryand has the same substitution pattern as in the PCM. The latterdetermines the substitution pattern for hotels in different travelcategories and has a similar pattern as in BLP but with a distinctdifference: the impact of a change (in price or availability) on othertravel categories is confined to hotels of similar quality. As a result,a hotel will have fewer substitutes in our model than in the BLP(Berry et al. 1995) model.
Ghose, Ipeirotis, and Li: Designing Ranking Systems for Hotels Using UGC500 Marketing Science 31(3), pp. 493–520, © 2012 INFORMS
reviewers to specify their main trip purpose (travelcategory) when posting a review.
We have data on all the hotel reviews posted byusers for a given hotel right from the time the firstreview was posted until the last date of our transac-tion data set (January 31, 2009). We classify a hotelinto a specific travel category based on reviewers’most frequently mentioned travel purpose for thathotel. Hence, each hotel belongs to a single travelcategory. To capture the heterogeneity in consumers’travel purpose, we introduce an idiosyncratic tasteshock at the travel category level. This shock is similarto the product-level taste shock in the BLP model.
Each travel category has a hotel that maximizes aconsumer’s utility in that category. We refer to thisas the “best” hotel in that category. To find the besthotel within each travel category, we use the PCM,which enables us to capture the vertical differentia-tion among hotels within the same travel category.A rational consumer chooses a travel category if andonly if her utility from the best hotel in that categoryexceeds her utility from the best hotel in any othertravel category. Thus, in our model, the utility for con-sumer i from choosing hotel j with category type k inmarket t can be represented as follows:
uijkt =Xjkt�i +�iPjkt + �jkt + �ikt1 (1)
where i represents a consumer, jk represents hotel jwith travel category type k 4k ∈ 81121 0 0 0 171895,and t represents a hotel market (city–week combi-nation). In this model, �i and �i are individual-specific random coefficients that capture consumers’heterogeneous tastes toward different observed hotelcharacteristics, X = 6X11X21 0 0 0 1XZ7, and toward theaverage price per night, P , respectively. Note that�i is a scalar, whereas �i is a Z-dimensional vectorcorresponding to Z hotel characteristics. �jkt repre-sents hotel characteristics unobservable to the econo-metrician. �ikt with a subscript k represents a travelcategory-level taste shock. Note that in our model, thetravel category-level shock is independently and iden-tically distributed across consumers and travel cate-gories, consistent with Song (2011).3
We define a “market” as the combination of “city–week.” Correspondingly, we calculate the marketshare for each hotel based on the number of rooms
3 Besides our model, which incorporates a travel category-leveltaste shock, at least three other plausible modeling approaches existin this context: (i) a model with only a hotel-level taste shockapproach; (ii) a model with both travel category-level and hotel-level taste shocks, with the travel category at the top hierarchy,resembling the nested logit model; and (iii) a model with no tasteshocks at either the travel category level or the hotel level, resem-bling the PCM (Berry and Pakes 2007) approach. We have estimatedall these models and found that our hybrid model provides the bestperformance in both precision and deviation. Details are providedin §5.3.
sold for that hotel in that market (i.e., city–week)divided by the total size of that market. With regardto market size, in our main estimation, we appliedthe same idea as in the demand estimation literatures(e.g., Berry et al. 1995, Nevo 2001, Song 2011), com-puting the market size by estimating the potentialconsumption in a market. That is, we estimate thetotal potential market consumption to be proportionalto the total number of rooms available in the exist-ing hotels in a certain market (including the hotelswhose transactions appear in our current choice setand those whose transactions we do not observe).4
We acquired the total number of existing hotel roomsin each market via TripAdvisor.com. Under this mea-sure, the outside good is defined as “no purchasefrom the current choice set.”5
Alternatively, in our robustness checks, we definethe market size as the total number of rooms all hotelsin that city sold during that week, based on the trans-action data from Travelocity.com. Recall that our maindata set comes from two sources: Travelocity.com-generated transaction data and TripAdvisor.com hotellisting data. The data set we use is the set of hotels atthe intersection of the two sources, which means thehotel choice set for each market includes those hotelsthat not only have a transaction generated via Trav-elocity.com but also have information available fromuser-generated reviews on TripAdvisor.com. Becausenot every hotel that has a Travelocity.com-generatedtransaction is listed on TripAdvisor.com, we defineour “outside good” as the set of hotels listed inthe original Travelocity.com transaction data but notTripAdvisor.com.
We follow Berry et al. (1995) and model the distri-bution of consumers’ taste parameters as multivariatenormal, conditional on demographics:
(
�i
�i
)
=
(
�̄
�̄
)
+çDi +èvi1 Di ∼ P ∗
D4D51
vi ∼ N401 IZ+151
where Di is a d × 1 vector of consumer demo-graphic variables, P ∗
D4D5 is a nonparametric distri-bution observed from other data sources, and vi
is a 4Z+ 15× 1 vector capturing the additional unob-served consumer-specific preference toward hotelcharacteristics. It follows a multivariate normaldistribution. ç is a 4Z + 15 × d matrix of coefficients
4 For this estimation of market size to be valid, we assume that thetotal number of room nights rented in a certain market is propor-tional to the number of individuals in that market.5 Because our transaction data set is a random sample from Trav-elocity, it is an unbalanced panel data set. Based on Yamamoto(2011), the BLP-type of model (i.e., mixed logit model) is a moregeneral form of the “varying choice set logit model.” Therefore, ourestimation is able to account for the varying choice set bias thatstandard logit models suffer.
Ghose, Ipeirotis, and Li: Designing Ranking Systems for Hotels Using UGCMarketing Science 31(3), pp. 493–520, © 2012 INFORMS 501
that measures how consumers’ taste parameters varywith observed demographics. è is a 4Z + 15× 4Z + 15scaling matrix. This specification allows the observeddemographics Di and the unobserved factor vi todetermine the consumer-specific taste.
As we know, a consumer’s income, yi, normallyaffects his taste. In particular, we notice that yi affectsthe consumer’s taste primarily through price. Thuswe propose our basic model with two assumptions:(i) Di contains only the consumer income yi, whichfollows the empirical income distribution Fy4�5 andcan be derived from the U.S. Census data; and (ii) ç iszero in all but one row. The nonzero row correspondsto the price coefficient. We relax both assumptions inour extended model in §4.4.
Given these assumptions, we basically model �i
and �i as a function of consumer income and theunobserved characteristic: �i = �̄ + �yyi + �vvi and�i = �̄+�vvi. Then we rewrite our model as follows:
uijkt = �jkt +Xjkt�vvi +�yyiPjkt +�vviPjkt + �ikt1 (2)
where �jkt = Xjkt�̄ + �̄Pjkt + �jkt represents the meanutility of hotel j with category type k in market t;�̄1 �̄1�y1�v, and �v are the parameters to be estimated.
4.2. EstimationAs mentioned in the previous subsection, our goalhere is to estimate the mean and deviation of �i and�i. We apply methods similar to those used in Berryand Pakes (2007) and Song (2011). In general, with agiven starting value of �0 = 4�0
y1�0v1�
0v5, we look for
the mean utility �, such that the model-predicted mar-ket share is equal to the observed market share. Wethen form a generalized method of moments (GMM)objective function using the moment condition thatthe mean of unobserved characteristics is uncorre-lated with the instrumental variables. We then updatethe parameter value of �1 = 4�1
y1�1v1�
1v5 and use it as
the starting point for the next-round iteration. Thisprocedure is repeated until the algorithm finds theoptimal value of � that minimizes the GMM objectivefunction. The algorithm searches only over a subset ofparameters because we concentrate on the mean util-ity parameters that enter linearly, out of the search.We conduct the estimation in three stages.
To calculate the market share for a particular hotel,we need to know (1) the size of a certain con-sumer segment and (2) the probability of that segmentchoosing this hotel. Multiplying the two gives us theoverall market share. See Online Appendix D for themathematical details for the derivation.
We next identify the mean utility � by equat-ing the estimated market share with the observedmarket share conditioning on a given � = 4�y1�v1�v5.The solution to this problem satisfies a system ofnonlinear equations. In our case,
∑Kk=1 J
k nonlinear
equations (where J k is the total number of hotelswithin travel category type k) and
∑ Kk=1J
k unknownvariables exist (� being a
∑Kk=1 J
k dimension vector).To solve, we apply the Newton–Raphson method perSong (2011), which works well when the number ofproducts per market is up to 20. To guarantee therobustness of the results when the number of productsis larger than 20, we tried different initial values in theiteration and found the final solution was consistent.In practice, this approach locates the closest solutionfor our settings, whereas the iteration procedure pro-vides a closed form to locate the roots rapidly.
To account for the endogeneity of price, we use aGMM estimator and form an objective function byinteracting the unobservable parameter, �, with a setof instrumental variables. We use the Nelder–Meadsimplex algorithm to update the parameter values for�y1�v, and �v, and we use them as the starting pointsto recalculate the market share and solve for the newmean utility. This process allows us to extract the newstructural error � and form the GMM objective func-tion. This entire procedure iterates until the algorithmfinds the optimal combination of �y1�v1�v, and � thatminimizes the GMM function.
4.2.1. Identification. A critical issue in the esti-mation process is price endogeneity. To separate theexogenous variation in prices (i.e., as a result of dif-ferences in marginal costs) and endogenous variation(i.e., as a result of differences in unobserved valu-ation), we use the average price of the same-classhotels in the other markets as an instrument for price.This is similar to Hausman’s (1996) approach. Theidentification assumption is that, controlling for class-specific means and demographics, market-specificvaluations are independent across markets (but areallowed to be correlated within a market). Hence,prices of the same-class hotels in two markets will becorrelated as a result of the common marginal costbut because of the independence assumption will beuncorrelated with market-specific valuation.
In addition, we used three other sets of instruments.First, we followed Villas-Boas and Winer (1999) andArchak et al. (2011) and used lagged prices as instru-ments in conjunction with Google Trends data. Thelagged price may not be an ideal instrument becausecommon demand shocks may be correlated over time.Nevertheless, common demand shocks that are cor-related through time are essentially trends. Control-ling for trends through our use of search volume datafor different major hotel brands should alleviate most,if not all, such concerns.
Second, cost-side variables that are correlated withprices but uncorrelated with factors that are reflectedin the unobserved characteristics term are widelyused as instruments for price (see, e.g., Chintaguntaet al. 2005). We used region dummies as proxiesfor the marginal costs, as suggested by Nevo (2001).
Ghose, Ipeirotis, and Li: Designing Ranking Systems for Hotels Using UGC502 Marketing Science 31(3), pp. 493–520, © 2012 INFORMS
The marginal costs include costs related to produc-tion (e.g., facilities, labor, energy) and distribution(e.g., transportation, labor, storage space). Becauseproduction costs exhibit little variation over time, theyconstitute too small a percentage of marginal costs tobe correlated with prices (Nevo 2001). Thus, instead offinding instruments for production costs, our modeluses brand dummies and hotel class variables to con-trol for such costs. Because distribution costs con-tribute to most of the marginal costs that are corre-lated with prices, we used region dummy variablesas proxies for the distribution costs.
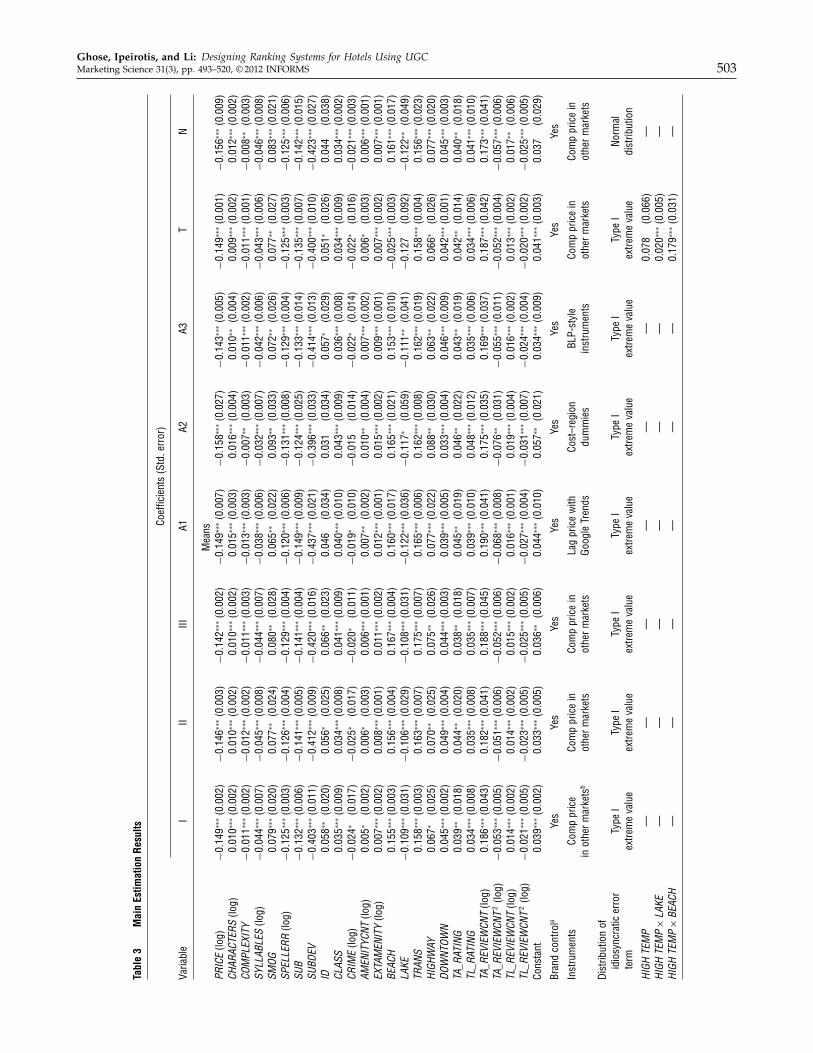
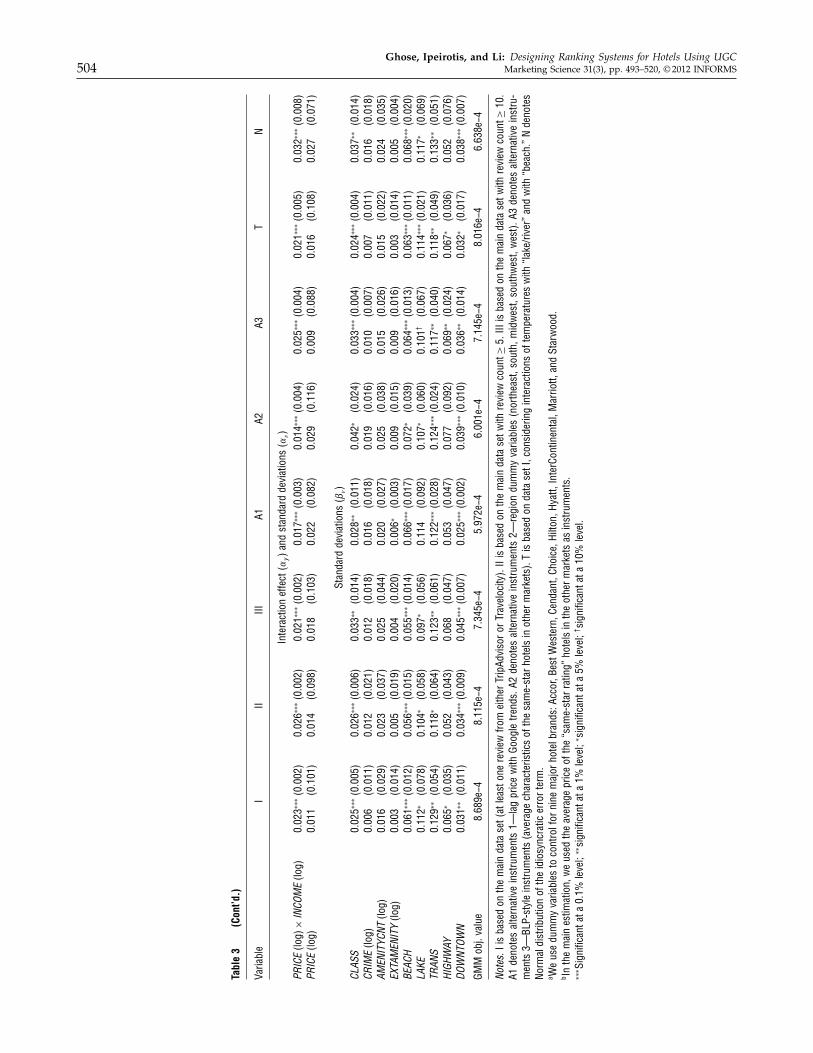
Third, we used BLP-style instruments. Specifically,we used the average characteristics of the hotels withthe same class in the other markets. All these alterna-tive estimations yielded similar results. See Table 3,columns 5–7, for the corresponding estimation resultsusing alternative instruments.
We performed an F -test in the first stage for eachof the instruments. In each case, the F -test value waswell over 10, suggesting that our instruments arevalid (i.e., the instruments are not weak). In addition,the Hansen’s J -test could not reject the null hypoth-esis of valid overidentifying restrictions. See OnlineAppendix E for the detailed estimation algorithm.6
4.3. Model Extension 1: Additional Text FeaturesSo far, we have not fully exploited the informa-tion about hotel service characteristics from the data,which is embedded in the natural-language text of theconsumer reviews. For example, the helpfulness of thehotel staff is a service feature one can assess by readingthe consumer opinions. Toward extracting such infor-mation, we build on the work of Hu and Liu (2004),Popescu and Etzioni (2005), and Archak et al. (2011).
First, we extract the important hotel features. Fol-lowing the automated approach introduced previ-ously (Archak et al. 2011), we use a part-of-speechtagger to identify the frequently mentioned nouns andnoun phrases, which we consider candidate hotel fea-tures. We then use WordNet (Fellbaum 1998) and acontext-sensitive hierarchical agglomerative clusteringalgorithm (Manning and Schutze 1999) to further clus-ter the identified nouns and noun phrases into clustersof similar nouns and noun phrases. The resulting setof clusters corresponds to the set of identified prod-uct features mentioned in the reviews. For our anal-ysis, we kept the top five most frequently mentionedfeatures, which were hotel staff, food quality, bath-room, parking facilities, and bedroom quality.
6 Further information on the proof of existence and uniqueness ofthe mean product quality (delta parameter that matches the modelpredicted market shares with observed market share) is available inSong (2011). This is in addition to Berry et al. (2004), who providesupport for their arguments regarding the asymptotic properties forthe multidimensional pure characteristics model with Monte Carlosimulations.
For sentiment analysis, we extracted all the evalua-tion phrases (adjectives and adverbs) that were usedto evaluate the individual service features (for exam-ple, for the feature “hotel staff,” we extracted phrasessuch as “helpful,” “smiling,” “rude,” “responsive”).The process of extracting user evaluation phrasescan be automated. To measure the meaning of theseevaluation phrases, we used AMT to exogenouslyassign explicit polarity semantics to each word. Tocompute the scores, we used AMT to create ourontology, with the scores for each evaluation phrase.Our process for creating these “external” scores wasdone using the methodology of Archak et al. (2011).Finally, to handle the negation (e.g., “I didn’t thinkthe staff was helpful”), we built a dictionary databaseto store all the negation words (e.g., “not,” “hardly”)using an approach similar to NegEx (http://code.google.com/p/negex; accessed February 1, 2012). Formore details on how we extracted the text featurestogether with the corresponding sentiment analysis,see Online Appendix §F-3.
4.4. Model Extension 2: Interactionswith the Travel Category
As discussed in §4.1, we simplify our basic modelframework by making two assumptions: (i) Di con-tains only the consumer income, INCOMEi; and (ii) çis zero in all but one row, which corresponds withthe price coefficient. However, other consumer demo-graphic characteristics are also likely to affect con-sumers’ tastes. Moreover, other interaction effectsmight also exist beyond the one between income andprice. Based on the basic model, we now relax theseassumptions by considering interaction effects withthe demographic variables. This extension is done sim-ilar to that of Nevo (2001) by enabling interactionsbetween consumer travel purposes and hotel charac-teristics. More specifically, we extend our basic modelby allowing Di to contain both consumer travel pur-poses and income. We also allow ç to be nonzeroin all its elements. We define Ti as an indicator vec-tor with identity components representing consumertravel purpose:7
T ′
i = 6Familyi Businessi Romancei Touristi Kidsi
Seniorsi Petsi Disabilityi70
7 The empirical distribution of Ti can be acquired from online con-sumer reviews and reviewers’ profiles. After writing an onlinereview for a hotel, a reviewer is asked to provide additional demo-graphic and trip information—for example, “What was the mainpurpose of this trip? (Select one from the eight choices.)” The dis-tribution of Ti is derived based on reviewers’ responses to thisquestion. Our robustness test showed that consumers’ demograph-ics derived from different online resources stay consistent (Jensen-Shannon divergence = 0003). Note that because there are eighttravel purpose dummies, we use seven of them in estimating theinteraction effects.
Ghose, Ipeirotis, and Li: Designing Ranking Systems for Hotels Using UGCMarketing Science 31(3), pp. 493–520, © 2012 INFORMS 503
Tabl
e3
Mai
nEs
timat
ion
Resu
lts
Coef
ficie
nts
(Std
.err
or)
Varia
ble
III
IIIA1
A2A3
TN
Mea
nsPR
ICE
(log)
−00
149∗
∗∗
(0.0
02)
−00
146∗
∗∗
(0.0
03)
−00
142∗
∗∗
(0.0
02)
−00
149∗
∗∗
(0.0
07)
−00
158∗
∗∗
(0.0
27)
−00
143∗
∗∗
(0.0
05)
−00
149∗
∗∗
(0.0
01)
−00
156∗
∗∗
(0.0
09)
CHAR
ACTE
RS(lo
g)00
010∗
∗∗
(0.0
02)
0001
0∗∗∗
(0.0
02)
0001
0∗∗∗
(0.0
02)
0001
5∗∗∗
(0.0
03)
0001
6∗∗∗
(0.0
04)
0001
0∗∗
(0.0
04)
0000
9∗∗∗
(0.0
02)
0001
2∗∗∗
(0.0
02)
COMPL
EXITY
−00
011∗
∗∗
(0.0
02)
−00
012∗
∗∗
(0.0
02)
−00
011∗
∗∗
(0.0
03)
−00
013∗
∗∗
(0.0
03)
−00
007∗
∗(0
.003
)−
0001
1∗∗∗
(0.0
02)
−00
011∗
∗∗
(0.0
01)
−00
008∗
∗(0
.003
)SY
LLAB
LES
(log)
−00
044∗
∗∗
(0.0
07)
−00
045∗
∗∗
(0.0
08)
−00
044∗
∗∗
(0.0
07)
−00
038∗
∗∗
(0.0
06)
−00
032∗
∗∗
(0.0
07)
−00
042∗
∗∗
(0.0
06)
−00
043∗
∗∗
(0.0
06)
−00
046∗
∗∗
(0.0
08)
SMOG
0007
9∗∗∗
(0.0
20)
0007
7∗∗
(0.0
24)
0008
0∗∗
(0.0
28)
0006
5∗∗
(0.0
22)
0009
3∗∗
(0.0
33)
0007
2∗∗
(0.0
26)
0007
7∗∗
(0.0
27)
0008
3∗∗∗
(0.0
21)
SPEL
LERR
(log)
−00
125∗
∗∗
(0.0
03)
−00
126∗
∗∗
(0.0
04)
−00
129∗
∗∗
(0.0
04)
−00
120∗
∗∗
(0.0
06)
−00
131∗
∗∗
(0.0
08)
−00
129∗
∗∗
(0.0
04)
−00
125∗
∗∗
(0.0
03)
−00
125∗
∗∗
(0.0
06)
SUB
−00
132∗
∗∗
(0.0
06)
−00
141∗
∗∗
(0.0
05)
−00
141∗
∗∗
(0.0
04)
−00
149∗
∗∗
(0.0
09)
−00
124∗
∗∗
(0.0
25)
−00
133∗
∗∗
(0.0
14)
−00
135∗
∗∗
(0.0
07)
−00
142∗
∗∗
(0.0
15)
SUBD
EV−
0040
3∗∗∗
(0.0
11)
−00
412∗
∗∗
(0.0
09)
−00
420∗
∗∗
(0.0
16)
−00
437∗
∗∗
(0.0
21)
−00
396∗
∗∗
(0.0
33)
−00
414∗
∗∗
(0.0
13)
−00
400∗
∗∗
(0.0
10)
−00
423∗
∗∗
(0.0
27)
ID00
058∗
∗(0
.020
)00
056∗
(0.0
25)
0006
6∗∗
(0.0
23)
0004
6(0
.034
)00
031
(0.0
34)
0005
7∗(0
.029
)00
051∗
(0.0
26)
0004
4(0
.038
)CL
ASS
0003
5∗∗∗
(0.0
09)
0003
4∗∗∗
(0.0
08)
0004
1∗∗∗
(0.0
09)
0004
0∗∗∗
(0.0
10)
0004
3∗∗∗
(0.0
09)
0003
6∗∗∗
(0.0
08)
0003
4∗∗∗
(0.0
09)
0003
4∗∗∗
(0.0
02)
CRIM
E(lo
g)−
0002
4∗(0
.017
)−
0002
5∗(0
.017
)−
0002
0∗(0
.011
)−
0001
9∗(0
.010
)−
0001
5(0
.014
)−
0002
2∗(0
.014
)−
0002
2∗(0
.016
)−
0002
1∗∗∗
(0.0
03)
AMEN
ITYC
NT(lo
g)00
005∗
(0.0
02)
0000
6∗(0
.003
)00
006∗
∗∗
(0.0
01)
0000
7∗∗
(0.0
02)
0001
0∗∗
(0.0
04)
0000
7∗∗∗
(0.0
02)
0000
6∗(0
.003
)00
006∗
∗∗
(0.0
01)
EXTA
MEN
ITY
(log)
0000
7∗∗∗
(0.0
02)
0000
8∗∗∗
(0.0
01)
0001
1∗∗∗
(0.0
02)
0001
2∗∗∗
(0.0
01)
0001
5∗∗∗
(0.0
02)
0000
9∗∗∗
(0.0
01)
0000
7∗∗∗
(0.0
02)
0000
7∗∗∗
(0.0
01)
BEAC
H00
155∗
∗∗
(0.0
03)
0015
6∗∗∗
(0.0
04)
0016
7∗∗∗
(0.0
04)
0016
0∗∗∗
(0.0
17)
0016
5∗∗∗
(0.0
21)
0015
3∗∗∗
(0.0
10)
−00
025∗
∗∗
(0.0
03)
0016
1∗∗∗
(0.0
17)
LAKE
−00
109∗
∗∗
(0.0
31)
−00
106∗
∗∗
(0.0
29)
−00
108∗
∗∗
(0.0
31)
−00
122∗
∗∗
(0.0
36)
−00
117∗
(0.0
59)
−00
111∗
∗(0
.041
)−
0012
7(0
.092
)−
0012
2∗∗
(0.0
49)
TRAN
S00
158∗
∗∗
(0.0
03)
0016
3∗∗∗
(0.0
07)
0017
5∗∗∗
(0.0
07)
0016
5∗∗∗
(0.0
06)
0016
2∗∗∗
(0.0
08)
0016
2∗∗∗
(0.0
19)
0015
8∗∗∗
(0.0
04)
0015
6∗∗∗
(0.0
23)
HIGH
WAY
0006
7∗(0
.025
)00
070∗
∗(0
.025
)00
075∗
∗(0
.026
)00
077∗
∗∗
(0.0
22)
0008
8∗∗
(0.0
30)
0006
3∗∗
(0.0
22)
0006
6∗(0
.026
)00
077∗
∗∗
(0.0
20)
DOWNT
OWN
0004
5∗∗∗
(0.0
02)
0004
9∗∗∗
(0.0
04)
0004
4∗∗∗
(0.0
03)
0003
9∗∗∗
(0.0
05)
0003
3∗∗∗
(0.0
04)
0004
6∗∗∗
(0.0
09)
0004
2∗∗∗
(0.0
01)
0004
5∗∗∗
(0.0
03)
TA_R
ATING
0003
9∗∗
(0.0
18)
0004
4∗∗
(0.0
20)
0003
8∗∗
(0.0
18)
0004
5∗∗
(0.0
19)
0004
6∗∗
(0.0
22)
0004
3∗∗
(0.0
19)
0004
2∗∗
(0.0
14)
0004
0∗∗
(0.0
18)
TL_R
ATING
0003
4∗∗∗
(0.0
08)
0003
5∗∗∗
(0.0
08)
0003
5∗∗∗
(0.0
07)
0003
9∗∗∗
(0.0
10)
0004
8∗∗∗
(0.0
12)
0003
5∗∗∗
(0.0
06)
0003
4∗∗∗
(0.0
06)
0004
1∗∗∗
(0.0
10)
TA_R
EVIEWCN
T(lo
g)00
186∗
∗∗
(0.0
43)
0018
2∗∗∗
(0.0
41)
0018
8∗∗∗
(0.0
45)
0019
0∗∗∗
(0.0
41)
0017
5∗∗∗
(0.0
35)
0016
9∗∗∗
(0.0
37)
0018
7∗∗∗
(0.0
42)
0017
3∗∗∗
(0.0
41)
TA_R
EVIEWCN
T2
(log)
−00
053∗
∗∗
(0.0
05)
−00
051∗
∗∗
(0.0
06)
−00
052∗
∗∗
(0.0
06)
−00
068∗
∗∗
(0.0
08)
−00
076∗
∗(0
.031
)−
0005
5∗∗∗
(0.0
11)
−00
052∗
∗∗
(0.0
04)
−00
057∗
∗∗
(0.0
06)
TL_R
EVIEWCN
T(lo
g)00
014∗
∗∗
(0.0
02)
0001
4∗∗∗
(0.0
02)
0001
5∗∗∗
(0.0
02)
0001
6∗∗∗
(0.0
01)
0001
9∗∗∗
(0.0
04)
0001
6∗∗∗
(0.0
02)
0001
3∗∗∗
(0.0
02)
0001
7∗∗
(0.0
06)
TL_R
EVIEWCN
T2
(log)
−00
021∗
∗∗
(0.0
05)
−00
023∗
∗∗
(0.0
05)
−00
025∗
∗∗
(0.0
05)
−00
027∗
∗∗
(0.0
04)
−00
031∗
∗∗
(0.0
07)
−00
024∗
∗∗
(0.0
04)
−00
020∗
∗∗
(0.0
02)
−00
025∗
∗∗
(0.0
05)
Cons
tant
0003
9∗∗∗
(0.0
02)
0003
3∗∗∗
(0.0
05)
0003
6∗∗
(0.0
06)
0004
4∗∗∗
(0.0
10)
0005
7∗∗
(0.0
21)
0003
4∗∗∗
(0.0
09)
0004
1∗∗∗
(0.0
03)
0003
7(0
.029
)
Bran
dco
ntro
laYe
sYe
sYe
sYe
sYe
sYe
sYe
sYe
s
Inst
rum
ents
Com
ppr
ice
Com
ppr
ice
inCo
mp
pric
ein
Lag
pric
ew
ithCo
st–r
egio
nBL
P-st
yle
Com
ppr
ice
inCo
mp
pric
ein
inot
herm
arke
tsb
othe
rmar
kets
othe
rmar
kets
Goog
leTr
ends
dum
mie
sin
stru
men
tsot
herm
arke
tsot
herm
arke
ts
Dist
ribut
ion
ofid
iosy
ncra
ticer
ror
Type
ITy
peI
Type
ITy
peI
Type
ITy
peI
Type
INo
rmal
term
extre
me
valu
eex
trem
eva
lue
extre
me
valu
eex
trem
eva
lue
extre
me
valu
eex
trem
eva
lue
extre
me
valu
edi
strib
utio
n
HIGH
TEMP
——
——
——
0007
8(0
.066
)—
HIGH
TEMP
×LA
KE—
——
——
—00
020∗
∗∗
(0.0
05)
—HIGH
TEMP
×BE
ACH
——
——
——
0017
9∗∗∗
(0.0
31)
—
Ghose, Ipeirotis, and Li: Designing Ranking Systems for Hotels Using UGC504 Marketing Science 31(3), pp. 493–520, © 2012 INFORMS
Tabl
e3
(Con
t’d.)
Varia
ble
III
IIIA1
A2A3
TN
Inte
ract
ion
effe
ct(�
y)a
ndst
anda
rdde
viat
ions
(��)
PRICE
(log)
×INCO
ME
(log)
0002
3∗∗∗
(0.0
02)
0002
6∗∗∗
(0.0
02)
0002
1∗∗∗
(0.0
02)
0001
7∗∗∗
(0.0
03)
0001
4∗∗∗
(0.0
04)
0002
5∗∗∗
(0.0
04)
0002
1∗∗∗
(0.0
05)
0003
2∗∗∗
(0.0
08)
PRICE
(log)
0001
1(0
.101
)00
014
(0.0
98)
0001
8(0
.103
)00
022
(0.0
82)
0002
9(0
.116
)00
009
(0.0
88)
0001
6(0
.108
)00
027
(0.0
71)
Stan
dard
devi
atio
ns4�
�5
CLAS
S00
025∗
∗∗
(0.0
05)
0002
6∗∗∗
(0.0
06)
0003
3∗∗
(0.0
14)
0002
8∗∗
(0.0
11)
0004
2∗(0
.024
)00
033∗
∗∗
(0.0
04)
0002
4∗∗∗
(0.0
04)
0003
7∗∗
(0.0
14)
CRIM
E(lo
g)00
006
(0.0
11)
0001
2(0
.021
)00
012
(0.0
18)
0001
6(0
.018
)00
019
(0.0
16)
0001
0(0
.007
)00
007
(0.0
11)
0001
6(0
.018
)AM
ENITYC
NT(lo
g)00
016
(0.0
29)
0002
3(0
.037
)00
025
(0.0
44)
0002
0(0
.027
)00
025
(0.0
38)
0001
5(0
.026
)00
015
(0.0
22)
0002
4(0
.035
)EX
TAMEN
ITY
(log)
0000
3(0
.014
)00
005
(0.0
19)
0000
4(0
.020
)00
006∗
(0.0
03)
0000
9(0
.015
)00
009
(0.0
16)
0000
3(0
.014
)00
005
(0.0
04)
BEAC
H00
061∗
∗∗
(0.0
12)
0005
6∗∗∗
(0.0
15)
0005
5∗∗∗
(0.0
14)
0006
6∗∗∗
(0.0
17)
0007
2∗(0
.039
)00
064∗
∗∗
(0.0
13)
0006
3∗∗∗
(0.0
11)
0006
8∗∗∗
(0.0
20)
LAKE
0011
2∗(0
.078
)00
104∗
(0.0
58)
0009
7∗(0
.056
)00
114
(0.0
92)
0010
7∗(0
.060
)00
101†
(0.0
67)
0011
4∗∗∗
(0.0
21)
0011
7∗(0
.069
)TR
ANS
0012
9∗∗
(0.0
54)
0011
8∗(0
.064
)00
123∗
∗(0
.061
)00
122∗
∗∗
(0.0
28)
0012
4∗∗∗
(0.0
24)
0011
7∗∗
(0.0
40)
0011
8∗∗
(0.0
49)
0013
3∗∗
(0.0
51)
HIGH
WAY
0006
5∗(0
.035
)00
052
(0.0
43)
0006
8(0
.047
)00
053
(0.0
47)
0007
7(0
.092
)00
069∗
∗(0
.024
)00
067∗
(0.0
36)
0005
2(0
.076
)DO
WNT
OWN
0003
1∗∗
(0.0
11)
0003
4∗∗∗
(0.0
09)
0004
5∗∗∗
(0.0
07)
0002
5∗∗∗
(0.0
02)
0003
9∗∗∗
(0.0
10)
0003
6∗∗
(0.0
14)
0003
2∗(0
.017
)00
038∗
∗∗
(0.0
07)
GMM
obj.
valu
e8.
689e
−48.
115e
−47.
345e
−45.
972e
−46.
001e
−47.
145e
−48.
016e
−46.
638e
−4
Notes.
Iis
base
don
the
mai
nda
tase
t(at
leas
tone
revi
ewfro
mei
ther
Trip
Advi
soro
rTra
velo
city
).II
isba
sed
onth
em
ain
data
setw
ithre
view
coun
t≥5.
IIIis
base
don
the
mai
nda
tase
twith
revi
ewco
unt≥
10.
A1de
note
sal
tern
ativ
ein
stru
men
ts1—
lag
pric
ew
ithGo
ogle
trend
s.A2
deno
tes
alte
rnat
ive
inst
rum
ents
2—re
gion
dum
my
varia
bles
(nor
thea
st,s
outh
,mid
wes
t,so
uthw
est,
wes
t).A3
deno
tes
alte
rnat
ive
inst
ru-
men
ts3—
BLP-
styl
ein
stru
men
ts(a
vera
gech
arac
teris
tics
ofth
esa
me-
star
hote
lsin
othe
rmar
kets
).T
isba
sed
onda
tase
tI,c
onsi
derin
gin
tera
ctio
nsof
tem
pera
ture
sw
ith“la
ke/ri
ver”
and
with
“bea
ch.”
Nde
note
sNo
rmal
dist
ribut
ion
ofth
eid
iosy
ncra
ticer
rort
erm
.a W
eus
edu
mm
yva
riabl
esto
cont
rolf
orni
nem
ajor
hote
lbra
nds:
Acco
r,Be
stW
este
rn,C
enda
nt,C
hoic
e,Hi
lton,
Hyat
t,In
terC
ontin
enta
l,M
arrio
tt,an
dSt
arw
ood.
b Inth
em
ain
estim
atio
n,w
eus
edth
eav
erag
epr
ice
ofth
e“s
ame-
star
ratin
g”ho
tels
inth
eot
herm
arke
tsas
inst
rum
ents
.∗∗∗Si
gnifi
cant
ata
0.1%
leve
l;∗∗si
gnifi
cant
ata
1%le
vel;
∗si
gnifi
cant
ata
5%le
vel;
†si
gnifi
cant
ata
10%
leve
l.

Ghose, Ipeirotis, and Li: Designing Ranking Systems for Hotels Using UGCMarketing Science 31(3), pp. 493–520, © 2012 INFORMS 505
For example, if consumer i is on a business trip, thecorresponding travel purpose vector is
T ′
i = 60 1 0 0 0 0 0 070
Thus, the extended model can be rewritten as
uijkt = �jkt +Xjkt�yyi +Xjkt�T Ti +Xjkt�vvi +�yyiPjkt
+�T TiPjkt +�vviPjkt + �ikt0 (3)
In the next section, we discuss the empirical resultsfrom our basic and extended models.
5. Empirical Analysis and ResultsIn §5.1, we discuss the main results obtained fromthe main data set. In §5.2, we discuss our robustnesstests using (1) the same model based on different sam-ples using alternative levels of online review data and(2) a different model based on the same data sets.Then, in §5.3, we further discuss the results on modelvalidation by comparing our model with the currentcompetitive ones. In §5.4, we provide some manage-rial implications by conducting counterfactual policyexperiments. Finally, in §5.5, we briefly discuss theresults from our extended model.
5.1. Results from the Basic ModelFive location-based characteristics have a positiveimpact on hotel demand: external amenities, prox-imity to the beach, public transportation, a high-way, and downtown. Hotels providing easy accessto public transportation (e.g., subways or bus sta-tions), highway exits, restaurants, shops, or a down-town area can have a much higher demand. BEACHalso has a positive impact on demand. Most beach-based hotels in our data set were located in the South,where the weather typically stays warm year round.Therefore, the desirability of a “walkable” beach-front did not lessen even in the winter (the time ofour data).
Two location-based characteristics have a negativeimpact on hotel demand: the annual crime rate andproximity to a lake. The higher the average reportedcrime rate in a local area, the lower the desirabilityof that area’s hotels. This result indicates that neigh-borhood safety plays an important role in the hotelindustry. The second of these characteristics is inter-esting because one would expect people to choose—rather than avoid—a hotel near a lake. However, mostwaterfront-based hotels in our data set were locatedin places where the weather becomes extremely coldfrom November to January. A waterfront location istherefore going to be less desirable to travelers inwinter.
To further examine the impact of lakefront loca-tions, we collected weather data from the National
Oceanic and Atmospheric Administration (NOAA)on the average temperature from November 2008 toJanuary 2009 for all cities in our data set. Then wedefined two dummy variables: HIGH TEMP, whichequals 1 if the average temperature is higher than50�, and LOW TEMP, which equals 1 if the aver-age temperature is lower than 40�.8 We interactedHIGH TEMP and LOW TEMP separately with LAKEin our model. The results show that the interactionof LOW TEMP with LAKE has a significantly nega-tive effect. This finding supports our earlier argument.Meanwhile, the interaction of HIGH TEMP with LAKEshowed a significantly positive effect, suggesting thatwarmer weather may help the lake area to attractmore visitors. As a robustness check, we conducted asimilar analysis for BEACH conditional on high andlow temperatures. The results show a similar trend.Column 8 of Table 3 shows the corresponding esti-mation results considering the interactions with thetemperature.
Class and amenity count both have a positiveimpact on hotel demand. Hotels with a higher num-ber of amenities and higher star levels have higherdemand, controlling for price. Reviewer rating is alsopositively associated with hotel demand. With regardto the TL_REVIEWCNT and TA_REVIEWCNT vari-ables, we find a positive sign for their linear form anda negative sign for their quadratic form. This findingindicates that the economic impact from the customerreviews is increasing in the volume of reviews but ata decreasing rate, as one would expect.
The textual quality and style of reviews demon-strated a statistically significant association withdemand. All the readability and subjectivity charac-teristics had a statistically significant association withhotel demand. Among the readability subfeatures,complexity, syllables, and spelling errors had a nega-tive sign and therefore are negatively associated withhotel demand. This finding implies that reviews withhigher readability characteristics (shorter sentencesand less complex words) and reviews with fewerspelling errors are positively associated with demand.On the other hand, the sign of the coefficients onCHARACTERS and SMOG is positive, implying thatlonger reviews that are easier to read are positivelyassociated with demand.9 These results indicate thatconsumers can form a judgment about the quality of
8 We tried other combinations to classify high versus low tem-peratures (≥70� as high and ≤30� as low (or) ≥60� as highand ≤20� as low), but they all yielded qualitatively similarresults.9 To alleviate any possible concerns with multicollinearity betweenSMOG and SYLLABLES, we reestimate our model after excludingthe SMOG index variable. We found no change in the qualitativenature of the results across the different data sets.

Ghose, Ipeirotis, and Li: Designing Ranking Systems for Hotels Using UGC506 Marketing Science 31(3), pp. 493–520, © 2012 INFORMS
a hotel by judging the quality of the (user-generated)reviews.
Both “mean subjectivity” and “subjectivity standarddeviation” are negatively associated with demand.This finding implies that consumers tend to believereviews that contain objective information (e.g., fac-tual description of a room) over reviews that containsubjective information (e.g., comfort of a room). Withrespect to the subjectivity standard deviation, our find-ings suggest that people prefer a “consistent objec-tive style” from online customer reviews compared toa mix of objective and subjective sentences. The lastreview-based characteristic was disclosure of revieweridentity (ID). This variable demonstrated a positiveassociation with hotel demand. This result is consis-tent with previous work (Forman et al. 2008), suggest-ing that identity information about reviewers in theonline travel community can positively shape commu-nity members’ judgment of hotels. PRICE has a nega-tive sign, which is as expected.10
Besides the above qualitative implications, we alsoquantitatively assess the economic value of differ-ent hotel characteristics. More specifically, we exam-ined the magnitude of marginal effects on hoteldemand for the location-, service-, and review-basedhotel characteristics. The presence of a nearby beachincreases hotel demand by 18.23%, on average. In con-trast, a nearby lake or river decreases demand by12.83%. Meanwhile, easy access to transportation andto highway exits increases demand by 18.32% and7.87%, respectively. Presence near a downtown areaincreases demand by 5.29%. With regard to service-based characteristics, a one-star increase in hotel classleads to an increase in demand by 4.13%, on average.Moreover, the presence of one more internal or exter-nal amenity increases demand by 0.06% or 0.08%,respectively. Demand decreases by 0.28% if the localcrime rate increases by one unit.
With regard to the review-based characteristics,the SMOG index (which represents the readabilityof the review text) was associated with the high-est marginal influence on demand on average. Aone-level increase in the SMOG index is associatedwith an increase in hotel demand by 9.3%, on aver-age. A one-unit increase in the number of charactersis associated with an increase in hotel demand by0.12%, whereas a one-unit increase in the number ofspelling errors, syllables, or complexity is associatedwith a decrease in hotel demand by 1.41%, 0.50%,and 1.18%, respectively. In terms of review subjectiv-ity, a 10% increase in the average subjectivity level
10 We also considered the covariates “airport,” “convention cen-ters,” and “number of rooms.” The estimation results are consistentwith our current results, but the coefficients for the three charac-teristics are statistically insignificant.
is associated with a decrease in hotel demand by1.55%, and a 10% increase in the standard deviationof subjectivity reduces demand by 4.74%. Finally, a10% increase in the reviewer identity-disclosure lev-els is associated with an increase in hotel demandby 0.68%.
Note that during the period of our data collection,Travelocity displayed 5 reviews per page, whereasTripAdvisor displayed 10 per page. To minimize thebias Web page design might cause (as some customersmay only read the reviews on the first page of eachsite), we decided to consider two more alternativesbesides our main data set: data set (II), with hotelsthat have at least 5 reviews, and data set (III), withhotels that have at least 10 reviews. Controlling forbrand effect, the estimation results from these threedata sets are illustrated in columns 2–4 of Table 3.For normalization purposes, we used the logarithmsof price, characteristics, syllables, spelling errors,crime rate, internal amenities, external amenities, andreview count (both TripAdvisor and Travelocity) in allthe analyses in this paper. See Table 3, columns 5–7,for the corresponding results. The estimation resultsfrom the three data sets are highly consistent. In gen-eral, all the coefficients illustrate a statistical signifi-cance, with a p-value equal to or below the 5% levelacross all three data sets. Moreover, a large majorityof variables present a high significance, with a p-valuebelow the 0.1% level.
5.2. Robustness ChecksTo assess the robustness of our estimation modeland results, we report some additional checks. First,we estimated the same model on alternative samplesplits. We considered three alternative data sets: dataset (IV), containing hotels with at least one reviewfrom TripAdvisor.com; data set (V), containing hotelswith at least one review from Travelocity.com; anddata set (VI), containing hotels with at least onereview from both sites. Table A.1 in Appendix Apresents the results. We found that the coefficientsfrom the estimations are qualitatively similar to ourmain results. Moreover, similar to those in the mainresults, most variables in the robustness tests illus-trate statistical significance at or below the 5% levelor stronger. Thus our estimation results, based onthe hybrid random coefficient model, are consistentacross different data sets.
Second, we conducted another group of tests usingan alternative model commonly used in the indus-trial organization and marketing literature, the ran-dom coefficient logit model (BLP; Berry et al. 1995).As mentioned in §4, the key difference between theBLP approach and our model is that BLP introduces ademand taste shock at each product level (i.e., hotel)
Ghose, Ipeirotis, and Li: Designing Ranking Systems for Hotels Using UGCMarketing Science 31(3), pp. 493–520, © 2012 INFORMS 507
rather than at a group level (i.e., the travel cate-gory), as in our model. Consequently, the substitu-tion space for BLP is different in the sense that BLPdoes not distinguish between the two types of crosssubstitutions—the within-travel and between-travelcategories. Rather, it would treat all hotels as pos-sible substitutes for each other. We added two setsof dummy variables, one for brand and the otherfor travel category. We conducted the same set ofestimations based on data sets (I)–(VI). Table A.2,columns 2–7, in Appendix A contain the results. Inaddition to an alternative specification with homoge-neous coefficients on the travel category dummies, wefurther considered consumers’ heterogeneous prefer-ences by assigning random coefficients to these dum-mies. The last column in Table A.2 in Appendix Ashows the corresponding results.
The results from the BLP model are consistent withour main estimation results using the hybrid model.Specifically, the coefficients from the BLP estimationdemonstrate three trends: (i) they have the same signsas our main results from the hybrid model, whichmeans the economic effects are consistent in direction;(ii) they exhibit lower levels of statistical significancecompared with our main results; and (iii) the mag-nitude of these coefficients is generally higher com-pared with our main results. These three trends arealso consistent with the findings in Song (2011). In thenext subsection, our model validation results furtherconfirm this finding.
Third, to alleviate concerns regarding whether UGChas a causal effect on demand, we conducted an addi-tional robustness test using a regression discontinu-ity (RD) design as suggested by Luca (2011). Morespecifically, our test builds on the special “round-ing mechanism” used by both Travelocity.com andTripAdvisor.com. These two websites generate theiroverall rating for each hotel by rounding the aver-age review ratings to the closest half star. For exam-ple, if the average rating across all reviewers is 3.24,the site rounds that number to 3; if the average rat-ing is 3.25, the site rounds that number to 3.5. Thus,we looked at those hotels with an unrounded averagerating just below and just above each rounding thresh-old. Then we looked for any discontinuous jumps insales patterns following discontinuous jumps in therounded overall rating while controlling for the con-tinuous unrounded rating and other hotel character-istics. Similar to Luca (2011), we based this design onthe assumption that all sales-affecting predeterminedcharacteristics of hotels become increasingly similarwhen approaching both sides of a rounding thresh-old. We found a significant positive treatment effect,suggesting that keeping all else the same, the discon-tinuous pattern in the sales is caused by the discon-tinuous pattern in the rating. This finding strongly
suggests user-generated reviews have a causal impacton hotel demand.
As a further robustness check, we tried differentbandwidths (bin size) of the neighborhood near therounding threshold. Our results are consistent andinsensitive to the bin size. Moreover, to eliminate thepossibility of self-selection bias (e.g., as addressed byHartmann et al. 2011) that could potentially invalidatethe RD design (e.g., hotels may submit the reviewsthemselves to pass the threshold), we performed anadditional McCrary density test (McCrary 2008) assuggested by Luca (2011). In particular, we dividedthe range of rating into small bins with a rangeof 0.05. Then we checked for whether the densityfor the number of submitted reviews is dispropor-tionately large in the bins just above the roundingthreshold (e.g., 3.25–3.3). We performed this checkbecause if hotels are gaming the system and submit-ting reviews themselves, we would expect to see sucha pattern. We did not find any significant differencein the density from our data, suggesting no evidencefor hotel “gaming” behavior. In summary, the addi-tional robustness tests using RD design together withthe McCrary density test give us more confidencein the causal impact of online reviews on productdemand.
5.3. Model ComparisonFor comparison purposes, we estimated three base-line models: the BLP model, the PCM, and the nestedlogit model with the travel category at the top hier-archy. Based on a study by Steckel and Vanhonacker(1993), we randomly partitioned our main sampledata set (I) into two parts: a subset with 70% of thetotal observations as the estimation sample and a sub-set with 30% of the total observations as the hold-out sample. To minimize any potential bias from thepartition procedure, we performed a 10-fold crossvalidation. We conducted this validation process forour random coefficient model and the three baselinemodels. Furthermore, to examine the model’s abil-ity to capture a deeper level of consumer hetero-geneity, we compared an extended version of ourmodel with an extended version of the BLP modelwhen incorporating additional interaction effects(i.e., travel purpose interacted with price and hotelcharacteristics).
To examine the significance of the UGC-based,location-based, and service-based hotel characteris-tics, we compared the original hybrid model withthe same model but excluding the UGC, location,and service variables, respectively. Finally, to eval-uate the usefulness of different aspects of UGC inmodeling the demand, we further conducted modelcomparison using the hybrid model but excludingthe numerical ratings and the textual review features,

Ghose, Ipeirotis, and Li: Designing Ranking Systems for Hotels Using UGC508 Marketing Science 31(3), pp. 493–520, © 2012 INFORMS
respectively. We also evaluated models without eachof the textual features, such as readability, subjectivity,and reviewer-identity variables, respectively. We havedone the above work for both in-sample and out-of-sample comparisons. Tables B.1–B.8 in Appendix Bcontain the results.11
The results show that conditioning on UGC vari-ables significantly improves a model’s predictivepower. With respect to out-of-sample root meansquare error (RMSE), the model fit improves by36.16% when adding the UGC variables. Similartrends in improvement in our model fit occur withrespect to the other two metrics, mean square error(MSE) and mean absolute deviation (MAD), in bothin-sample and out-of-sample analyses.
Our out-of-sample results in Table B.5 illustratethat our model improves by 12.86% in RMSE com-pared to the BLP model with no random coefficientson travel category dummies. This number becomes53.85%, 63.28%, and 9.64% for the PCM, the nestedlogit model, and the BLP model with random coef-ficients on travel category dummies, respectively.Thus, our model provides the best overall perfor-mance in both precision (i.e., RMSE, MSE) and devi-ation (i.e., MAD) of the predicted market share. Thenested logit model demonstrates the weakest pre-dictive power. Moreover, as illustrated in Table B.6,when incorporating interaction effects, although bothmodels show improvement in predictive power, theextended hybrid model performs much better thanthe extended BLP model.
Table B.7 shows that by including the UGC,location-based, and service-based variables, ourmodel fit improves by 36.16%, 55.77%, and 53.56%,respectively, in RMSE. Similar trends in improvementin our model fit occur with respect to MSE and MAD.Therefore, our results suggest that the model’s pre-dictive power would decrease the most if we were toexclude the location-based variables from our model,followed by the service-based variables, and finallyby the UGC variables. This finding strongly indicateslocation- and service-based characteristics are indeedthe two most influential factors for hotel demand.
Moreover, Table B.8 shows that of all the UGC-related features, textual information improves themodel’s predictive power significantly more than the
11 With regard to the unobserved characteristics required for out-of-sample prediction using the hybrid model, BLP model, and PCM,we applied the same method as suggested in Athey and Imbens(2007). We drew the unobserved characteristics for the holdout sam-ple randomly from the marginal distribution of unobserved char-acteristics from the estimation sample. This method has also beenused in the marketing literature. See, for example, Nair et al. (2005),who infer the structural error for the holdout sample from themarginal distribution of the structural error across different mar-kets derived from the estimation sample.
numerical features by 35.17% and 21.06%, respec-tively, in RMSE. In addition, within the set oftextual features, the review readability and subjectiv-ity show a higher impact than the reviewer-identityinformation.
5.4. Counterfactual ExperimentsA key advantage of structural modeling is its poten-tial for normative policy evaluation. To explicitlymeasure the economic impact of strategic policies, weconducted a counterfactual experiment. Specifically,we looked into how a price change in one type ofhotel affects the demand for other types of hotels toexamine the extent of competition (and consequentsubstitution patterns) between hotels. We focused onhotels with different star ratings for this analysis.
We assumed a price cut by 20% for all four-star hotels in an effort to determine the demandchanges for the five-, three-, two-, and one-star hotels.We find the demand for four-star hotels increases2.9%, whereas the demand for all other hotel classesdecreases. Demand for five-star hotels drops the most(5.34%), followed by three-star hotels (3.88%), one-star hotels (2.87%), and finally two-star hotels (2.6%).We also conducted similar analyses for hotels fromother classes. For example, by assuming a 20% pricecut for the three-star hotels, we find the demand forthree-star hotels increases by 2.79%, and the demandfor four- and two-star hotels drops the most—5.14%and 5.01%, respectively.
The basic findings from the above set of experi-ments are as follows: (i) a price cut for a particularclass of hotels tends to cause a demand drop for allhotels in the lower-level classes, and (ii) the closestsubstitutes for four-star hotels are five-star hotels, theclosest substitutes for three-star hotels are four- andtwo-star hotels, and the closest substitutes for two-star hotels are one-star hotels.
5.5. Results from Model ExtensionsAs discussed in §§4.3 and 4.4, we also estimated twoextended models. Table 4 shows the estimation resultsfor the extended model with additional text features.We see the qualitative nature of our main resultsremains the same. The three features that have a posi-tive and statistically significant impact on demand arefood quality, hotel staff, and parking facilities. Amongthese three features, food quality presents the highestpositive impact, followed by hotel staff and parking.In contrast, bedroom quality has a negative impacton demand. This negative sign may seem surprising.One possible explanation is that consumers often usebedroom quality as a cue for price, especially giventhat quality in our data is a proxy for the numberof beds and size of the room (full, queen, king, etc.).This situation may occur when prices are obfuscated
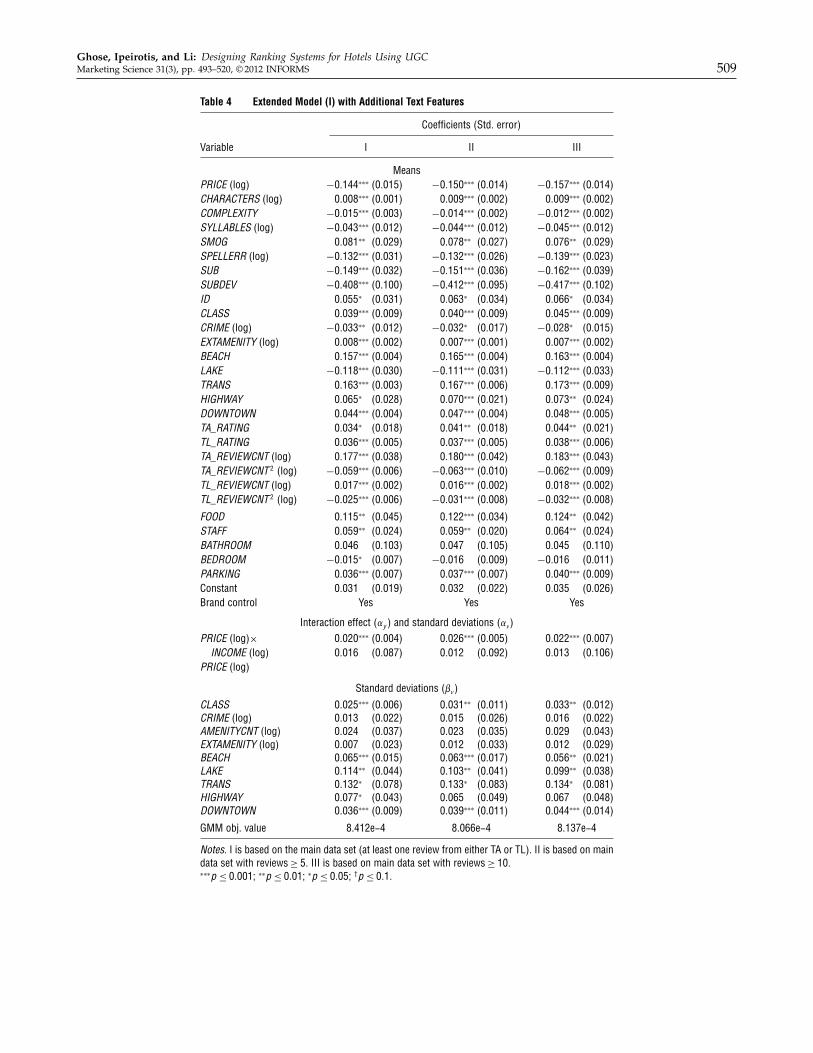
Ghose, Ipeirotis, and Li: Designing Ranking Systems for Hotels Using UGCMarketing Science 31(3), pp. 493–520, © 2012 INFORMS 509
Table 4 Extended Model (I) with Additional Text Features
Coefficients (Std. error)
Variable I II III
MeansPRICE (log) −00144∗∗∗ (0.015) −00150∗∗∗ (0.014) −00157∗∗∗ (0.014)CHARACTERS (log) 00008∗∗∗ (0.001) 00009∗∗∗ (0.002) 00009∗∗∗ (0.002)COMPLEXITY −00015∗∗∗ (0.003) −00014∗∗∗ (0.002) −00012∗∗∗ (0.002)SYLLABLES (log) −00043∗∗∗ (0.012) −00044∗∗∗ (0.012) −00045∗∗∗ (0.012)SMOG 00081∗∗ (0.029) 00078∗∗ (0.027) 00076∗∗ (0.029)SPELLERR (log) −00132∗∗∗ (0.031) −00132∗∗∗ (0.026) −00139∗∗∗ (0.023)SUB −00149∗∗∗ (0.032) −00151∗∗∗ (0.036) −00162∗∗∗ (0.039)SUBDEV −00408∗∗∗ (0.100) −00412∗∗∗ (0.095) −00417∗∗∗ (0.102)ID 00055∗ (0.031) 00063∗ (0.034) 00066∗ (0.034)CLASS 00039∗∗∗ (0.009) 00040∗∗∗ (0.009) 00045∗∗∗ (0.009)CRIME (log) −00033∗∗ (0.012) −00032∗ (0.017) −00028∗ (0.015)EXTAMENITY (log) 00008∗∗∗ (0.002) 00007∗∗∗ (0.001) 00007∗∗∗ (0.002)BEACH 00157∗∗∗ (0.004) 00165∗∗∗ (0.004) 00163∗∗∗ (0.004)LAKE −00118∗∗∗ (0.030) −00111∗∗∗ (0.031) −00112∗∗∗ (0.033)TRANS 00163∗∗∗ (0.003) 00167∗∗∗ (0.006) 00173∗∗∗ (0.009)HIGHWAY 00065∗ (0.028) 00070∗∗∗ (0.021) 00073∗∗ (0.024)DOWNTOWN 00044∗∗∗ (0.004) 00047∗∗∗ (0.004) 00048∗∗∗ (0.005)TA_RATING 00034∗ (0.018) 00041∗∗ (0.018) 00044∗∗ (0.021)TL_RATING 00036∗∗∗ (0.005) 00037∗∗∗ (0.005) 00038∗∗∗ (0.006)TA_REVIEWCNT (log) 00177∗∗∗ (0.038) 00180∗∗∗ (0.042) 00183∗∗∗ (0.043)TA_REVIEWCNT 2 (log) −00059∗∗∗ (0.006) −00063∗∗∗ (0.010) −00062∗∗∗ (0.009)TL_REVIEWCNT (log) 00017∗∗∗ (0.002) 00016∗∗∗ (0.002) 00018∗∗∗ (0.002)TL_REVIEWCNT 2 (log) −00025∗∗∗ (0.006) −00031∗∗∗ (0.008) −00032∗∗∗ (0.008)
FOOD 00115∗∗ (0.045) 00122∗∗∗ (0.034) 00124∗∗ (0.042)STAFF 00059∗∗ (0.024) 00059∗∗ (0.020) 00064∗∗ (0.024)BATHROOM 00046 (0.103) 00047 (0.105) 00045 (0.110)BEDROOM −00015∗ (0.007) −00016 (0.009) −00016 (0.011)PARKING 00036∗∗∗ (0.007) 00037∗∗∗ (0.007) 00040∗∗∗ (0.009)Constant 00031 (0.019) 00032 (0.022) 00035 (0.026)Brand control Yes Yes Yes
Interaction effect 4�y 5 and standard deviations 4��5
PRICE (log)× 00020∗∗∗ (0.004) 00026∗∗∗ (0.005) 00022∗∗∗ (0.007)INCOME (log) 00016 (0.087) 00012 (0.092) 00013 (0.106)
PRICE (log)
Standard deviations (��)
CLASS 00025∗∗∗ (0.006) 00031∗∗ (0.011) 00033∗∗ (0.012)CRIME (log) 00013 (0.022) 00015 (0.026) 00016 (0.022)AMENITYCNT (log) 00024 (0.037) 00023 (0.035) 00029 (0.043)EXTAMENITY (log) 00007 (0.023) 00012 (0.033) 00012 (0.029)BEACH 00065∗∗∗ (0.015) 00063∗∗∗ (0.017) 00056∗∗ (0.021)LAKE 00114∗∗ (0.044) 00103∗∗ (0.041) 00099∗∗ (0.038)TRANS 00132∗ (0.078) 00133∗ (0.083) 00134∗ (0.081)HIGHWAY 00077∗ (0.043) 00065 (0.049) 00067 (0.048)DOWNTOWN 00036∗∗∗ (0.009) 00039∗∗∗ (0.011) 00044∗∗∗ (0.014)
GMM obj. value 8.412e−4 8.066e−4 8.137e−4
Notes. I is based on the main data set (at least one review from either TA or TL). II is based on maindata set with reviews ≥ 5. III is based on main data set with reviews ≥ 10.∗∗∗p ≤ 00001; ∗∗p ≤ 0001; ∗p ≤ 0005; †p ≤ 001.

Ghose, Ipeirotis, and Li: Designing Ranking Systems for Hotels Using UGC510 Marketing Science 31(3), pp. 493–520, © 2012 INFORMS
on the main results page and are only available justbefore checkout.
Next, we estimate the model with additional inter-action effects to better understand how the dis-tribution of consumers’ demographic informationinfluences the distribution of consumers’ heteroge-neous preferences. More specifically, the extendedmodel is able to capture six interaction effects:
1. Between travel category and hotel characteristics(e.g., location, service).
2. Between travel category and price.3. Between income and hotel characteristics.4. Between income and price.5. Between unobserved consumer characteristics and
hotel characteristics.6. Between unobserved consumer characteristics and
price.Note that the basic model already captures inter-
action effects 4–6, whereas the extended model fur-ther relaxes the model assumptions by consideringthree additional interaction effects. The correspond-ing results for the extended model are provided inTables 5(a) and 5(b).
First, we notice that consumers’ travel purposescan explain their heterogeneous tastes toward price.For example, from Table 5(a), we see the mean pricecoefficient is −00145. From Table 5(b), we can inferthat if a consumer is on a business trip, her price
Table 5(a) Extended Model (II) Mean Coefficients
Mean coefficients(Std. error)
PRICE (log) −00145∗∗∗ (0.003)CHARACTERS (log) 00009∗∗∗ (0.002)COMPLEXITY −00012∗∗∗ (0.003)SYLLABLES (log) −00045∗∗∗ (0.008)SMOG 00083∗∗ (0.029)SPELLERR (log) −00129∗∗∗ (0.003)SUB −00138∗∗∗ (0.007)SUBDEV −00403∗∗∗ (0.016)ID 00055∗ (0.030)CLASS 00037∗∗∗ (0.008)CRIME (log) −00025∗ (0.016)AMENITYCNT (log) 00005∗∗ (0.002)EXTAMENITY (log) 00007∗∗∗ (0.001)BEACH 00158∗∗∗ (0.005)LAKE −00111∗∗∗ (0.021)TRANS 00159∗∗∗ (0.003)HIGHWAY 00064∗ (0.030)DOWNTOWN 00045∗∗∗ (0.002)TA_RATING 00033∗∗ (0.012)TL_RATING 00031∗∗ (0.011)TA_REVIEWCNT (log) 00180∗∗∗ (0.046)TA_REVIEWCNT 2 (log) −00055∗∗∗ (0.007)TL_REVIEWCNT (log) 00014∗∗∗ (0.003)TL_REVIEWCNT 2 (log) −00021∗∗ (0.008)Constant 00037∗∗ (0.017)
∗∗∗p ≤ 00001; ∗∗p ≤ 0001; ∗p ≤ 0005; †p ≤ 0010
Tabl
e5(
b)Ex
tend
edM
odel
(II)A
dditi
onal
Inte
ract
ion
Effe
cts
and
Stan
dard
Devi
atio
nsof
Coef
ficie
nts
Varia
ble
v iINCO
ME
(log)
Family
Business
Romance
Tourist
Kids
Seniors
Pets
PRICE
(log)
0001
2(0
.076
)00
021∗
∗∗
(0.0
03)
−00
011∗
∗∗
(0.0
00)
0003
8∗∗∗
(0.0
05)
−00
003∗
∗∗
(0.0
00)
−00
015∗
∗∗
(0.0
04)
0003
2∗∗∗
(0.0
04)
−00
007
(0.0
71)
−00
018
(0.0
43)
CLAS
S00
019
(0.0
28)
0001
7∗∗∗
(0.0
02)
0004
6∗∗∗
(0.0
12)
0002
3∗∗
(0.0
11)
0010
8∗∗∗
(0.0
28)
−00
014∗
∗∗
(0.0
03)
0002
1∗(0
.011
)00
033
(0.0
27)
−00
052
(0.0
81)
CRIM
E(lo
g)00
012
(0.0
23)
0000
2(0
.007
)−
0003
3∗(0
.017
)00
087
(0.0
65)
−00
037
(0.0
34)
−00
023
(0.0
75)
−00
046∗
∗∗
(0.0
03)
0001
2(0
.011
)00
026
(0.0
44)
AMEN
ITYC
NT(lo
g)00
021
(0.0
43)
0001
5(0
.012
)00
027
(0.0
29)
0003
5(0
.040
)00
008∗
∗∗
(0.0
01)
−00
004
(0.0
06)
0000
1(0
.024
)−
0000
5(0
.009
)−
0001
1(0
.027
)EX
TAMEN
ITY
(log)
0001
4(0
.022
)00
035
(0.0
50)
0006
3(0
.097
)00
011∗
∗∗
(0.0
04)
0001
7∗∗∗
(0.0
04)
0000
3(0
.004
)00
009∗
∗∗
(0.0
01)
−00
014
(0.0
11)
0004
9(0
.042
)BE
ACH
0002
9(0
.026
)00
037∗
∗(0
.014
)−
0005
9(0
.045
)−
0004
0∗(0
.023
)00
165∗
∗∗
(0.0
10)
−00
062
(0.0
49)
0015
3∗∗∗
(0.0
25)
0003
7(0
.031
)00
015
(0.0
17)
LAKE
0005
3(0
.083
)00
011
(0.0
24)
−00
206
(0.1
83)
0003
3(0
.064
)00
022
(0.0
18)
−00
125
(0.2
01)
−00
027
(0.0
25)
−00
050
(0.1
21)
0002
8(0
.040
)TR
ANS
0007
7(0
.081
)−
0012
5(0
.231
)−
0002
5∗∗
(0.0
11)
0015
7∗∗∗
(0.0
14)
−00
011∗
(0.0
06)
−00
033
(0.0
56)
0004
1(0
.038
)00
166
(0.2
02)
−00
039
(0.0
31)
HIGH
WAY
0004
2(0
.039
)−
0000
9∗(0
.005
)−
0002
1∗∗∗
(0.0
05)
0012
0∗∗∗
(0.0
31)
−00
022∗
∗∗
(0.0
02)
0003
9∗∗∗
(0.0
09)
0006
3∗∗∗
(0.0
13)
0006
2(0
.100
)00
177
(0.1
58)
DOWNT
OWN
0002
6(0
.017
)−
0001
8(0
.021
)00
188∗
∗∗
(0.0
10)
0004
1(0
.037
)−
0000
2(0
.017
)−
0002
9∗(0
.015
)00
121∗
∗∗
(0.0
23)
−00
040
(0.0
36)
0013
6(0
.101
)
∗∗∗p
≤00
001;
∗∗p
≤00
01;∗p
≤00
05;†p
≤00
10
Ghose, Ipeirotis, and Li: Designing Ranking Systems for Hotels Using UGCMarketing Science 31(3), pp. 493–520, © 2012 INFORMS 511
coefficient will increase by 0.038 relative to the aver-age traveler. In contrast, if a consumer is on a fam-ily trip or a romantic trip, her price coefficient is0.011 or 0.003, respectively, below that of the aver-age traveler. Among all types of travelers, all elsebeing equal, tourists (i.e., travelers with a large grouptour) tend to be the most price sensitive, with a pricecoefficient 0.015 below that of the average traveler,whereas business travelers are the least price sensi-tive. These findings are consistent with those fromthe marginal effects of price change on demand. Forinstance, we find that a 20% increase in hotel priceleads to a 1.8% demand drop from business travelers,a 2.6% drop from family travelers, a 2.48% demanddrop from romantic travelers, and a 2.67% demanddrop from tourists.
Furthermore, we find travel purpose also influencesconsumer heterogeneity toward different hotel loca-tion and service characteristics. For instance, busi-ness travelers have the highest marginal valuation forclose proximity to a highway and public transporta-tion. From Table 5(a), we see the mean coefficients forHIGHWAY and TRANS are 0.064 and 0.159, respec-tively. According to the estimated interaction effectsin Table 5(b), the coefficients from business travel-ers for HIGHWAY and TRANS are higher than themean coefficients, with an increase to 0.120 and 0.157,respectively. Likewise, the presence of an interstatehighway near a hotel increases demand from businesstravelers by 19.20%, compared to a 6.68% increasefrom the average traveler and a 5.34% increase fromromantic travelers. Similarly, the presence of publictransportation near a hotel increases hotel demandfrom business travelers by 35.74%, compared to a17.98% increase from the average traveler and a15.16% increase from family travelers.
In contrast, romantic travelers are more sensitiveto CLASS and BEACH compared with other typesof travelers. For example, the presence of a beachnear a hotel increases demand from romantic travel-ers by 37.11%, compared to an 18.15% increase fromthe average traveler and a 13.54% increase from busi-ness travelers. Similarly, a one-star improvement inhotel class leads to an increase in hotel demandfrom romantic travelers by 21.95%, compared to a5.61% increase from the average traveler and a 3.47%increase from tourists.
Finally, Table 5(b) shows that after we accountfor the interaction effects, all the estimates onthe unobserved consumer characteristics (i.e., vi5become insignificant at conventional significance lev-els. This finding is consistent with Nevo (2001),who shows that the observable—rather than theunobservable—demographics explain most of theconsumer heterogeneity.
6. Utility Gain-Based Hotel RankingHaving estimated the parameters from the model in§4, we next derive the utility gain a consumer witha particular travel purpose receives from staying ina given hotel. This helps us propose a new rankingsystem for hotels based on the average utility gainfrom transactions in each hotel. As discussed in §4,to capture consumer heterogeneity, we model the util-ity from each hotel for each consumer as consistingof two parts: the mean and the deviation. The meanutility provides us with a good estimation of howmuch consumers can benefit from choosing a particu-lar hotel, whereas the deviation of utility describes thevariance of this benefit. We are interested in know-ing consumers’ utility gain on an aggregate level fromchoosing a certain hotel. Therefore, we define the aver-age utility gain from hotel j with travel category type kas the sum of its mean utility across all weeks:
Utility Gainjk =∑
t
�̄jkt0 (4)
6.1. Ranking HotelsIn the ranking approach we propose, a hotel that pro-vides a comparably higher average utility gain thanothers would appear at the top of our list. Using thecoefficients for hotel characteristics estimated fromour model, we are able to compute the average utilitygain based on Equation (4). Notice that in this equa-tion, �̄jkt is the average value of the estimated utilitygain over the consumer population in market t:
�̄jkt =1N
N∑
i
4�jkt+Xjkt�vvi+�yyiPjkt+�vviPjkt+�ikt51 (5)
where N represents the total number of consumersinvolved in the estimation. This definition takes intoaccount all the sources of uncertainty, such as the ran-dom coefficients and model errors. Since by assump-tion Xjkt�vvi + �yyiPjkt + �vviPjkt + �ikt is mean-zero(e.g., Nevo 2001), in our computation, Equation (5)can be simplified as follows:
�̄jkt =1N
N∑
i
4�jkt50 (6)
Using the estimates from the previous analysis, wecompute �̄jkt . We determine the final average utilitygain, Utility Gainjk , by summing over �̄jkt across allmarkets. As the final ranking criterion, the averageutility gain provides us with a new metric to rankhotels in response to a user query on the travel searchengine.
6.2. User Study Based on Online SurveyTo evaluate the quality of our ranking technique,we conducted an extensive user study in which we
Ghose, Ipeirotis, and Li: Designing Ranking Systems for Hotels Using UGC512 Marketing Science 31(3), pp. 493–520, © 2012 INFORMS
designed and executed several online surveys usingAmazon Mechanical Turk. We computed the expectedutility for each hotel from our parameter estimatesand ranked the hotels in each city according to theiraverage utility gain. Then we generated differentrankings for the top 10 hotels in accordance withseveral existing baseline criteria deployed by travelsearch engines: most booked, price low to high, pricehigh to low, hotel class, hotel size (number of rooms),and number of internal amenities. We also consid-ered four other benchmark criteria based on UGC:customer rating from TripAdvisor.com, customer rat-ing from Travelocity.com, mixed rating from TripAd-visor.com and Travelocity.com, and maximum onlinereview count. Moreover, to examine the significanceof the UGC and of the comprehensive model to theoverall performance of the ranking scheme, we gen-erated two more baselines using the BLP model (asdescribed in §5.2) and the same hybrid model, butexcluding all UGC variables. Finally, we also gen-erated a combined ranking using combined criteriaof price and hotel class to examine whether a rank-ing that attempts to introduce diversity artificially cancompete with our utility-based ranking. We did thisby interlacing the top five hotels with “the lowestprice” and the top five hotels with “the highest num-ber of stars.”12
In our study, we presented our model-generatedranking together with one of the above-mentionedalternative rankings and asked users to compare eachpair of rankings—that is, our ranking paired with oneof the existing benchmarks. To avoid any potentialbias, we did not release any information to the usersabout the criteria for generating those rankings, andwe randomized the presentation order of the rank-ings. The studies in our ranking evaluations wereblind pairwise tests in which we presented the tworankings side, by side and the user had to pick oneof them without having any information beyond thelist of the hotels. This setting resulted in 13 differ-ent surveys for each of the six cities (Los Angeles,New Orleans, New York, Orlando, San Francisco, andSalt Lake City), giving us 78 surveys with 100 partici-pants each, equaling 7,800 user comparisons of differ-ent ranking lists. To further control for any biases, weconducted this user study with stringent controls inthe design and execution of the survey. Appendix Cprovides more details on the user study.
12 We also tried interlacing rankings with different criteria, such as“the highest price” and the “lowest number of stars,” or “the low-est price” and the “lowest number of stars,” or “the highest price”and the “highest number of stars.” The results are similar, whichsuggests that customers prefer a list of hotels that specialize in avariety of characteristics, rather than a variety of hotels, each spe-cializing in only one characteristic.
Our results (see Table 6) show that for each of the 13comparisons in each of the six cities, the majority ofcustomers preferred our ranking (p = 0005, sign test).Notice that in all 78 surveys, we observe a statisti-cally significant difference for our ranking (p = 0005,sign test). The overall set of results (i.e., in none of the78 surveys was our ranking deemed worse) indicatesthat our ranking strategy is preferable to the exist-ing baselines. (Figure C.1 in Appendix C provides ascreenshot of sample tasks from the online survey.)Moreover, users preferred our ranking based on thehybrid model with UGC variables over the one with-out UGC variables and over the one generated basedon the BLP model. This finding further demonstratesthe importance of incorporating UGC variables in anydemand estimation model that generates a rankingsystem for products in shopping search engines. Fur-thermore, we checked the click-throughs of the top-ranked hotel in each ranking list. On average (over atotal of 78 comparison tasks), the top-ranked hotel inour utility-based ranking list received approximatelytwo times the clicks compared to its counterpart inthe competitor ranking list. This provides additionalsupport that our ranking can help users locate thebest-value hotel early on.
To better understand how users interpret theutility-based ranking, we also asked consumers whythey chose a particular ranking. The majority ofusers indicated our utility-based ranking promotedthe idea that price was not the main factor in rat-ing a hotel’s quality. Instead, a good ranking rec-ommendation satisfies customers’ multidimensionalpreferences for hotels. Moreover, users strongly pre-ferred the diversity of the retrieved results, giventhat the list consisted of a mix of hotels cuttingacross several price and quality ranges. In contrast,the other ranking approaches tended to list hotels ofonly one type (e.g., very expensive for “star ratings”or mainly three-star hotels for “most booked”). Noticethat even the ranking baseline with the combinedcriteria showed a similar trend. This finding furtherindicates customers prefer a list of hotels where eachspecializes in a variety of characteristics rather than avariety of hotels where each specializes in only a fewcharacteristics.
Of course, diversity of results is a well-known fac-tor of user satisfaction in Web search (Agichtein et al.2006). Although we could potentially try to imitatesolutions from Web search and introduce diversity inthe results in an exogenous manner, we observe thatthe approach based on consumer-utility theory intro-duces diversity naturally in the results. This resultseems intuitive: if a specific segment of the mar-ket systematically appears to be underpriced—hence,introducing a nondiverse set of results—market forceswould modify the prices for the whole segment
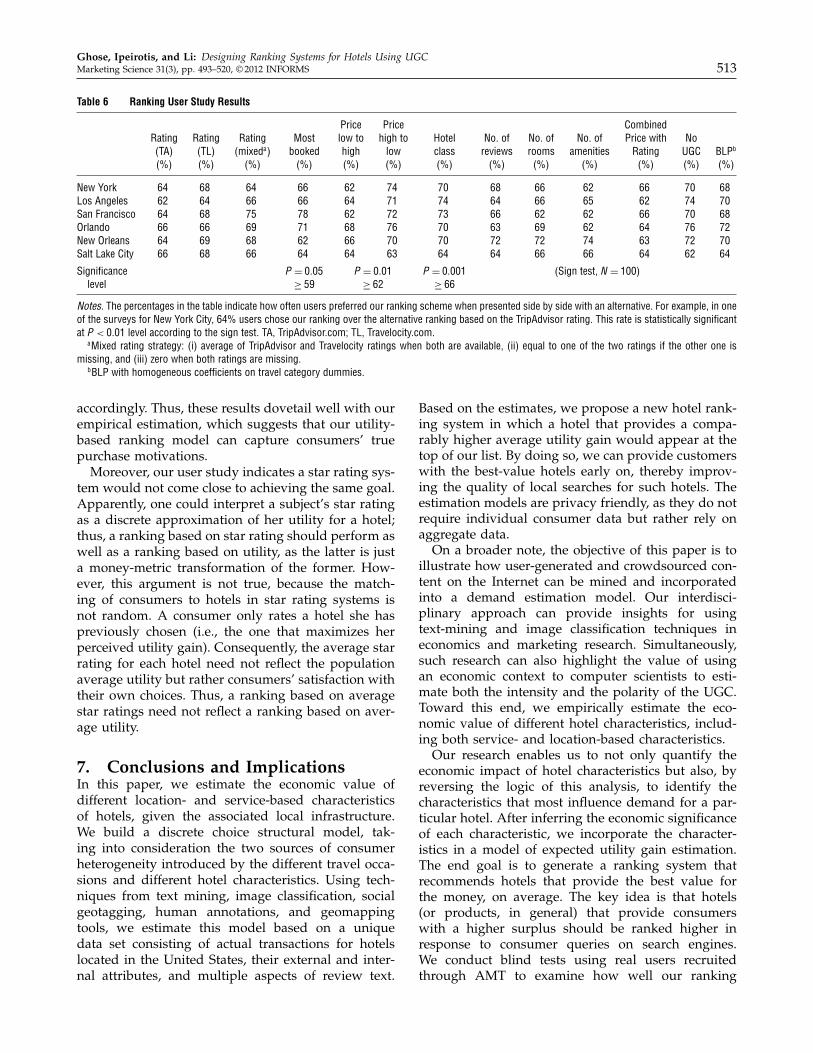
Ghose, Ipeirotis, and Li: Designing Ranking Systems for Hotels Using UGCMarketing Science 31(3), pp. 493–520, © 2012 INFORMS 513
Table 6 Ranking User Study Results
Price Price CombinedRating Rating Rating Most low to high to Hotel No. of No. of No. of Price with No(TA) (TL) (mixeda) booked high low class reviews rooms amenities Rating UGC BLPb
(%) (%) (%) (%) (%) (%) (%) (%) (%) (%) (%) (%) (%)
New York 64 68 64 66 62 74 70 68 66 62 66 70 68Los Angeles 62 64 66 66 64 71 74 64 66 65 62 74 70San Francisco 64 68 75 78 62 72 73 66 62 62 66 70 68Orlando 66 66 69 71 68 76 70 63 69 62 64 76 72New Orleans 64 69 68 62 66 70 70 72 72 74 63 72 70Salt Lake City 66 68 66 64 64 63 64 64 66 66 64 62 64
Significance P = 0005 P = 0001 P = 00001 (Sign test, N = 100)level ≥ 59 ≥ 62 ≥ 66
Notes. The percentages in the table indicate how often users preferred our ranking scheme when presented side by side with an alternative. For example, in oneof the surveys for New York City, 64% users chose our ranking over the alternative ranking based on the TripAdvisor rating. This rate is statistically significantat P < 0001 level according to the sign test. TA, TripAdvisor.com; TL, Travelocity.com.
aMixed rating strategy: (i) average of TripAdvisor and Travelocity ratings when both are available, (ii) equal to one of the two ratings if the other one ismissing, and (iii) zero when both ratings are missing.
bBLP with homogeneous coefficients on travel category dummies.
accordingly. Thus, these results dovetail well with ourempirical estimation, which suggests that our utility-based ranking model can capture consumers’ truepurchase motivations.
Moreover, our user study indicates a star rating sys-tem would not come close to achieving the same goal.Apparently, one could interpret a subject’s star ratingas a discrete approximation of her utility for a hotel;thus, a ranking based on star rating should perform aswell as a ranking based on utility, as the latter is justa money-metric transformation of the former. How-ever, this argument is not true, because the match-ing of consumers to hotels in star rating systems isnot random. A consumer only rates a hotel she haspreviously chosen (i.e., the one that maximizes herperceived utility gain). Consequently, the average starrating for each hotel need not reflect the populationaverage utility but rather consumers’ satisfaction withtheir own choices. Thus, a ranking based on averagestar ratings need not reflect a ranking based on aver-age utility.
7. Conclusions and ImplicationsIn this paper, we estimate the economic value ofdifferent location- and service-based characteristicsof hotels, given the associated local infrastructure.We build a discrete choice structural model, tak-ing into consideration the two sources of consumerheterogeneity introduced by the different travel occa-sions and different hotel characteristics. Using tech-niques from text mining, image classification, socialgeotagging, human annotations, and geomappingtools, we estimate this model based on a uniquedata set consisting of actual transactions for hotelslocated in the United States, their external and inter-nal attributes, and multiple aspects of review text.
Based on the estimates, we propose a new hotel rank-ing system in which a hotel that provides a compa-rably higher average utility gain would appear at thetop of our list. By doing so, we can provide customerswith the best-value hotels early on, thereby improv-ing the quality of local searches for such hotels. Theestimation models are privacy friendly, as they do notrequire individual consumer data but rather rely onaggregate data.
On a broader note, the objective of this paper is toillustrate how user-generated and crowdsourced con-tent on the Internet can be mined and incorporatedinto a demand estimation model. Our interdisci-plinary approach can provide insights for usingtext-mining and image classification techniques ineconomics and marketing research. Simultaneously,such research can also highlight the value of usingan economic context to computer scientists to esti-mate both the intensity and the polarity of the UGC.Toward this end, we empirically estimate the eco-nomic value of different hotel characteristics, includ-ing both service- and location-based characteristics.
Our research enables us to not only quantify theeconomic impact of hotel characteristics but also, byreversing the logic of this analysis, to identify thecharacteristics that most influence demand for a par-ticular hotel. After inferring the economic significanceof each characteristic, we incorporate the character-istics in a model of expected utility gain estimation.The end goal is to generate a ranking system thatrecommends hotels that provide the best value forthe money, on average. The key idea is that hotels(or products, in general) that provide consumerswith a higher surplus should be ranked higher inresponse to consumer queries on search engines.We conduct blind tests using real users recruitedthrough AMT to examine how well our ranking
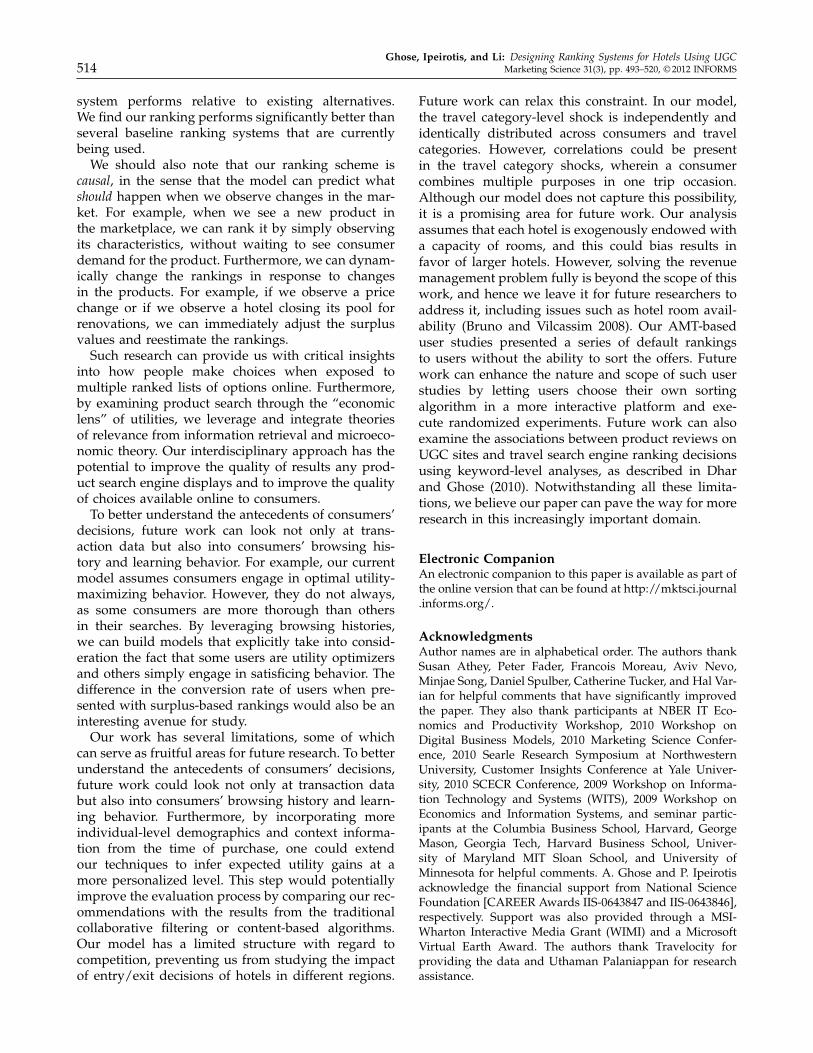
Ghose, Ipeirotis, and Li: Designing Ranking Systems for Hotels Using UGC514 Marketing Science 31(3), pp. 493–520, © 2012 INFORMS
system performs relative to existing alternatives.We find our ranking performs significantly better thanseveral baseline ranking systems that are currentlybeing used.
We should also note that our ranking scheme iscausal, in the sense that the model can predict whatshould happen when we observe changes in the mar-ket. For example, when we see a new product inthe marketplace, we can rank it by simply observingits characteristics, without waiting to see consumerdemand for the product. Furthermore, we can dynam-ically change the rankings in response to changesin the products. For example, if we observe a pricechange or if we observe a hotel closing its pool forrenovations, we can immediately adjust the surplusvalues and reestimate the rankings.
Such research can provide us with critical insightsinto how people make choices when exposed tomultiple ranked lists of options online. Furthermore,by examining product search through the “economiclens” of utilities, we leverage and integrate theoriesof relevance from information retrieval and microeco-nomic theory. Our interdisciplinary approach has thepotential to improve the quality of results any prod-uct search engine displays and to improve the qualityof choices available online to consumers.
To better understand the antecedents of consumers’decisions, future work can look not only at trans-action data but also into consumers’ browsing his-tory and learning behavior. For example, our currentmodel assumes consumers engage in optimal utility-maximizing behavior. However, they do not always,as some consumers are more thorough than othersin their searches. By leveraging browsing histories,we can build models that explicitly take into consid-eration the fact that some users are utility optimizersand others simply engage in satisficing behavior. Thedifference in the conversion rate of users when pre-sented with surplus-based rankings would also be aninteresting avenue for study.
Our work has several limitations, some of whichcan serve as fruitful areas for future research. To betterunderstand the antecedents of consumers’ decisions,future work could look not only at transaction databut also into consumers’ browsing history and learn-ing behavior. Furthermore, by incorporating moreindividual-level demographics and context informa-tion from the time of purchase, one could extendour techniques to infer expected utility gains at amore personalized level. This step would potentiallyimprove the evaluation process by comparing our rec-ommendations with the results from the traditionalcollaborative filtering or content-based algorithms.Our model has a limited structure with regard tocompetition, preventing us from studying the impactof entry/exit decisions of hotels in different regions.
Future work can relax this constraint. In our model,the travel category-level shock is independently andidentically distributed across consumers and travelcategories. However, correlations could be presentin the travel category shocks, wherein a consumercombines multiple purposes in one trip occasion.Although our model does not capture this possibility,it is a promising area for future work. Our analysisassumes that each hotel is exogenously endowed witha capacity of rooms, and this could bias results infavor of larger hotels. However, solving the revenuemanagement problem fully is beyond the scope of thiswork, and hence we leave it for future researchers toaddress it, including issues such as hotel room avail-ability (Bruno and Vilcassim 2008). Our AMT-baseduser studies presented a series of default rankingsto users without the ability to sort the offers. Futurework can enhance the nature and scope of such userstudies by letting users choose their own sortingalgorithm in a more interactive platform and exe-cute randomized experiments. Future work can alsoexamine the associations between product reviews onUGC sites and travel search engine ranking decisionsusing keyword-level analyses, as described in Dharand Ghose (2010). Notwithstanding all these limita-tions, we believe our paper can pave the way for moreresearch in this increasingly important domain.
Electronic CompanionAn electronic companion to this paper is available as part ofthe online version that can be found at http://mktsci.journal.informs.org/.
AcknowledgmentsAuthor names are in alphabetical order. The authors thankSusan Athey, Peter Fader, Francois Moreau, Aviv Nevo,Minjae Song, Daniel Spulber, Catherine Tucker, and Hal Var-ian for helpful comments that have significantly improvedthe paper. They also thank participants at NBER IT Eco-nomics and Productivity Workshop, 2010 Workshop onDigital Business Models, 2010 Marketing Science Confer-ence, 2010 Searle Research Symposium at NorthwesternUniversity, Customer Insights Conference at Yale Univer-sity, 2010 SCECR Conference, 2009 Workshop on Informa-tion Technology and Systems (WITS), 2009 Workshop onEconomics and Information Systems, and seminar partic-ipants at the Columbia Business School, Harvard, GeorgeMason, Georgia Tech, Harvard Business School, Univer-sity of Maryland MIT Sloan School, and University ofMinnesota for helpful comments. A. Ghose and P. Ipeirotisacknowledge the financial support from National ScienceFoundation [CAREER Awards IIS-0643847 and IIS-0643846],respectively. Support was also provided through a MSI-Wharton Interactive Media Grant (WIMI) and a MicrosoftVirtual Earth Award. The authors thank Travelocity forproviding the data and Uthaman Palaniappan for researchassistance.
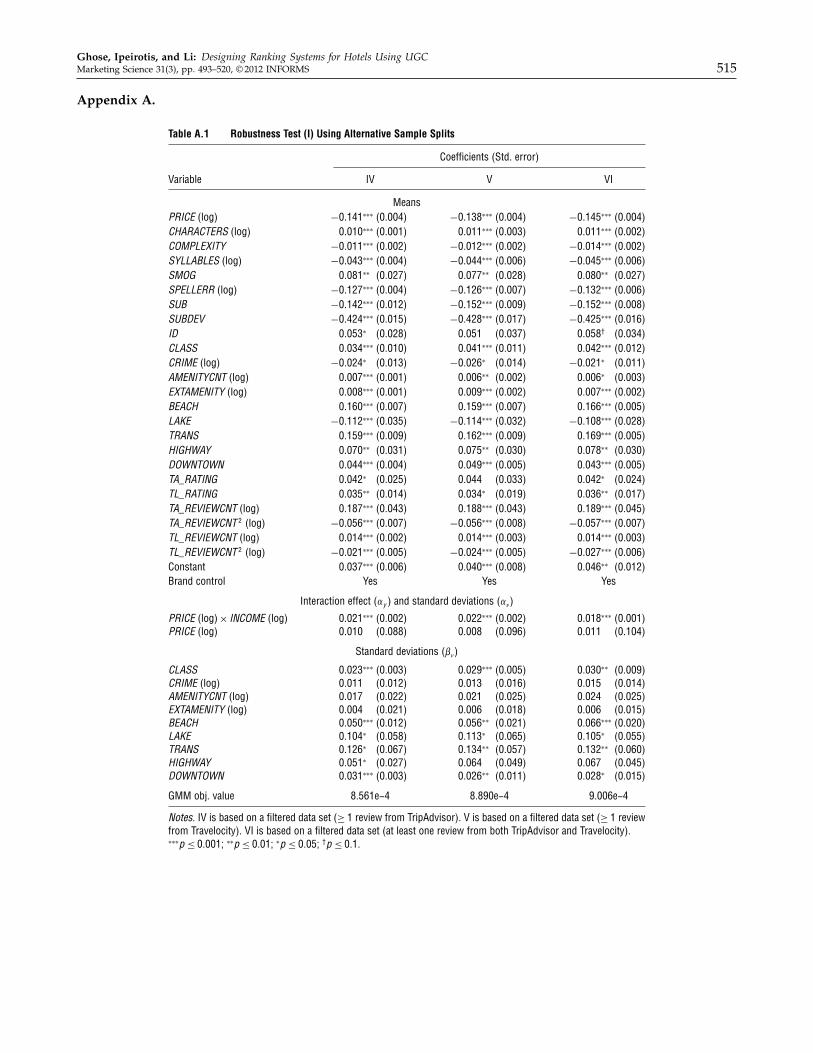
Ghose, Ipeirotis, and Li: Designing Ranking Systems for Hotels Using UGCMarketing Science 31(3), pp. 493–520, © 2012 INFORMS 515
Appendix A.
Table A.1 Robustness Test (I) Using Alternative Sample Splits
Coefficients (Std. error)
Variable IV V VI
MeansPRICE (log) −00141∗∗∗ (0.004) −00138∗∗∗ (0.004) −00145∗∗∗ (0.004)CHARACTERS (log) 00010∗∗∗ (0.001) 00011∗∗∗ (0.003) 00011∗∗∗ (0.002)COMPLEXITY −00011∗∗∗ (0.002) −00012∗∗∗ (0.002) −00014∗∗∗ (0.002)SYLLABLES (log) −00043∗∗∗ (0.004) −00044∗∗∗ (0.006) −00045∗∗∗ (0.006)SMOG 00081∗∗ (0.027) 00077∗∗ (0.028) 00080∗∗ (0.027)SPELLERR (log) −00127∗∗∗ (0.004) −00126∗∗∗ (0.007) −00132∗∗∗ (0.006)SUB −00142∗∗∗ (0.012) −00152∗∗∗ (0.009) −00152∗∗∗ (0.008)SUBDEV −00424∗∗∗ (0.015) −00428∗∗∗ (0.017) −00425∗∗∗ (0.016)ID 00053∗ (0.028) 00051 (0.037) 00058† (0.034)CLASS 00034∗∗∗ (0.010) 00041∗∗∗ (0.011) 00042∗∗∗ (0.012)CRIME (log) −00024∗ (0.013) −00026∗ (0.014) −00021∗ (0.011)AMENITYCNT (log) 00007∗∗∗ (0.001) 00006∗∗ (0.002) 00006∗ (0.003)EXTAMENITY (log) 00008∗∗∗ (0.001) 00009∗∗∗ (0.002) 00007∗∗∗ (0.002)BEACH 00160∗∗∗ (0.007) 00159∗∗∗ (0.007) 00166∗∗∗ (0.005)LAKE −00112∗∗∗ (0.035) −00114∗∗∗ (0.032) −00108∗∗∗ (0.028)TRANS 00159∗∗∗ (0.009) 00162∗∗∗ (0.009) 00169∗∗∗ (0.005)HIGHWAY 00070∗∗ (0.031) 00075∗∗ (0.030) 00078∗∗ (0.030)DOWNTOWN 00044∗∗∗ (0.004) 00049∗∗∗ (0.005) 00043∗∗∗ (0.005)TA_RATING 00042∗ (0.025) 00044 (0.033) 00042∗ (0.024)TL_RATING 00035∗∗ (0.014) 00034∗ (0.019) 00036∗∗ (0.017)TA_REVIEWCNT (log) 00187∗∗∗ (0.043) 00188∗∗∗ (0.043) 00189∗∗∗ (0.045)TA_REVIEWCNT 2 (log) −00056∗∗∗ (0.007) −00056∗∗∗ (0.008) −00057∗∗∗ (0.007)TL_REVIEWCNT (log) 00014∗∗∗ (0.002) 00014∗∗∗ (0.003) 00014∗∗∗ (0.003)TL_REVIEWCNT 2 (log) −00021∗∗∗ (0.005) −00024∗∗∗ (0.005) −00027∗∗∗ (0.006)Constant 00037∗∗∗ (0.006) 00040∗∗∗ (0.008) 00046∗∗ (0.012)Brand control Yes Yes Yes
Interaction effect (�y ) and standard deviations (��)
PRICE (log) × INCOME (log) 00021∗∗∗ (0.002) 00022∗∗∗ (0.002) 00018∗∗∗ (0.001)PRICE (log) 00010 (0.088) 00008 (0.096) 00011 (0.104)
Standard deviations 4��5
CLASS 00023∗∗∗ (0.003) 00029∗∗∗ (0.005) 00030∗∗ (0.009)CRIME (log) 00011 (0.012) 00013 (0.016) 00015 (0.014)AMENITYCNT (log) 00017 (0.022) 00021 (0.025) 00024 (0.025)EXTAMENITY (log) 00004 (0.021) 00006 (0.018) 00006 (0.015)BEACH 00050∗∗∗ (0.012) 00056∗∗ (0.021) 00066∗∗∗ (0.020)LAKE 00104∗ (0.058) 00113∗ (0.065) 00105∗ (0.055)TRANS 00126∗ (0.067) 00134∗∗ (0.057) 00132∗∗ (0.060)HIGHWAY 00051∗ (0.027) 00064 (0.049) 00067 (0.045)DOWNTOWN 00031∗∗∗ (0.003) 00026∗∗ (0.011) 00028∗ (0.015)
GMM obj. value 8.561e−4 8.890e−4 9.006e−4
Notes. IV is based on a filtered data set (≥ 1 review from TripAdvisor). V is based on a filtered data set (≥ 1 reviewfrom Travelocity). VI is based on a filtered data set (at least one review from both TripAdvisor and Travelocity).∗∗∗p ≤ 00001; ∗∗p ≤ 0001; ∗p ≤ 0005; †p ≤ 001.
Ghose, Ipeirotis, and Li: Designing Ranking Systems for Hotels Using UGC516 Marketing Science 31(3), pp. 493–520, © 2012 INFORMS
Tabl
eA.
2Ro
bust
ness
Test
(II)U
sing
the
BLP
Mod
el
Coef
ficie
nts
(Std
.err
or)
Varia
ble
III
IIIIV
VVI
R
Mea
nsPR
ICE
(log)
−00
257∗
∗∗
(0.0
33)
−00
254∗
∗∗
(0.0
34)
−00
251∗
∗∗
(0.0
31)
−00
255∗
∗∗
(0.0
40)
−00
263∗
∗∗
(0.0
45)
−00
266∗
∗∗
(0.0
46)
−00
256∗
∗∗
(0.0
34)
CHAR
ACTE
RS(lo
g)00
036∗
∗(0
.012
)00
038∗
∗∗
(0.0
11)
0004
0∗∗∗
(0.0
12)
0003
1∗∗
(0.0
14)
0004
4∗∗
(0.0
15)
0004
1∗∗
(0.0
16)
0003
7∗∗
(0.0
14)
COMPL
EXITY
−00
009
(0.0
11)
−00
009
(0.0
11)
−00
009
(0.0
11)
−00
010
(0.0
10)
−00
014
(0.0
11)
−00
014
(0.0
11)
−00
014
(0.0
12)
SYLL
ABLE
S(lo
g)−
0014
3∗∗
(0.0
51)
−00
142∗
∗(0
.051
)−
0014
2∗∗
(0.0
53)
−00
145∗
∗(0
.062
)−
0014
7∗∗
(0.0
61)
−00
149∗
∗(0
.064
)−
0014
3∗∗
(0.0
59)
SMOG
0015
9∗(0
.080
)00
156∗
(0.0
79)
0015
7∗(0
.080
)00
159∗
(0.0
82)
0015
0∗(0
.085
)00
142†
(0.1
01)
0015
7∗(0
.083
)SP
ELLE
RR(lo
g)−
0008
8∗∗
(0.0
35)
−00
091∗
∗(0
.036
)−
0009
1∗∗
(0.0
37)
−00
104∗
∗(0
.040
)−
0010
6∗∗
(0.0
37)
−00
105∗
∗(0
.040
)−
0009
8∗∗
(0.0
37)
SUB
−00
251∗
(0.1
77)
−00
255∗
(0.1
78)
−00
257∗
(0.1
78)
−00
253∗
(0.1
61)
−00
262∗
(0.1
63)
−00
266∗
(0.1
71)
−00
249∗
(0.1
18)
SUBD
EV−
0057
7∗∗
(0.2
18)
−00
576∗
∗(0
.216
)−
0058
0∗∗
(0.2
18)
−00
589∗
∗(0
.215
)−
0057
2∗∗
(0.2
10)
−00
574∗
∗(0
.211
)−
0057
6∗∗
(0.2
14)
ID00
143∗
∗∗
(0.0
33)
0014
5∗∗∗
(0.0
34)
0014
6∗∗∗
(0.0
39)
0015
1∗∗∗
(0.0
41)
0015
5∗∗∗
(0.0
43)
0015
3∗∗∗
(0.0
43)
0015
2∗∗∗
(0.0
41)
CLAS
S00
057∗
∗∗
(0.0
02)
0005
8∗∗∗
(0.0
02)
0005
6∗∗∗
(0.0
02)
0005
9∗∗∗
(0.0
05)
0006
6∗∗∗
(0.0
08)
0007
1∗∗∗
(0.0
11)
0005
9∗∗∗
(0.0
11)
CRIM
E(lo
g)−
0008
6∗(0
.049
)−
0008
8∗(0
.050
)−
0008
6∗(0
.052
)−
0009
2∗(0
.054
)−
0009
9∗(0
.055
)−
0009
6∗(0
.055
)−
0009
1∗(0
.053
)AM
ENITYC
NT(lo
g)00
029∗
(0.0
16)
0003
2∗∗
(0.0
14)
0003
4∗∗
(0.0
14)
0003
6∗∗
(0.0
12)
0003
8∗∗
(0.0
15)
0003
2∗∗
(0.0
15)
0003
5∗∗
(0.0
13)
EXTA
MEN
ITY
(log)
0003
5∗∗
(0.0
15)
0003
4∗∗
(0.0
12)
0003
5∗∗
(0.0
14)
0004
1∗∗∗
(0.0
12)
0005
2∗∗∗
(0.0
14)
0004
9∗∗∗
(0.0
11)
0004
7∗∗∗
(0.0
14)
BEAC
H00
366∗
∗∗
(0.1
03)
0036
8∗∗∗
(0.0
99)
0037
3∗∗∗
(0.0
98)
0037
8∗∗∗
(0.1
00)
0039
6∗∗∗
(0.1
05)
0039
1∗∗∗
(0.1
01)
0037
7∗∗∗
(0.1
01)
LAKE
−00
174∗
∗(0
.071
)−
0016
6∗∗
(0.0
72)
−00
172∗
∗(0
.071
)−
0016
9∗∗
(0.0
76)
−00
171∗
∗(0
.077
)−
0018
0∗∗
(0.0
79)
−00
171∗
∗(0
.080
)TR
ANS
0038
5∗∗∗
(0.1
11)
0038
2∗∗∗
(0.1
11)
0038
9∗∗∗
(0.1
19)
0040
0∗∗∗
(0.1
21)
0040
8∗∗∗
(0.1
20)
0041
0∗∗∗
(0.1
21)
0039
5∗∗∗
(0.1
12)
HIGH
WAY
0040
4∗∗
(0.1
84)
0040
4∗∗
(0.1
83)
0040
4∗∗
(0.1
92)
0040
7∗∗
(0.1
87)
0041
6∗∗
(0.1
89)
0042
0∗∗
(0.1
91)
0040
1∗∗
(0.1
82)
DOWNT
OWN
0019
0∗(0
.106
)00
192∗
(0.1
02)
0019
3∗(0
.102
)00
201∗
(0.1
00)
0020
2∗(0
.099
)00
201∗
(0.0
98)
0019
4∗(0
.099
)TA
_RAT
ING
0010
3∗∗
(0.0
37)
0010
5∗∗
(0.0
37)
0011
0∗∗
(0.0
35)
0011
2∗∗
(0.0
36)
0011
5∗∗
(0.0
41)
0011
7∗∗
(0.0
39)
0010
9∗∗
(0.0
31)
TL_R
ATING
0011
0∗(0
.059
)00
109∗
(0.0
58)
0010
8∗(0
.058
)00
106∗
(0.0
60)
0010
7∗(0
.058
)00
108∗
(0.0
59)
0010
8∗(0
.054
)TA
_REV
IEWCN
T(lo
g)00
325∗
(0.1
71)
0032
9∗(0
.173
)00
326∗
(0.1
70)
0033
0∗(0
.172
)00
351∗
(0.1
84)
0035
2∗(0
.182
)00
342∗
(0.1
77)
TA_R
EVIEWCN
T2
(log)
−00
063∗
∗∗
(0.0
11)
−00
061∗
∗∗
(0.0
12)
−00
062∗
∗∗
(0.0
12)
−00
069∗
∗∗
(0.0
11)
−00
073∗
∗∗
(0.0
12)
−00
070∗
∗∗
(0.0
12)
−00
065∗
∗∗
(0.0
12)
TL_R
EVIEWCN
T(lo
g)00
045∗
∗(0
.021
)00
048∗
∗(0
.021
)00
045∗
∗(0
.021
)00
054∗
∗(0
.023
)00
062∗
∗(0
.027
)00
062∗
∗(0
.026
)00
050∗
∗(0
.021
)TL
_REV
IEWCN
T2
(log)
−00
037∗
(0.0
19)
−00
037∗
(0.0
20)
−00
036∗
(0.0
19)
−00
041∗
∗(0
.018
)−
0004
3∗∗
(0.0
19)
−00
041∗
∗(0
.017
)−
0003
9∗∗
(0.0
15)
Cons
tant
0005
8(0
.197
)00
052
(0.1
94)
0006
0(0
.189
)00
067
(0.2
01)
0007
1(0
.206
)00
075
(0.2
09)
0006
3(0
.200
)
Bran
dco
ntro
lYe
sYe
sYe
sYe
sYe
sYe
sYe
s
Trav
elca
tego
ryw
ithYe
sYe
sYe
sYe
sYe
sYe
sNo
hom
ogen
eous
coef
.a
Trav
elca
tego
ryw
ithNo
NoNo
NoNo
NoYe
sra
ndom
coef
.b
Inte
ract
ion
effe
ct(�
y)a
ndst
anda
rdde
viat
ions
(��)
PRICE
(log)
×INCO
ME
(log)
0004
5∗∗∗
(0.0
03)
0004
7∗∗∗
(0.0
03)
0004
8∗∗∗
(0.0
03)
0004
1∗∗∗
(0.0
03)
0005
1∗∗∗
(0.0
03)
0005
0∗∗∗
(0.0
03)
0004
3∗∗∗
(0.0
01)
PRICE
(log)
0001
6(0
.067
)00
012
(0.0
63)
0001
5(0
.065
)00
011
(0.0
68)
0002
0(0
.076
)00
019
(0.0
71)
0001
4(0
.066
)

Ghose, Ipeirotis, and Li: Designing Ranking Systems for Hotels Using UGCMarketing Science 31(3), pp. 493–520, © 2012 INFORMS 517
Tabl
eA.
2(C
ont’d
.)
Varia
ble
III
IIIIV
VVI
R
Devi
atio
ns(�
�)
CLAS
S00
033∗
∗(0
.013
)00
034∗
∗(0
.013
)00
034∗
∗(0
.012
)00
032∗
∗(0
.013
)00
038∗
∗(0
.015
)00
039∗
∗(0
.015
)00
035∗
∗∗
(0.0
11)
CRIM
E(lo
g)00
014
(0.0
20)
0001
5(0
.021
)00
013
(0.0
19)
0001
0(0
.018
)00
009
(0.0
14)
0001
1(0
.011
)00
013
(0.0
19)
AMEN
ITYC
NT(lo
g)00
015
(0.0
14)
0001
3(0
.017
)00
016
(0.0
20)
0001
6(0
.021
)00
015
(0.0
20)
0001
7(0
.020
)00
014
(0.0
15)
EXTA
MEN
ITY
(log)
0000
6(0
.025
)00
006
(0.0
25)
0000
5(0
.026
)00
005
(0.0
26)
0000
5(0
.026
)00
006
(0.0
24)
0000
6(0
.024
)BE
ACH
0009
4∗∗∗
(0.0
16)
0009
3∗∗∗
(0.0
18)
0009
5∗∗∗
(0.0
19)
0009
7∗∗∗
(0.0
22)
0010
1∗∗∗
(0.0
23)
0010
6∗∗∗
(0.0
25)
0009
5∗∗∗
(0.0
17)
LAKE
0014
2∗∗
(0.0
66)
0014
3∗∗
(0.0
64)
0014
9∗∗
(0.0
61)
0015
0∗∗
(0.0
61)
0016
5∗∗
(0.0
71)
0016
6∗∗
(0.0
73)
0014
6∗∗
(0.0
67)
TRAN
S00
168∗
∗(0
.063
)00
170∗
∗(0
.065
)00
167∗
∗(0
.061
)00
162∗
∗(0
.067
)00
173∗
∗(0
.073
)00
177∗
∗(0
.073
)00
173∗
∗(0
.071
)HIGH
WAY
0007
7∗(0
.042
)00
081∗
(0.0
49)
0007
5†(0
.052
)00
074†
(0.0
52)
0006
8(0
.049
)00
063
(0.0
53)
0007
7∗(0
.041
)DO
WNT
OWN
0004
1∗(0
.022
)00
042∗
(0.0
22)
0004
5∗(0
.024
)00
049∗
(0.0
26)
0005
1∗∗
(0.0
20)
0005
8∗∗
(0.0
24)
0004
9∗∗
(0.0
23)
GMM
obj.
valu
e7.
011e
−47.
617e
−47.
201e
−46.
978e
−47.
961e
−48.
262e
−47.
223e
−4
Notes.
Iis
base
don
the
mai
nda
tase
t(at
leas
tone
revi
ewfro
mei
ther
Trip
Advi
soro
rTra
velo
city
).II
isba
sed
onth
em
ain
data
setw
ithre
view
coun
t≥5.
IIIis
base
don
the
mai
nda
tase
twith
revi
ewco
unt≥
10.
IVis
base
don
the
filte
red
data
set(
atle
asto
nere
view
from
Trip
Advi
sor)
.Vis
base
don
the
filte
red
data
set(
atle
asto
nere
view
from
Trav
eloc
ity).
VIis
base
don
the
filte
red
data
set(
atle
asto
nere
view
from
both
Trip
Advi
sora
ndTr
avel
ocity
).R
isba
sed
onda
tase
tI,w
ithra
ndom
coef
ficie
nts
ontra
velc
ateg
ory
dum
mie
s.a W
eco
nsid
erdu
mm
yva
riabl
esw
ithho
mog
eneo
usco
effic
ient
sto
cont
rolf
orth
eei
ghtc
orre
spon
ding
trave
lcat
egor
ies.
b We
cons
ider
dum
my
varia
bles
with
rand
omco
effic
ient
sto
cont
rolf
orth
eei
ghtc
orre
spon
ding
trave
lcat
egor
ies.
∗∗∗Si
gnifi
cant
ata
0.1%
leve
l;∗∗si
gnifi
cant
ata
1%le
vel;
∗si
gnifi
cant
ata
5%le
vel;
†si
gnifi
cant
ata
10%
leve
l.
Appendix B. In-Sample Basic ModelComparison ResultsIn-sample and out-of-sample results are estimated based ona 10-fold cross validation. The size of the estimation sam-ple for both the in-sample and out-of-sample estimationsis 5,669. The size of the holdout sample for out-of-sampleestimation is 2,430.
Table B.1 In-Sample Basic Model Validation Results
BLP without BLP with Nested logitrandom random (random
Hybrid coef. on coef. on utilitymodel travel categories travel categories PCM maximization)
RMSE 000407 000518 000485 000976 001158MSE 000016 000027 000024 000095 000134MAD 000133 000185 000167 000318 000379
Table B.2 In-Sample Extended Model ValidationResults
Hybrid model with BLP withinteraction effects interaction effects
RMSE 000347 000426MSE 000012 000018MAD 000100 000161
Table B.3 In-Sample Model Validation Results by Excluding CertainFeatures
Without UGC Without location Without service(Hybrid model) variables variables variables
RMSE 000743 001159 001112MSE 000055 000134 000124MAD 000328 000360 000353
Table B.4 In-Sample Model Validation Results by Excluding CertainUGC Features
Without all Without Without(Hybrid text Without Without numeric reviewermodel) features readability subjectivity rating identity
RMSE 000678 000642 000539 000513 000435MSE 000046 000041 000029 000026 000019MAD 000309 000289 000201 000217 000156
Table B.5 Out-of-Sample Basic Model Validation Results
BLP without BLP with Nested logitrandom random (random
Hybrid coef. on coef. on utilitymodel travel categories travel categories PCM maximization)
RMSE 000881 001011 000975 001909 002399MSE 000078 000102 000095 000364 000576MAD 000276 000362 000387 000524 001311

Ghose, Ipeirotis, and Li: Designing Ranking Systems for Hotels Using UGC518 Marketing Science 31(3), pp. 493–520, © 2012 INFORMS
Table B.6 Out-of-Sample Extended ModelValidation Results
Hybrid model with BLP withinteraction effects interaction effects
RMSE 000865 000922MSE 000075 000085MAD 000253 000287
Table B.7 Out-of-Sample Model Validation Results by ExcludingCertain Features
Without UGC Without location Without service(Hybrid model) variables variables variables
RMSE 001380 001992 001897MSE 000190 000397 000360MAD 000965 001276 001155
Table B.8 Out-of-Sample Model Validation Results by ExcludingCertain UGC Features
Without all Without Without(Hybrid text Without Without numeric reviewermodel) features readability subjectivity rating identity
RMSE 001359 001252 001176 001116 000964MSE 000185 000157 000138 000125 000093MAD 000812 000618 000607 000583 000303
Appendix C.
Figure C.1 Screenshot for a Sample Task from the User Study
More Details on the Design of the User StudyTo further control for biases, we conducted the userstudy with stringent controls in the design and exe-cution of the online survey. This led to a set of 7,800user comparisons. Our additional design takes intoaccount the following issues:
• First, to prevent each AMT worker from seeingthe same ranking multiple times, we restricted eachworker to only participate in at most one rankingcomparison for each city.
• Second, to make sure each AMT worker isexposed to the full decision-making environment as a“real” visitor, in addition to the hotel name, address,price, and class information, we provided the URLsfor each hotel’s main Web pages from five differ-ent major (travel) search engine websites: TripAd-visor.com, Expedia.com, Hotels.com, Travelocity.com,and Google.com. Moreover, we were able to trackwhether or not a particular AMT worker clicked onany of these URLs for a particular hotel in a particularranking comparison task.
• Third, we were able to track the exact time eachAMT worker spent on a task (i.e., from the momentan AMT worker accepted a task until the moment thatworker submitted the result).
Ghose, Ipeirotis, and Li: Designing Ranking Systems for Hotels Using UGCMarketing Science 31(3), pp. 493–520, © 2012 INFORMS 519
• Finally, to control for the quality of the responses,we allowed only those AMT workers with a priorapproval rate higher than 95% to participate in thesurvey. AMT provides an approval rate for eachworker based on the frequency with which tasks havebeen approved by the buyer. This approval rate canprovide information on the quality of the workers.
Our finding suggested that, on average, each AMTworker spent 116.8 seconds (∼2 minutes) per task.Besides, more than 50% of AMT workers clicked onthe provided URLs to facilitate their decisions basedon the detailed information of the hotels.
ReferencesAgichtein, E., E. Brill, S. Dumais, R. Ragno. 2006. Learning user
interaction models for predicting Web search result prefer-ences. Proc. 29th Annual Internat. ACM SIGIR Conf. Res. Devel-opment Inform. Retrieval, ACM, New York, 3–10.
Ansari, A., C. Mela. 2003. E-customization. J. Marketing Res. 40(2)131–145.
Ansari, A., S. Essegaier, R. Kohli. 2000. Internet recommendationsystems. J. Marketing Res. 37(3) 363–375.
Archak, N., A. Ghose, P. G. Ipeirotis. 2011. Deriving the pric-ing power of product features by mining consumer reviews.Management Sci. 57(8) 1485–1509.
Athey, S., G. Imbens. 2007. Discrete choice models with multipleunobserved choice characteristics. Internat. Econom. Rev. 48(4)1159–1192.
Berry, S., A. Pakes. 2007. The pure characteristics demand model.Internat. Econom. Rev. 48(4) 1193–1225.
Berry, S., J. Levinsohn, A. Pakes. 1995. Automobile prices in marketequilibrium. Econometrica 63(4) 841–890.
Berry, S., O. B. Linton, A. Pakes. 2004. Limit theorems for estimatingthe parameters of differentiated product demand systems. Rev.Econom. Stud. 71(3) 613–654.
Bodapati, A. 2008. Recommender systems with purchase data.J. Marketing Res. 45(1) 77–93.
Bruno, H. A., N. J. Vilcassim. 2008. Structural demand estima-tion with varying product availability. Marketing Sci. 27(6)1126–1131.
Chevalier, J. A., D. Mayzlin. 2006. The effect of word of mouth onsales: Online book reviews. J. Marketing Res. 43(3) 345–354.
Chintagunta, P., J.-P. Dubé, K. Y. Goh. 2005. Beyond the endogene-ity bias: The effect of unmeasured brand characteristics onhousehold-level brand choice models. Management Sci. 51(5)832–849.
Chung, T. S., R. T. Rust, M. Wedel. 2009. My mobile music: Anadaptive personalization system for digital audio players. Mar-keting Sci. 28(1) 52–68.
Das, S., M. Chen. 2007. Yahoo! for Amazon: Sentiment extrac-tion from small talk on the Web. Management Sci. 53(9)1375–1388.
Decker, R., M. Trusov. 2010. Estimating aggregate consumer pref-erences from online product reviews. Internat. J. Res. Marketing27(4) 293–307.
Dellarocas, C., N. Awad, M. Zhang. 2007. Exploring the value ofonline product reviews in forecasting sales: The case of motionpictures. J. Interactive Marketing 21(4) 23–45.
Dhar, V., E. A. Chang. 2009. Does chatter matter? The impact ofuser-generated content on music sales. J. Interactive Marketing23(4) 300–307.
Dhar, V., A. Ghose. 2010. Sponsored search and market efficiency.Inform. Systems Res. 21(4) 760–772.
Duan, W., B. Gu, A. B. Whinston. 2008. Do online reviews mat-ter? An empirical investigation of panel data. Decision SupportSystems 45(4) 1007–1016.
Eliashberg, J., S. K. Hui, Z. J. Zhang. 2007. From story line tobox office: A new approach for green-lighting movie scripts.Management Sci. 53(6) 881–893.
Fader, P. S., B. G. S. Hardie. 1996. Modeling consumer choice amongSKUs. J. Marketing Res. 33(4) 442–452.
Fellbaum, C. 1998. Wordnet: An Electronic Lexical Database. MITPress, Cambridge, MA.
Forman, C., A. Ghose, B. Wiesenfeld. 2008. Examining the relation-ship between reviews and sales: The role of reviewer iden-tity disclosure in electronic markets. Inform. Systems Res. 19(3)291–313.
Ghose, A., P. G. Ipeirotis. 2011. Estimating the helpfulness and eco-nomic impact of product reviews: Mining text and reviewercharacteristics. IEEE Trans. Knowledge Data Engrg. 23(10)1498–1512.
Ghose, A., P. G. Ipeirotis, A. Sundararajan. 2009. The dimensionsof reputation in electronic markets. Working paper, New YorkUniversity, New York.
Godes, D., D. Mayzlin. 2004. Using online conversations tostudy word-of-mouth communication. Marketing Sci. 23(4)545–560.
Hartmann, W., H. S. Nair, S. Narayanan. 2011. Identifying causalmarketing mix effects using a regression discontinuity design.Marketing Sci. 30(6) 1079–1097.
Hausman, J. 1996. Valuation of new goods under perfect and imper-fect competition. T. Bresnahan, R. Gordon, eds. The Economicsof New Goods, Studies in Income and Wealth, Vol. 58. NationalBureau of Economic Research, Chicago, 207–248.
Hu, M., B. Liu. 2004. Mining and summarizing customer reviews.Proc. 10th ACM SIGKDD Internat. Conf. Knowledge DiscoveryData Mining 4KDD045, ACM, New York, 168–177.
Hu, N., P. A. Pavlou, J. Zhang. 2006. Can online reviews reveal aproduct’s true quality? Empirical findings and analytical mod-eling of online word-of-mouth communication. Proc. SeventhACM Conf. Electronic Commerce, ACM, New York, 324–330.
Lee, T., E. Bradlow. 2011. Automatic construction of conjointattributes and levels from online customer reviews. J. Market-ing Res. 48(5) 881–894.
Li, X., L. Hitt. 2008. Self-selection and information role of onlineproduct reviews. Inform. Systems Res. 19(4) 456–474.
Lipsman, A. 2007. Online consumer-generated reviews havebig impact on offline purchases. Press release, comScore,Reston, VA. http://www.marketingcharts.com/direct/online-consumer-generated-reviews-have-big-impact-on-offline-purchases-2577/kelsey-group-comscore-online-review-influence-on-purchase-by-service-typejpg.
Liu, Y. 2006. Word-of-mouth for movies: Its dynamics and impacton box office revenue. J. Marketing 70(3) 74–89.
Luca, M. 2011. Reviews, reputation, and revenue: The case ofYelp.com. Working Paper 12-016, Harvard Business School,Boston.
Manning, C., H. Schutze. 1999. Foundations of Statistical Natural Lan-guage Processing. MIT Press, Cambridge, MA.
McCrary, J. 2008. Manipulation of the running variable in theregression discontinuity design: A density test. J. Econometrics142(2) 698–714.
Moe, W. 2009. How much does a good product rating help a badproduct? Modeling the role of product quality in the rela-tionship between online consumer ratings and sales. Workingpaper, University of Maryland, College Park.

Ghose, Ipeirotis, and Li: Designing Ranking Systems for Hotels Using UGC520 Marketing Science 31(3), pp. 493–520, © 2012 INFORMS
Nair, H., J.-P. Dubé, P. Chintagunta. 2005. Accounting for primaryand secondary demand effects with aggregate data. MarketingSci. 24(3) 444–460.
Netzer, O., R. Feldman, J. Goldenberg, M. Fresko. 2012. Mineyour own business: Market-structure surveillance through textmining. Marketing Sci. 31(3) 521–543.
Nevo, A. 2001. Measuring market power in the ready-to-eat cerealindustry. Econometrica 69(2) 307–342.
Pang, B., L. Lee. 2004. A sentimental education: Sentiment anal-ysis using subjectivity summarization based on minimumcuts. Proc. 42nd Annual Meeting Assoc. Computat. Linguistics,Barcelona, Spain, 271–278.
Popescu, A., O. Etzioni. 2005. Extracting product features and opin-ions from reviews. Proc. Human Language Tech. Conf. Empir-ical Methods Natural Language Processing 4HLT/EMNLP 20055,Vancouver, 339–346.
Rust, R. T., T. S. Chung. 2006. Marketing models of service andrelationships. Marketing Sci. 25(6) 560–580.
Scaffidi, C., K. Bierhoff, E. Chang, M. Felker, H. Ng, C. Jin.2007. Red opal: Product-feature scoring from reviews. Proc.8th ACM Conf. Electronic Commerce 4EC’075, ACM, New York,182–191.
Song, M. 2011. A hybrid discrete choice model of differentiatedproduct demand with an application to personal comput-ers. Simon School Working Paper FR 08-09, University ofRochester, Rochester, NY.
Steckel, J., W. Vanhonacker. 1993. Cross-validating regression mod-els in marketing research. Marketing Sci. 12(4) 415–427.
Villas-Boas, J. M., R. S. Winer. 1999. Endogeneity in brand choicemodels. Management Sci. 45(10) 1324–1338.
Yamamoto, T. 2011. A multinomial response model for varyingchoice sets, with application to partially contested multipartyelections. Working paper, Princeton University, Princeton, NJ.
Ying, Y., F. Feinberg, M. Wedel. 2006. Leveraging missing ratingsto improve online recommendation systems. J. Marketing Res.43(3) 355–365.