Embed Size (px)
Citation preview

1
Designs for Different Types of Loading
Chapter 5
Material taken from Chapter 5 Mott, 2003, Machine Elements in Mechanical Design
Loading TypesThe manner of computing the design stress depends on the manner of loading and on the type of material. Loading types include the following:– Static– Repeated and reversed– Fluctuating– Shock or impact– Random
Types of Loading and Stress RatioThe primary factors to consider when specifying the type of loading to which a machine part is subjected are the manner of variation of the load and the resulting variation of stress with time.Stress variations are characterized by four key values:– Maximum stress, σmax– Minimum stress, σmin– Mean (average) stress, σm– Alternating stress, σa (stress amplitude)

2
Types of Loading and Stress RatioThe maximum and minimum stresses are usually computed from known information by stress analysis or finite-element methods, or they are measured using experimental stress analysis techniques.Then the mean and alternating stresses can be computed from:
σm = (σmax + σmin) / 2σa = (σmax - σmin) / 2
Types of Loading and Stress RatioThe behavior of a material under varying stresses is dependent on the manner of the variation. One method used to characterize the variation is called stress ratio.Stress ratio R = minimum stress = σmin
maximum stress σmaxStress ratio A = alternating stress = σamean stress σm
Static Stress
When a part is subjected to a load that is applied slowly, without shock, and is held at a constant value, the resulting stress in the part is called static stress.Because σmax = σmin, the stress ratio for static stress is R = 1.0.

3
Static Stress
Mott, 2003, Machine Elements in Mechanical Design
Repeated and Reversed StressA stress reversal occurs when a given element of a load-carrying member is subjected to a certain level of tensile stress followed by the same level of compressive stress.The stress is called repeated and reversed.Because σmin = - σmax, the stress ratio is R = -1.0, and the mean stress is zero.
Repeated, Reversed Stress

4
Fluctuating Stress
When a load-carrying member is subjected to an alternating stress with a nonzero mean, the loading produces fluctuating stress.
Fluctuating Stresses
Mott, 2003, Machine Elements in Mechanical Design
Shock, Impact, and Random Loading
Loads applied suddenly and rapidly cause shock or impact.Examples include a hammer blow, a weight falling onto a structure, and the action inside a rock crusher.When varying loads are applied that are not regular in their amplitude, the loading is called random.

5
Endurance StrengthThe endurance strength of a material is its ability to withstand fatigue loads. In general, it is the stress level that a material can survive for a given number of cycles of loading. If the number of cycles is infinite the stress level is called the endurance limit.Endurance strengths are usually charted on a graph called an S-N diagram.Curves A, B, and D show a material that exhibits an endurance limit, such as plain carbon steel. Curve C is typical of most nonferrous materials, such as aluminum, which does not have an endurance limit.
Mott, 2003, Machine Elements in Mechanical Design
Endurance Strength
Approximations for the basic endurance strength for wrought steel:
Endurance strength = 0.50(ultimate tensile strength) = 0.50(su)

6
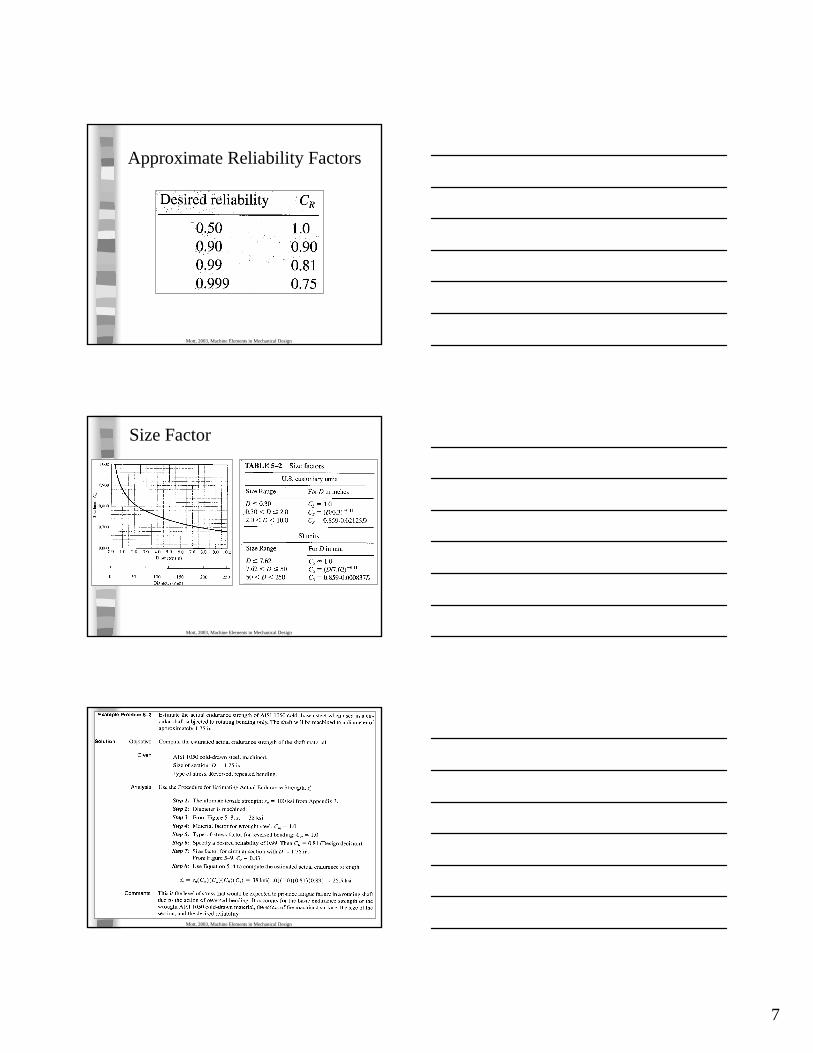
Estimated Actual Endurance Strength
If the actual material characteristics or operating conditions for a machine part are different from those for which the basic endurance strength was determined, the fatigue strength must be reduced from the reported value.
Mott, 2003, Machine Elements in Mechanical Design
Mott, 2003, Machine Elements in Mechanical Design
7
Approximate Reliability Factors
Mott, 2003, Machine Elements in Mechanical Design
Size Factor
Mott, 2003, Machine Elements in Mechanical Design
Mott, 2003, Machine Elements in Mechanical Design

8
Design PhilosophyIt is the designer’s responsibility to ensure that a machine part is safe for operation under reasonably foreseeable conditions.Some general conditions are:– Application: quantities, manufacturing techniques,
danger to people and economic cost, cost-sensitive, small physical size or low weight
– Environment: temperature range, electrical voltage or current, low noise, vibration environment
– Loads: consider all modes of operation, including startup, shut down, normal operation, and foreseeable overloads. The loads should be characterized as static, repeated and reversed, fluctuation, shock, or impact.
Design Philosophy con’t– Types of Stresses: direct tension, direct
compression, direct shear, bending, or torsional
– Material: material properties of yield strength, ultimate tensile strength, ultimate compressive strength, endurance strength, stiffness, ductility, toughness, creep resistance, and corrosion resistance
– Confidence: reliable data for loads, material properties, and stress calculations.
Design Philosophy con’tAll design approaches must define the relationship between the applied stresses on a component and the strength of the material from which it is being made, considering the conditions of service.The goal of the design process is to achieve a suitable design factor, N (aka factor of safety), that ensures the component is safe. The strength of the material must be greater than the applied stresses.

9
Design Philosophy con’tThe sequence of design analysis is:– Geometry of the component and the loading are
known: apply the desired design factor, N, to the actual expected stress to determine the required strength of the material. Then a suitable material can be specified.
– Loading is known and the material for the component has been specified: compute a design stress by applying the desired design factor, N, to the approximate strength of the material. This is the maximum allowable stress to which any part of the component can be exposed. Then complete the stress analysis to determine what shape and size of the component will ensure that stresses are safe.
Design Philosophy con’t– Loading is known, and the material and the
complete geometry of the component have been specified: compute both the expected maximum applied stress and the design stress. By comparing these stresses, determine the resulting design factor, N, for the proposed design and judge its acceptability. A redesign may be called for if the design factor is either too low (unsafe) or too high (over designed).
Design Philosophy con’tMachine elements can fail because of excessive deformation or vibration.Criteria for failure due to deformation are often highly dependent on the machine’s use. – Will excessive deformation cause two or more
members to touch when they should not?– Will the desired precision of the machine be
compromised?– Will parts vibrate excessively or resonate at the
frequencies experienced during operation?

10
Design FactorsThe term design factor, N, is a measure of a load-carrying component safety. The strength of the material from which the component is to be made is divided by the design factor to determine a design stress, σd (aka allowable stress).Then the actual stress to which the component is subjected should be less than the design stress.
Design Factors con’tOften the value of the design factor or the design stress is governed by codes established by standards-setting organizations such as the American Society of Mechanical Engineers, the American Gear Manufacturers Associations, or the US Dept of Defense.In the absence of codes or standards, the designer must use judgment to specify the desired design factor.
Ductile Materials1. N = 1.25 to 2.0. Design of structures under
static loads for which there is a high level of confidence in all design data.
2. N = 2.0 to 2.5. Design of machine elements under dynamic loading with average confidence in all design data. (typically used in problem solutions)
3. N = 2.5 to 4.0. Design of static structures or machine elements under dynamic loading with uncertainty about loads, material properties, stress analysis, or the environment.

11
Ductile Materials con’t
4. N = 4.0 or higher. Design of static structures or machine elements under dynamic loading with uncertainty about some combination of loads, material properties, stress analysis, or the environment. The desire to provide extra safety to critical components may also justify these values.
Brittle Materials
5. N = 3.0 to 4.0. Design of structures under static loads for which there is a high level of confidence in all design data.
6. N = 4.0 to 8.0. Design of static structures or machine elements under dynamic loading with uncertainty about loads, material properties, stress analysis, or the environment.
Predictions of Failure
Designers should understand the various ways that load-carrying components can fail in order to complete a design that ensures that failure does not occur. Several different methods of predicting failure are available, and it is the designer’s responsibility to select the one most appropriate to the conditions of the project.

12
Failure Prediction Method1. Maximum normal stress
– Uniaxial static stress on brittle materials2. Modified Mohr
– Biaxial static stress on brittle materials3. Yield Strength
– Uniaxial static stress on ductile materials4. Maximum Shear Stress
– Biaxial static stress on ductile materials [moderately conservative]
5. Distortion Energy– Biaxial or triaxial on ductile materials [good
predictor]
Failure Prediction Method6. Goodman
– Fluctuating stress on ductile materials [slightly conservative]
7. Gerber– Fluctuation stress on ductile materials
[good predictor]8. Soderberg
– Fluctuating stress on ductile materials [moderately conservative]
Selected Review of Failure Prediction Methods

13
Maximum Normal Stress MethodThe maximum normal stress theory states that a material will fracture when the maximum normal stress (either tension or compression) exceeds the ultimate strength of the material as obtained from a standard tensile or compressive test. Its use is limited, namely for brittle materials under pure uniaxial static tension or compression. When applying this theory, any stress concentration factor at the region of interest should be applied to the computed stress because brittle materials do not yield and cannot redistribute the increased stress.
Maximum Normal Stress Theory
For tensile stress:Ktσ < σd = sut / N
For compressive stress:Ktσ < σd = suc / N
Where Kt is the stress concentration factor and σ is the calculated stress
Yield Strength MethodThis is a simple application of the principle of yielding in which a component is carrying a direct tensile or compressive load in the manner similar to the conditions of the standard tensile or compressive test for the material. Failure is predicted when the actual applied stress exceeds the yield strength. Stress concentrations can normally be neglected for static stresses on ductile materials because the higher stresses near the stress concentrations are highly localized.

14
Yield Strength Method con’t
For tensile stress:σ < σd = syt / N
For compressive stress:σ < σd = syc / N
For most wrought ductile metals:syt = syc
Maximum Shear Stress MethodThe maximum shear stress method of failure prediction states that a ductile material begins to yield when the maximum shear stress in a load-carrying component exceeds that in a tensile-test specimen when yielding begins. A Mohr’s circle analysis for the uniaxial tension test shows that the maximum shear stress is ½ of the applied tensile stress. At yield then, ssy = sy / 2τmax < τd = ssy / N = 0.5 sy / NThe maximum shear stress method of failure prediction has always shown by experimentation to be somewhat conservative for ductile materials subjected to a combination of normal and shear stresses.
Distortion Energy MethodThe distortion energy method has been shown to be the best predictor of failure for ductile materials under static loads or completely reversed normal, shear, or combined stresses. It requires the definition of von Mises stress, indicated by the symbol σ’, that can be calculated for biaxial stresses, given the maximum and minimum principle stresses, σ1 and σ2 from:
212221' σσ−σ+σ=σ

15
Distortion Energy Method con’tFailure is predicted when σ’ > sy. The biaxial stress approach requires that the applied stress in the third orthogonal direction, typically σz, is zero.The failure line is an ellipse centered at the origin and passing through the yield strength on each axis, in both the tensile and compressive regions. It is necessary that the material has equal values for yield strength in tension and compression for direct use of this method.
Distortion Energy Method con’tThe numerical scales on the graph are normalized to the yield strength so the ellipse passes through sy/σ1 = 1 on the σ1 axis and similarly on the other axes. Combinations of principle stresses that lie within the distortion energy ellipse are predicted to be safe, while those outside would predict failure.
Distortion Energy Method con’t
For design, the design factor, N, can be applied to the yield strength.σ’ < σd = sy / N

16
Distortion Energy Method
Mott, 2003, Machine Elements in Mechanical Design
Alternate Form for the von Mises Stress
Often the stresses are found in a somewhat orthogonal direction, x and y, namely σx, σy, and τxy. The von Mises stress can then be calculated directly from
For uniaxial stress with shear, σy = 0…22 3' xyx τ+σ=σ
222 3' xyyxyx τ+σσ−σ+σ=σ
Goodman MethodThe Goodman method of failure prediction provides a good correlation with experimental data.The Goodman diagram plots the mean stresses on the horizontal stress and the alternating stresses on the vertical axis.A straight line is drawn from the estimated actual endurance strength of the material, s’n, on the vertical axis to the ultimate tensile strength, su, on the horizontal axis.Combinations of mean stress, σm, and alternating stress, σa, above the line predict failure, while those below the line predict no failure.

17
Goodman Method con’t
1'
=σ
+σ
u
m
n
a
ss
Modified Goodman Diagram
Mott, 2003, Machine Elements in Mechanical Design
Design EquationIntroducing a design factor on both the ultimate and endurance strength values depicts a “safe stress” line.Any stress concentration factor in the region of interest should be applied to the alternating component but not to the mean stress component, because experimental evidence shows that the presence of a stress condition does not affect the contribution of the mean stress of fatigue failure.
NssK
u
m
n
at 1'
=+σσ

18
Modified Goodman Diagram
Mott, 2003, Machine Elements in Mechanical Design
Early Cycle YieldingThe Goodman line presents a difficulty near the right end because it seems to allow a pure mean stress greater than the yield strength of the material.Most designers choose to not permit yielding anywhere. The yield line is added to the Goodman diagram, drawn between the yield strength plotted on both axes. Now the line segments between points labeled A, B, and C define the failure line.
Mott, 2003, Machine Elements in Mechanical Design
Early Cycle Yielding con’t
First complete the design based on fatigue and then check for yield separately. The design equation for the yield line:
Apply the stress concentration factor to the mean stress to ensure that yielding does not occur. In many cases, the safe stress line for fatigue actually falls completely below the yield strength line, indicating that no yielding is expected.
1'
=+y
mt
n
at
sK
sK σσ

19
Comparison of 3 MethodsSoderberg is the most conservative.
Mott, 2003, Machine Elements in Mechanical Design
Soderberg Method
Drawn between the endurance strength and the yield strength, the Soderberg line is the most conservative. One advantage is that it protects directly against early cycle yielding, whereas Goodman requires the secondary consideration of the yield line. However, the degree of conservatism is considered too great for competitive efficient design.
1'
=σ
+σ
y
m
n
at
ssK
Design Analysis
Summarize the recommended methods for design analysis based on the type of material (brittle or ductile), the naure of the loading (static or cyclical), and the type of stress (uniaxial or biaxial).

20
Design Analysis
The following symbols are used:– su or sut = ultimate tensile strength– suc = ultimate compressive strength– sy = yield strength or yield point– ssy = yield strength in shear– s’n = endurance strength of material under actual
conditions– s’sn = endurance strength in shear under actual
conditions– σ = nominal applied stress, without Kt
General Design ProcedureThe procedure is set up assuming that the following factors are known or can be estimated:– General design requirements: objectives and
limitations on size, shape, weight, desired precision, etc
– Nature of the loads to be carried– Types of stresses produced by the loads– Type of material from which the element is to be
made– General description of the manufacturing process
to be used, particularly with regard to the surface finish that will be produced
– Desired reliability
General Design Procedure1. Specify the objectives and limitations, if any,
of the design, including desired life, size, shape, and appearance.
2. Determine the environment in which the element will be placed, considering such factors as corrosion potential and temperature
3. Determine the nature and characteristics of the loads to be carried by the element
4. Determine the magnitudes for the loads and the operating conditions

21
General Design Procedure con’t5. Analyze how loads are to be applied to
determine the type of stresses produced6. Propose the basic geometry for the element7. Propose the method of manufacturing the
element8. Specify the material from which the element
is to be made, along with its condition9. Determine the expected properties of the
selected material10. Specify an appropriate design factor11. Determine stress analysis method
General Design Procedure con’t12. Compute the appropriate design stress for
use in the stress analysis13. Determine the nature of any stress
concentrations14. Complete the required stress analyses at all
points where the stress may be high15. Specify suitable, convenient dimensions for
all features of the element
General Design Procedure con’t16. Check all assumptions made earlier in the
design to ensure that the element is still safe and reasonably efficient.
17. Specify suitable tolerances for all dimensions
18. Check to determine whether some part of the component may deflect excessively
19. Document the final design with drawings and specifications
20. Maintain a careful record of the design analyses for future reference.