Embed Size (px)
Citation preview
1468
Bulletin of the Seismological Society of America, Vol. 93, No. 4, pp. 1468–1478, August 2003
Detailed Fault Structure of the 2000 Western Tottori, Japan,
Earthquake Sequence
by Eiichi Fukuyama, William L. Ellsworth, Felix Waldhauser, and Atsuki Kubo
Abstract We investigate the faulting process of the aftershock region of the 2000western Tottori earthquake (Mw 6.6) by combining aftershock hypocenters and mo-ment tensor solutions. Aftershock locations were precisely determined by the doubledifference method using P- and S-phase arrival data of the Japan MeteorologicalAgency unified catalog. By combining the relocated hypocenters and moment tensorsolutions of aftershocks by broadband waveform inversion of FREESIA (F-net), wesuccessfully resolved very detailed fault structures activated by the mainshock. Theestimated fault model resolves 15 individual fault segments that are consistent withboth aftershock distribution and focal mechanism solutions. Rupture in the main-shock was principally confined to the three fault elements in the southern half of thezone, which is also where the earliest aftershocks concentrate. With time, the northernpart of the zone becomes activated, which is also reflected in the postseismic defor-mation field. From the stress tensor analysis of aftershock focal mechanisms, wefound a rather uniform stress field in the aftershock region, although fault strikeswere scattered. The maximum stress direction is N107�E, which is consistent withthe tectonic stress field in this region. In the northern part of the fault, where no slipoccurred during the mainshock but postseismic slip was observed, the maximumstress direction of N130�E was possible as an alternative solution of stress tensorinversion.
Introduction
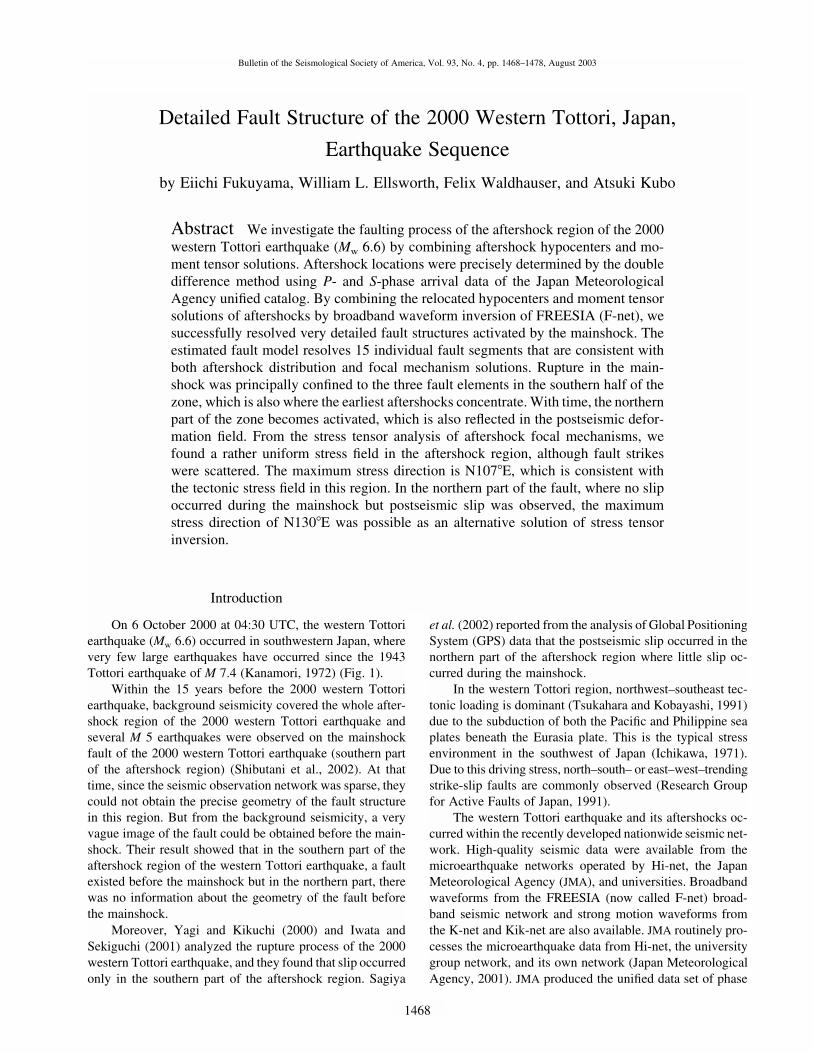
On 6 October 2000 at 04:30 UTC, the western Tottoriearthquake (Mw 6.6) occurred in southwestern Japan, wherevery few large earthquakes have occurred since the 1943Tottori earthquake of M 7.4 (Kanamori, 1972) (Fig. 1).
Within the 15 years before the 2000 western Tottoriearthquake, background seismicity covered the whole after-shock region of the 2000 western Tottori earthquake andseveral M 5 earthquakes were observed on the mainshockfault of the 2000 western Tottori earthquake (southern partof the aftershock region) (Shibutani et al., 2002). At thattime, since the seismic observation network was sparse, theycould not obtain the precise geometry of the fault structurein this region. But from the background seismicity, a veryvague image of the fault could be obtained before the main-shock. Their result showed that in the southern part of theaftershock region of the western Tottori earthquake, a faultexisted before the mainshock but in the northern part, therewas no information about the geometry of the fault beforethe mainshock.
Moreover, Yagi and Kikuchi (2000) and Iwata andSekiguchi (2001) analyzed the rupture process of the 2000western Tottori earthquake, and they found that slip occurredonly in the southern part of the aftershock region. Sagiya
et al. (2002) reported from the analysis of Global PositioningSystem (GPS) data that the postseismic slip occurred in thenorthern part of the aftershock region where little slip oc-curred during the mainshock.
In the western Tottori region, northwest–southeast tec-tonic loading is dominant (Tsukahara and Kobayashi, 1991)due to the subduction of both the Pacific and Philippine seaplates beneath the Eurasia plate. This is the typical stressenvironment in the southwest of Japan (Ichikawa, 1971).Due to this driving stress, north–south– or east–west–trendingstrike-slip faults are commonly observed (Research Groupfor Active Faults of Japan, 1991).
The western Tottori earthquake and its aftershocks oc-curred within the recently developed nationwide seismic net-work. High-quality seismic data were available from themicroearthquake networks operated by Hi-net, the JapanMeteorological Agency (JMA), and universities. Broadbandwaveforms from the FREESIA (now called F-net) broad-band seismic network and strong motion waveforms fromthe K-net and Kik-net are also available. JMA routinely pro-cesses the microearthquake data from Hi-net, the universitygroup network, and its own network (Japan MeteorologicalAgency, 2001). JMA produced the unified data set of phase
Detailed Fault Structure of the 2000 Western Tottori, Japan, Earthquake Sequence 1469
132oE 133oE 134oE 135oE
36oN
50 km
130oE 140oE
30oN
40oN
500 km
1943 Tottori2000 Western
Tottori
Station Distribution for P- andS- Phase Pick Data
Tectonic Stress
PA
PH
EU
NA
35oN
34oN
Figure 1. Station distribution of high-gain micro-seismic network in western Honshu, Japan, used forthe relocation. Stations belong to either Hi-net, uni-versity network, or the JMA network. The epicentraldistribution of the 2000 western Tottori aftershocksand fault trace of the 1943 Tottori earthquakes arealso shown. In upper left panel, the configuration ofthe plates in this region is shown. EU, Eurasian plate;NA, North American plate; PA, Pacific plate; PH,Philippine Sea plate.
Table 1Velocity Structure
This Study Kyoto University
Depth(km)
P-Wave Velocity(km/sec)
Depth(km)
P-Wave Velocity(km/sec)
0.0 3.0 0.0 5.51.0 4.0 2.0 6.053.0 6.0 16.0 6.6
30.0 8.0 38.0 8.0
arrival times of the Tottori mainshock and its aftershocksthat we used in this study. The National Research Institutefor Earth Science and Disaster Prevention (NIED) routinelyestimates the seismic moment tensors whose JMA magni-tudes are greater than 3.5 using the FREESIA network (Fu-kuyama et al., 1998, 2001a; Kubo et al., 2002).
A new high-resolution hypocenter relocation techniquehas recently been developed by Waldhauser and Ellsworth(2000). This technique minimizes the residuals between ob-served and calculated travel time differences (or double dif-ferences [DDs]) for pairs of nearby earthquakes. By formingdifferences in this manner, the common mode travel timeerrors are canceled, making the computation insensitive tothe assumed velocity structure. We have applied this methodto the 2000 western Tottori earthquake and its aftershocks.
In this article, in order to reveal the detailed fault struc-ture in the region of the 2000 western Tottori earthquake,we first relocated its aftershocks using the DD method. Then,we compared the fault structure revealed by the relocatedseismicity with the moment tensors obtained from broad-band seismic waveforms of the corresponding events. Weconstruct a fault model of the 2000 western Tottori earth-quake region based on the relocated aftershock hypocentersand moment tensor solutions. Finally we estimate the stressfield using stress tensor inversion and investigate its com-patibility with the fault geometry.
Relocation of Aftershock Sequence
JMA gathers all the data streams from the microearth-quake stations of Hi-net, several university networks, and itsown network and routinely reads the P- and S-wave arrivalsto determine the hypocenters (Japan Meteorological Agency,2001). We used this arrival time data for earthquakes oc-curring from 6 October to 17 November 2000, in the regionbetween 35.00� and 35.50� N, 133.00� and 133.55� E. Intotal, there are about 9200 events in the JMA unified dataset, and we successfully relocated about 8500 using the DDmethod.
To relocate the earthquakes with “hypo DD” (a programfor the DD method; Waldhauser and Ellsworth, 2000), weused stations within an epicentral distance of 120 km (Fig. 1)in order to exclude the Pn arrivals. We discarded events withfewer than eight readings. We used a velocity structure withfour layers, as shown in Table 1. The S-wave velocity isassumed to be of the P-wave speed.1/ 3�
We also tested the velocity model used for routine lo-cation at the Disaster Prevention Research Institute, KyotoUniversity (T. Shibutani, personal comm. 2000), which alsoconsists of four layers (Table 1). The main difference be-tween the models is the velocity in the shallow parts. How-ever, there are no distinct differences in the seismicity pat-tern. This implies that the DD method is robust with respectto the uncertainties in the velocity structure. We prefer theprimary model because fewer events were pushed above the
model surface, indicating that low velocity near the surfaceis more appropriate in this case.
Included among the unrelocated earthquakes are fewerthan 10 M 3–4 earthquakes that occurred within 1/2 hour ofthe mainshock. Relocation failed because of an insuffcientnumber of readings created by their overlapping waveforms.All other unrelocated aftershocks are all M 2 or smallerearthquakes. The percentages of unrelocated events forgreater than and less than M 3.0 events are 2.1% and 6.6%,respectively. Thus we could successfully relocate most ofthe important aftershocks.
In Figure 2, the original JMA hypocenters from the uni-fied catalog and the result of the DD relocation are shown.Many fine fault structures that are suggested in the JMA hy-pocenters can be easily recognized in the DD relocations. Inthe gross view, two major fault trends are evident. One
1470 E. Fukuyama, W. L. Ellsworth, F. Waldhauser, and A. Kubo
133.2oE 133.4oE
35.2oN
35.4oN
10 km
0 10 20 3020
10
0
0 520
10
0
0 520
10
0
133.2oE 133.4oE
10 km
0 10 20 3020
10
0
(a) JMA Hypocenters (b) Relocated Hypocenters
A
B
A
B
H.HINH
Depth (km
)
Depth (km
)
Distance (km)Distance (km)
F
E
D
C
DC
FE
Depth (km
)D
epth (km)
Distance (km)A B A B
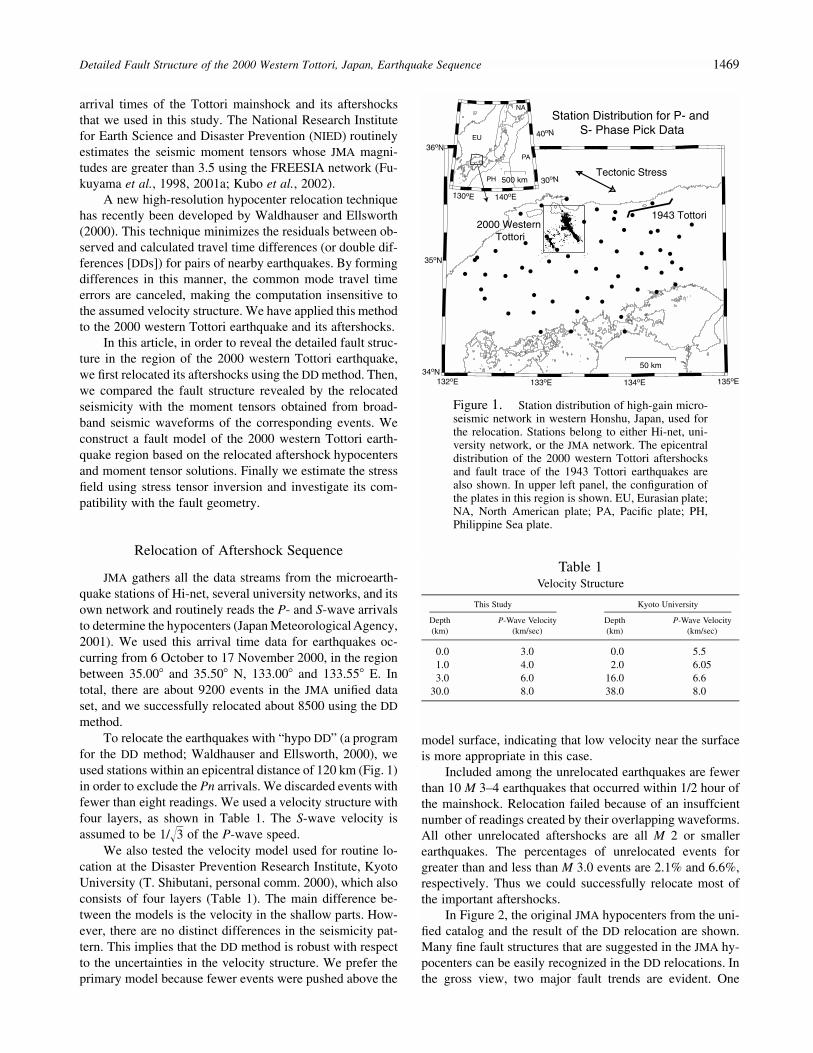
Figure 2. (a) Original distribution of aftershocks estimated by JMA. (b) Distributionof aftershocks relocated by the double difference method. All the earthquakes are plot-ted with a fixed scale in order to enhance the lineament of the fault trace. The graycircle shows the mainshock hypocenter. Triangles indicate the station locations. StationH.HINH was used to examine the depths of earthquakes. The AB box in both figuresshows the longitudinal cross section of hypocenters. The CD and EF cross sections arealso shown for relocated hypocenters.
trends N145�E, which is consistent with the mainshock faultdirection. The other is almost north–south (N170�E) in trend,which can be seen in the northern part. It should also benoted that there are conjugate faults for both groups, thewestern branch and northern fault group. These two linea-ments (N145�E and N170�E) might suggest a pre-existingfault system at depth 8–10 km.
In Figure 2, a longitudinal cross section of relocatedhypocenters is shown. Aftershocks in the southern region(12–30 km in distance in Fig. 2), where slip occurred duringthe mainshock (Yagi and Kikuchi, 2000; Iwata and Seki-guchi, 2001), are distributed from 2 to 15 km in depth; how-ever, in the northern part (0–12 km in distance in Fig. 2)where little if any slip occurred during the mainshock, af-tershocks are distributed in a very narrow depth range. To-ward the southern end of the zone, the fault plane developsa westward dip (Fig. 2).
The sparse geometry of the permanent station networklimits our ability to determine focal depths, particularly forthe shallowest event. Only two permanent stations are lo-cated close to the main body of the aftershock zone, andnone atop the complex northern end of the zone. Conse-quently, our depths in this region are poorly constrained.Focal depths estimated using more than 60 temporary sta-tions installed just above the focal region by the Joint Groupfor Dense Aftershock Observation of the 2000 Tottori-kenSeibu Earthquake (2001) were reported to be as shallow as2 km in the northern part. We believe that their focal depthsshould be more accurate than ours. Fortunately, the vast ma-jority of the structures observed in the northern part of thezone are vertical strike-slip faults, and thus the lack of ab-solute depth control little affects their interpretation.
In the southern part of the zone, one permanent stationsits just above the fault (H.HINH; see Fig. 2). We can ex-
Detailed Fault Structure of the 2000 Western Tottori, Japan, Earthquake Sequence 1471
0 5 10 15 200
0.5
1
1.5
2
Depth (km)
Tsp
(s)
Vp=6km/s
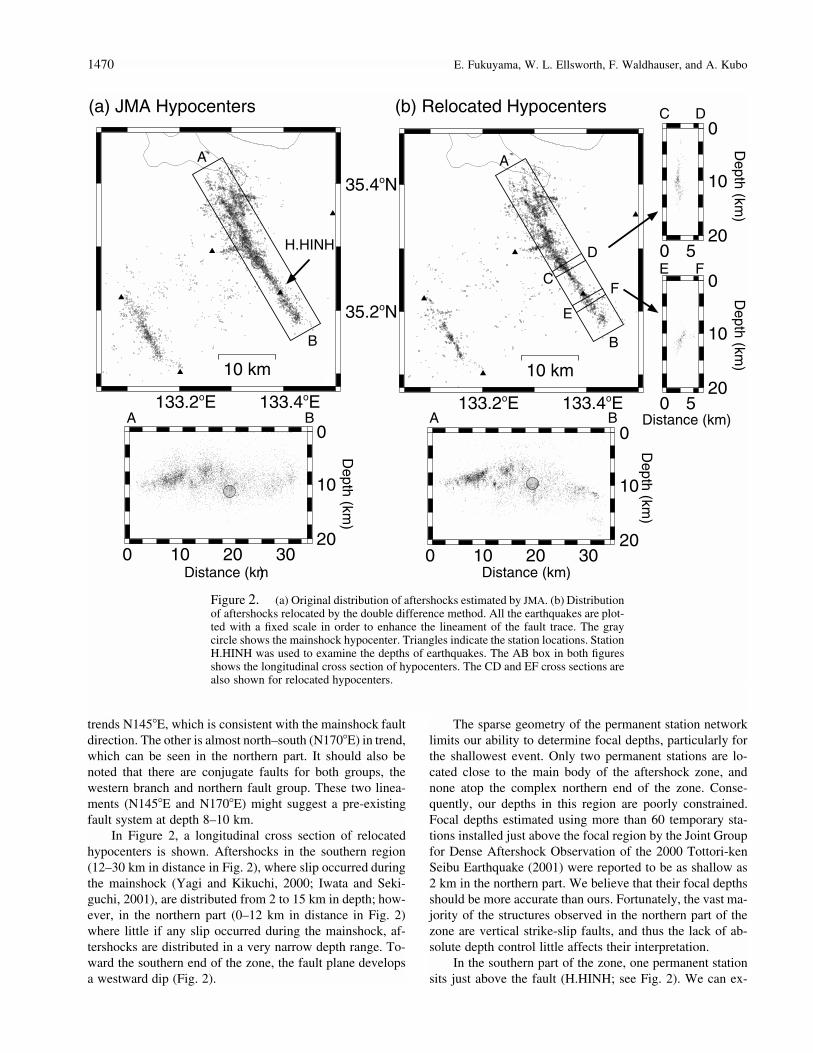
Figure 3. Correlation plot between S-P times andtheir depths of aftershocks occurring within 3 kmfrom station H.HINH shown in Figure 2.
amine the depth of earthquakes occurring beneath this sta-tion using S-P times. Figure 3 shows the relation betweenestimated depths and observed S-P times for earthquakesoccurring within the epicentral distance of 2 km from thisstation. There are some earthquakes that appear to be sys-tematically too deep, but others agree with the observedS-P interval. In this figure, S-P times in the range from 0.4to 1.8 sec correspond to the depth interval from 3.2 to 14.8km, assuming that the average Vp � 6 km/sec and all earth-quakes occur beneath the station (i.e., D � 0 km). The depthrange of the relocation is 4–15 km, which is consistent withthe estimates using S-P times. These depths are also consis-tent with the depth range of the rupture during the mainshock(2 and 15 km) estimated by waveform inversion of near-field accerelograms (Iwata and Sekiguchi, 2001).
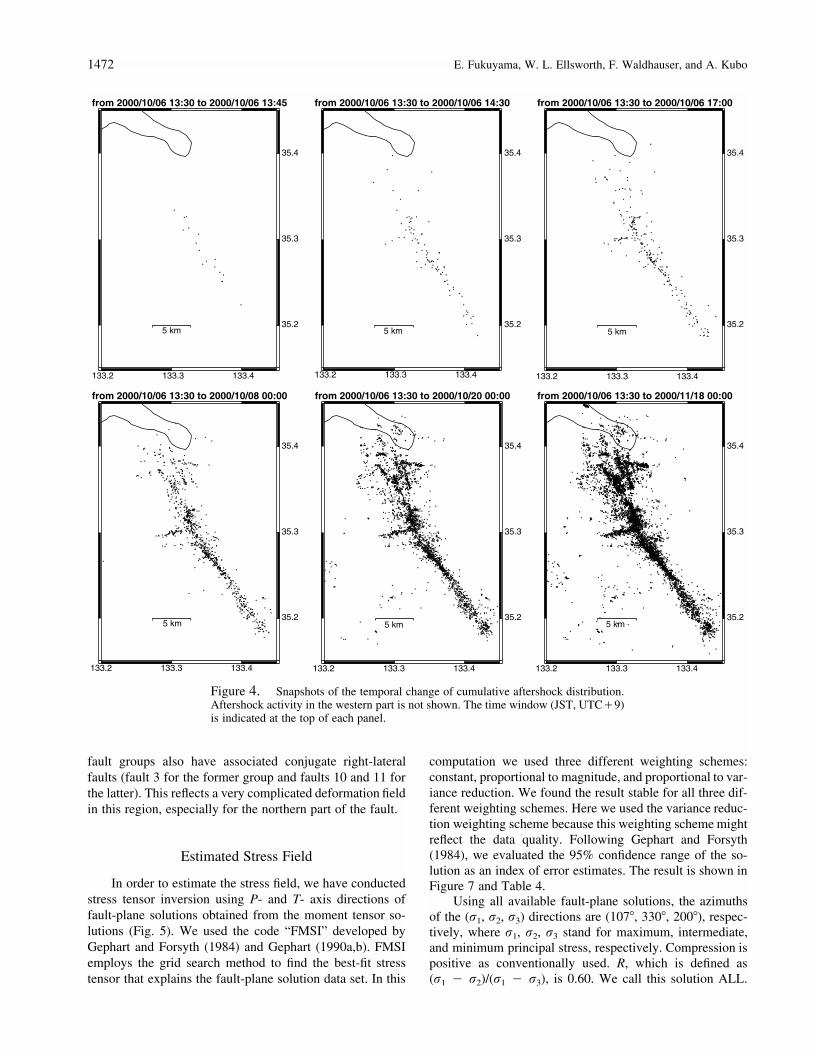
In Figure 4, the temporal development of the cumulativeaftershock distribution is shown. Within 15 min of the main-shock, the aftershocks concentrate along the southern part,where the slip during the mainshock is estimated to occur(e.g., Yagi and Kikuchi, 2000; Iwata and Sekiguchi, 2001).By 60 min after the mainshock, activity appears throughoutthe entire extent of the aftershock region. As time progresses,activity fills in the fault structures.
On 8 October at 13:17, the largest aftershock (Mw 5.1)occurred about 20 km west of the mainshock region. Thisevent was followed by its own aftershocks. With additionalpassage of time, the structures within the main zone densi-fied and widened, which might suggest that the aftershockactivity expanded from the mainshock fault surface to theentire fault zone. Also, several new alignments of after-shocks were recognized inside the aftershock region.
As stated before, there are about 10 relatively largeearthquakes (M �2) that occurred within 30 min after themainshock and could not be relocated, but other unrelocatedearthquakes are all very small earthquakes (M �2). Thus
while the first snapshot in Figure 4 is missing about 10 de-tected earthquakes, the other snapshots will not change sig-nificantly since the total number of unrelocated earthquakesis only 6.4%.
Fault Model by Aftershocks and Moment Tensors
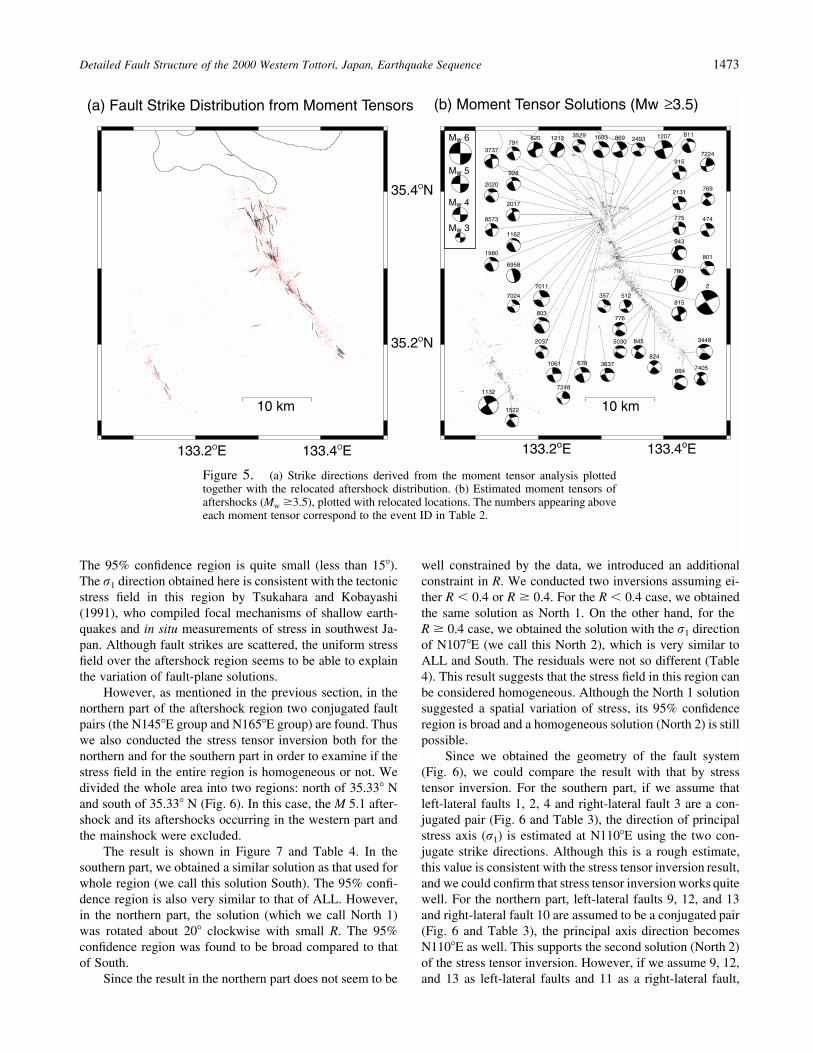
In Figure 5, strike directions and moment tensor solu-tions for M � 3.5 aftershocks are displayed together withall relocated hypocenters. All focal mechanism parametersare listed in Table 2. The strike directions are estimated fromthe moment tensor analysis using broadband seismic wave-forms (Fukuyama et al., 1998, 2001a). The details of theprocedure can also be found in Fukuyama and Dreger(2000), Fukuyama et al. (2001b), and Kubo et al. (2002).Among the two possible fault planes in the moment tensorsolution, the fault plane was chosen in the following way.First, the direction close to that of the mainshock rupture(N150�E) is chosen. The provisional plane is then comparedto the fault trend of the DD hypocenters, and obvious dis-agreements are manually switched to the auxiliary plane.
According to Kubo et al. (2002), errors in principal axisdirections are less than 15� in the NIED seismic momenttensor catalog. This error estimate is based on the compari-son between NIED moment tensors, Harvard Centrold Mo-ment Tensor, and JMA focal mechanism catalog. In theTottori region, since observational conditions are more fa-vorable than those of offshore earthquakes, this 15� errormight be an upper bound.
One can see in Figure 5 the excellent agreement be-tween relocated seismicity and fault strike directions esti-mated by the moment tensors. Taking into consideration theestimation errors of principal axis directions of moment ten-sors and fits between strikes from moment tensors and hy-pocenter distribution, the results suggest that the scatteringof the principal axes of moment tensors of aftershocks iscaused by a locally complicated fault system.
We have modeled the fault structure based on the re-located aftershocks. By looking at the map view of relocatedaftershocks, the strike of each fault was chosen. Then fromthe cross section perpendicular to the fault strike, the dipangle of each fault was estimated. These selections weredone by hand. We did not use a fitting algorithm to obtainthe fault plane automatically, because it was diffcult to sepa-rate the earthquakes on the fault from off-fault ones. Instead,by using human eyes, we could obtain a robust fault modelthat convincingly explains the relocated hypocenters. Thefault model is shown in Table 3 and Figure 6. We also com-pared the fault model with the moment tensor solutions inorder to check the geometry of each fault. This comparisonexplicitly assures the validity of the fault-plane selection byhand. Slip directions shown in Table 3 were obtained fromthe moment tensor solutions.
The obtained fault traces can be classified into twogroups of left-lateral faults, N145�E (faults 1, 2, 4, 5, 6) andN165�E (faults 9, 12, 13). It should be noted that the two
1472 E. Fukuyama, W. L. Ellsworth, F. Waldhauser, and A. Kubo
133.2 133.3 133.4
35.2
35.3
35.4
5 km
from 2000/10/06 13:30 to 2000/10/06 13:45
133.2 133.3 133.4
35.2
35.3
35.4
5 km
from 2000/10/06 13:30 to 2000/10/06 14:30
133.2 133.3 133.4
35.2
35.3
35.4
5 km
from 2000/10/06 13:30 to 2000/10/06 17:00
133.2 133.3 133.4
35.2
35.3
35.4
5 km
from 2000/10/06 13:30 to 2000/10/08 00:00
133.2 133.3 133.4
35.2
35.3
35.4
5 km
from 2000/10/06 13:30 to 2000/10/20 00:00
133.2 133.3 133.4
35.2
35.3
35.4
5 km
from 2000/10/06 13:30 to 2000/11/18 00:00
Figure 4. Snapshots of the temporal change of cumulative aftershock distribution.Aftershock activity in the western part is not shown. The time window (JST, UTC�9)is indicated at the top of each panel.
fault groups also have associated conjugate right-lateralfaults (fault 3 for the former group and faults 10 and 11 forthe latter). This reflects a very complicated deformation fieldin this region, especially for the northern part of the fault.
Estimated Stress Field
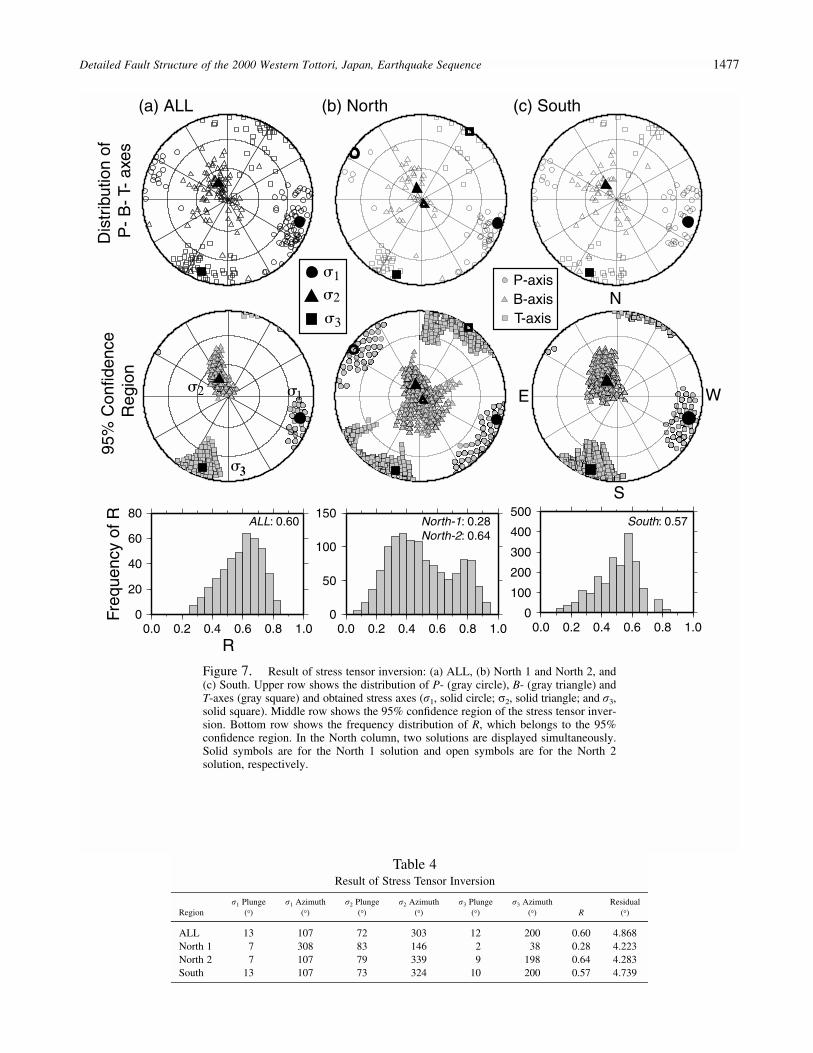
In order to estimate the stress field, we have conductedstress tensor inversion using P- and T- axis directions offault-plane solutions obtained from the moment tensor so-lutions (Fig. 5). We used the code “FMSI” developed byGephart and Forsyth (1984) and Gephart (1990a,b). FMSIemploys the grid search method to find the best-fit stresstensor that explains the fault-plane solution data set. In this
computation we used three different weighting schemes:constant, proportional to magnitude, and proportional to var-iance reduction. We found the result stable for all three dif-ferent weighting schemes. Here we used the variance reduc-tion weighting scheme because this weighting scheme mightreflect the data quality. Following Gephart and Forsyth(1984), we evaluated the 95% confidence range of the so-lution as an index of error estimates. The result is shown inFigure 7 and Table 4.
Using all available fault-plane solutions, the azimuthsof the (r1, r2, r3) directions are (107�, 330�, 200�), respec-tively, where r1, r2, r3 stand for maximum, intermediate,and minimum principal stress, respectively. Compression ispositive as conventionally used. R, which is defined as(r1 � r2)/(r1 � r3), is 0.60. We call this solution ALL.
Detailed Fault Structure of the 2000 Western Tottori, Japan, Earthquake Sequence 1473
133.2OE 133.4OE
35.2ON
35.4ON
10 km
133.2oE 133.4oE
10 km
2
357
474
512
664678
769
775
776
780
791
801
803
811
815
820
824
845
869
915
928
943
1061
1132
1162
12071212
1522
1693
1980
2017
2020
2037
2131
2493
3448
3529
3637
3737
5030
6958
7011
7024
7224
7248
7405
8573
Mw 6
Mw 5
Mw 4
Mw 3
(a) Fault Strike Distribution from Moment Tensors (b) Moment Tensor Solutions (Mw ≥3.5)
Figure 5. (a) Strike directions derived from the moment tensor analysis plottedtogether with the relocated aftershock distribution. (b) Estimated moment tensors ofaftershocks (Mw �3.5), plotted with relocated locations. The numbers appearing aboveeach moment tensor correspond to the event ID in Table 2.
The 95% confidence region is quite small (less than 15�).The r1 direction obtained here is consistent with the tectonicstress field in this region by Tsukahara and Kobayashi(1991), who compiled focal mechanisms of shallow earth-quakes and in situ measurements of stress in southwest Ja-pan. Although fault strikes are scattered, the uniform stressfield over the aftershock region seems to be able to explainthe variation of fault-plane solutions.
However, as mentioned in the previous section, in thenorthern part of the aftershock region two conjugated faultpairs (the N145�E group and N165�E group) are found. Thuswe also conducted the stress tensor inversion both for thenorthern and for the southern part in order to examine if thestress field in the entire region is homogeneous or not. Wedivided the whole area into two regions: north of 35.33� Nand south of 35.33� N (Fig. 6). In this case, the M 5.1 after-shock and its aftershocks occurring in the western part andthe mainshock were excluded.
The result is shown in Figure 7 and Table 4. In thesouthern part, we obtained a similar solution as that used forwhole region (we call this solution South). The 95% confi-dence region is also very similar to that of ALL. However,in the northern part, the solution (which we call North 1)was rotated about 20� clockwise with small R. The 95%confidence region was found to be broad compared to thatof South.
Since the result in the northern part does not seem to be
well constrained by the data, we introduced an additionalconstraint in R. We conducted two inversions assuming ei-ther R � 0.4 or R � 0.4. For the R � 0.4 case, we obtainedthe same solution as North 1. On the other hand, for theR � 0.4 case, we obtained the solution with the r1 directionof N107�E (we call this North 2), which is very similar toALL and South. The residuals were not so different (Table4). This result suggests that the stress field in this region canbe considered homogeneous. Although the North 1 solutionsuggested a spatial variation of stress, its 95% confidenceregion is broad and a homogeneous solution (North 2) is stillpossible.
Since we obtained the geometry of the fault system(Fig. 6), we could compare the result with that by stresstensor inversion. For the southern part, if we assume thatleft-lateral faults 1, 2, 4 and right-lateral fault 3 are a con-jugated pair (Fig. 6 and Table 3), the direction of principalstress axis (r1) is estimated at N110�E using the two con-jugate strike directions. Although this is a rough estimate,this value is consistent with the stress tensor inversion result,and we could confirm that stress tensor inversion works quitewell. For the northern part, left-lateral faults 9, 12, and 13and right-lateral fault 10 are assumed to be a conjugated pair(Fig. 6 and Table 3), the principal axis direction becomesN110�E as well. This supports the second solution (North 2)of the stress tensor inversion. However, if we assume 9, 12,and 13 as left-lateral faults and 11 as a right-lateral fault,
1474 E. Fukuyama, W. L. Ellsworth, F. Waldhauser, and A. Kubo
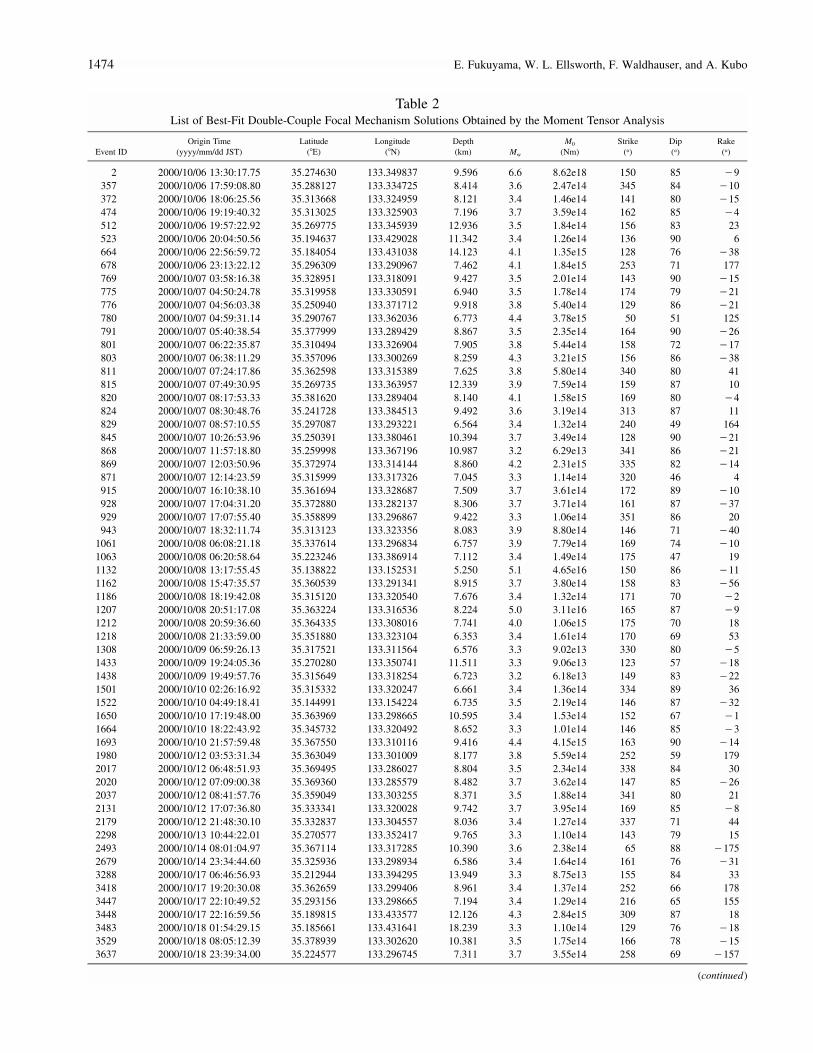
Table 2List of Best-Fit Double-Couple Focal Mechanism Solutions Obtained by the Moment Tensor Analysis
Event IDOrigin Time
(yyyy/mm/dd JST)Latitude
(�E)Longitude
(�N)Depth(km) Mw
M0
(Nm)Strike
(�)Dip(�)
Rake(�)
2 2000/10/06 13:30:17.75 35.274630 133.349837 9.596 6.6 8.62e18 150 85 �9357 2000/10/06 17:59:08.80 35.288127 133.334725 8.414 3.6 2.47e14 345 84 �10372 2000/10/06 18:06:25.56 35.313668 133.324959 8.121 3.4 1.46e14 141 80 �15474 2000/10/06 19:19:40.32 35.313025 133.325903 7.196 3.7 3.59e14 162 85 �4512 2000/10/06 19:57:22.92 35.269775 133.345939 12.936 3.5 1.84e14 156 83 23523 2000/10/06 20:04:50.56 35.194637 133.429028 11.342 3.4 1.26e14 136 90 6664 2000/10/06 22:56:59.72 35.184054 133.431038 14.123 4.1 1.35e15 128 76 �38678 2000/10/06 23:13:22.12 35.296309 133.290967 7.462 4.1 1.84e15 253 71 177769 2000/10/07 03:58:16.38 35.328951 133.318091 9.427 3.5 2.01e14 143 90 �15775 2000/10/07 04:50:24.78 35.319958 133.330591 6.940 3.5 1.78e14 174 79 �21776 2000/10/07 04:56:03.38 35.250940 133.371712 9.918 3.8 5.40e14 129 86 �21780 2000/10/07 04:59:31.14 35.290767 133.362036 6.773 4.4 3.78e15 50 51 125791 2000/10/07 05:40:38.54 35.377999 133.289429 8.867 3.5 2.35e14 164 90 �26801 2000/10/07 06:22:35.87 35.310494 133.326904 7.905 3.8 5.44e14 158 72 �17803 2000/10/07 06:38:11.29 35.357096 133.300269 8.259 4.3 3.21e15 156 86 �38811 2000/10/07 07:24:17.86 35.362598 133.315389 7.625 3.8 5.80e14 340 80 41815 2000/10/07 07:49:30.95 35.269735 133.363957 12.339 3.9 7.59e14 159 87 10820 2000/10/07 08:17:53.33 35.381620 133.289404 8.140 4.1 1.58e15 169 80 �4824 2000/10/07 08:30:48.76 35.241728 133.384513 9.492 3.6 3.19e14 313 87 11829 2000/10/07 08:57:10.55 35.297087 133.293221 6.564 3.4 1.32e14 240 49 164845 2000/10/07 10:26:53.96 35.250391 133.380461 10.394 3.7 3.49e14 128 90 �21868 2000/10/07 11:57:18.80 35.259998 133.367196 10.987 3.2 6.29e13 341 86 �21869 2000/10/07 12:03:50.96 35.372974 133.314144 8.860 4.2 2.31e15 335 82 �14871 2000/10/07 12:14:23.59 35.315999 133.317326 7.045 3.3 1.14e14 320 46 4915 2000/10/07 16:10:38.10 35.361694 133.328687 7.509 3.7 3.61e14 172 89 �10928 2000/10/07 17:04:31.20 35.372880 133.282137 8.306 3.7 3.71e14 161 87 �37929 2000/10/07 17:07:55.40 35.358899 133.296867 9.422 3.3 1.06e14 351 86 20943 2000/10/07 18:32:11.74 35.313123 133.323356 8.083 3.9 8.80e14 146 71 �40
1061 2000/10/08 06:08:21.18 35.337614 133.296834 6.757 3.9 7.79e14 169 74 �101063 2000/10/08 06:20:58.64 35.223246 133.386914 7.112 3.4 1.49e14 175 47 191132 2000/10/08 13:17:55.45 35.138822 133.152531 5.250 5.1 4.65e16 150 86 �111162 2000/10/08 15:47:35.57 35.360539 133.291341 8.915 3.7 3.80e14 158 83 �561186 2000/10/08 18:19:42.08 35.315120 133.320540 7.676 3.4 1.32e14 171 70 �21207 2000/10/08 20:51:17.08 35.363224 133.316536 8.224 5.0 3.11e16 165 87 �91212 2000/10/08 20:59:36.60 35.364335 133.308016 7.741 4.0 1.06e15 175 70 181218 2000/10/08 21:33:59.00 35.351880 133.323104 6.353 3.4 1.61e14 170 69 531308 2000/10/09 06:59:26.13 35.317521 133.311564 6.576 3.3 9.02e13 330 80 �51433 2000/10/09 19:24:05.36 35.270280 133.350741 11.511 3.3 9.06e13 123 57 �181438 2000/10/09 19:49:57.76 35.315649 133.318254 6.723 3.2 6.18e13 149 83 �221501 2000/10/10 02:26:16.92 35.315332 133.320247 6.661 3.4 1.36e14 334 89 361522 2000/10/10 04:49:18.41 35.144991 133.154224 6.735 3.5 2.19e14 146 87 �321650 2000/10/10 17:19:48.00 35.363969 133.298665 10.595 3.4 1.53e14 152 67 �11664 2000/10/10 18:22:43.92 35.345732 133.320492 8.652 3.3 1.01e14 146 85 �31693 2000/10/10 21:57:59.48 35.367550 133.310116 9.416 4.4 4.15e15 163 90 �141980 2000/10/12 03:53:31.34 35.363049 133.301009 8.177 3.8 5.59e14 252 59 1792017 2000/10/12 06:48:51.93 35.369495 133.286027 8.804 3.5 2.34e14 338 84 302020 2000/10/12 07:09:00.38 35.369360 133.285579 8.482 3.7 3.62e14 147 85 �262037 2000/10/12 08:41:57.76 35.359049 133.303255 8.371 3.5 1.88e14 341 80 212131 2000/10/12 17:07:36.80 35.333341 133.320028 9.742 3.7 3.95e14 169 85 �82179 2000/10/12 21:48:30.10 35.332837 133.304557 8.036 3.4 1.27e14 337 71 442298 2000/10/13 10:44:22.01 35.270577 133.352417 9.765 3.3 1.10e14 143 79 152493 2000/10/14 08:01:04.97 35.367114 133.317285 10.390 3.6 2.38e14 65 88 �1752679 2000/10/14 23:34:44.60 35.325936 133.298934 6.586 3.4 1.64e14 161 76 �313288 2000/10/17 06:46:56.93 35.212944 133.394295 13.949 3.3 8.75e13 155 84 333418 2000/10/17 19:20:30.08 35.362659 133.299406 8.961 3.4 1.37e14 252 66 1783447 2000/10/17 22:10:49.52 35.293156 133.298665 7.194 3.4 1.29e14 216 65 1553448 2000/10/17 22:16:59.56 35.189815 133.433577 12.126 4.3 2.84e15 309 87 183483 2000/10/18 01:54:29.15 35.185661 133.431641 18.239 3.3 1.10e14 129 76 �183529 2000/10/18 08:05:12.39 35.378939 133.302620 10.381 3.5 1.75e14 166 78 �153637 2000/10/18 23:39:34.00 35.224577 133.296745 7.311 3.7 3.55e14 258 69 �157
(continued)
Detailed Fault Structure of the 2000 Western Tottori, Japan, Earthquake Sequence 1475
Table 2(Continued)
Event IDOrigin Time
(yyyy/mm/dd JST)Latitude
(�E)Longitude
(�N)Depth(km) Mw
M0
(Nm)Strike
(�)Dip(�)
Rake(�)
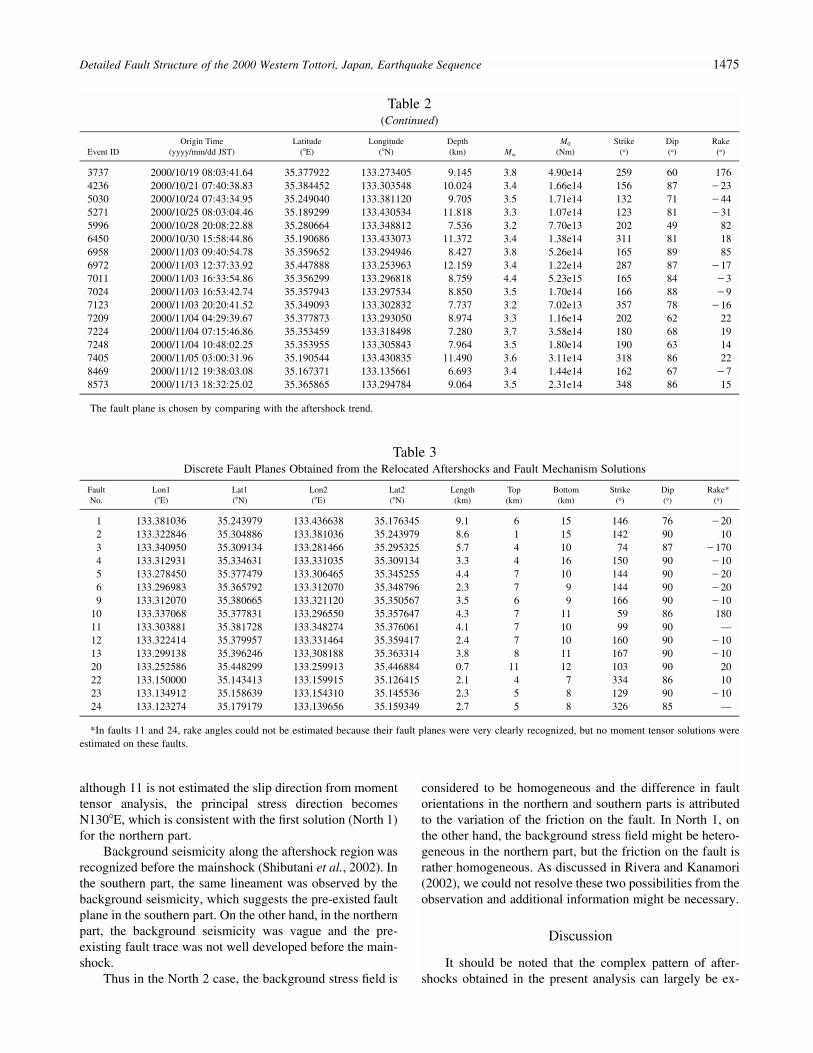
3737 2000/10/19 08:03:41.64 35.377922 133.273405 9.145 3.8 4.90e14 259 60 1764236 2000/10/21 07:40:38.83 35.384452 133.303548 10.024 3.4 1.66e14 156 87 �235030 2000/10/24 07:43:34.95 35.249040 133.381120 9.705 3.5 1.71e14 132 71 �445271 2000/10/25 08:03:04.46 35.189299 133.430534 11.818 3.3 1.07e14 123 81 �315996 2000/10/28 20:08:22.88 35.280664 133.348812 7.536 3.2 7.70e13 202 49 826450 2000/10/30 15:58:44.86 35.190686 133.433073 11.372 3.4 1.38e14 311 81 186958 2000/11/03 09:40:54.78 35.359652 133.294946 8.427 3.8 5.26e14 165 89 856972 2000/11/03 12:37:33.92 35.447888 133.253963 12.159 3.4 1.22e14 287 87 �177011 2000/11/03 16:33:54.86 35.356299 133.296818 8.759 4.4 5.23e15 165 84 �37024 2000/11/03 16:53:42.74 35.357943 133.297534 8.850 3.5 1.70e14 166 88 �97123 2000/11/03 20:20:41.52 35.349093 133.302832 7.737 3.2 7.02e13 357 78 �167209 2000/11/04 04:29:39.67 35.377873 133.293050 8.974 3.3 1.16e14 202 62 227224 2000/11/04 07:15:46.86 35.353459 133.318498 7.280 3.7 3.58e14 180 68 197248 2000/11/04 10:48:02.25 35.353955 133.305843 7.964 3.5 1.80e14 190 63 147405 2000/11/05 03:00:31.96 35.190544 133.430835 11.490 3.6 3.11e14 318 86 228469 2000/11/12 19:38:03.08 35.167371 133.135661 6.693 3.4 1.44e14 162 67 �78573 2000/11/13 18:32:25.02 35.365865 133.294784 9.064 3.5 2.31e14 348 86 15
The fault plane is chosen by comparing with the aftershock trend.
Table 3Discrete Fault Planes Obtained from the Relocated Aftershocks and Fault Mechanism Solutions
FaultNo.
Lon1(�E)
Lat1(�N)
Lon2(�E)
Lat2(�N)
Length(km)
Top(km)
Bottom(km)
Strike(�)
Dip(�)
Rake*(�)
1 133.381036 35.243979 133.436638 35.176345 9.1 6 15 146 76 �202 133.322846 35.304886 133.381036 35.243979 8.6 1 15 142 90 103 133.340950 35.309134 133.281466 35.295325 5.7 4 10 74 87 �1704 133.312931 35.334631 133.331035 35.309134 3.3 4 16 150 90 �105 133.278450 35.377479 133.306465 35.345255 4.4 7 10 144 90 �206 133.296983 35.365792 133.312070 35.348796 2.3 7 9 144 90 �209 133.312070 35.380665 133.321120 35.350567 3.5 6 9 166 90 �10
10 133.337068 35.377831 133.296550 35.357647 4.3 7 11 59 86 18011 133.303881 35.381728 133.348274 35.376061 4.1 7 10 99 90 —12 133.322414 35.379957 133.331464 35.359417 2.4 7 10 160 90 �1013 133.299138 35.396246 133.308188 35.363314 3.8 8 11 167 90 �1020 133.252586 35.448299 133.259913 35.446884 0.7 11 12 103 90 2022 133.150000 35.143413 133.159915 35.126415 2.1 4 7 334 86 1023 133.134912 35.158639 133.154310 35.145536 2.3 5 8 129 90 �1024 133.123274 35.179179 133.139656 35.159349 2.7 5 8 326 85 —
*In faults 11 and 24, rake angles could not be estimated because their fault planes were very clearly recognized, but no moment tensor solutions wereestimated on these faults.
although 11 is not estimated the slip direction from momenttensor analysis, the principal stress direction becomesN130�E, which is consistent with the first solution (North 1)for the northern part.
Background seismicity along the aftershock region wasrecognized before the mainshock (Shibutani et al., 2002). Inthe southern part, the same lineament was observed by thebackground seismicity, which suggests the pre-existed faultplane in the southern part. On the other hand, in the northernpart, the background seismicity was vague and the pre-existing fault trace was not well developed before the main-shock.
Thus in the North 2 case, the background stress field is
considered to be homogeneous and the difference in faultorientations in the northern and southern parts is attributedto the variation of the friction on the fault. In North 1, onthe other hand, the background stress field might be hetero-geneous in the northern part, but the friction on the fault israther homogeneous. As discussed in Rivera and Kanamori(2002), we could not resolve these two possibilities from theobservation and additional information might be necessary.
Discussion
It should be noted that the complex pattern of after-shocks obtained in the present analysis can largely be ex-
1476 E. Fukuyama, W. L. Ellsworth, F. Waldhauser, and A. Kubo
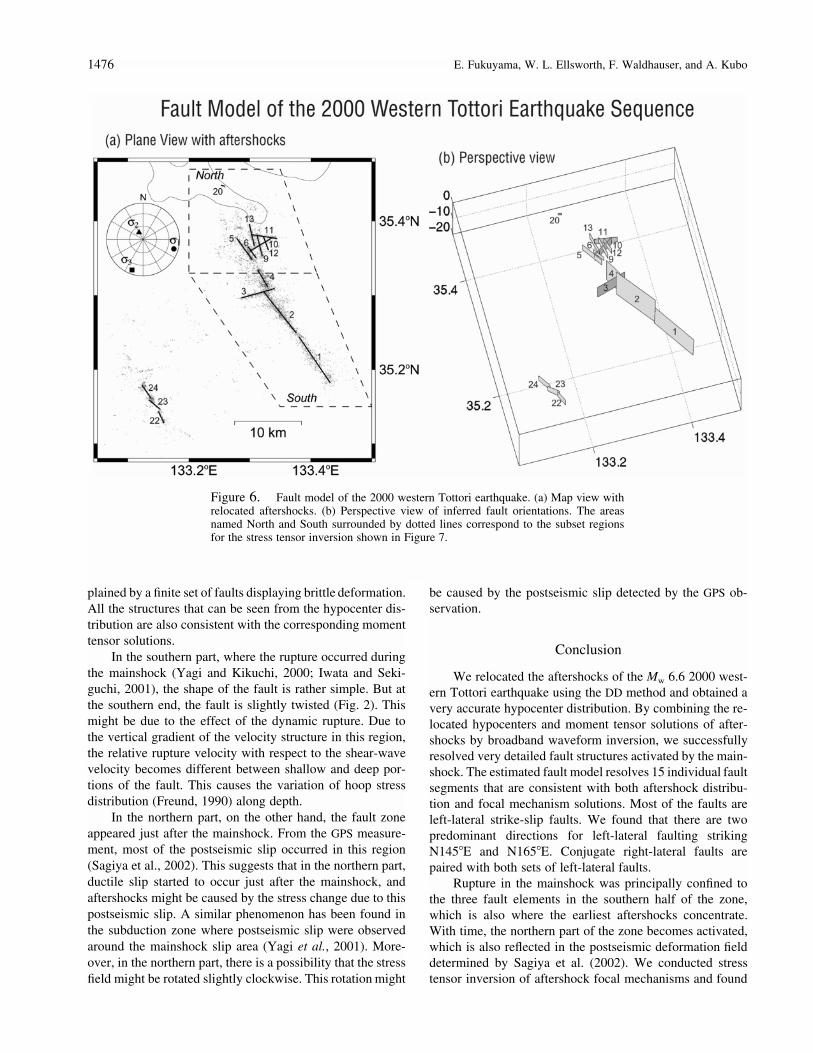
Figure 6. Fault model of the 2000 western Tottori earthquake. (a) Map view withrelocated aftershocks. (b) Perspective view of inferred fault orientations. The areasnamed North and South surrounded by dotted lines correspond to the subset regionsfor the stress tensor inversion shown in Figure 7.
plained by a finite set of faults displaying brittle deformation.All the structures that can be seen from the hypocenter dis-tribution are also consistent with the corresponding momenttensor solutions.
In the southern part, where the rupture occurred duringthe mainshock (Yagi and Kikuchi, 2000; Iwata and Seki-guchi, 2001), the shape of the fault is rather simple. But atthe southern end, the fault is slightly twisted (Fig. 2). Thismight be due to the effect of the dynamic rupture. Due tothe vertical gradient of the velocity structure in this region,the relative rupture velocity with respect to the shear-wavevelocity becomes different between shallow and deep por-tions of the fault. This causes the variation of hoop stressdistribution (Freund, 1990) along depth.
In the northern part, on the other hand, the fault zoneappeared just after the mainshock. From the GPS measure-ment, most of the postseismic slip occurred in this region(Sagiya et al., 2002). This suggests that in the northern part,ductile slip started to occur just after the mainshock, andaftershocks might be caused by the stress change due to thispostseismic slip. A similar phenomenon has been found inthe subduction zone where postseismic slip were observedaround the mainshock slip area (Yagi et al., 2001). More-over, in the northern part, there is a possibility that the stressfield might be rotated slightly clockwise. This rotation might
be caused by the postseismic slip detected by the GPS ob-servation.
Conclusion
We relocated the aftershocks of the Mw 6.6 2000 west-ern Tottori earthquake using the DD method and obtained avery accurate hypocenter distribution. By combining the re-located hypocenters and moment tensor solutions of after-shocks by broadband waveform inversion, we successfullyresolved very detailed fault structures activated by the main-shock. The estimated fault model resolves 15 individual faultsegments that are consistent with both aftershock distribu-tion and focal mechanism solutions. Most of the faults areleft-lateral strike-slip faults. We found that there are twopredominant directions for left-lateral faulting strikingN145�E and N165�E. Conjugate right-lateral faults arepaired with both sets of left-lateral faults.
Rupture in the mainshock was principally confined tothe three fault elements in the southern half of the zone,which is also where the earliest aftershocks concentrate.With time, the northern part of the zone becomes activated,which is also reflected in the postseismic deformation fielddetermined by Sagiya et al. (2002). We conducted stresstensor inversion of aftershock focal mechanisms and found
Detailed Fault Structure of the 2000 Western Tottori, Japan, Earthquake Sequence 1477
(a) ALL (b) North (c) SouthD
istr
ibut
ion
ofP
-B
-T-
axes
95%
Con
fiden
ceR
egio
n
N
S
E W
R
Freq
uenc
yof
R
�1
�3
�2P-axis
T-axisB-axis
ALL: 0.60 North-1: 0.28North-2: 0.64
South: 0.57
1�2
0
20
40
60
80
0.0 0.2 0.4 0.6 0.8 1.00
50
100
150
0.0 0.2 0.4 0.6 0.8 1.00
100
200
300
400
500
0.0 0.2 0.4 0.6 0.8 1.0
�
�3
Figure 7. Result of stress tensor inversion: (a) ALL, (b) North 1 and North 2, and(c) South. Upper row shows the distribution of P- (gray circle), B- (gray triangle) andT-axes (gray square) and obtained stress axes (r1, solid circle; r2, solid triangle; and r3,solid square). Middle row shows the 95% confidence region of the stress tensor inver-sion. Bottom row shows the frequency distribution of R, which belongs to the 95%confidence region. In the North column, two solutions are displayed simultaneously.Solid symbols are for the North 1 solution and open symbols are for the North 2solution, respectively.
Table 4Result of Stress Tensor Inversion
Regionr1 Plunge
(�)r1 Azimuth
(�)r2 Plunge
(�)r2 Azimuth
(�)r3 Plunge
(�)r3 Azimuth
(�) RResidual
(�)
ALL 13 107 72 303 12 200 0.60 4.868North 1 7 308 83 146 2 38 0.28 4.223North 2 7 107 79 339 9 198 0.64 4.283South 13 107 73 324 10 200 0.57 4.739
1478 E. Fukuyama, W. L. Ellsworth, F. Waldhauser, and A. Kubo
that the maximum stress direction obtained from the stresstensor inversion is N107�E, which is consistent with otherestimates of the tectonic stress field in this region. Slip onthe complex fault network in the northern part can be ex-plained either by the stress field responsible for the main-shock or by a 20� clockwise rotation of the stress field.
Acknowledgments
We would like to thank the Japan Meteorological Agency for provid-ing us all the phase reading data for the western Tottori sequence. Reviewsby Jeanne Hardebeck, associate editor, and Bjorn Lund and Judith Sheridanwere valuable in improving the manuscript. Comments by David Schaffwere helpful. GMT—the Generic Mapping Tools data processing and dis-play software package—was used to make the figures. This work was con-ducted under the project “Fundamental Research on Earthquake Source andEarth Anomaly” and “Research on Earthquake Mechanism” at the NationalResearch Institute for Earth Science and Disaster Prevention.
References
Centroid Moment Tensor Catalog. www.seismology.harvard.edu/CMTsearch.html.
Fukuyama, E., and D. S. Dreger (2000). Performance test for automatedmoment tensor determination system by using synthetic waveformsof the future Tokai earthquake, Earth Planets Space 52, 383–392.
Fukuyama, E., M. Ishida, D. S. Dreger, and H. Kawai (1998). Automatedseismic moment tensor determination by using on-line broadbandseismic waveforms, Zisin (J. Seismol. Soc. Jpn.) Ser. 2, 51, 149–156(in Japanese with English abstract).
Fukuyama, E., M. Ishida, S. Horiuchi, H. Inoue, S. Hori, S. Sekiguchi,T. Eguchi, A. Kubo, H. Kawai, H. Murakami, S. Yamamoto, and K.Nonomura (2001a). NIED seismic moment tensor catalogue January–December, 2000, Technical Notes of the National Research Institutefor Earth Science and Disaster Prevention 217, 1–131.
Fukuyama, E., A. Kubo, H. Kawai, and K. Nonomura (2001b). Seismicremote monitoring of stress field, Earth Planets Space 53, 1021–1026.
Freund, L. B. (1990). Dynamic Fracture Mechanics, Cambridge U Press,New York, 563 pp.
Gephart, J. W. (1990a). Stress and the direction of slip on fault planes,Tectonics 9, 845–858.
Gephart, J. W. (1990b). FMSI: a Fortran program for inverting fault/slick-enside and earthquake focal mechanism data to obtain the regionalstress tensor, Comput. Geosci. 16, 935–989.
Gephart, J. W., and D. W. Forsyth (1984). An improved method for deter-mining the regional stress tensor using earthquake focal mechanismdata: application to the San Fernando earthquake sequence, J. Geo-phys. Res. 89, 9305–9320.
Ichikawa, M. (1971). Reanalyses of mechanism of earthquakes which oc-curred in and near Japan and statistical studies on the nodal planesolutions obtained 1926–1968, Geophys. Mag. 35, 207–274.
Iwata, T., and H. Sekiguchi (2001). Substance of the earthquake faultingduring the 2000 western Tottori earthquake, SEISMO 5, March 2001,5–7 (in Japanese).
Japan Meteorological Agency (2001). The Seismological and Volcanolog-ical Bulletin of Japan, Japan Meteorological Agency, Tokyo.
Joint Group for Dense Aftershock Observation of the 2000 Tottori-kenSeibu Earthquake (2001). Aftershock distribution of the 2000 Tottori-ken Seibu earthquake determined precisely by dense aftershock ob-servation, Abstracts 2001 Japan Earth and Plantary Science JointMeeting, S3-005, Tokyo, 4–8 June (CD-Rom).
Kanamori, H. (1972). Determination of effective tectonic stress associatedwith earthquake faulting, the Tottori earthquake of 1943, Phys. EarthPlanet. Interiors, 5, 426–434.
Kubo, A., E. Fukuyama, H. Kawai, and K. Nonomura (2002). NIED seismicmoment tensor catalogue for regional earthquakes around Japan: qual-ity test and application, Tectonophysics 356, 23–48.
NIED Seismic Moment Tensor Catalog, www.fnet.bosai.go.jp.Research Group for Active Faults of Japan (1991). Active Faults in Japan,
(New Edition), Tokyo University Press, Tokyo (in Japanese).Rivera, L., and H. Kanamori (2002). Spatial heterogeneity of tectonic stress
and friction in the crust, Geophys. Res. Lett. 29, no. 6, 1088, doi10.1029/2001GL013803.
Sagiya, T., T. Nishimura, Y. Hatanaka, E. Fukuyama, and W. L. Ellsworth(2002). Crustal movements associate with the 2000 western Tottoriearthquake and its fault models, Zisin (J. Seismol. Soc. Jpn.) Ser. 54,523–534 (in Japanese with English abstract).
Shibutani, T., S. Nakao, R. Nishida, F. Takeuchi, K. Watanabe, and Y.Umeda (2002). Swarm-like seismic activity in 1989, 1990, and 1997preceding the 2000 western Tottori earthquake, Earth Planets Space54, 831–845.
Tsukahara, H., and Y. Kobayashi (1991). Crustal stress in the central andwestern parts of Honshu, Japan, Zisin (J. Seismol. Soc. Jpn.) Ser. 2,44, 221–231 (in Japanese with English abstract).
Waldhauser, F., and W. L. Ellsworth (2000). A double-difference earth-quake location algorithm: method and application to the northernHayward fault, California, Bull. Seism. Soc. Am. 90, 1353–1368.
Yagi, Y., and M. Kikuchi (2000). Source process of the 2000 October 6western Tottori earthquake (preliminary report), Newslett. Seism. Soc.Jpn. 12, no. 4, 9–10 (in Japanese).
Yagi, Y., M. Kikuchi, and T. Sagiya (2001). Co-seismic slip, post-seismicslip, and aftershocks associated with two large earthquakes in 1996in Hyuga-nada, Japan, Earth Planets Space 53, 793–803.
National Research Institute for Earth Science and Disaster Prevention3-1 Tennodai, Tsukuba, Ibaraki, 305-0006 [email protected]@bosai.go.jp
(E.F., A.K.)
U.S. Geological Survey345 Middlefield Road, Menlo Park, California [email protected]
(W.L.E., F.W.)
now at Lamont-Doherty Earth ObservatoryColumbia University61 Route 9W, Palisades, New York [email protected]
(F.W.)
Manuscript received 21 May 2002.


![Fault structure and mechanics of the Hayward Fault ...felixw/papers/Waldhauser_Ellsworth_JGR2002.pdf1. Introduction [2] The Hayward Fault is located on the eastern side of San Francisco](https://img.pdfslide.net/doc/110x75/611970a4a120600f8632fa4b/fault-structure-and-mechanics-of-the-hayward-fault-felixwpaperswaldhauserellsworthjgr2002pdf.jpg)

