Embed Size (px)
Citation preview
Research ArticleDetailed Parametric Investigation and Optimization of aComposite Wing with High Aspect Ratio
Yu-shan Meng, Li Yan, Wei Huang , and Tian-tian Zhang
College of Aerospace Science and Engineering, National University of Defense Technology, Changsha, 410073 Hunan, China
Correspondence should be addressed to Wei Huang; [email protected]
Received 10 March 2019; Revised 4 May 2019; Accepted 4 June 2019; Published 11 July 2019
Academic Editor: Antonio Viviani
Copyright © 2019 Yu-shan Meng et al. This is an open access article distributed under the Creative Commons Attribution License,which permits unrestricted use, distribution, and reproduction in any medium, provided the original work is properly cited.
The large deformation problem of the wing with high aspect ratio cannot be avoided due to the large bending moment and poortorsional stiffness. The wing design follows the following procedure; firstly, the design indexes of high aspect ratio wing arepreliminarily formulated referring to some parameters of the Predator UAV. Then, the aerodynamic analysis of the wing isperformed, and the stress cloud diagram is obtained. Next, the finite element model of the wing is designed, and the staticanalysis is conducted in the ANSYS ACP module, and the unreasonable component size is changed. An appropriate thicknesswhich is 12mm is selected as the final thickness of the wing. Then, the analysis of laying methods of skin structure is conducted.Finally, the composite structure is proved to reduce the maximum deformation and maximum stress effectively compared withthe metal wing.
1. Introduction
During the flight of an aircraft, the wing is crucial to the gen-eration of the lift force [1]. The wing will be overdeformed oreven destroyed once the stiffness of the wing is insufficientduring the flight. The unstable elastic effect is very dangerousat the same time [2]; the shear force and bending momentcaused by the aerodynamic force will increase from the tipto the root with the increase of the length of wings. As aresult, the tip of the wing will have a larger warpage deforma-tion, and the wing will be fatigued and broken easier.
As for the wing, the strength of the wing cannot beincreased without limit. Excessive strength will also lead toexcessive conservative margin, which will not only increasethe weight of the structure but also decrease the performanceof the aircraft. Therefore, a large number of composite mate-rials are used in the high aspect ratio wing in this paper. Thewing of UAV is a typical wing with large aspect ratio. Due toits long wingspan, the structural design problems of the wingare more significant. The application of lightweight and high-strength composite materials can not only reduce the weightof the structure but also make use of the elasticity of compos-ite materials to realize the complex bending and torsion
deformation of the wing, so as to meet the requirements ofcomposite stiffness and strength of the structure [3].
Scholars at home and abroad have been paying attentionto its parametric design, new configuration, and optimization[1]. Shi et al. [4] used numerical simulation analysis methodto study the geometric nonlinear deformation of UAV withlarge aspect ratio and solved the problem of model establish-ment and structural response of flexible wing. Based onCFD/CSD coupling method and Kriging approximationtechnology, Lu et al. [5] established a static aerostatic optimi-zation interpolation model for the wing and applied thehybrid optimization algorithm to the aerostatic optimizationdesign of the wing. Shokrieh and Behrooz [6] used finite ele-ment analysis software to calculate the torsional stiffness ofthe composite wing and the mass distribution along the wing,calculated the natural frequencies of the bending and tor-sional vibrations of the wing and the rotational natural fre-quency of the aileron, and finally drew the conclusion thatthere was no flutter within the design speed range of thewing. Takeda et al. [7] used FBG sensors to test the durabilityof composite wing structures, including service life and cyclicfatigue test. The results demonstrate that FBG sensors can beused to monitor the structural safety of large composite wing
HindawiInternational Journal of Aerospace EngineeringVolume 2019, Article ID 3684015, 27 pageshttps://doi.org/10.1155/2019/3684015

structures. Lu et al. [5] carried out the finite element analysisof a composite wing, and this proves that the finite elementapproach is effective in the analysis and investigation of thewing structure. The performance of the composite structureis superior to that of the metal structure and alloy steel struc-ture in weight reduction and other performances. Taig [8]stated that the most basic choice in the wing design is mate-rial selection and structural form selection, and he intro-duced the principles used to achieve design objectives,design requirements, and design constraints in detail. Kimet al. [9] used the multilevel optimization method to developthe optimization framework of the composite wing structure,and certain constraints were set to enhance the aeroelasticstability of the aircraft by seeking the best structural charac-teristics such as mass and torsional stiffness. Patil et al. [10]analyzed the aeroelastic instability problem of the aircraftreliably and modeled the important structural features ofthe wing. Finally, they concluded the effects of structuralcharacteristics and aerodynamics on the structural fluttervelocity and oscillation amplitude.
Njuguna [11] carried out the flutter study of compositestructure and briefly introduced the influence of fiber layupdirection on flutter. Omprakash et al. [12] carried out themultivariable optimization design of the wing, and the thick-ness and angle of the layer were both analyzed. The obtainedresults show that the structural stability, continuity, andweight reduction performance of the optimal design of thewing by means of the genetic algorithm are better than thoseusing traditional methods. In the aspect of laying design,Feng et al. [13] used the ANSYS finite element analysis soft-ware to optimize the layer of the wing under the premise thatthe parameters of the configuration are known, and finally,they got the optimal layering scheme. Liu et al. [14] usedthe finite element simulation approach to formulate the lay-ing schemes for several different wing layout forms, validatethe wing deployment test, and establish a set of researchschemes which can effectively improve the ratio of wing loadto structure weight.
2. Aerodynamic Analysis and StructuralDesign of the Wing
The design parameters of the wing are preliminarily formu-lated referring to some dimensions and flight parameters ofthe Predator UAV, as shown in Table 1.
2.1. Aerodynamic Analysis of NACA 2412.NACA 2412 airfoilis chosen as the design airfoil in this paper. The geometricmodel of NACA 2412 drawn in CATIA is imported intoICEM CFD [15]. The generated meshes that meet the qualityrequirements are shown in Figure 1. Then the aerodynamicanalysis of NACA 2412 is simulated in FLUENT. The pres-sure cloud diagram of the airfoil surface is obtained as shownin Figure 2.
For the postprocessing of the calculation of the externalflow field of the wing in the current study, the most notablething is the lift and drag characteristics of the wing. It canbe seen from Figure 2 that an obvious wingspan flow occursaround the wingtip because of the long wingspan of the wing,which is a three-dimensional turbulent flow. This is becausethere is no separation effect at the end of the wing, and thehigh-pressure airflow on the low surface of the wing will goaround the wingtip and roll up to the upper surface. The lon-ger the wingspan is, the more obvious the wingtip flowaround the wingtip will become.
2.2. Structural Design of the Wing. A widely accepted designscheme of composite structures in the field of aeronautics isthe “Building Block” [16]; in this paper, the wing designedin this paper is simplified into a structure with only beams,ribs, and skins. It adopts a double-beam structure with goodbending and torsion rigidity to obtain a structural layout withhigh bearing efficiency [17]. The size of the beam will not beparticularly large since the skin of the wing can provide partof the flexural stiffness, and the desired results can beobtained by increasing the thickness of the skin. The spar isessentially a shear beam as the main bearing member, andthe I-beam is used and arranged according to the equal per-centage line. The initial size of the fore beam and the rearbeam is shown in Figures 3(a) and 3(b).
The ribs are simplified to a structure with only webs so asto facilitate the analysis of the model in this paper. In thispaper. 14 wing ribs are designed for the wing, of which theroot is a reinforced wing rib with the thickness of 9mmand the others are ordinary wing ribs with a thickness of6mm. In addition, weight-reducing holes are arranged onthe wing ribs to reduce the weight of the structure. It isknown from engineering experience that the most suitabledistance between the two nearest ribs is 500mm to 600mm[18], and the distance is chosen as 560mm.
3. Preliminary Static Analysis of theComposite Wing
The ANSYS Composite Pre/Post (ANSYS ACP) compositematerial special module is the pre- and postprocessing
Table 1: Design parameters of the wing employed in the current study.
Wingspan (m) Root chord (m) Tip chord (m) Cruising Mach number Aspect ratio Flight height (m)
14.8 1.1 0.4 0.6 19.73 7620
y
z
x
Figure 1: Structural mesh of NACA 2412.
2 International Journal of Aerospace Engineering

module of the composite material analysis scheme [18]. Allcomposite material definitions are created and mapped tothe finite element grid in the preprocessing module. In thepostprocessing module, the resolving result file is importedinto the process to evaluate and visualize the compositestructure. The finite element analysis of the wing is carriedout in the Workbench collaborative simulation environmentdeveloped by ANSYS.
For the composite wing in this paper, the skin and wingribs are made of composite materials, while the aluminumalloy material is used for beam structure to overcome theshortcomings of poor shear resistance of the compositematerial. The material parameters are shown in Table 2and Table 3.
In this paper, the X-Y direction of the reference coordi-nate system coincides with the main direction of the material.
In Table 2 and Table 3, part of the performance properties ofmaterials is defined as follows:
(i) σb—tensile ultimate strength, it refers to the maxi-mum stress that the material can bear beforebreaking
(ii) S—shear XY
(iii) X—tensile X direction
(iv) Y—tensile Y direction
(v) μ12—Poisson’s ratio XY Y direction
(vi) X ′—compressive X direction
(vii) Y ′—compressive Y direction
0
2.835e+004
PressureContour 1
(Pa)
2.445e+004
2.055e+004
1.664e+004
1.274e+004
8.836e+004
4.933e+003
1.029e+003
−2.874e+003
−6.777e+003
−1.068e+004
−1.458e+004
−1.849e+004
−2.239e+004
−2.629e+004
1.000
0.500 1.500
y
x
z
2.000 (m)
Figure 2: Pressure contour on the NACA 2412 airfoil.
W1
H t
t1
t2
W1 = 110 mmW2 = 110 mmt = 10 mmt1 = 8 mmt2 = 8 mm
W2
(a)
W1
H t
t1
t2
W1 = 80 mmW2 = 80 mmt = 10 mmt1 = 8 mmt2 = 8 mm
W2
(b)
Figure 3: The size of fore beam and the rear beam.
3International Journal of Aerospace Engineering
When laminating the composite structures, the 0° fiberdirection (or reference direction) of the material is definedby the tool coordinate system Rosettes in the ANSYS ACPmodule, and the X axis of the tool coordinate system is the0° direction of the fiber. According to the empirical formula,as for the skin, when the ratio of three ply angles (±45, 0, and90) is 60 : 30 : 10, the structure performance of the wing is thebest. In the initial finite element static analysis, as for the skin,the stacking sequence is [45/90/0/90/-45]s, and subscript “s”denotes symmetrical layers. For the wing ribs, which aremainly subjected to shear stress [8], the stacking sequenceis [±45]5s. The thickness and layer parameters of the ribsare formulated as Table 4.
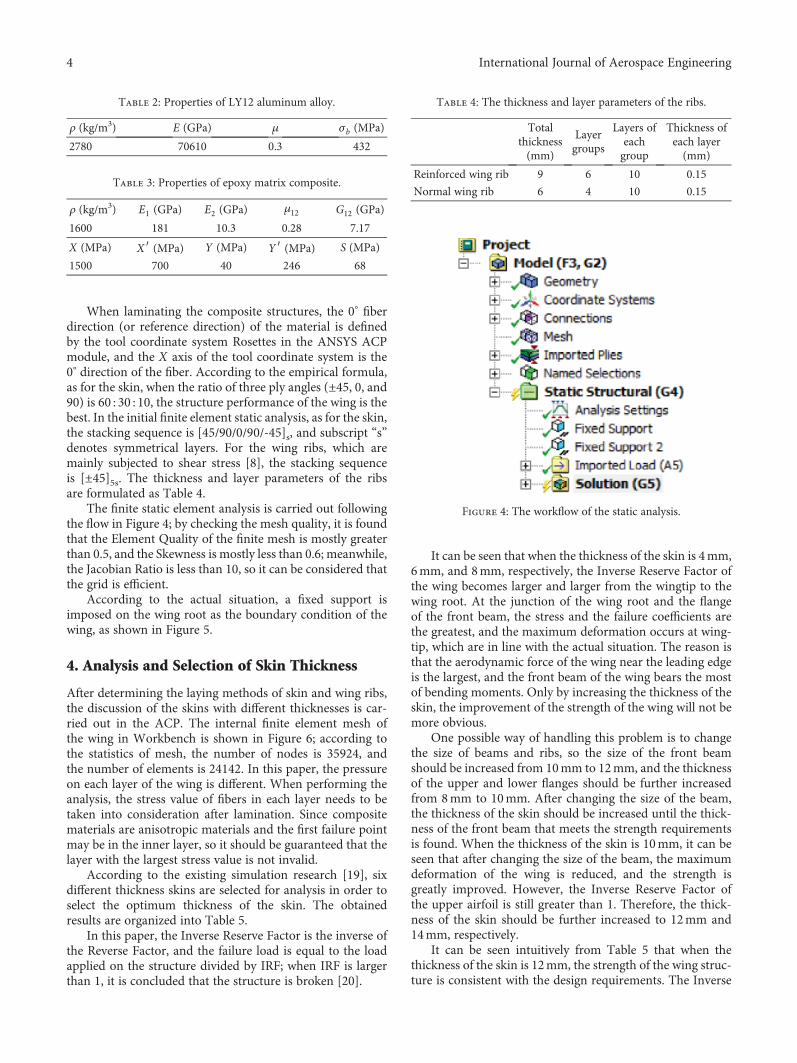
The finite static element analysis is carried out followingthe flow in Figure 4; by checking the mesh quality, it is foundthat the Element Quality of the finite mesh is mostly greaterthan 0.5, and the Skewness is mostly less than 0.6; meanwhile,the Jacobian Ratio is less than 10, so it can be considered thatthe grid is efficient.
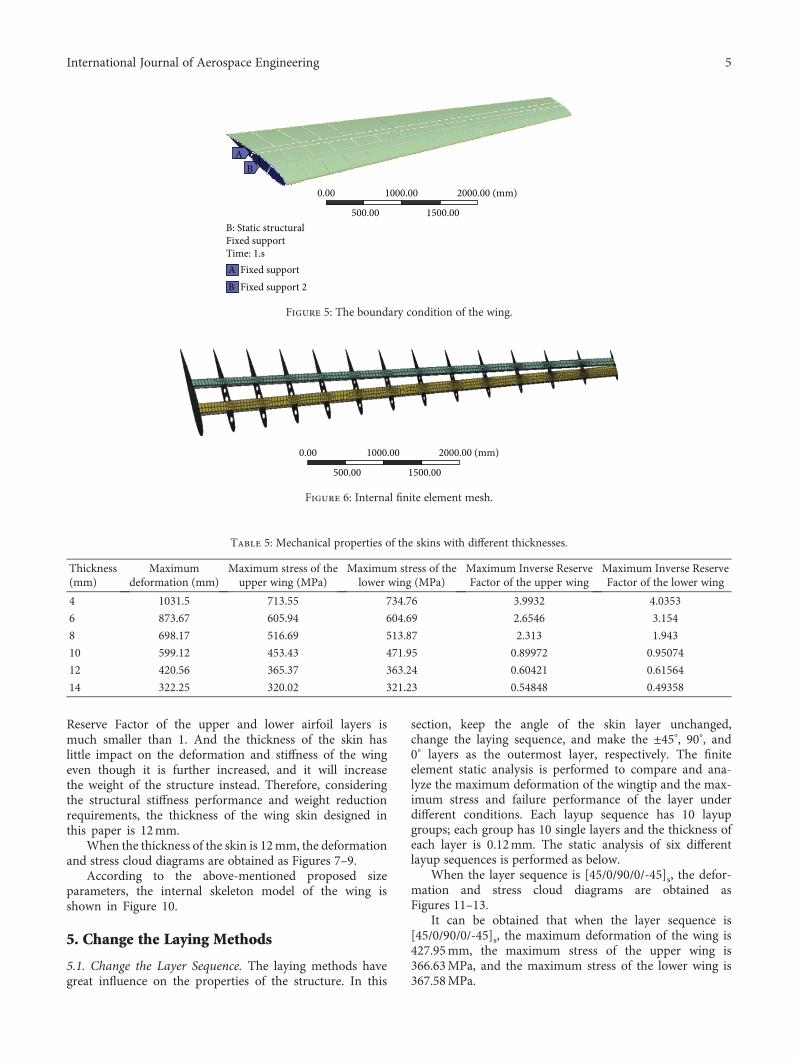
According to the actual situation, a fixed support isimposed on the wing root as the boundary condition of thewing, as shown in Figure 5.
4. Analysis and Selection of Skin Thickness
After determining the laying methods of skin and wing ribs,the discussion of the skins with different thicknesses is car-ried out in the ACP. The internal finite element mesh ofthe wing in Workbench is shown in Figure 6; according tothe statistics of mesh, the number of nodes is 35924, andthe number of elements is 24142. In this paper, the pressureon each layer of the wing is different. When performing theanalysis, the stress value of fibers in each layer needs to betaken into consideration after lamination. Since compositematerials are anisotropic materials and the first failure pointmay be in the inner layer, so it should be guaranteed that thelayer with the largest stress value is not invalid.
According to the existing simulation research [19], sixdifferent thickness skins are selected for analysis in order toselect the optimum thickness of the skin. The obtainedresults are organized into Table 5.
In this paper, the Inverse Reserve Factor is the inverse ofthe Reverse Factor, and the failure load is equal to the loadapplied on the structure divided by IRF; when IRF is largerthan 1, it is concluded that the structure is broken [20].
It can be seen that when the thickness of the skin is 4mm,6mm, and 8mm, respectively, the Inverse Reserve Factor ofthe wing becomes larger and larger from the wingtip to thewing root. At the junction of the wing root and the flangeof the front beam, the stress and the failure coefficients arethe greatest, and the maximum deformation occurs at wing-tip, which are in line with the actual situation. The reason isthat the aerodynamic force of the wing near the leading edgeis the largest, and the front beam of the wing bears the mostof bending moments. Only by increasing the thickness of theskin, the improvement of the strength of the wing will not bemore obvious.
One possible way of handling this problem is to changethe size of beams and ribs, so the size of the front beamshould be increased from 10mm to 12mm, and the thicknessof the upper and lower flanges should be further increasedfrom 8mm to 10mm. After changing the size of the beam,the thickness of the skin should be increased until the thick-ness of the front beam that meets the strength requirementsis found. When the thickness of the skin is 10mm, it can beseen that after changing the size of the beam, the maximumdeformation of the wing is reduced, and the strength isgreatly improved. However, the Inverse Reserve Factor ofthe upper airfoil is still greater than 1. Therefore, the thick-ness of the skin should be further increased to 12mm and14mm, respectively.
It can be seen intuitively from Table 5 that when thethickness of the skin is 12mm, the strength of the wing struc-ture is consistent with the design requirements. The Inverse
Table 4: The thickness and layer parameters of the ribs.
Totalthickness(mm)
Layergroups
Layers ofeachgroup
Thickness ofeach layer(mm)
Reinforced wing rib 9 6 10 0.15
Normal wing rib 6 4 10 0.15
Figure 4: The workflow of the static analysis.
Table 2: Properties of LY12 aluminum alloy.
ρ (kg/m3) E (GPa) μ σb (MPa)
2780 70610 0.3 432
Table 3: Properties of epoxy matrix composite.
ρ (kg/m3) E1 (GPa) E2 (GPa) μ12 G12 (GPa)
1600 181 10.3 0.28 7.17
X (MPa) X ′ (MPa) Y (MPa) Y ′ (MPa) S (MPa)
1500 700 40 246 68
4 International Journal of Aerospace Engineering
Reserve Factor of the upper and lower airfoil layers ismuch smaller than 1. And the thickness of the skin haslittle impact on the deformation and stiffness of the wingeven though it is further increased, and it will increasethe weight of the structure instead. Therefore, consideringthe structural stiffness performance and weight reductionrequirements, the thickness of the wing skin designed inthis paper is 12mm.
When the thickness of the skin is 12mm, the deformationand stress cloud diagrams are obtained as Figures 7–9.
According to the above-mentioned proposed sizeparameters, the internal skeleton model of the wing isshown in Figure 10.
5. Change the Laying Methods
5.1. Change the Layer Sequence. The laying methods havegreat influence on the properties of the structure. In this
section, keep the angle of the skin layer unchanged,change the laying sequence, and make the ±45°, 90°, and0° layers as the outermost layer, respectively. The finiteelement static analysis is performed to compare and ana-lyze the maximum deformation of the wingtip and the max-imum stress and failure performance of the layer underdifferent conditions. Each layup sequence has 10 layupgroups; each group has 10 single layers and the thickness ofeach layer is 0.12mm. The static analysis of six differentlayup sequences is performed as below.
When the layer sequence is [45/0/90/0/-45]s, the defor-mation and stress cloud diagrams are obtained asFigures 11–13.
It can be obtained that when the layer sequence is[45/0/90/0/-45]s, the maximum deformation of the wing is427.95mm, the maximum stress of the upper wing is366.63MPa, and the maximum stress of the lower wing is367.58MPa.
0.00 1000.00
AB
B: Static structuralFixed supportTime: 1.s
Fixed supportFixed support 2B
A
2000.00 (mm)
500.00 1500.00
Figure 5: The boundary condition of the wing.
0.00 1000.00 2000.00 (mm)
500.00 1500.00
Figure 6: Internal finite element mesh.
Table 5: Mechanical properties of the skins with different thicknesses.
Thickness(mm)
Maximumdeformation (mm)
Maximum stress of theupper wing (MPa)
Maximum stress of thelower wing (MPa)
Maximum Inverse ReserveFactor of the upper wing
Maximum Inverse ReserveFactor of the lower wing
4 1031.5 713.55 734.76 3.9932 4.0353
6 873.67 605.94 604.69 2.6546 3.154
8 698.17 516.69 513.87 2.313 1.943
10 599.12 453.43 471.95 0.89972 0.95074
12 420.56 365.37 363.24 0.60421 0.61564
14 322.25 320.02 321.23 0.54848 0.49358
5International Journal of Aerospace Engineering

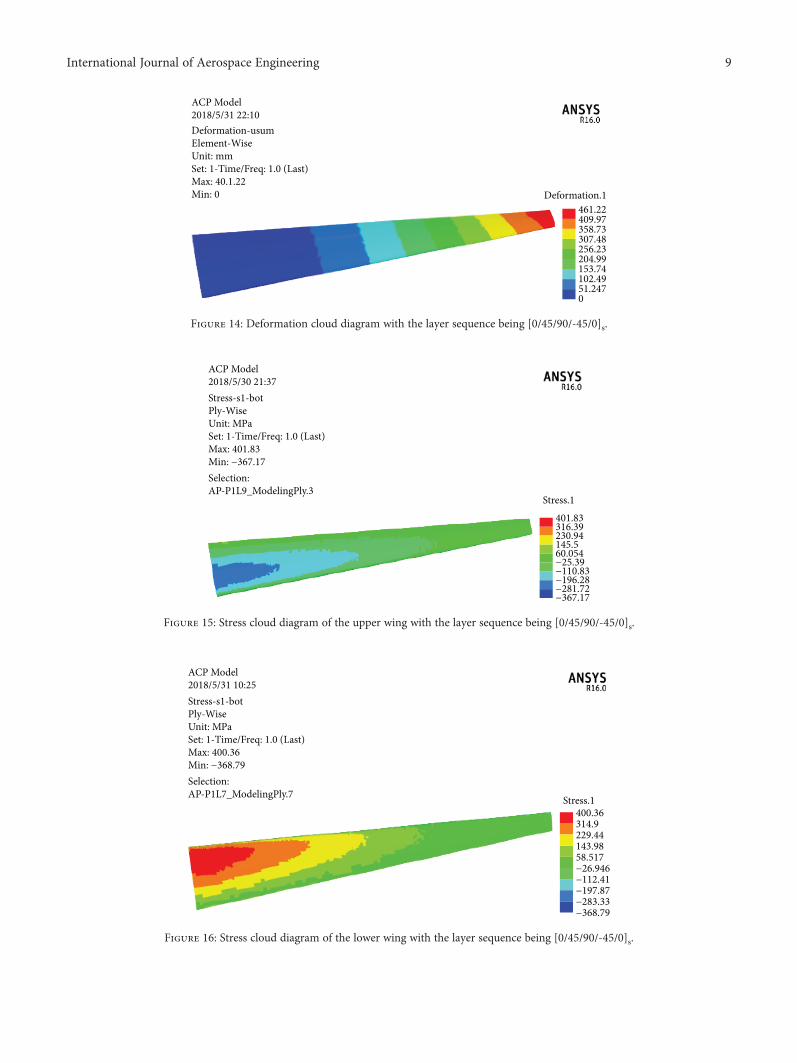
When the layer sequence is [0/45/90/-45/0]s, the defor-mation and stress cloud diagrams are obtained asFigures 14–16.
It can be obtained that when the layer sequence is[0/45/90/-45/0]s, the maximum deformation of the wing is461.22mm, the maximum stress of the upper wing is401.83MPa, and the maximum stress of the lower wing is400.36MPa.
When the layer sequence is [0/90/45/90/0]s, the defor-mation and stress cloud diagrams are obtained asFigures 17–19.
It can be obtained that when the layer sequence is[90/45/0/-45/90]s, the maximum deformation of the wing is475.49mm, the maximum stress of the upper wing is405.12MPa, and the maximum stress of the lower wing is409.02MPa.
420.56
Deformation.1
ACP Model2018/5/19 08:32
373.83327.1280.37233.05186.92140.1993.45846.7290
Deformation-usumElement-WiseUnit: mmSet: 1-Time/Freq: 1.0 (Last)Max: 420.56Min: 0
420.
Deformation.
ACP Model2018/5/19 08:32
373.327.280.233.186.140.93.446.7
Deformation-usumElement-WiseUnit: mmSet: 1-Time/Freq: 1.0 (Last)Max: 420.56Min: 0
Figure 7: Deformation cloud diagram with the thickness of the skin being 12mm.
365.37Stress.1
288.13210.88133.6356.383−20.865−98.112−175.36−252.61−329.85
ACP Model2018/5/31 08:58Stress -s1-botPly-WiseUnit: MPaSet 1-Time/Freq: 1.0 (Last)Max: 365.37Min: -329.85
Selection:AP-P1L4_ModelingPly: 4 365.37
Stress.1288.13210.88133.6356.383−20.86−98.11−175.3−252.6−329 8
ACP Model2018/5/31 08:58Stress -s1-botPly-WiseUnit: MPaSet 1-Time/Freq: 1.0 (Last)Max: 365.37Min: -329.85
Selection:AP-P1L4_ModelingggPlyy: 4
Figure 8: Stress cloud diagram of the upper wing with the thickness of the skin being 12mm.
363.24
Stress.1
294.65226.06157.4788.88320.293−48.297−116.89−185.48−254.07
ACP Model2018/5/30 11:19Stress -s1-botPly-WiseUnit: MPaSet 1-Time/Freq: 1.0 (Last)Max: 36324Min: −254.07 Selection:AP-P1L4_ModelingPly:5
363.24
Stress.1
294.65226.06157.4788.88320.293−48.29−116.8−185.4−254 0
ACP Model2018/5/30 11:19Stress -s1-botPly-WiseUnit: MPaSet 1-Time/Freq: 1.0 (Last)Max: 36324Min: −254.07Selection:AP-P1L4_ModelingPly:5
Figure 9: Stress cloud diagram of the lower wing with the thickness of the skin being 12mm.
6 International Journal of Aerospace Engineering

When the layer sequence is [90/45/0/-45/90]s, thedeformation and stress cloud diagrams are obtained asFigures 20–22.
It can be obtained that when the layer sequence is[90/45/0/-45/90]s, the maximum deformation of the wing is446.93mm, the maximum stress of the upper wing is385.41MPa, and the maximum stress of the lower wing is388.24MPa.
When the layer sequence is [90/0/45/0/90]s, the deforma-tion and stress cloud diagrams are obtained as Figures 23–25.
It can be obtained that when the layer sequence is[90/0/45/0/90]s, the maximum deformation of the wing is451.71mm, the maximum stress of the upper wing is393.48MPa, and the maximum stress of the lower wing is398MPa. The obtained results are organized into Table 6.
By comparing the results in Table 6, the following con-clusions can be drawn:
(1) The structural stiffness of the wing can be improvedby changing the laying sequence of the skin, and theinfluence of the laying sequence on the deformationof the wing is within several centimeters
(2) The deformation of the wingtip is the smallest, andthe stress is the smallest when the ±45 ply is locatedat the outermost part of the ply. The deformation ofthe wingtip is the largest when the 0 ply is locatedat the outermost part of the ply, and the failure coef-ficient is also the largest. When the outermost layer is90 degrees, the performance is in the middle
(3) In order to improve the stiffness of the structure andreduce the deformation and the failure coefficient, the±45 and 90 layers should be laid on the outermostlayer, and the 0 layers should be laid on the interiorof the layers as far as possible
5.2. Change the Layer Angle. Keep the layer sequenceunchanged, change the layer angle, and analyze the structuralproperties of the ply with different angles.
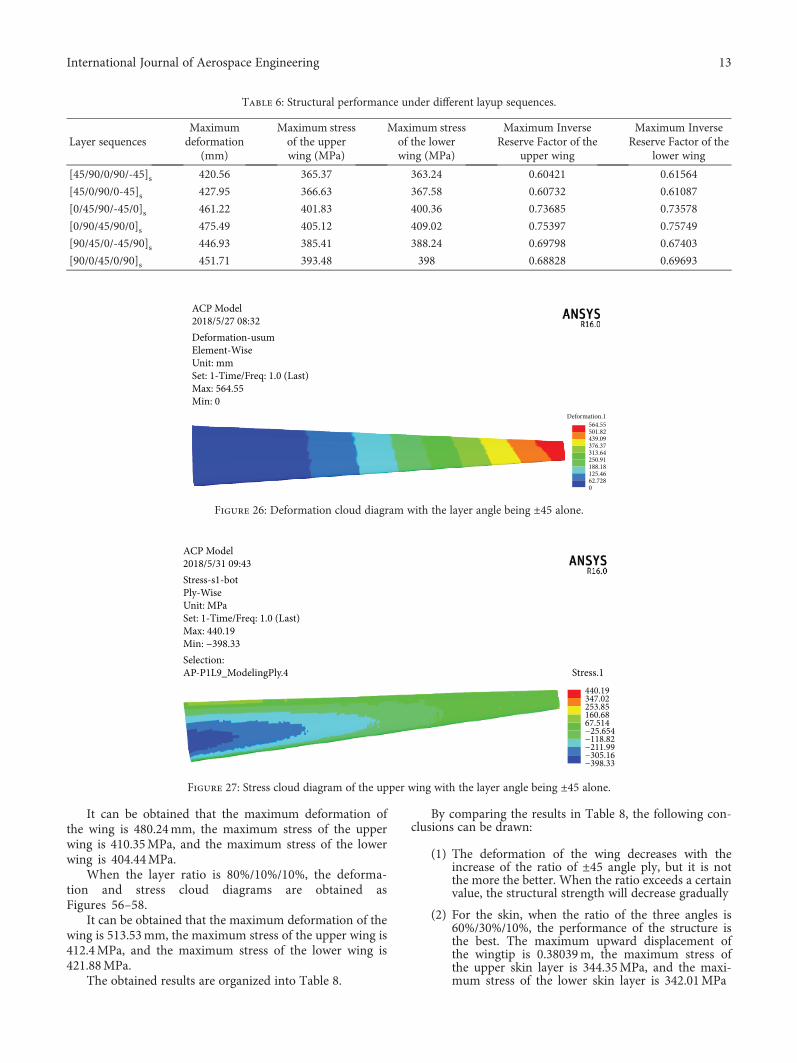
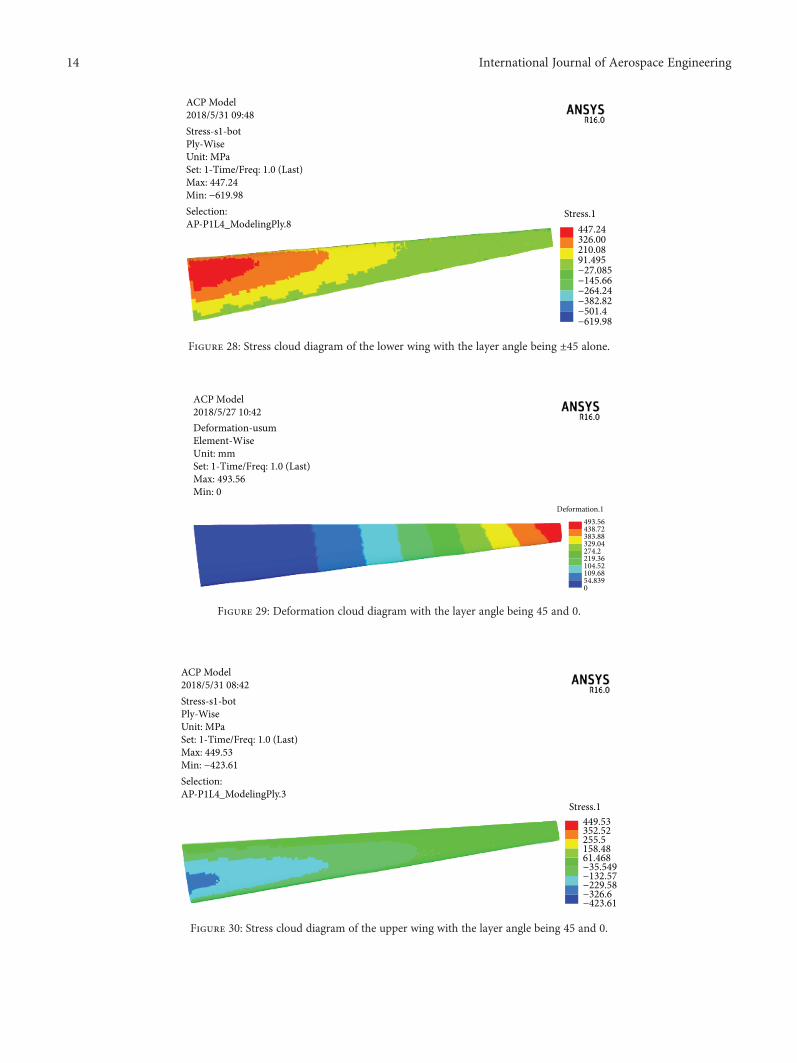
When the layer angle is ±45 alone, the deformation andstress cloud diagrams are obtained as Figures 26–28.
It can be obtained that the maximum deformation of thewing is 564.55mm, the maximum stress of the upper wing is440.19MPa, and the maximum stress of the lower wing is447.24MPa.
When the layer angle is 45 and 0, the deformation andstress cloud diagrams are obtained as Figures 29–31.
It can be obtained that the maximum deformation of thewing is 493.56mm, the maximum stress of the upper wing is449.53MPa, and the maximum stress of the lower wing is434.73MPa.
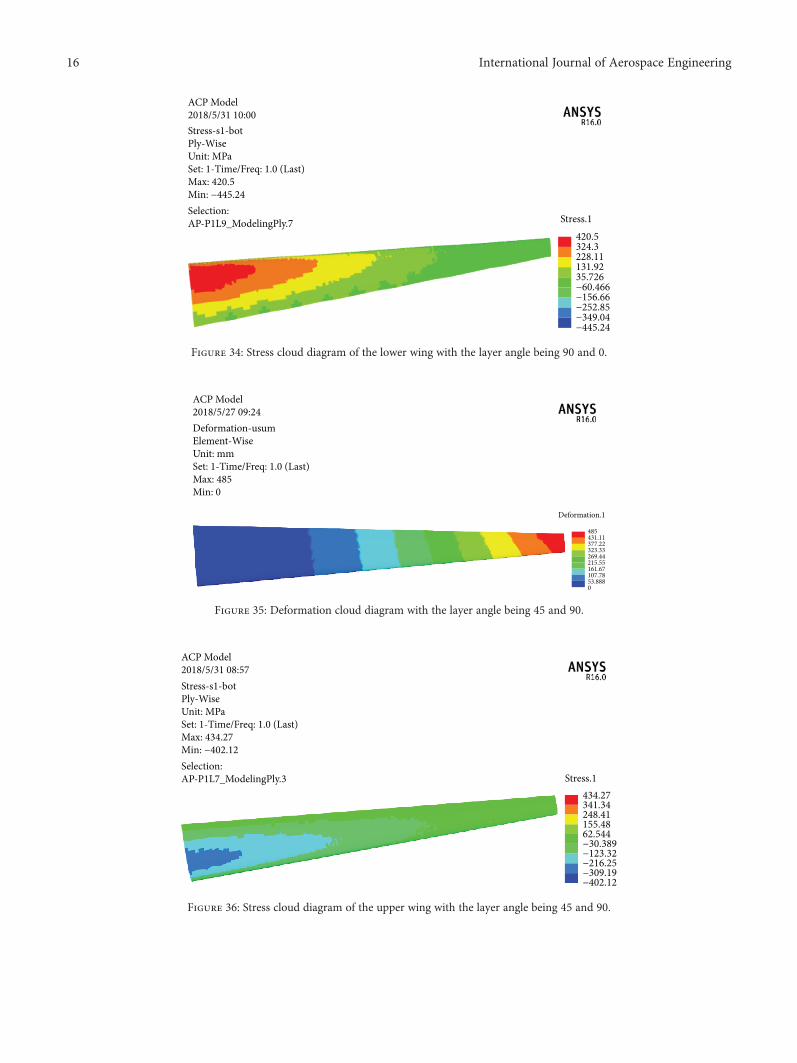
When the layer angle is 90 and 0, the deformation andstress cloud diagrams are obtained as Figures 32–34.
It can be obtained that the maximum deformation of thewing is 456.47mm, the maximum stress of the upper wing is420.91MPa, and the maximum stress of the lower wing is420.5MPa.
When the layer angle is 45 and 90, the deformation andstress cloud diagrams are obtained as Figures 35–37.
It can be obtained that the maximum deformation of thewing is 485mm, the maximum stress of the upper wing is434.27MPa, and the maximum stress of the lower wing is432.86MPa.
When the layer angle is ±45 and 90, the deformation andstress cloud diagrams are obtained as Figures 38–40.
It can be obtained that the maximum deformation of thewing is 470.46mm, the maximum stress of the upper wing is420.91MPa, and the maximum stress of the lower wing is416.36MPa.
The obtained results are organized into Table 7.By comparing the results in Table 7, the following con-
clusions can be drawn:
(1) Comparing the results of the first three groups withthe last group, the second group with the fifth group,it can be seen that the structural deformation andfailure coefficients with two angles are smaller thanthose with a single angle and larger than those withfour angles at the same time. It means that thestrength of the layer with standard angle mixed ishigher than that with a single layer. When laminatingcomposite structures, we should adopt the mixedlayers as far as possible
(2) By comparing the results of the second group withthe third group, it can be seen that the bendingstrength of 0 and 90 orthogonal ply is greater thanthat of 0 and 45 oblique ply
(3) By comparing the results of the third group with thefourth group, it can be concluded that the bendingdeformation of the structure with 45 only is greaterthan the structure with ±45. It shows that the princi-ple of equilibrium symmetry should be adopted inthe process of laying and the ±45 layer should beadopted at the same time
5.3. Change the Layer Ratio. Keep the angle and the layupsequence unchanged; adjust the proportion of the four angles(±45, 90, and 0) in the laminate layer. The following is ananalysis comparison of the eight different angle proportions.
When the layer ratio is 10%/10%/80%, the deformationand stress cloud diagrams are obtained as Figures 41–43.
It can be obtained that the maximum deformation of thewing is 523.99mm, the maximum stress of the upper wing is434.1MPa, and the maximum stress of the lower wing is423.11MPa.
Figure 10: Model of the overall internal skeleton with the thicknessof the skin being 12mm.
7International Journal of Aerospace Engineering

When the layer ratio is 20%/20%/60%, the deformationand stress cloud diagrams are obtained as Figures 44–46.
It can be obtained that the maximum deformation of thewing is 498.69mm, the maximum stress of the upper wing is414.68MPa, and the maximum stress of the lower wing is418.84MPa.
When the layer ratio is 30%/60%/10%, the deformationand stress cloud diagrams are obtained as Figures 47–49.
It can be obtained that the maximum deformation of thewing is 456.47mm, the maximum stress of the upper wing is405.12MPa, and the maximum stress of the lower wing is409.44MPa.
427.94Deformation.1
380.39332.84285.29237.74190.19142.6595.09747.5490
ACP Model2018/5/27 19:30Deformation-usumElement-WiseUnit: mmSet: 1-Time/Freq: 1.0 (Last)Max: 427.94Min: 0
427.9Deformation.
380.3332.8285.2237.7190.1142.695.0947.540
ACP Model2018/5/27 19:30Defoff rmation-usumElement-WiseUnit: mmSet: 1-Time/Freq: 1.0 (Last)Max: 427.94Min: 0
Figure 11: Deformation cloud diagram with the layer sequence being [45/0/90/0/-45]s.
366.63Stress.1
286.37206.1125.8345.556−34.714−114.98−195.25−275.52−355.79
ACP Model2018/5/31 09:44Stress-s1-botPly-WiseUnit: MPaSet: 1-Time/Freq: 1.0 (Last)Max: 366.63Min: −355.79Selection:AP-P1L7_ModelingPly.5
Figure 12: Stress cloud diagram of the upper wing with the layer sequence being [45/0/90/0/-45]s.
367.58Stress.1
302.04236.5170.96105.4339.888−25.651−91.19−156.73−222.27
ACP Model2018/5/31 15:04Stress-s1-botPly-WiseUnit: MPaSet: 1-Time/Freq: 1.0 (Last)Max: 367.58Min: −222.27Selection:AP-P1L4_ModelingPly.11
Figure 13: Stress cloud diagram of the lower wing with the layer sequence being [45/0/90/0/-45]s.
8 International Journal of Aerospace Engineering
461.22Deformation.1
409.97358.73307.48256.23204.99153.74102.4951.2470
ACP Model2018/5/31 22:10Deformation-usumElement-WiseUnit: mmSet: 1-Time/Freq: 1.0 (Last)Max: 40.1.22Min: 0
Figure 14: Deformation cloud diagram with the layer sequence being [0/45/90/-45/0]s.
401.83
Stress.1
316.39230.94145.560.054−25.39−110.83−196.28−281.72−367.17
ACP Model2018/5/30 21:37Stress-s1-botPly-WiseUnit: MPaSet: 1-Time/Freq: 1.0 (Last)Max: 401.83Min: −367.17Selection:AP-P1L9_ModelingPly.3
Figure 15: Stress cloud diagram of the upper wing with the layer sequence being [0/45/90/-45/0]s.
400.36Stress.1
314.9229.44143.9858.517−26.946−112.41−197.87−283.33−368.79
ACP Model2018/5/31 10:25Stress-s1-botPly-WiseUnit: MPaSet: 1-Time/Freq: 1.0 (Last)Max: 400.36Min: −368.79Selection:AP-P1L7_ModelingPly.7
Figure 16: Stress cloud diagram of the lower wing with the layer sequence being [0/45/90/-45/0]s.
9International Journal of Aerospace Engineering

475.49Deformation.1
422.65369.82316.99264.16211.33158.5105.6652.8320
ACP Model2018/5/31 21:56Deformation-usumElement-WiseUnit: mmSet: 1-Time/Freq: 1.0 (Last)Max: 475.49Min: 0
Figure 17: Deformation cloud diagram with the layer sequence being [0/45/90/-45/0]s.
405.12Stress.1
316.43227.73139.0350.338−38.357−127.05−215.75−304.44−393.14
ACP Model2018/5/31 16:29Stress-s1-botPly-WiseUnit: MPaSet: 1-Time/Freq: 1.0 (Last)Max: 405.12Min: −393.14Selection:AP-PIL7_ModelingPly.5
Figure 18: Stress cloud diagram of the upper wing with the layer sequence being [0/45/90/-45/0]s.
409.02Stress.1
331.55254.07176.5999.1221.644−55.831−133.31−210.78−288.26
ACP Model2018/5/30 11:11Stress-s1-botPly-WiseUnit: MPaSet: 1-Time/Freq: 1.0 (Last)Max: 409.02Min: −288.26Selection:AP-P1L2_ModelingPly.5
Figure 19: Stress cloud diagram of the lower wing with the layer sequence being [0/45/90/-45/0]s.
10 International Journal of Aerospace Engineering

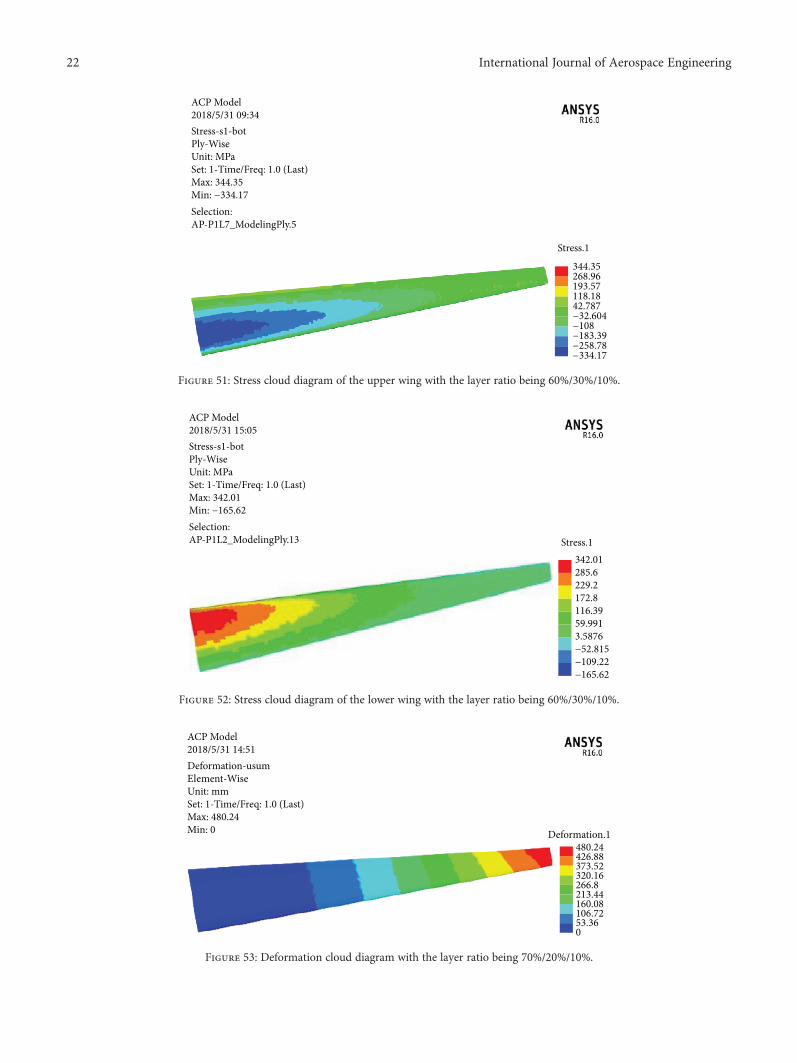
When the layer ratio is 60%/30%/10%, the deformationand stress cloud diagrams are obtained as Figures 50–52.
It can be obtained that the maximum deformation of thewing is 380.39mm, the maximum stress of the upper wing is
344.35MPa, and the maximum stress of the lower wing is342.01MPa.
When the layer ratio is 70%/20%/10%, the deformationand stress cloud diagrams are obtained as Figures 53–55.
446.93
Deformation.1
397.28347.62297.96248.3198.64148.9899.31949.6590
ACP Model2018/5/26 11:32Deformation-usumElement-WiseUnit: mmSet: 1-Time/Freq: 1.0 (Last)Max: 446.93Min: 0
Figure 20: Deformation cloud diagram with the layer sequence being [90/45/0/-45/90]s.
385.41Stress.1
304.84224.26143.6863.104−17.473−98.05−178.63−259.2−339.78
ACP Model2018/5/31 09:34Stress-s1-botPly-WiseUnit: MPaSet: 1-Time/Freq: 1.0 (Last)Max: 385.41Min: −339.78Selection:AP-P1L2_ModelingPly.5
Figure 21: Stress cloud diagram of the upper wing with the layer sequence being [90/45/0/-45/90]s.
388.24Stress.1
320.9253.56186.22118.8851.534−15.808−83.15−150.49−217.83
ACP Model2018/5/31 22:07Stress-s1-botPly-WiseUnit: MPaSet: 1-Time/Freq: 1.0 (Last)Max: 388.24Min: −217.83Selection:AP-P1L9_ModelingPly.9
Figure 22: Stress cloud diagram of the lower wing with the layer sequence being [90/45/0/-45/90]s.
11International Journal of Aerospace Engineering

451.71Deformation.1
401.52351.33301.14250.95200.76150.57100.3850.190
ACP Model2018/5/31 22:16Deformation-usumElement-WiseUnit: mmSet: 1-Time/Freq: 1.0 (Last)Max: 451.71Min: 0
Figure 23: Deformation cloud diagram with the layer sequence being [90/0/45/0/90]s.
393.48Stress.1
310.29227.1143.9160.719−22.47−105.66−188.85−272.04−355.23
ACP Model2018/5/31 09:19Stress-s1-botPly-WiseUnit: MPaSet: 1-Time/Freq: 1.0 (Last)Max: 393.48Min: −355.23Selection:AP-P1L4_ModelingPly.9
Figure 24: Stress cloud diagram of the upper wing with the layer sequence being [90/0/45/0/90]s.
398Stress.1
322.26246.53170.895.06719.334−56.398−132.13−207.86−283.59
ACP Model2018/5/31 10:25Stress-s1-botPly-WiseUnit: MPaSet: 1-Time/Freq: 1.0 (Last)Max: 398Min: −263.59Selection:AP-P1L4_ModelingPly.7
Figure 25: Stress cloud diagram of the lower wing with the layer sequence being [90/0/45/0/90]s.
12 International Journal of Aerospace Engineering
It can be obtained that the maximum deformation ofthe wing is 480.24mm, the maximum stress of the upperwing is 410.35MPa, and the maximum stress of the lowerwing is 404.44MPa.
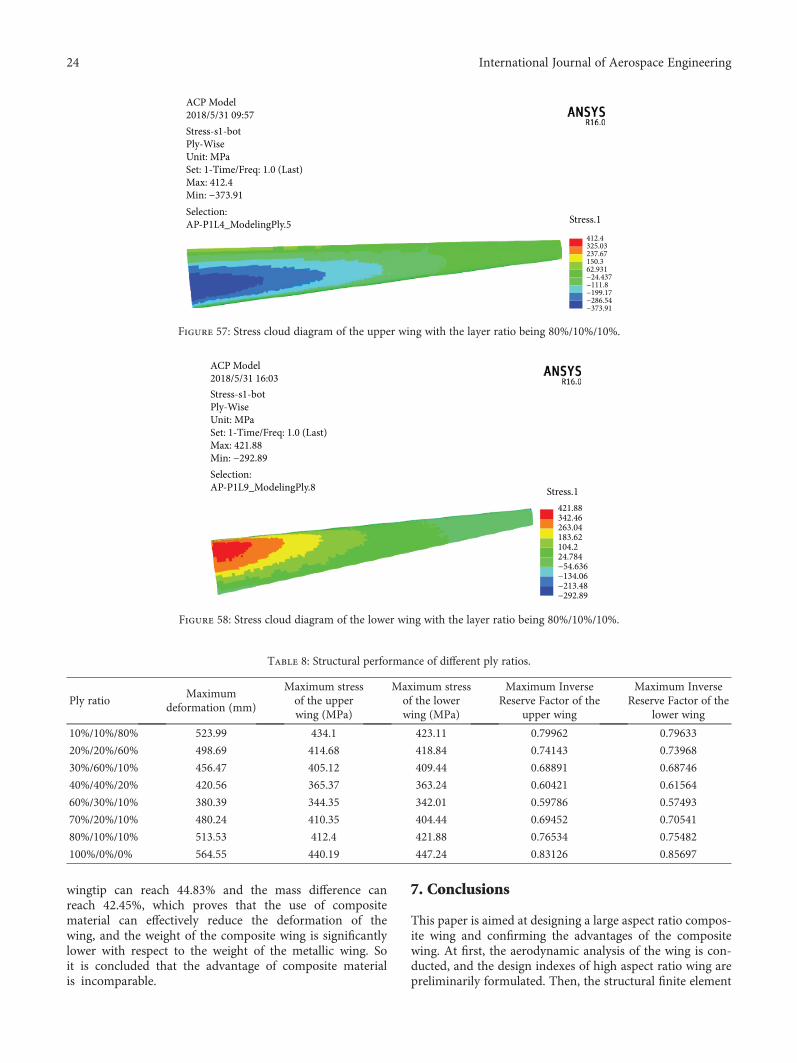
When the layer ratio is 80%/10%/10%, the deforma-tion and stress cloud diagrams are obtained asFigures 56–58.
It can be obtained that the maximum deformation of thewing is 513.53mm, the maximum stress of the upper wing is412.4MPa, and the maximum stress of the lower wing is421.88MPa.
The obtained results are organized into Table 8.
By comparing the results in Table 8, the following con-clusions can be drawn:
(1) The deformation of the wing decreases with theincrease of the ratio of ±45 angle ply, but it is notthe more the better. When the ratio exceeds a certainvalue, the structural strength will decrease gradually
(2) For the skin, when the ratio of the three angles is60%/30%/10%, the performance of the structure isthe best. The maximum upward displacement ofthe wingtip is 0.38039m, the maximum stress ofthe upper skin layer is 344.35MPa, and the maxi-mum stress of the lower skin layer is 342.01MPa
Table 6: Structural performance under different layup sequences.
Layer sequencesMaximumdeformation
(mm)
Maximum stressof the upperwing (MPa)
Maximum stressof the lowerwing (MPa)
Maximum InverseReserve Factor of the
upper wing
Maximum InverseReserve Factor of the
lower wing
[45/90/0/90/-45]s 420.56 365.37 363.24 0.60421 0.61564
[45/0/90/0-45]s 427.95 366.63 367.58 0.60732 0.61087
[0/45/90/-45/0]s 461.22 401.83 400.36 0.73685 0.73578
[0/90/45/90/0]s 475.49 405.12 409.02 0.75397 0.75749
[90/45/0/-45/90]s 446.93 385.41 388.24 0.69798 0.67403
[90/0/45/0/90]s 451.71 393.48 398 0.68828 0.69693
564.55Deformation.1
501.82439.09376.37313.64250.91188.18125.4662.7280
ACP Model2018/5/27 08:32Deformation-usumElement-WiseUnit: mmSet: 1-Time/Freq: 1.0 (Last)Max: 564.55Min: 0
Figure 26: Deformation cloud diagram with the layer angle being ±45 alone.
440.19
Stress.1
347.02253.85160.6867.514−25.654−118.82−211.99−305.16−398.33
ACP Model2018/5/31 09:43Stress-s1-botPly-WiseUnit: MPaSet: 1-Time/Freq: 1.0 (Last)Max: 440.19Min: −398.33Selection:AP-P1L9_ModelingPly.4
Figure 27: Stress cloud diagram of the upper wing with the layer angle being ±45 alone.
13International Journal of Aerospace Engineering
447.24Stress.1
326.00210.0891.495−27.085−145.66−264.24−382.82−501.4−619.98
ACP Model2018/5/31 09:48Stress-s1-botPly-WiseUnit: MPaSet: 1-Time/Freq: 1.0 (Last)Max: 447.24Min: −619.98Selection:AP-P1L4_ModelingPly.8
Figure 28: Stress cloud diagram of the lower wing with the layer angle being ±45 alone.
493.56Deformation.1
438.72383.88329.04274.2219.36104.52109.6854.8390
ACP Model2018/5/27 10:42Deformation-usumElement-WiseUnit: mmSet: 1-Time/Freq: 1.0 (Last)Max: 493.56Min: 0
Figure 29: Deformation cloud diagram with the layer angle being 45 and 0.
449.53Stress.1
352.52255.5158.4861.468−35.549−132.57−229.58−326.6−423.61
ACP Model2018/5/31 08:42Stress-s1-botPly-WiseUnit: MPaSet: 1-Time/Freq: 1.0 (Last)Max: 449.53Min: −423.61Selection:AP-P1L4_ModelingPly.3
Figure 30: Stress cloud diagram of the upper wing with the layer angle being 45 and 0.
14 International Journal of Aerospace Engineering

434.73Stress.1
352.01269.29186.56103.8421.119−61.604−144.33−227.05−309.77
ACP Model2018/5/31 09:47Stress-s1-botPly-WiseUnit: MPaSet: 1-Time/Freq: 1.0 (Last)Max: 434.73Min: −309.77Selection:AP-P1L4_ModelingPly.7
Figure 31: Stress cloud diagram of the lower wing with the layer angle being 45 and 0.
456.47Deformation.1
405.75355.03304.31253.59202.87152.16101.4450.7190
ACP Model2018/5/27 18:45Deformation-usumElement-WiseUnit: mmSet: 1-Time/Freq: 1.0 (Last)Max: 456.47Min: 0
Figure 32: Deformation cloud diagram with the layer angle being 90 and 0.
420.91Stress.1
330.84240.77150.6960.62−29.453−119.53−209.6−299.67−389.75
ACP Model2018/5/31 08:43Stress-s1-botPly-WiseUnit: MPaSet: 1-Time/Freq: 1.0 (Last)Max: 420.91Min: −389.75Selection:AP-P1L7_ModelingPly.3
Figure 33: Stress cloud diagram of the upper wing with the layer angle being 90 and 0.
15International Journal of Aerospace Engineering
420.5Stress.1
324.3228.11131.9235.726−60.466−156.66−252.85−349.04−445.24
ACP Model2018/5/31 10:00Stress-s1-botPly-WiseUnit: MPaSet: 1-Time/Freq: 1.0 (Last)Max: 420.5Min: −445.24Selection:AP-P1L9_ModelingPly.7
Figure 34: Stress cloud diagram of the lower wing with the layer angle being 90 and 0.
485
Deformation.1
431.11377.22323.33269.44215.55161.67107.7853.8880
ACP Model2018/5/27 09:24Deformation-usumElement-WiseUnit: mmSet: 1-Time/Freq: 1.0 (Last)Max: 485Min: 0
Figure 35: Deformation cloud diagram with the layer angle being 45 and 90.
434.27Stress.1
341.34248.41155.4862.544−30.389−123.32−216.25−309.19−402.12
ACP Model2018/5/31 08:57Stress-s1-botPly-WiseUnit: MPaSet: 1-Time/Freq: 1.0 (Last)Max: 434.27Min: −402.12Selection:AP-P1L7_ModelingPly.3
Figure 36: Stress cloud diagram of the upper wing with the layer angle being 45 and 90.
16 International Journal of Aerospace Engineering

432.86
Stress.1
333.84234.82135.836.777−62.245−161.27−260.29−359.31−458.33
ACP Model2018/5/31 10:17Stress-s1-botPly-WiseUnit: MPaSet: 1-Time/Freq: 1.0 (Last)Max: 432.86Min: −458.33Selection:AP-P1L9_ModelingPly.7
Figure 37: Stress cloud diagram of the lower wing with the layer angle being 45 and 90.
470.46Deformation.1
418.18365.91313.64261.37209.09156.82104.5552.2730
ACP Model2018/5/27 08:50Deformation-usumElement-WiseUnit: mmSet: 1-Time/Freq: 1.0 (Last)Max: 470.46Min: 0
Figure 38: Deformation cloud diagram with the layer angle being ±45 and 90.
420.91
Stress.1
330.84240.77150.6960.62−29.453−119.53−209.6−299.67−389.75
ACP Model2018/5/31 08:43Stress-s1-botPly-WiseUnit: MPaSet: 1-Time/Freq: 1.0 (Last)Max: 420.91Min: −389.75Selection:AP-P1L7_ModelingPly.3
Figure 39: Stress cloud diagram of the upper wing with the layer angle being ±45 and 90.
17International Journal of Aerospace Engineering
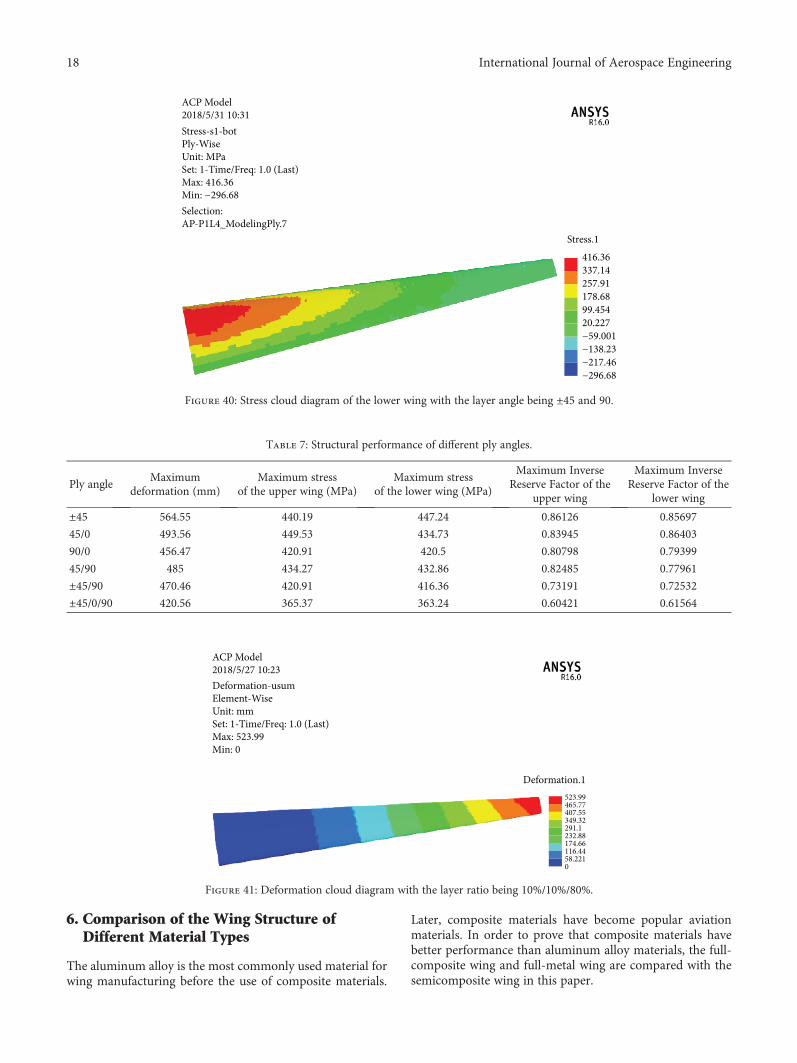
6. Comparison of the Wing Structure ofDifferent Material Types
The aluminum alloy is the most commonly used material forwing manufacturing before the use of composite materials.
Later, composite materials have become popular aviationmaterials. In order to prove that composite materials havebetter performance than aluminum alloy materials, the full-composite wing and full-metal wing are compared with thesemicomposite wing in this paper.
416.36Stress.1
337.14257.91178.6899.45420.227−59.001−138.23−217.46−296.68
ACP Model2018/5/31 10:31Stress-s1-botPly-WiseUnit: MPaSet: 1-Time/Freq: 1.0 (Last)Max: 416.36Min: −296.68Selection:AP-P1L4_ModelingPly.7
Figure 40: Stress cloud diagram of the lower wing with the layer angle being ±45 and 90.
Table 7: Structural performance of different ply angles.
Ply angleMaximum
deformation (mm)Maximum stress
of the upper wing (MPa)Maximum stress
of the lower wing (MPa)
Maximum InverseReserve Factor of the
upper wing
Maximum InverseReserve Factor of the
lower wing
±45 564.55 440.19 447.24 0.86126 0.85697
45/0 493.56 449.53 434.73 0.83945 0.86403
90/0 456.47 420.91 420.5 0.80798 0.79399
45/90 485 434.27 432.86 0.82485 0.77961
±45/90 470.46 420.91 416.36 0.73191 0.72532
±45/0/90 420.56 365.37 363.24 0.60421 0.61564
523.99
Deformation.1
465.77407.55349.32291.1232.88174.66116.4458.2210
ACP Model2018/5/27 10:23Deformation-usumElement-WiseUnit: mmSet: 1-Time/Freq: 1.0 (Last)Max: 523.99Min: 0
Figure 41: Deformation cloud diagram with the layer ratio being 10%/10%/80%.
18 International Journal of Aerospace Engineering

434.1Stress.1
342.14250.17158.2166.243−25.723−117.69−209.65−301.62−393.58
ACP Model2018/5/31 16:29Stress-s1-botPly-WiseUnit: MPaSet: 1 - Time/Freq: 1.0 (Last)Max: 434.1Min: −393.58Selection:AP-P1L4_Modeling Ply.5
Figure 42: Stress cloud diagram of the upper wing with the layer ratio being 10%/10%/80%.
423.11
Stress.1
316.72210.33103.95−2.4381−108.82−215.21−321.6−427.98−534.37
ACP Model2018/5/31 10:32Stress-s1-botPly-WiseUnit: MPaSet: 1-Time/Freq: 1.0 (Last)Max: 423.11Min: −534.37Selection:AP-P1L2_ModelingPly.8
Figure 43: Stress cloud diagram of the lower wing with the layer ratio being 10%/10%/80%.
498.69
Deformation.1
443.28387.87332.46277.05221.64166.23110.8255.4090
ACP Model2018/5/27 07:41Deformation-usumElement-WiseUnit: mmSet: 1-Time/Freq: 1.0 (Last)Max: 498.69Min: 0
Figure 44: Deformation cloud diagram with the layer ratio being 20%/20%/60%.
19International Journal of Aerospace Engineering

414.68Stress.1
327.04239.4151.7604.118−23.522−111.16−198.8−286.44−374.08
ACP Model2018/5/31 09:18Stress-s1-botPly-WiseUnit: MPaSet: 1-Time/Freq: 1.0 (Last)Max: 414.68Min: −374.08Selection:AP-P1L2_ModelingPly.4
Figure 45: Stress cloud diagram of the upper wing with the layer ratio being 20%/20%/60%.
418.84Stress.1
329.44240.03150.6261.217−28.189−117.6−207−296.41−385.81
ACP Model2018/5/31 10:32Stress-s1-botPly-WiseUnit: MPaSet: 1-Time/Freq: 1.0 (Last)Max: 418.84Min: −385.81Selection:AP-P1L7_ModelingPly.7
Figure 46: Stress cloud diagram of the lower wing with the layer ratio being 20%/20%/60%.
456.47Deformation.1
405.75355.03304.31253.59202.87152.16101.4450.7190
ACP Model2018/5/31 14:59Deformation-usumElement-WiseUnit: mmSet: 1-Time/Freq: 1.0 (Last)Max: 456.47Min: 0
Figure 47: Deformation cloud diagram with the layer ratio being 30%/60%/10%.
20 International Journal of Aerospace Engineering

6.1. Full-Metal Wing Structure. The static analysis of the full-metallic wing structure is carried out under the same loadingcondition, and the deformation and stress cloud diagrams areobtained as Figures 59 and 60.
6.2. Full-Composite Wing Structure. For the composite wingstructure designed in this paper, due to the characteristicsof the beam structure, the front and back beams are not thecomposite structure. In this section, the front and back beams
405.12
Stress.1
316.43227.73139.0350.338−38.357−127.05−215.75−304.44−393.14
ACP Model2018/5/31 16:28Stress-s1-botPly-WiseUnit: MPaSet: 1-Time/Freq: 1.0 (Last)Max: 405.12Min: −393.14Selection:AP-P1L7_ModelingPly.5
Figure 48: Stress cloud diagram of the upper wing with the layer ratio being 30%/60%/10%.
409.44Stress.1
300.88192.3283.763−24.796−133.35−241.91−350.47−459.03−567.59
ACP Model2018/5/31 10:25Stress-s1-botPly-WiseUnit: MPaSet: 1-Time/Freq: 1.0 (Last)Max: 409.44Min: −567.59Selection:AP-P1L4_ModelingPly.8
Figure 49: Stress cloud diagram of the lower wing with the layer ratio being 30%/60%/10%.
380.39Deformation.1
338.12295.86253.59211.33169.06126.884.53142.2650
ACP Model2018/5/31 15:30Deformation-usumElement-WiseUnit: mmSet: 1-Time/Freq: 1.0 (Last)Max: 380.39Min: 0
Figure 50: Deformation cloud diagram with the layer ratio being 60%/30%/10%.
21International Journal of Aerospace Engineering
344.35
Stress.1
268.96193.57118.1842.787−32.604−108−183.39−258.78−334.17
ACP Model2018/5/31 09:34Stress-s1-botPly-WiseUnit: MPaSet: 1-Time/Freq: 1.0 (Last)Max: 344.35Min: −334.17Selection:AP-P1L7_ModelingPly.5
Figure 51: Stress cloud diagram of the upper wing with the layer ratio being 60%/30%/10%.
342.01Stress.1
285.6229.2172.8116.3959.9913.5876−52.815−109.22−165.62
ACP Model2018/5/31 15:05Stress-s1-botPly-WiseUnit: MPaSet: 1-Time/Freq: 1.0 (Last)Max: 342.01Min: −165.62Selection:AP-P1L2_ModelingPly.13
Figure 52: Stress cloud diagram of the lower wing with the layer ratio being 60%/30%/10%.
480.24Deformation.1
426.88373.52320.16266.8213.44160.08106.7253.360
ACP Model2018/5/31 14:51Deformation-usumElement-WiseUnit: mmSet: 1-Time/Freq: 1.0 (Last)Max: 480.24Min: 0
Figure 53: Deformation cloud diagram with the layer ratio being 70%/20%/10%.
22 International Journal of Aerospace Engineering

are separately layered as well, and the web adopts the 45°
layup to bear the shearing force. The layup of each layer ofthe upper and lower flanges is [45/90/0/90/-45] symmetri-cally, and the static analysis of the full-composite wing is car-ried out. The deformation and stress cloud diagrams areobtained as Figures 61–63.
The obtained results of these materials are organizedinto Table 9.
It can be seen from the data in Table 9 that themechanical properties of the composite structure are obvi-ously superior to those of the metal structure. Under thesame load, the maximum deformation difference of the
410.35
Stress.1
324.56238.77152.9867.187−18.604−104.39−190.19−275.98−361.77
ACP Model2018/5/31 09:43Stress-s1-botPly-WiseUnit: MPaSet: 1-Time/Freq: 1.0 (Last)Max: 410.35Min: −361.77Selection:AP-P1L2_ModelingPly.5
Figure 54: Stress cloud diagram of the upper wing with the layer ratio being 70%/20%/10%.
404.44Stress.1
302.75201.0599.362−2.3305−104.02−205.72−307.41−409.1−510.79
ACP Model2018/5/31 10:25Stress-s1-botPly-WiseUnit: MPaSet: 1-Time/Freq: 1.0 (Last)Max: 404.44Min: −510.79Selection:AP-P1L2_ModelingPly.8
Figure 55: Stress cloud diagram of the lower wing with the layer ratio being 70%/20%/10%.
513.53
Deformation.1
456.47399.41342.35285.29228.23171.18114.1257.0580
ACP Model2018/5/31 15:53Deformation-usumElement-WiseUnit: mmSet: 1-Time/Freq: 1.0 (Last)Max: 513.53Min: 0
Figure 56: Deformation cloud diagram with the layer ratio being 80%/10%/10%.
23International Journal of Aerospace Engineering
wingtip can reach 44.83% and the mass difference canreach 42.45%, which proves that the use of compositematerial can effectively reduce the deformation of thewing, and the weight of the composite wing is significantlylower with respect to the weight of the metallic wing. Soit is concluded that the advantage of composite materialis incomparable.
7. Conclusions
This paper is aimed at designing a large aspect ratio compos-ite wing and confirming the advantages of the compositewing. At first, the aerodynamic analysis of the wing is con-ducted, and the design indexes of high aspect ratio wing arepreliminarily formulated. Then, the structural finite element
412.4
Stress.1
325.03237.67150.362.931−24.437−111.8−199.17−286.54−373.91
ACP Model2018/5/31 09:57Stress-s1-botPly-WiseUnit: MPaSet: 1-Time/Freq: 1.0 (Last)Max: 412.4Min: −373.91Selection:AP-P1L4_ModelingPly.5
Figure 57: Stress cloud diagram of the upper wing with the layer ratio being 80%/10%/10%.
421.88
Stress.1
342.46263.04183.62104.224.784−54.636−134.06−213.48−292.89
ACP Model2018/5/31 16:03Stress-s1-botPly-WiseUnit: MPaSet: 1-Time/Freq: 1.0 (Last)Max: 421.88Min: −292.89Selection:AP-P1L9_ModelingPly.8
Figure 58: Stress cloud diagram of the lower wing with the layer ratio being 80%/10%/10%.
Table 8: Structural performance of different ply ratios.
Ply ratioMaximum
deformation (mm)
Maximum stressof the upperwing (MPa)
Maximum stressof the lowerwing (MPa)
Maximum InverseReserve Factor of the
upper wing
Maximum InverseReserve Factor of the
lower wing
10%/10%/80% 523.99 434.1 423.11 0.79962 0.79633
20%/20%/60% 498.69 414.68 418.84 0.74143 0.73968
30%/60%/10% 456.47 405.12 409.44 0.68891 0.68746
40%/40%/20% 420.56 365.37 363.24 0.60421 0.61564
60%/30%/10% 380.39 344.35 342.01 0.59786 0.57493
70%/20%/10% 480.24 410.35 404.44 0.69452 0.70541
80%/10%/10% 513.53 412.4 421.88 0.76534 0.75482
100%/0%/0% 564.55 440.19 447.24 0.83126 0.85697
24 International Journal of Aerospace Engineering

0.00 1500.00 3000.00 (mm)
750.00 2250.00
G: Static StructuralTotal DeformationType: Total DeformationUnit: mmTime: 12018/6/11 12:11
570.97 Max507.53444.08380.64317.2253.76190.32126.8863.4410 Min
Figure 59: Deformation cloud diagram of full-metallic wing.
0.00 1500.00 3000.00 (mm)
750.00 2250.00
G: Static StructuralEquivalent StressType: Equivalent (von-Mises) StressUnit: MPaTime: 12018/6/11 11:52
263.88 Max234.56205.24175.92146.6117.2887.96258.64329.3240.0051066 Min
Figure 60: Stress cloud diagram of full-metallic wing.
315Deformation.1
ACP Model2018/6/11 11:56Deformation-usumElement-WiseUnit: mmSet: 1-Time/Freq: 1.0 (Last)Max: 315Min: 0
28024521017514010570.00135.0010
Figure 61: Deformation cloud diagram of full-composite wing.
25International Journal of Aerospace Engineering

static analysis is carried out in the ACP module of ANSYSWorkbench by using the aerodynamic load obtained. Next,the performance of the wing structure is analyzed andcompared by changing different layering methods, and theperformance of the structure under different materials is ana-lyzed and compared as well. The whole design flow is sum-marized and the conclusions are summarized as follows:
(1) The structural properties of different thicknesses ofthe skin are compared, and the stiffness, strength,
and weight reduction effects are considered compre-hensively. Finally, 12mm is chosen as a proper thick-ness of the skin
(2) Different laying methods have different impact onthe performance of the skin, and the laying sequence,the laying angle, and the laying ratio are selected asvariables in this paper, and it is concluded that thebest laying methods of skin structure are the follow-ing three cases:
ACP Model2018/5/31 22:10Stress-s1-botPly-WiseUnit: MPaSet: 1-Time/Freq: 1.0 (Last)Max: 309.34Min: −282.66Selection:AP-P1L9_ModelingPly.3
309.34
Stress.1
243.57177.79112.0146.233−19.545−85.323−151.1−216.88−282.66
Figure 62: Stress cloud diagram of the upper wing with full composite.
ACP Model2018/6/14 11:37Stress-s1-botPly-WiseUnit: MPaSet: 1-Time/Freq: 1.0 (Last)Max: 306.12Min: −403.45Selection:AP-P1L7_ModelingPly.10
Stress.1
−403.45
−324.61
−245.77
−166.93
−88.087
−9.2464
69.594
148.43
227.27
306.12
Figure 63: Stress cloud diagram of the lower wing with full composite.
Table 9: Structural performance of different materials.
Maximum stress (MPa) Maximum deformation (mm) Mass (kg)
Full-composite wing 309.34 315 220.09
Full-metal wing 263.88 570.97 382.41
Variation 17.2% 44.83% 42.45%
26 International Journal of Aerospace Engineering

(i) The ±45 ply is located at the outermost partof the ply
(ii) The strength of the layer with three standardangles mixed is higher than that with a singlelayer
(iii) When the ratio of three angles is 60%/30%/10%,the performance of the structure is the best
(3) The mechanical properties of the composite structureare obviously superior to those of the metallic struc-ture. Under the same load, the composite structurecan reduce the maximum deformation and the struc-tural mass effectively
Data Availability
The data used to support the findings of this study areincluded within the article.
Conflicts of Interest
The authors declare there is no conflict of interest regardingthe publication of this paper.
Acknowledgments
The authors would like to express their thanks for the sup-port from the National Natural Science Foundation of China(No. 11802340).
References
[1] D. Sziroczak and H. Smith, “A review of design issues specificto hypersonic flight vehicles,” Progress in Aerospace Sciences,vol. 84, pp. 1–28, 2016.
[2] C. E. S. Cesnik, D. H. Hodges, and M. J. Patil, “Nonlinear aero-elastic analysis of aircraft with high-aspect-ratio wings,” in39th AIAA/ASME/ASCE/AHS/ASC Structures, StructuralDynamics, and Materials Conference and Exhibit, Long Beach,CA, USA, April 1998.
[3] Z. Shen and X. J. Zhang, Introduction of Structural StrengthDesign and Verification of Composite Aircraft, Shanghai Jiaotong University Press, Shanghai, 2011.
[4] L. Shi, Y. C. Deng, H. T. Gao, and W. Li, “Research onmodeling criterion and methods for flexible wing structureswith large aspect ratio,” Aircraft Design, vol. 36, no. 6,pp. 1–4, 2016.
[5] W. S. Lu, S. P. Wang, and Y. C. Ma, “Static aeroelastic optimi-zation design of composite wing with large aspect ratio basedon CFD/CSD and Kriging interpolation model,” Journal ofApplied Mechanics, vol. 32, no. 4, pp. 581–585, 2015.
[6] M. M. Shokrieh and F. T. Behrooz, “Wing instability of a fullcomposite aircraft,” Composite Structures, vol. 54, no. 2-3,pp. 335–340, 2001.
[7] S. Takeda, Y. Aoki, T. Ishikawa, N. Takeda, and H. Kikukawa,“Structural health monitoring of composite wing structureduring durability test,” Composite Structures, vol. 79, no. 1,pp. 133–139, 2007.
[8] I. C. Taig, “Principles of design of a carbon fibre composite air-craft wing,” Philosophical Transactions of the Royal Society A:Mathematical, Physical and Engineering Sciences, vol. 294,no. 1411, pp. 565–575, 1980.
[9] T. Kim, J. Lim, S. J. Shin, and D. H. Kim, “Structural designoptimization of a tiltrotor aircraft composite wing to enhancewhirl flutter stability,” Composite Structures, vol. 95, pp. 283–294, 2013.
[10] M. J. Patil, D. H. Hodges, and C. E. S. Cesnik, “Nonlinear aero-elastic analysis of complete aircraft in subsonic flow,” Journalof Aircraft, vol. 37, no. 5, pp. 753–760, 2000.
[11] J. Njuguna, “Flutter prediction, suppression and control in air-craft composite wings as a design prerequisite: a survey,”Structural Control and Health Monitoring, vol. 14, no. 5,pp. 715–758, 2007.
[12] O. Seresta, Z. Gürdal, D. B. Adams, and L. T. Watson, “Opti-mal design of composite wing structures with blended lami-nates,” Composites Part B: Engineering, vol. 38, no. 4,pp. 469–480, 2007.
[13] Y. Feng, X. T. Zheng, S. Y. Wu, and Z. D. Liu, “Optimizationdesign of layer and analysis of lightweight composite wingcladding,” Journal of Aviation, vol. 36, no. 6, pp. 1858–1866,2015.
[14] Z. D. Liu, X. T. Zheng, Y. Feng, and D. Zhang, “Design and testverification of full composite wing structure for UAV,” Journalof Composite Materials, vol. 33, no. 5, pp. 1055–1063, 2016.
[15] B. B. Ji and J. P. Chen, ANSYS ICEM CFD Grid GenerationTechnology, China Water Power Press, Beijing, 2012.
[16] N. B. Yang and W. Liang, Introduction to Airworthiness Con-formity Proof of Aircraft Composite Structures, Aviation Indus-try Press, Beijing, 2015.
[17] T. T. Zhang, W. Huang, Z. G. Wang, and L. Yan, “A study ofairfoil parameterization, modeling, and optimization basedon the computational fluid dynamics method,” Journal of Zhe-jiang University–Science A, vol. 17, no. 8, pp. 632–645, 2016.
[18] A. Y. Zhao, The layout of ribs in the wing box for Modern CivilAircraft, Science &Technology Vision, 2012.
[19] Y. S. Meng, L. Yan, W. Huang, T. T. Zhang, and Z. B. Du,“Structural design and analysis of a composite wing with highaspect ratio,” in 8th European Conference for Aeronautics andSpace Sciences (EUCASS), Madrid, Spain, 2019.
[20] W. P. Yang, Composite Structural Stress Analysis of Aircraft,Aviation Industry Press, Beijing, 2018.
27International Journal of Aerospace Engineering

International Journal of
AerospaceEngineeringHindawiwww.hindawi.com Volume 2018
RoboticsJournal of
Hindawiwww.hindawi.com Volume 2018
Hindawiwww.hindawi.com Volume 2018
Active and Passive Electronic Components
VLSI Design
Hindawiwww.hindawi.com Volume 2018
Hindawiwww.hindawi.com Volume 2018
Shock and Vibration
Hindawiwww.hindawi.com Volume 2018
Civil EngineeringAdvances in
Acoustics and VibrationAdvances in
Hindawiwww.hindawi.com Volume 2018
Hindawiwww.hindawi.com Volume 2018
Electrical and Computer Engineering
Journal of
Advances inOptoElectronics
Hindawiwww.hindawi.com
Volume 2018
Hindawi Publishing Corporation http://www.hindawi.com Volume 2013Hindawiwww.hindawi.com
The Scientific World Journal
Volume 2018
Control Scienceand Engineering
Journal of
Hindawiwww.hindawi.com Volume 2018
Hindawiwww.hindawi.com
Journal ofEngineeringVolume 2018
SensorsJournal of
Hindawiwww.hindawi.com Volume 2018
International Journal of
RotatingMachinery
Hindawiwww.hindawi.com Volume 2018
Modelling &Simulationin EngineeringHindawiwww.hindawi.com Volume 2018
Hindawiwww.hindawi.com Volume 2018
Chemical EngineeringInternational Journal of Antennas and
Propagation
International Journal of
Hindawiwww.hindawi.com Volume 2018
Hindawiwww.hindawi.com Volume 2018
Navigation and Observation
International Journal of
Hindawi
www.hindawi.com Volume 2018
Advances in
Multimedia
Submit your manuscripts atwww.hindawi.com