Embed Size (px)
Citation preview
1
Detailed simulation of dual-reflux pressure swing adsorption process 1
2
Tushar S. Bhatta, Giuseppe Stortib, Renato Rotaa,* 3
4 a Politecnico di Milano, Chemistry, Materials and Chemical Engineering Department “Giulio Natta”, Via Mancinelli 7, 20131 Milan, Italy 5 b ETH Zürich, Department of Chemistry and Applied Biosciences, Vladimir-Prelog-Weg 1-5/10, HCI F 125, 8093 Zürich, Switzerland 6
7
Highlights 8
9
• Aspen Adsim® model for simulating realistic DR-PSA process scenarios is presented.10
• 19 experimental runs reported by McIntyre et al. (2010) are simulated.11
• Model predictions are in good agreement with experimental results.12
• Effect of feed position on process performance is assessed via simulations.13
14
Abstract 15
16
A model for the detailed simulation of dual-reflux pressure swing adsorption process developed in the frame of the 17
commercial software Aspen Adsim® is presented. For validation purposes, simulations were performed and model 18
predictions were compared with published experimental results. At cyclic steady-state, model predictions were found 19
to be in good agreement with reported experimental results in terms of: (i) average ethane mole fraction in heavy 20
product, (ii) average nitrogen mole fraction in light product, (iii) instantaneous heavy product composition profiles, 21
and (iii) instantaneous column composition profiles. The predicted and experimental trends obtained by analyzing the 22
effect of various operating parameters (light reflux flowrate, duration of feed/purge step, heavy product flowrate and 23
mole fraction of heavy component in binary feed gas mixture) on process performance are also comparable. Overall, 24
this simulation technique of dual-reflux pressure swing adsorption can serve as an effective tool for process design, 25
cost reduction of laboratory and/or plant trails, and enhanced process understanding. 26
27
Keywords: Pressure swing adsorption; Dual-reflux; Mathematical modeling; Gas purification; Process simulation; 28
Cyclic adsorption process 29
30
* Corresponding author. Tel.: +39 0223993154; Fax: +39 0223993180.31
E-mail: [email protected] 32
https://doi.org/10.1016/j.ces.2014.09.013
2
1. Introduction 33
34
Since its inception more than half a century ago, the technology of pressure swing adsorption (PSA) has 35
been widely studied and applied, becoming today the method of choice for the separation and/or purification 36
of many gaseous mixtures. Some of its most popular industrial applications include hydrocarbon separation, 37
hydrogen purification, air drying, and air separation. PSA systems employed for the processing of binary 38
feed gas mixtures can be categorized into three main types: (i) stripping, (ii) rectifying and (iii) dual-reflux. 39
40
Stripping PSA systems are based on the Skarstrom cycle (Skarstrom, 1959) and are capable of producing 41
only the light product (weakly adsorbed; in the following referred to as species 𝐵𝐵) at high purity, since the 42
purity of the heavy product (strongly adsorbed; species 𝐴𝐴 ) is confined by thermodynamic constraints 43
(Subramanian and Ritter, 1997). Rectifying PSA systems, developed by Diagne et al. (1994) and Ebner and 44
Ritter (2002) and also known as enriching reflux PSA (Yoshida et al., 2003), have thermodynamic 45
constraints on the purity of the light product, thus resulting in the capability of producing only the heavy 46
product at high purities. In contrast, the purity of both the products is thermodynamically unconstrained in 47
dual-reflux pressure swing adsorption (DR-PSA; Leavitt, 1992): consequently, DR-PSA processes are 48
capable of achieving complete separation of binary feed gas mixture, thus producing two pure-component 49
streams. 50
51
A typical DR-PSA unit comprises of a combined two-bed system with feed injection in a given position 52
along the axis of the adsorption column. Such position (𝑍𝑍𝐹𝐹) divides each bed in two sections: ‘Stripping 53
Section’ (𝑆𝑆𝑆𝑆) and the ‘Rectifying Section’ (𝑅𝑅𝑆𝑆). Two reflux streams (so the name DR-PSA), light reflux 54
(𝐿𝐿𝑅𝑅, pure 𝐵𝐵), and heavy reflux (𝐻𝐻𝑅𝑅, pure 𝐴𝐴), are respectively injected at the 𝑆𝑆𝑆𝑆 and 𝑅𝑅𝑆𝑆 end of each column 55
during constant pressure steps. Depending on the column operating pressure (high pressure, 𝑃𝑃𝐻𝐻 , or low 56
pressure, 𝑃𝑃𝐿𝐿 ) to which the binary feed gas mixture is supplied and the type of gas (𝐴𝐴 or 𝐵𝐵) with which the 57
pressure swing is carried out, four different cycle configurations can be identified (Kearns and Webley, 58
2006): 59
(i) DR-PL-A: Feed to 𝑃𝑃𝐿𝐿 and pressure swing with 𝐴𝐴; 60
https://doi.org/10.1016/j.ces.2014.09.013
3
(ii) DR-PL-B: Feed to 𝑃𝑃𝐿𝐿 and pressure swing with 𝐵𝐵; 61
(iii) DR-PH-A: Feed to 𝑃𝑃𝐻𝐻 and pressure swing with 𝐴𝐴; 62
(iv) DR-PH-B: Feed to 𝑃𝑃𝐻𝐻 and pressure swing with 𝐵𝐵. 63
64
Gas separation processes based on DR-PSA have been studied experimentally in the literature. Diagne et al. 65
(1994, 1995a, 1995b) explored the application of this process to the 𝐶𝐶𝑂𝑂2 removal from air using zeolite 13X 66
as adsorbent. In these studies they demonstrated that feed gas containing 20% 𝐶𝐶𝑂𝑂2 can be concentrated to 67
values higher than 94% in the heavy product stream by proper selection of the operating conditions. More 68
recently, McIntyre et al. (2010) conducted experiments using wood-based activated carbons in DR-PL-A 69
configuration for the recovery and enrichment of dilute ethane from nitrogen. In this extensive study, they 70
performed 19 runs for 1,500 to 3,000 cycles each and analyzed the effect of various operating parameters on 71
process performance: light reflux flowrate, duration of feed/purge step, heavy product flowrate and feed 72
mole fraction of the heavy component. It was demonstrated that the average of these 19 runs with an ethane 73
feed concentration of 1.38 vol % gave an ethane enrichment of 45.8 times (63.2 vol %) and ethane recovery 74
of 84%, while producing 𝑁𝑁2 at high purity (99.8 vol %) and recovery (>99%). These experimental studies 75
proved that both the light and heavy products can be obtained at high purities using DR-PSA systems. 76
77
Various modeling tools ranging from very simple to complex have been reported in the literature for the 78
design and optimization of PSA units (cf. Ruthven et al., 1994; Spoorthi et al., 2011; Thakur et al., 2011; 79
Sivakumar and Rao, 2011a, 2011b, 2012). The simplest modeling approach (usually indicated as 80
Equilibrium Theory) involves a large set of simplifying assumptions, such as instantaneous linear 81
equilibrium throughout the column, isothermal conditions, negligible mass transport resistances and axial 82
mixing, negligible pressure drop, and ideal gas behavior. The resulting equations have been solved by the 83
method of characteristics (Rhee et al., 1986) and its solution for conventional PSA systems was fully 84
detailed by Knaebel and Hill (1985). Equilibrium Theory was applied to DR-PSA systems by Ebner and 85
Ritter (2004), Kearns and Webley (2006) and most recently by Bhatt et al. (2013). At the opposite extreme, 86
the detailed PSA modeling approach requires much less assumptions, thus considering nonlinear adsorption 87
equilibrium along with transport limitations, pressure drop and temperature effects. Yang and Doong (1985) 88
https://doi.org/10.1016/j.ces.2014.09.013
4
were among the earliest to propose such a detailed modeling approach for conventional PSA systems and a 89
similar approach has been used for DR-PSA by Diagne et al. (1996) and Thakur et al. (2011). Various 90
configurations and/or process steps encountered in a PSA cycle need to be modeled via partial differential 91
equations (PDEs) linked by the equation of state and the thermodynamic properties of the gas and adsorbed 92
phases. Given the inherent complexity and iterative nature of PSA systems, the numerical solution of 93
detailed models is computationally demanding and time consuming. 94
95
In this work, we present a detailed model for the simulation of DR-PL-A processes developed in the frame 96
of the commercial software Aspen Adsim®. To validate the resulting model, all the 19 experimental runs 97
reported by McIntyre et al. (2010) and considering the separation of the binary mixture nitrogen-ethane have 98
been simulated. At cyclic steady-state, model predictions are compared with reported experimental results in 99
terms of: (i) average ethane mole fraction in heavy product, (ii) average nitrogen mole fraction in light 100
product, (iii) instantaneous heavy product composition profiles, and (iii) instantaneous column composition 101
profiles. Simulation results and reported experimental trends obtained by analyzing the effect of various 102
operating parameters (light reflux flowrate, duration of feed/purge step, heavy product flowrate and mole 103
fraction of heavy component in binary feed gas mixture) on process performance are compared. For 104
enhanced understanding of the process behavior, column composition profiles at the end of each process 105
cycle step are also provided for every run at 𝐶𝐶𝑆𝑆𝑆𝑆. Finally, since the feed position was fixed in all the 106
previous model calculations, additional simulations were performed to assess the effect of changing such 107
position on process performance. 108
109
2. DR-PL-A cycle description 110
111
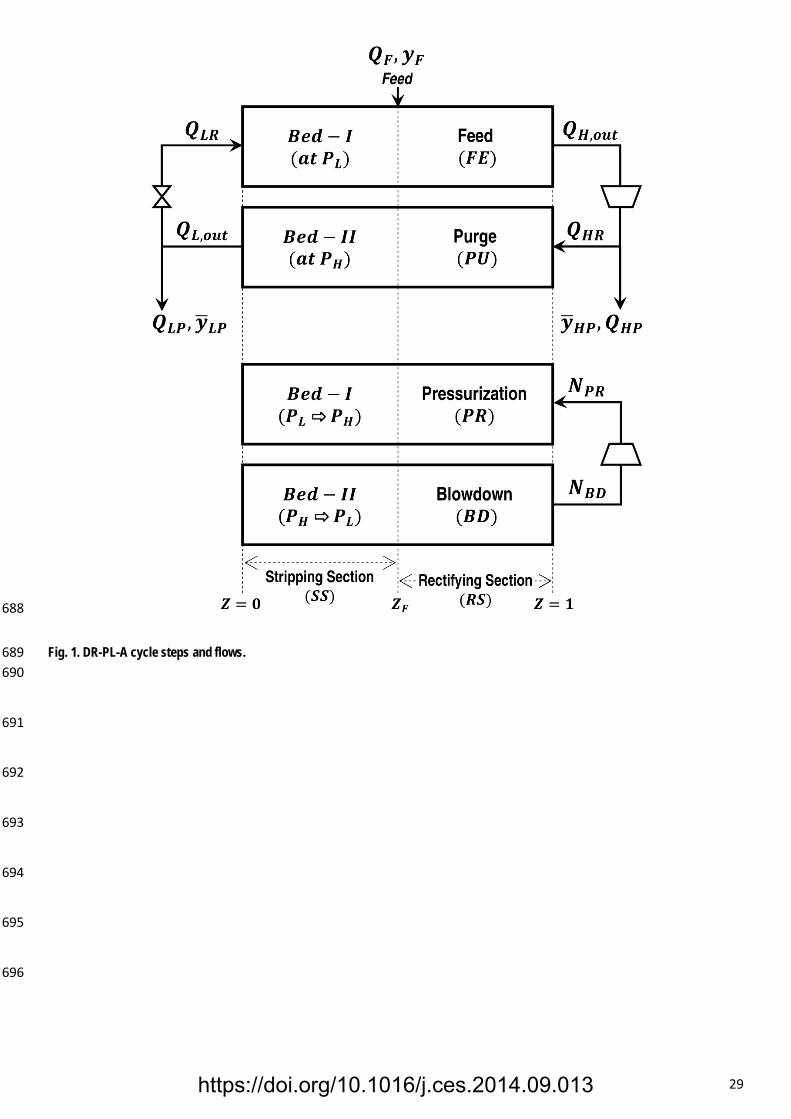
The schematic diagram of the twin-bed DR-PL-A system under consideration in this work is depicted in Fig. 112
1. In this particular configuration, each of the two adsorption beds (𝐵𝐵𝐵𝐵𝐵𝐵 − 𝐼𝐼 and 𝐵𝐵𝐵𝐵𝐵𝐵 − 𝐼𝐼𝐼𝐼) undergoes a four 113
step cyclic process: two steps are simultaneously executed at constant pressure and remaining two at non-114
constant pressure in both the beds. Note that only half-cycle is depicted in the figure, since the same steps 115
occur with the column numbers transposed. The feed injection position along the bed, defined in terms of 116
https://doi.org/10.1016/j.ces.2014.09.013
5
normalized axial coordinate (𝑍𝑍𝐹𝐹), divides each column into two sections; it is a dimensionless value, 𝑍𝑍 117
being the axial coordinate normalized with respect to the column length (𝑍𝑍 = 𝑧𝑧/𝐿𝐿𝑏𝑏𝑏𝑏𝑏𝑏). The section to the 118
left of the feed injection position (𝑍𝑍 < 𝑍𝑍𝐹𝐹) is termed as ‘Stripping Section’ or 𝑆𝑆𝑆𝑆 (material enriched in 𝐵𝐵 is 119
either injected-in or pushed-out of the end of this section, 𝑍𝑍 = 0) and the section to the right of the feed 120
injection position (𝑍𝑍 > 𝑍𝑍𝐹𝐹) is termed as ‘Rectifying Section’ or 𝑅𝑅𝑆𝑆 (material enriched in 𝐴𝐴 is either injected-121
in or pushed-out of the end of this section, 𝑍𝑍 = 1). 122
123
Binary feed gas mixture with flowrate 𝑄𝑄𝐹𝐹 and composition 𝑦𝑦𝐹𝐹 (mole fraction of 𝐴𝐴 in feed gas mixture) is 124
supplied to 𝐵𝐵𝐵𝐵𝐵𝐵 − 𝐼𝐼 which is maintained at constant pressure equal to 𝑃𝑃𝐿𝐿 during the feed step (𝐹𝐹𝐹𝐹) ; 125
simultaneously, 𝐵𝐵𝐵𝐵𝐵𝐵 − 𝐼𝐼𝐼𝐼 undergoes purge step (𝑃𝑃𝑃𝑃) while being maintained at constant 𝑃𝑃𝐻𝐻 . Material 126
enriched in 𝐴𝐴 is pushed out of the 𝐵𝐵𝐵𝐵𝐵𝐵 − 𝐼𝐼 undergoing 𝐹𝐹𝐹𝐹 at flowrate 𝑄𝑄𝐻𝐻,𝑜𝑜𝑜𝑜𝑜𝑜. It is compressed and portion 127
of 𝑄𝑄𝐻𝐻,𝑜𝑜𝑜𝑜𝑜𝑜 is taken out of the system as Heavy Product (𝐻𝐻𝑃𝑃) with flowrate 𝑄𝑄𝐻𝐻𝐻𝐻 and the remaining portion is 128
supplied as Heavy Reflux (𝐻𝐻𝑅𝑅) to 𝐵𝐵𝐵𝐵𝐵𝐵 − 𝐼𝐼𝐼𝐼 undergoing 𝑃𝑃𝑃𝑃 at flowrate 𝑄𝑄𝐻𝐻𝐻𝐻 . Material enriched in 𝐵𝐵 exits 129
from 𝐵𝐵𝐵𝐵𝐵𝐵 − 𝐼𝐼𝐼𝐼 at flowrate 𝑄𝑄𝐿𝐿,𝑜𝑜𝑜𝑜𝑜𝑜, a portion of which is taken out of the system as Light Product (𝐿𝐿𝑃𝑃) at 130
flowrate 𝑄𝑄𝐿𝐿𝐻𝐻 and the remaining quantity is supplied as Light Reflux (𝐿𝐿𝑅𝑅) at flowrate 𝑄𝑄𝐿𝐿𝐻𝐻 to 𝐵𝐵𝐵𝐵𝐵𝐵 − 𝐼𝐼. The 131
average mole fractions of 𝐴𝐴 in light and heavy product are termed as 𝑦𝑦�𝐿𝐿𝐻𝐻 and 𝑦𝑦�𝐻𝐻𝐻𝐻 respectively. At the end of 132
the simultaneous 𝐹𝐹𝐹𝐹/𝑃𝑃𝑃𝑃, the bed pressures need to be interchanged. This is accomplished by transferring 133
gas enriched in 𝐴𝐴 from the rectifying end (𝑍𝑍 = 1) of 𝐵𝐵𝐵𝐵𝐵𝐵 − 𝐼𝐼𝐼𝐼 (after compression) to the 𝑍𝑍 = 1 end of 134
𝐵𝐵𝐵𝐵𝐵𝐵 − 𝐼𝐼. Hence 𝐵𝐵𝐵𝐵𝐵𝐵 − 𝐼𝐼𝐼𝐼 undergoes blowdown step (𝐵𝐵𝐵𝐵) during which its pressure decreases from 𝑃𝑃𝐻𝐻 to 135
𝑃𝑃𝐿𝐿 and simultaneously 𝐵𝐵𝐵𝐵𝐵𝐵 − 𝐼𝐼 undergoes pressurization step (𝑃𝑃𝑅𝑅) during which its pressure increases from 136
𝑃𝑃𝐿𝐿 to 𝑃𝑃𝐻𝐻. The total amounts (in kmol) of gas extracted from 𝐵𝐵𝐵𝐵𝐵𝐵 − 𝐼𝐼𝐼𝐼 and transferred to 𝐵𝐵𝐵𝐵𝐵𝐵 − 𝐼𝐼 during 137
these steps are indicated as 𝑁𝑁𝐵𝐵𝐵𝐵 and 𝑁𝑁𝐻𝐻𝐻𝐻, respectively. 138
139
3. Model description and solution approach 140
141
As anticipated, the model aimed to the detailed simulation of the four-step DR-PL-A process described in 142
section 2 was developed in the frame of the commercial software Aspen Adsim®. The process cycle is 143
https://doi.org/10.1016/j.ces.2014.09.013
6
simulated by applying the so-called ‘Single Bed Approach’, thus following the behavior of one single 144
column out of the two beds working in parallel during the actual process. In order to reduce the 145
computational effort while ensuring reliable simulation results, the following assumptions are considered in 146
this work: 147
1. isothermal operation; 148
2. ideal gas behavior; 149
3. ideal plug-flow behavior without axial mixing; 150
4. lumped mass transport rates (constant mass transfer coefficient times a driving force in terms of 151
concentrations in adsorbed phase); 152
5. non-linear adsorption isotherms expressed as a function of partial pressures through the ‘Extended 153
Langmuir’ model; 154
6. pressure drop estimated via Ergun equation. 155
The model constitutive equations are fully detailed in Aspen Adsim® help menu; accordingly, they are 156
omitted here, with the exception of some selected terms which are summarized below (the meanings of all 157
variables and symbols used in this paper are provided in the final section Notations). 158
159
Ideal gas behavior: 160
𝑃𝑃𝑦𝑦𝑖𝑖 = 𝑅𝑅𝑅𝑅𝑐𝑐𝑖𝑖 (1) 161
where, 𝑃𝑃 is the total pressure, 𝑦𝑦𝑖𝑖 is the bulk gas-phase mole fraction of component 𝑖𝑖, 𝑅𝑅 is the universal gas 162
constant, 𝑅𝑅 is the system temperature and 𝑐𝑐𝑖𝑖 is the bulk gas-phase concentration of component 𝑖𝑖. 163
164
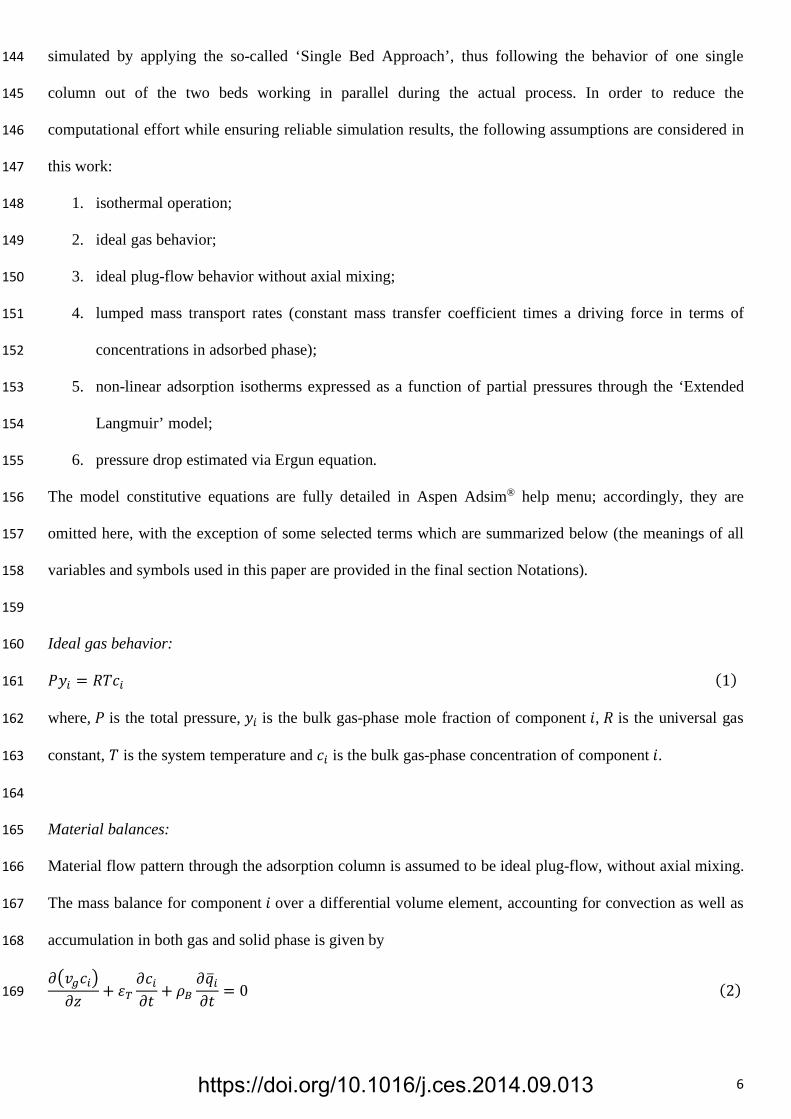
Material balances: 165
Material flow pattern through the adsorption column is assumed to be ideal plug-flow, without axial mixing. 166
The mass balance for component 𝑖𝑖 over a differential volume element, accounting for convection as well as 167
accumulation in both gas and solid phase is given by 168
𝜕𝜕�𝑣𝑣𝑔𝑔𝑐𝑐𝑖𝑖�𝜕𝜕𝑧𝑧 + 𝜀𝜀𝑇𝑇
𝜕𝜕𝑐𝑐𝑖𝑖𝜕𝜕𝜕𝜕 + 𝜌𝜌𝐵𝐵
𝜕𝜕𝑞𝑞�𝑖𝑖𝜕𝜕𝜕𝜕 = 0 (2) 169
https://doi.org/10.1016/j.ces.2014.09.013
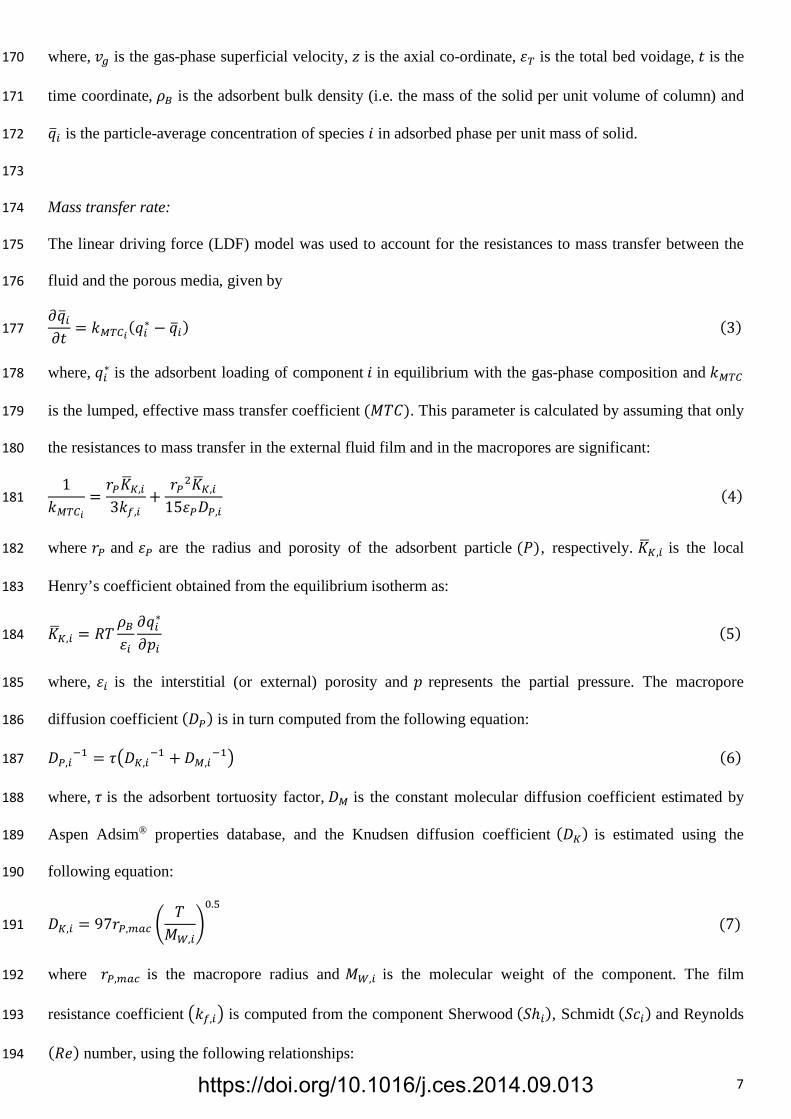
7
where, 𝑣𝑣𝑔𝑔 is the gas-phase superficial velocity, 𝑧𝑧 is the axial co-ordinate, 𝜀𝜀𝑇𝑇 is the total bed voidage, 𝜕𝜕 is the 170
time coordinate, 𝜌𝜌𝐵𝐵 is the adsorbent bulk density (i.e. the mass of the solid per unit volume of column) and 171
𝑞𝑞�𝑖𝑖 is the particle-average concentration of species 𝑖𝑖 in adsorbed phase per unit mass of solid. 172
173
Mass transfer rate: 174
The linear driving force (LDF) model was used to account for the resistances to mass transfer between the 175
fluid and the porous media, given by 176
𝜕𝜕𝑞𝑞�𝑖𝑖𝜕𝜕𝜕𝜕 = 𝑘𝑘𝑀𝑀𝑇𝑇𝑀𝑀𝑖𝑖(𝑞𝑞𝑖𝑖
∗ − 𝑞𝑞�𝑖𝑖) (3) 177
where, 𝑞𝑞𝑖𝑖∗ is the adsorbent loading of component 𝑖𝑖 in equilibrium with the gas-phase composition and 𝑘𝑘𝑀𝑀𝑇𝑇𝑀𝑀 178
is the lumped, effective mass transfer coefficient (𝑀𝑀𝑅𝑅𝐶𝐶). This parameter is calculated by assuming that only 179
the resistances to mass transfer in the external fluid film and in the macropores are significant: 180
1𝑘𝑘𝑀𝑀𝑇𝑇𝑀𝑀𝑖𝑖
=𝑟𝑟𝐻𝐻𝐾𝐾�𝐾𝐾,𝑖𝑖
3𝑘𝑘𝑓𝑓,𝑖𝑖+
𝑟𝑟𝐻𝐻2𝐾𝐾�𝐾𝐾,𝑖𝑖
15𝜀𝜀𝐻𝐻𝐵𝐵𝐻𝐻,𝑖𝑖 (4) 181
where 𝑟𝑟𝐻𝐻 and 𝜀𝜀𝐻𝐻 are the radius and porosity of the adsorbent particle (𝑃𝑃), respectively. 𝐾𝐾�𝐾𝐾,𝑖𝑖 is the local 182
Henry’s coefficient obtained from the equilibrium isotherm as: 183
𝐾𝐾�𝐾𝐾,𝑖𝑖 = 𝑅𝑅𝑅𝑅𝜌𝜌𝐵𝐵𝜀𝜀𝑖𝑖𝜕𝜕𝑞𝑞𝑖𝑖∗
𝜕𝜕𝑝𝑝𝑖𝑖 (5) 184
where, 𝜀𝜀𝑖𝑖 is the interstitial (or external) porosity and 𝑝𝑝 represents the partial pressure. The macropore 185
diffusion coefficient (𝐵𝐵𝐻𝐻) is in turn computed from the following equation: 186
𝐵𝐵𝐻𝐻,𝑖𝑖−1 = 𝜏𝜏�𝐵𝐵𝐾𝐾,𝑖𝑖
−1 + 𝐵𝐵𝑀𝑀,𝑖𝑖−1� (6) 187
where, 𝜏𝜏 is the adsorbent tortuosity factor, 𝐵𝐵𝑀𝑀 is the constant molecular diffusion coefficient estimated by 188
Aspen Adsim® properties database, and the Knudsen diffusion coefficient (𝐵𝐵𝐾𝐾) is estimated using the 189
following equation: 190
𝐵𝐵𝐾𝐾,𝑖𝑖 = 97𝑟𝑟𝐻𝐻,𝑚𝑚𝑚𝑚𝑚𝑚 �𝑅𝑅
𝑀𝑀𝑊𝑊,𝑖𝑖�0.5
(7) 191
where 𝑟𝑟𝐻𝐻,𝑚𝑚𝑚𝑚𝑚𝑚 is the macropore radius and 𝑀𝑀𝑊𝑊,𝑖𝑖 is the molecular weight of the component. The film 192
resistance coefficient �𝑘𝑘𝑓𝑓,𝑖𝑖� is computed from the component Sherwood (𝑆𝑆ℎ𝑖𝑖), Schmidt (𝑆𝑆𝑐𝑐𝑖𝑖) and Reynolds 193
(𝑅𝑅𝐵𝐵) number, using the following relationships: 194
https://doi.org/10.1016/j.ces.2014.09.013
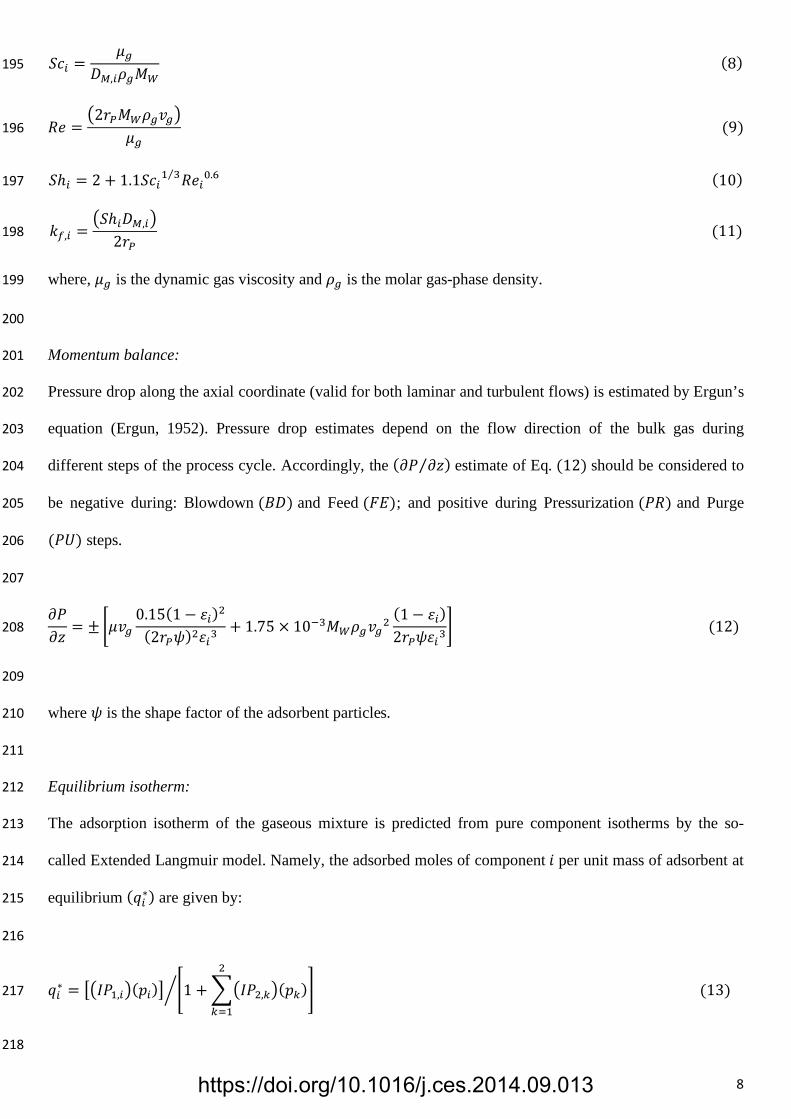
8
𝑆𝑆𝑐𝑐𝑖𝑖 =𝜇𝜇𝑔𝑔
𝐵𝐵𝑀𝑀,𝑖𝑖𝜌𝜌𝑔𝑔𝑀𝑀𝑊𝑊 (8) 195
𝑅𝑅𝐵𝐵 =�2𝑟𝑟𝐻𝐻𝑀𝑀𝑊𝑊𝜌𝜌𝑔𝑔𝑣𝑣𝑔𝑔�
𝜇𝜇𝑔𝑔 (9) 196
𝑆𝑆ℎ𝑖𝑖 = 2 + 1.1𝑆𝑆𝑐𝑐𝑖𝑖1 3⁄ 𝑅𝑅𝐵𝐵𝑖𝑖0.6 (10) 197
𝑘𝑘𝑓𝑓,𝑖𝑖 =�𝑆𝑆ℎ𝑖𝑖𝐵𝐵𝑀𝑀,𝑖𝑖�
2𝑟𝑟𝐻𝐻 (11) 198
where, 𝜇𝜇𝑔𝑔 is the dynamic gas viscosity and 𝜌𝜌𝑔𝑔 is the molar gas-phase density. 199
200
Momentum balance: 201
Pressure drop along the axial coordinate (valid for both laminar and turbulent flows) is estimated by Ergun’s 202
equation (Ergun, 1952). Pressure drop estimates depend on the flow direction of the bulk gas during 203
different steps of the process cycle. Accordingly, the (𝜕𝜕𝑃𝑃 𝜕𝜕𝑧𝑧⁄ ) estimate of Eq. (12) should be considered to 204
be negative during: Blowdown (𝐵𝐵𝐵𝐵) and Feed (𝐹𝐹𝐹𝐹); and positive during Pressurization (𝑃𝑃𝑅𝑅) and Purge 205
(𝑃𝑃𝑃𝑃) steps. 206
207
𝜕𝜕𝑃𝑃𝜕𝜕𝑧𝑧 = ± �𝜇𝜇𝑣𝑣𝑔𝑔
0.15(1− 𝜀𝜀𝑖𝑖)2
(2𝑟𝑟𝐻𝐻𝜓𝜓)2𝜀𝜀𝑖𝑖3+ 1.75 × 10⁻³𝑀𝑀𝑊𝑊𝜌𝜌𝑔𝑔𝑣𝑣𝑔𝑔2
(1− 𝜀𝜀𝑖𝑖)2𝑟𝑟𝐻𝐻𝜓𝜓𝜀𝜀𝑖𝑖3
� (12) 208
209
where 𝜓𝜓 is the shape factor of the adsorbent particles. 210
211
Equilibrium isotherm: 212
The adsorption isotherm of the gaseous mixture is predicted from pure component isotherms by the so-213
called Extended Langmuir model. Namely, the adsorbed moles of component 𝑖𝑖 per unit mass of adsorbent at 214
equilibrium (𝑞𝑞𝑖𝑖∗) are given by: 215
216
𝑞𝑞𝑖𝑖∗ = ��𝐼𝐼𝑃𝑃1,𝑖𝑖�(𝑝𝑝𝑖𝑖)� �1 + ��𝐼𝐼𝑃𝑃2,𝑘𝑘�(𝑝𝑝𝑘𝑘)2
𝑘𝑘=1
�� (13) 217
218
https://doi.org/10.1016/j.ces.2014.09.013
9
where 𝐼𝐼𝑃𝑃1,𝑖𝑖 and 𝐼𝐼𝑃𝑃2,𝑖𝑖 are the Langmuir isotherm parameters for the pure component 𝑖𝑖 and 𝑝𝑝 represents the 219
gas partial pressure. 220
221
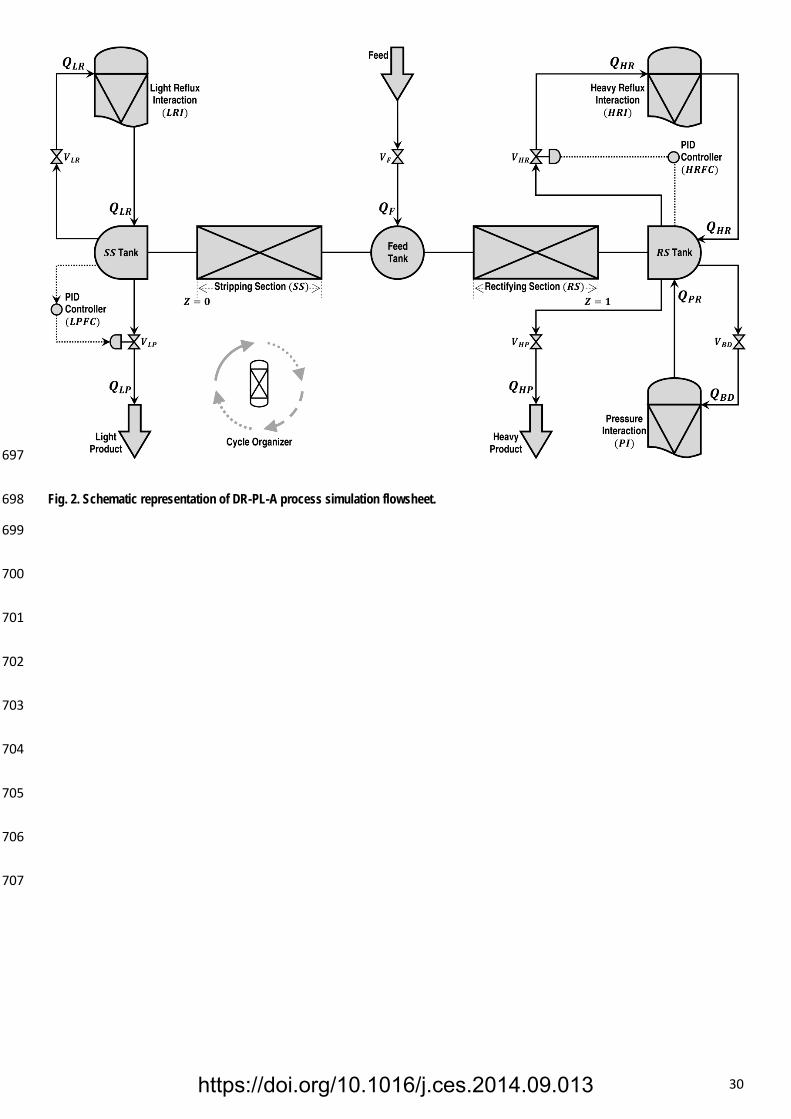
A qualitative representation of the considered DR-PL-A process simulation flowsheet is shown in Fig. 2. As 222
anticipated, the process cycle is simulated by applying the so-called ‘Single Bed Approach’ until the 223
achievement of cyclic steady-state conditions (𝐶𝐶𝑆𝑆𝑆𝑆). The evolution of concentration, pressure and velocity 224
profiles in the simulated column is followed step by step throughout the duration of the entire separation 225
cycle, whereas the interplay with the second bed is accounted for through the introduction of ‘interaction 226
modules’ (𝐼𝐼): this way, all the properties of the selected leaving stream are recorded and then reproduced as 227
input stream (as a first-in-first-out buffer profile) when required in the frame of the process cycle. As per the 228
description of twin-bed DR-PL-A system elucidated in section 2, both the adsorbent beds undergo the same 229
steps in a given cycle and are assumed to be identical (i.e., with same length, feed position, cross-sectional 230
area (𝐴𝐴𝑏𝑏𝑏𝑏𝑏𝑏), kind and amount of adsorbent, particle size, interstitial porosity (𝜀𝜀𝑖𝑖), particle porosity (𝜀𝜀𝐻𝐻), 231
solid (𝜌𝜌𝑆𝑆) and bulk densities (𝜌𝜌𝐵𝐵)). The selected computational scheme, based on the simulation of the 232
complete cycle of one single bed, significantly improves the computational speed since it reduces the total 233
number of equations to be solved for achieving the final results. Moreover, the ‘Single Bed Approach’ 234
retains the accuracy of multiple bed simulation provided the transfer of information through the previously 235
mentioned interaction modules is accurate enough. 236
237
In accordance with the twin-bed DR-PL-A system depicted in Fig. 1, the simulated single column is 238
sketched in Fig. 2 as a series of two fixed-beds, Stripping Section (𝑆𝑆𝑆𝑆) and Rectifying Section (𝑅𝑅𝑆𝑆). The 239
respective lengths of these two sections define the position of the feed injection (𝑍𝑍𝐹𝐹) with respect to the 240
whole column. Since a single gas stream can enter or leave a fixed bed in Aspen Adsim®, the input and 241
output streams of 𝑅𝑅𝑆𝑆 and 𝑆𝑆𝑆𝑆 are connected to the so-called ‘gas tank void’ modules. These tanks are set to 242
be of negligible volume and serve as connectors for multiple streams entering and exiting the beds. 243
Specifically, the tank connected to the 𝑆𝑆𝑆𝑆 end (𝑍𝑍 = 0) is termed as ‘𝑆𝑆𝑆𝑆 Tank’, the one connected to the 𝑅𝑅𝑆𝑆 244
end (𝑍𝑍 = 1) ‘𝑅𝑅𝑆𝑆 Tank’ and the one in-between the two beds ‘Feed Tank’. 245
https://doi.org/10.1016/j.ces.2014.09.013
10
246
The flowrates (𝑄𝑄) of light reflux (𝐿𝐿𝑅𝑅), feed (𝐹𝐹), heavy reflux (𝐻𝐻𝑅𝑅), blowdown (𝐵𝐵𝐵𝐵), heavy product (𝐻𝐻𝑃𝑃) 247
and light product (𝐿𝐿𝑃𝑃) are respectively regulated through the valves 𝑉𝑉𝐿𝐿𝐻𝐻 , 𝑉𝑉𝐹𝐹 , 𝑉𝑉𝐻𝐻𝐻𝐻 , 𝑉𝑉𝐵𝐵𝐵𝐵 , 𝑉𝑉𝐻𝐻𝐻𝐻 and 𝑉𝑉𝐿𝐿𝐻𝐻 . The 248
extent of opening (or simply the position) of all of these valves can be set as required by the specific step 249
scenario. When open, all these valves ensure a specified flowrate with the exception of 𝑉𝑉𝐿𝐿𝐻𝐻 and 𝑉𝑉𝐻𝐻𝐻𝐻 , whose 250
flowrate is governed by PID controllers. The controller that governs 𝑄𝑄𝐿𝐿𝐻𝐻 via 𝑉𝑉𝐿𝐿𝐻𝐻 is termed as light product 251
flowrate controller (𝐿𝐿𝑃𝑃𝐹𝐹𝐶𝐶) and the one that governs 𝑄𝑄𝐻𝐻𝐻𝐻 via 𝑉𝑉𝐻𝐻𝐻𝐻 is termed as heavy reflux flowrate 252
controller (𝐻𝐻𝑅𝑅𝐹𝐹𝐶𝐶). Since light product is released during 𝑃𝑃𝑃𝑃 and heavy reflux is released during 𝐹𝐹𝐹𝐹, the 𝑃𝑃𝐻𝐻 253
and 𝑃𝑃𝐿𝐿 set points (input quantities) are respectively maintained by 𝐿𝐿𝑃𝑃𝐹𝐹𝐶𝐶 and 𝐻𝐻𝑅𝑅𝐹𝐹𝐶𝐶 by flowrate 254
manipulation of the specific streams. 255
256
The solution sequence of the module is governed by the ‘Cycle Organizer’ which allows to create the steps 257
and to manage all the variables and the working conditions that occur in the cyclic process. Inside such 258
organizer it is possible to create any number of steps, define the step termination event (like the duration of a 259
constant pressure step or the end pressure of a variable pressure step) and manipulate the flowsheet variables 260
for a given step (such as the closing of the valves, opening of the valves at a specific flowrate, etc.). 261
Furthermore, the ‘Cycle Organizer’ allows handling all the interaction modules which appear in the 262
flowsheet making possible the simulation of the entire cycle. 263
264
4. Model adaptation to experimental apparatus and procedures 265
266
As already mentioned, model validation is carried out by simulating the experimental data by McIntyre et al. 267
(2010). Namely, 19 experiments in DR-PL-A configuration for the recovery and enrichment of dilute ethane 268
(𝐶𝐶2𝐻𝐻6) in nitrogen (𝑁𝑁2) using MeadWestvaco BAX-1500® activated carbon have been considered. The pure 269
component adsorption isotherms of 𝐶𝐶2𝐻𝐻6 and 𝑁𝑁2 on the selected activated carbon were provided by 270
McIntyre et al. (2002). In the operating range of the experiments, 𝐶𝐶2𝐻𝐻6 is adsorbed more than 𝑁𝑁2 : 271
https://doi.org/10.1016/j.ces.2014.09.013
11
accordingly, 𝐶𝐶2𝐻𝐻6 is henceforth referred to as heavy component (𝐴𝐴) and 𝑦𝑦𝐹𝐹 refers to its mole fraction in the 272
binary feed gas mixture. 273
274
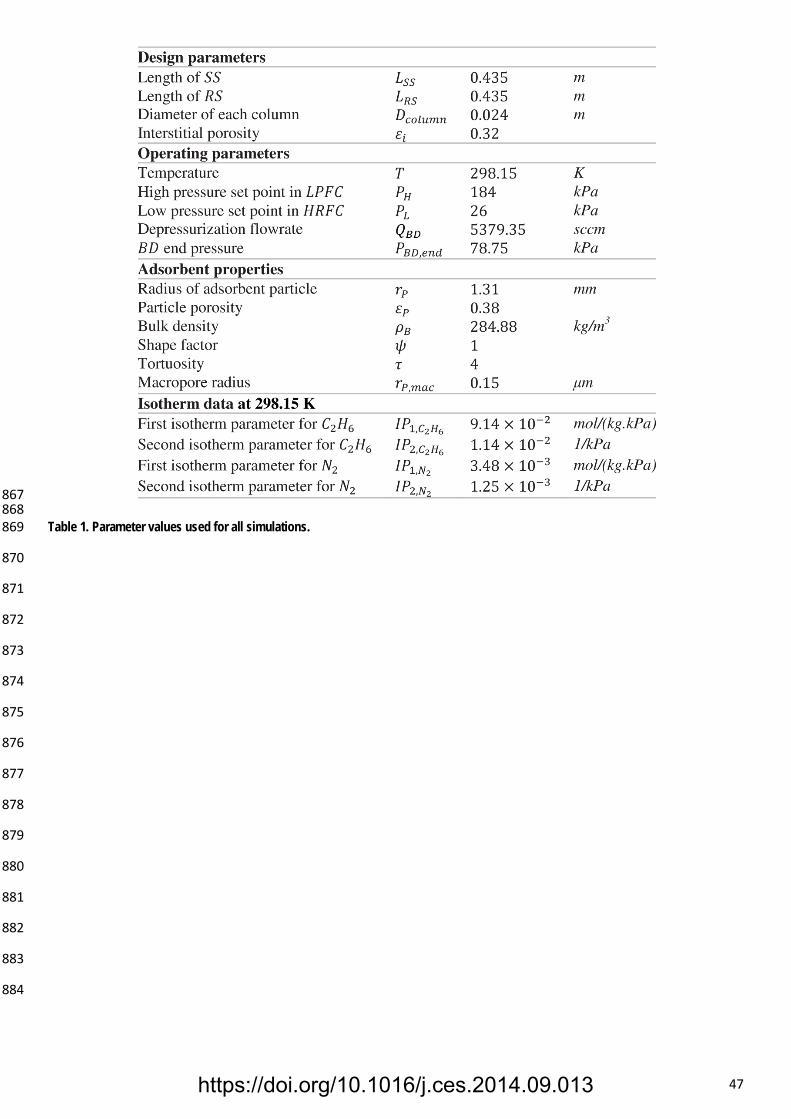
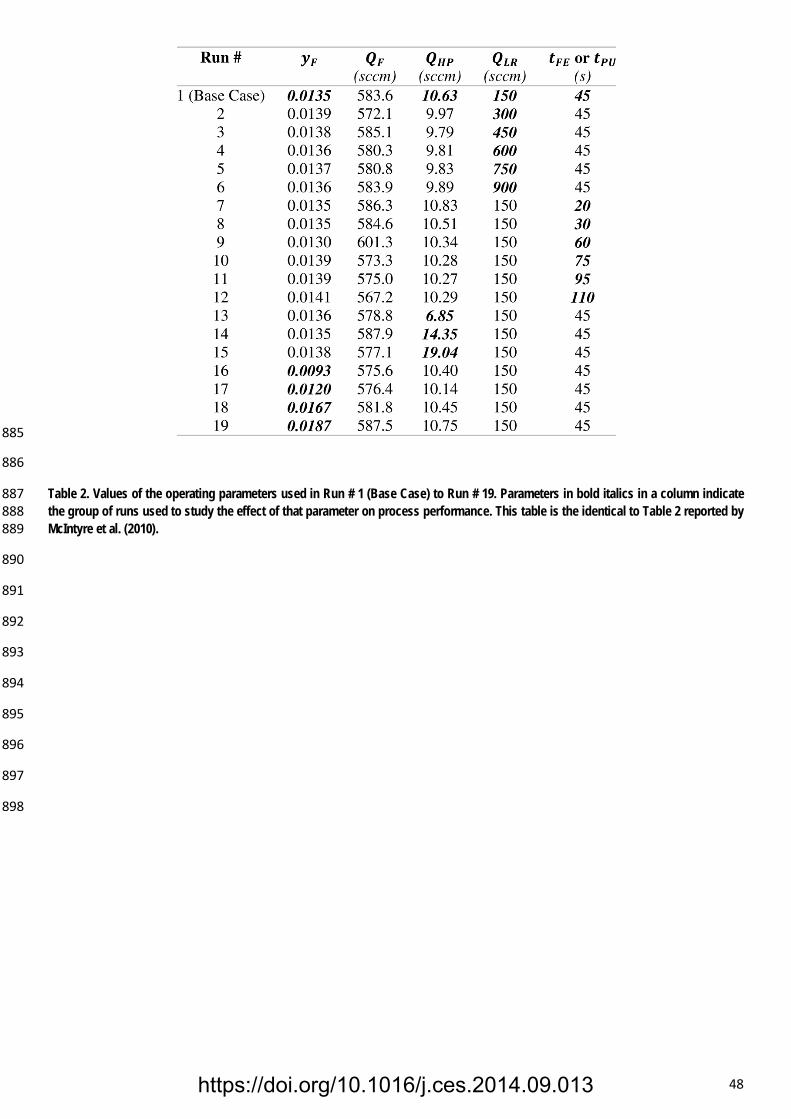
Model parameter values, kept constant while simulating all the runs, are listed in Table 1, whereas the values 275
of the operating parameters that varied during the simulation of individual runs are listed in Table 2. To 276
maintain consistency, the simulated Run numbers used in this work are identical to the ones used by 277
McIntyre et al. (2010); hence, Table 2 in this work is identical to Table 2 in the paper by McIntyre et al. 278
(2010). 279
280
About the values in Table 1, length and diameter of each column (𝑆𝑆𝑆𝑆 and 𝑅𝑅𝑆𝑆) were set according to the 281
description of the experimental apparatus provided by McIntyre et al., 2010. The amount of adsorbent 282
(𝑀𝑀𝑚𝑚𝑏𝑏𝑎𝑎) in each of the columns was also stated, thus allowing the evaluation of the adsorbent bed volume 283
(𝑉𝑉𝑏𝑏𝑏𝑏𝑏𝑏) and bulk density (𝜌𝜌𝐵𝐵). The values of average length and radius of adsorbent pellets mentioned by 284
Tolles et al. (2009) were utilized to calculate the radius (𝑟𝑟𝐻𝐻) of equivalent spherical particles ( 𝜓𝜓 = 1). 285
Mesoporous as well as macroporous volume (𝑉𝑉𝑚𝑚𝑏𝑏𝑎𝑎𝑜𝑜+𝑚𝑚𝑚𝑚𝑚𝑚𝑚𝑚𝑜𝑜) along with maximum macropore radius 286
(𝑟𝑟𝐻𝐻,𝑚𝑚𝑚𝑚𝑚𝑚) of the adsorbent, mentioned by Wilhelm et al. (2005) were assumed. The average tortuosity (𝜏𝜏) 287
value mentioned by Ruthven et al. (1994) for activated carbons was utilized in the model calculations. The 288
interstitial (or external) porosity (𝜀𝜀𝑖𝑖) provided by Hou et al. (2010) was assumed. This estimated value of 𝜀𝜀𝑖𝑖 289
also matches the overall bulk porosity range for densely packed beds with cylindrical pellets, mentioned by 290
Zhang et al., 2006. This information was utilized to estimate the value of the adsorbent particle porosity (𝜀𝜀𝐻𝐻) 291
as follows: 292
293
𝜀𝜀𝐻𝐻 =𝑀𝑀𝑚𝑚𝑏𝑏𝑎𝑎(𝑉𝑉𝑚𝑚𝑏𝑏𝑎𝑎𝑜𝑜+𝑚𝑚𝑚𝑚𝑚𝑚𝑚𝑚𝑜𝑜)
𝑉𝑉𝑏𝑏𝑏𝑏𝑏𝑏(1− 𝜀𝜀𝑖𝑖)=𝜌𝜌𝐵𝐵(𝑉𝑉𝑚𝑚𝑏𝑏𝑎𝑎𝑜𝑜+𝑚𝑚𝑚𝑚𝑚𝑚𝑚𝑚𝑜𝑜)
(1− 𝜀𝜀𝑖𝑖) (14) 294
295
The experimental apparatus was using a pump for pressurization and depressurization. Instead of using a 296
pump module in the simulation (which parameters were not provided in the corresponding paper), the values 297
https://doi.org/10.1016/j.ces.2014.09.013
12
of all the molar flowrates were input for any given step, and the material flow direction was governed by 298
setting the following information in the cycle organizer: 299
(i) pressure values of the corresponding module at the entry/exit point of the streams; 300
(ii) close () or open () valves at designated and/ or controlled flowrates and; 301
(iii) whether an interaction module is nonfunctional () or recording information (ℝ) or feeding back the 302
recorded information (𝔽𝔽). 303
The specific implementation of these input values for each experimental run will be detailed in the following 304
section (cf. Table 3). 305
306
The 𝑃𝑃𝐻𝐻 and 𝑃𝑃𝐿𝐿 set points (Table 1) used in 𝐿𝐿𝑃𝑃𝐹𝐹𝐶𝐶 and 𝐻𝐻𝑅𝑅𝐹𝐹𝐶𝐶, respectively, have been kept constant for all 307
simulations and identical to the approximate values provided by McIntyre et al. (2010) for all experimental 308
runs. In the same paper, only the durations of 𝑃𝑃𝑅𝑅 and 𝐵𝐵𝐵𝐵 steps (10 seconds for all the runs) were provided 309
without the mention of the total amount of material pushed out of one column during 𝐵𝐵𝐵𝐵 and then supplied 310
to the second column during 𝑃𝑃𝑅𝑅, thus preventing the evaluation of the actual profile (or time evolution) of 311
flowrate. However, the complete pressure profile of both the columns was provided for the base case (Run # 312
1) and it was mentioned that the pressure profile for all other runs is similar. Based on this analogy, the 313
average pressure at the end of the 𝐵𝐵𝐵𝐵 step of both the columns was assumed equal to the value 𝑃𝑃𝐵𝐵𝐵𝐵,𝑏𝑏𝑒𝑒𝑏𝑏 in 314
Table 1. Therefore, a specific value of the depressurization flowrate 𝑄𝑄𝐵𝐵𝐵𝐵 being pushed out of the column 315
during step 𝐵𝐵𝐵𝐵 was evaluated in order to reduce the column pressure down to 𝑃𝑃𝐵𝐵𝐵𝐵,𝑏𝑏𝑒𝑒𝑏𝑏 at the end of the step. 316
The resulting value (cf. Table 1) was recorded in 𝑅𝑅𝑆𝑆 Tank (event driven step) and the amount of material 317
accumulated during 𝐵𝐵𝐵𝐵 was then supplied back to the column during 𝑃𝑃𝑅𝑅 . This arrangement slightly 318
increased the cycle time but provided a reasonable reproduction of the experimental pressure profiles. 319
320
According to McIntyre et al. (2010), the first experimental run (Run # 1, the base case) was initiated with the 321
columns filled with pure 𝑁𝑁2. After 𝐶𝐶𝑆𝑆𝑆𝑆 was achieved, a process condition was changed, and a new run 322
commenced from the periodic state of the previous run; this same approach was applied to the complete 323
series of experiments. Accordingly, the same procedure was applied in modeling: the simulation of Run # 1 324
was initiated using pure 𝑁𝑁2 in all the bed, tank and interaction modules, while all simulation runs thereafter 325
https://doi.org/10.1016/j.ces.2014.09.013
13
were initiated using the concentration profiles predicted for the previous run at 𝐶𝐶𝑆𝑆𝑆𝑆 following the same 326
order of the 19 experimental runs reported by McIntyre et al. (2010). 327
328
As mentioned in the original paper, temperature oscillations of around 25 K were observed for all the 329
reported experimental runs. This temperature variation is lower than those typical of conventional PSA 330
systems and is explained by the limited pressure ratio 𝑃𝑃𝐻𝐻/𝑃𝑃𝐿𝐿 along with the low concentration of the most 331
adsorbable component in the feed, less than 1.4% on molar basis. Accordingly, the simulations were carried 332
out at constant temperature equal to 298 K, using model parameter values estimated at the same temperature. 333
334
All 19 simulations were carried out for batch intervals of 1,500 cycles. In order to assess the actual 335
achievement of 𝐶𝐶𝑆𝑆𝑆𝑆 conditions, once the time invariance of the cycle-average compositions was reached the 336
component material balances were checked after every batch and steady-state conditions were considered to 337
be established when the resulting error was less than 5% for 𝐶𝐶2𝐻𝐻6 and less than 2% for 𝑁𝑁2, similar to the 338
criterion mentioned by McIntyre et al. (2010). At 𝐶𝐶𝑆𝑆𝑆𝑆, the average 𝑁𝑁2 material balance error for all the runs 339
was about 0.03% whereas the same assessment for 𝐶𝐶2𝐻𝐻6 was about 2.5%. The larger error in 𝐶𝐶2𝐻𝐻6 material 340
balance was due to the very low concentration of 𝐶𝐶2𝐻𝐻6 in the feed stream. If 𝐶𝐶𝑆𝑆𝑆𝑆 was not established, a 341
further batch of 1,500 simulation cycles was carried out and the checking procedure was repeated. Usually 342
𝐶𝐶𝑆𝑆𝑆𝑆 was achieved sooner than anticipated in most of the simulations (say, around 800 cycles); however, we 343
decided to run the same number of cycles as reported by the experimenters to maintain consistency and also 344
to check the 𝐶𝐶𝑆𝑆𝑆𝑆 robustness. Depending on the cycle duration, the overall computational time ranged from 3 345
days to 2 weeks on Intel® Xenon® X5650, 2.66GHz, 64-bit processor. 346
347
5. Base case simulation 348
349
This section provides a detailed description of the approach used for simulating Run # 1 (base case); the 350
same approach was used for simulating all other runs. As anticipated, all the parameter values stated in 351
Table 1 were used. A four step DR-PL-A cycle was formulated in the cycle organizer (𝐵𝐵𝐵𝐵, 𝐹𝐹𝐹𝐹, 𝑃𝑃𝑅𝑅 and 𝑃𝑃𝑃𝑃). 352
The simulation of 𝐵𝐵𝐵𝐵 step was executed until the desired pressure value 𝑃𝑃𝐵𝐵𝐵𝐵,𝑏𝑏𝑒𝑒𝑏𝑏 was recorded in 𝑅𝑅𝑆𝑆 Tank 353
https://doi.org/10.1016/j.ces.2014.09.013
14
(event driven step), whereas 𝐹𝐹𝐹𝐹 was executed for the time stated in Table 2 (time driven step). Of course, 354
the execution times of the parallel steps 𝑃𝑃𝑅𝑅 and 𝑃𝑃𝑃𝑃 were equivalent to that of 𝐵𝐵𝐵𝐵 and 𝐹𝐹𝐹𝐹, respectively. 355
Once the execution methodology of these four steps was defined, the modus operandi of the various valves 356
and interaction modules during each step in the cycle organizer was defined as shown in Table 3. 357
358
The cycle starts with blowdown (𝐵𝐵𝐵𝐵) step and the column is depressurized from 𝑃𝑃𝐻𝐻 to 𝑃𝑃𝐵𝐵𝐵𝐵,𝑏𝑏𝑒𝑒𝑏𝑏 . The gas 359
mixture is withdrawn from 𝑍𝑍 = 1 end of the column at 𝑄𝑄𝐵𝐵𝐵𝐵 (cf. Table 1) via 𝑉𝑉𝐵𝐵𝐵𝐵 and the evolutions of 360
concentration, pressure and flow profiles are recorded in the pressure interaction module (𝑃𝑃𝐼𝐼). Then, the 361
feed step (𝐹𝐹𝐹𝐹) is simulated for the time 𝜕𝜕𝐹𝐹𝐹𝐹 mentioned in Table 2. Light reflux material is fed to the column 362
at constant flowrate 𝑄𝑄𝐿𝐿𝐻𝐻 (Table 2) via the light reflux interaction module (𝐿𝐿𝑅𝑅𝐼𝐼); simultaneously, the binary 363
feed gas mixture with composition 𝑦𝑦𝐹𝐹 (Table 2) is fed to the column at fixed flowrate 𝑄𝑄𝐹𝐹 (Table 2) via 𝑉𝑉𝐹𝐹 . 364
Material withdrawn from 𝑍𝑍 = 1 end of the column during this step is divided into two streams and gets 365
collected by: (i) heavy product module at constant flowrate (𝑄𝑄𝐻𝐻𝐻𝐻 in Table 2) via 𝑉𝑉𝐻𝐻𝐻𝐻 and (ii) heavy reflux 366
interaction module (𝐻𝐻𝑅𝑅𝐼𝐼) at flowrate 𝑄𝑄𝐻𝐻𝐻𝐻 controlled by 𝐻𝐻𝑅𝑅𝐹𝐹𝐶𝐶 via 𝑉𝑉𝐻𝐻𝐻𝐻 in order to maintain the outlet 367
pressure equal to the set point 𝑃𝑃𝐿𝐿 (Table 1). Note that the material withdrawn from 𝑍𝑍 = 1 end of the column 368
during this step is flowing to the Heavy Product module as first priority (by default simulation settings), 369
while the remaining material is sent to 𝐻𝐻𝑅𝑅𝐼𝐼. This way, the heavy product flowrate (set equivalent to the 370
corresponding experimental value) is consistently maintained in the simulation. Next, the pressurization step 371
(𝑃𝑃𝑅𝑅) is simulated. Pressure interaction module (𝑃𝑃𝐼𝐼) feeds back a stream with the profiles recorded during 372
𝐵𝐵𝐵𝐵 at the flowrate 𝑄𝑄𝐻𝐻𝐻𝐻 (equivalent to 𝑄𝑄𝐵𝐵𝐵𝐵). 373
374
At the high pressures resulting from 𝑃𝑃𝑅𝑅, the purge step (𝑃𝑃𝑃𝑃) is executed. The heavy reflux (𝑄𝑄𝐻𝐻𝐻𝐻) is pushed 375
by 𝐻𝐻𝑅𝑅𝐼𝐼 (recorded during 𝐹𝐹𝐹𝐹) inside the column. Material withdrawn from 𝑍𝑍 = 0 end of the column during 376
this step is divided into two streams and gets collected by: (i) Light product module at flowrate 𝑄𝑄𝐿𝐿𝐻𝐻 377
controlled by 𝐿𝐿𝑃𝑃𝐹𝐹𝐶𝐶 via 𝑉𝑉𝐿𝐿𝐻𝐻 in order to maintain the pressure at the set point 𝑃𝑃𝐻𝐻 (Table 1) and (ii) Light 378
reflux interaction module (𝐿𝐿𝑅𝑅𝐼𝐼) at constant flowrate (𝑄𝑄𝐿𝐿𝐻𝐻 in Table 2) via 𝑉𝑉𝐿𝐿𝐻𝐻 . Similar to step 𝐹𝐹𝐹𝐹, in order to 379
assure light reflux flowrate equal to the experimental one, the material withdrawn from 𝑍𝑍 = 0 end of the 380
https://doi.org/10.1016/j.ces.2014.09.013
15
column during this step is flowing to 𝐿𝐿𝑅𝑅𝐼𝐼 with first priority (by default simulation settings) and then the 381
remaining material is sent to the light product module. 382
383
Once established 𝐶𝐶𝑆𝑆𝑆𝑆 conditions, model predictions were compared with reported experimental results in 384
terms of: (i) average 𝐶𝐶2𝐻𝐻6 mole fraction in heavy product (𝑦𝑦�𝐻𝐻𝐻𝐻); (ii) average mole fraction of 𝑁𝑁2 in light 385
product (1 − 𝑦𝑦�𝐿𝐿𝐻𝐻) ; (iii) instantaneous heavy product composition (𝑦𝑦𝐻𝐻𝐻𝐻 : 𝐶𝐶2𝐻𝐻6 mole fraction in heavy 386
product) profiles during 𝐹𝐹𝐹𝐹 step and; (iii) instantaneous column composition profiles (in terms of 𝐶𝐶2𝐻𝐻6 387
mole fraction: 𝑦𝑦𝑀𝑀2𝐻𝐻6) at the end of 𝑃𝑃𝑃𝑃 step. 388
389
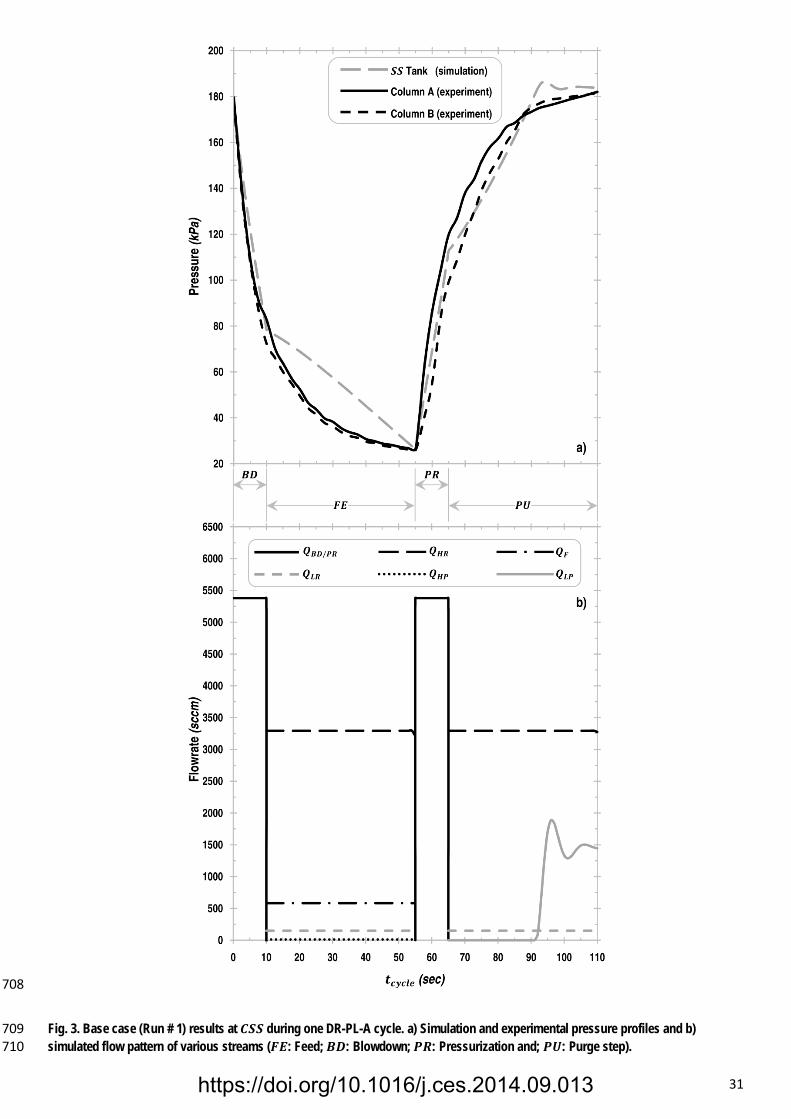
Pressure profile and flow pattern of various streams during one cycle at 𝐶𝐶𝑆𝑆𝑆𝑆 are depicted in Fig. 3a) and 3b), 390
respectively. The model estimated blowdown and pressurization times are normalized with respect to the 391
one reported by McIntyre et al. (2010). The cycle time (𝜕𝜕𝑚𝑚𝑐𝑐𝑚𝑚𝑐𝑐𝑏𝑏) is identical for both figures: 3a) and 3b). 392
Since negligible pressure drop was observed across the simulated column length, the pressure profile of 𝑆𝑆𝑆𝑆 393
Tank is representative of the entire column. For comparative analysis, actual experimental pressure profile 394
of both the columns (reported in their Fig. 3 by McIntyre et al., 2010; measured near 𝑍𝑍 = 0 end of each 395
column) is also plotted in the same figure. Note that the pressure profiles during a complete cycle (𝐵𝐵𝐵𝐵, 𝐹𝐹𝐹𝐹, 396
𝑃𝑃𝑅𝑅 and 𝑃𝑃𝑃𝑃) occurring in each of the experimental columns are plotted in Fig. 3a). Discrepancy between the 397
experimental and simulation pressure profile can be ascribed to the simplistic model assumptions coupled 398
with the fact that the pump module was not utilized in the simulation. In general, the experimental and 399
calculated pressure profiles are comparable and the close achievement of 𝑃𝑃𝐿𝐿 and 𝑃𝑃𝐻𝐻 set points (Table 1) is 400
apparent from Fig. 3a). As explained above, 𝑄𝑄𝐻𝐻𝐻𝐻 is the variable manipulated by 𝐻𝐻𝑅𝑅𝐹𝐹𝐶𝐶 (via 𝑉𝑉𝐻𝐻𝐻𝐻 ) to ensure 401
pressure equal to 𝑃𝑃𝐿𝐿 during the feed step: since the step starts at 𝑃𝑃𝐵𝐵𝐵𝐵,𝑏𝑏𝑒𝑒𝑏𝑏 (which is higher than the set point, 402
𝑃𝑃𝐵𝐵𝐵𝐵,𝑏𝑏𝑒𝑒𝑏𝑏 > 𝑃𝑃𝐿𝐿), valve 𝑉𝑉𝐻𝐻𝐻𝐻 is fully open and the corresponding flow (heavy reflux) reaches its maximum limit 403
(the bias of 𝐻𝐻𝑅𝑅𝐹𝐹𝐶𝐶) and remains equal to such value until the set point pressure is established at 𝑅𝑅𝑆𝑆 Tank. 404
Conversely, 𝑃𝑃𝑃𝑃 starts at a pressure value lower than the set point 𝑃𝑃𝐻𝐻 : therefore, 𝐿𝐿𝑃𝑃𝐹𝐹𝐶𝐶 restricts 𝑄𝑄𝐿𝐿𝐻𝐻 by 405
closing the valve 𝑉𝑉𝐿𝐿𝐻𝐻 until the set point pressure is established at 𝑆𝑆𝑆𝑆 Tank and then manipulates the same 406
https://doi.org/10.1016/j.ces.2014.09.013
16
flow to maintain the pressure constant and equal to 𝑃𝑃𝐻𝐻. Note that this second interval corresponds to non-407
zero and non-constant 𝑄𝑄𝐿𝐿𝐻𝐻 in Fig. 3b). 408
409
While simulating all the available experimental runs, a reasonable match between simulation and 410
experimental results at 𝐶𝐶𝑆𝑆𝑆𝑆 could be obtained when a pressure profile very similar to the one shown in Fig. 411
3a) was qualitatively established. As explained above, the pressure profile was mainly determined by fine-412
tuning both the controllers, 𝐻𝐻𝑅𝑅𝐹𝐹𝐶𝐶 and 𝐿𝐿𝑃𝑃𝐹𝐹𝐶𝐶. Moreover, after establishing 𝐶𝐶𝑆𝑆𝑆𝑆 conditions, the consistency 413
between experimental and simulation results was checked by mass balance calculations, as elaborated in the 414
next section. 415
416
6. Results and discussion 417
418
In this section, a comparative analysis between simulation and reported experimental results at 𝐶𝐶𝑆𝑆𝑆𝑆 is 419
presented for all the available experimental conditions. Namely, the effect on process performance of the 420
following process parameters is explored: 421
422
a) light reflux flowrate (𝑄𝑄𝐿𝐿𝐻𝐻): Run # 1 to 6; 423
b) feed or purge step time �𝜕𝜕𝐹𝐹𝐹𝐹/𝐻𝐻𝑃𝑃�: Run # 7, 8, 1 and 9 to 12; 424
c) heavy product flowrate (𝑄𝑄𝐻𝐻𝐻𝐻): Run # 13, 1, 14 and 15; 425
d) ethane mole fraction (𝑦𝑦𝐹𝐹) in binary feed gas mixture: Run # 16, 17, 1, 18 and 19. 426
427
In order to maintain consistency, the maximum and minimum limits of both the axes for each case are held 428
constant for ease of comparison. In all cases, 1,500 to 3,000 cycles were simulated to achieve 𝐶𝐶𝑆𝑆𝑆𝑆: besides 429
being identical to the typical experimental values, the cyclic steady state nature of the simulation results was 430
demonstrated by fulfilling the following constraints: 431
432
(i) material balance error of the component, less than 5% for 𝐶𝐶2𝐻𝐻6 and 0.1% for 𝑁𝑁2 (values respectively 433
identical and much more stringent than those reported by the experimenters); 434
https://doi.org/10.1016/j.ces.2014.09.013
17
(ii) achievement of both experimental set point values of pressure, 𝑃𝑃𝐻𝐻 and 𝑃𝑃𝐿𝐿; 435
(iii) pressure profile and flow pattern of various streams qualitatively similar to those shown in Fig. 3 for the 436
base case and; 437
(iv) bed composition profile at the end of 𝑃𝑃𝑃𝑃 and the composition profile of heavy product during 𝐹𝐹𝐹𝐹 for 438
each run were very similar to the ones reported by McIntyre et al., 2010. 439
440
The experimental flowrates 𝑄𝑄𝐹𝐹 , 𝑄𝑄𝐻𝐻𝐻𝐻 , 𝑄𝑄𝐿𝐿𝐻𝐻 (cf. Table 2) and the pressure values 𝑃𝑃𝐻𝐻, 𝑃𝑃𝐿𝐿 (cf. Table 1) were set 441
and/or maintained in all simulations. On the other hand, the flowrate 𝑄𝑄𝐿𝐿𝐻𝐻 was not fixed in the experimental 442
setup, but controlled in the model simulations by 𝐿𝐿𝑃𝑃𝐹𝐹𝐶𝐶 via 𝑉𝑉𝐿𝐿𝐻𝐻 in order to maintain the set point pressure 443
𝑃𝑃𝐻𝐻. Regardless of this dissimilarity, a very good match was found between the light product flowrate (𝑄𝑄𝐿𝐿𝐻𝐻) 444
recorded in the experiments and predicted by the model in all examined cases. This agreement represents a 445
meaningful model validation in terms of the remaining flowrate 𝑄𝑄𝐻𝐻𝐻𝐻 and of the internal recycle loop. 446
Simulated values of heavy reflux flowrates (𝑄𝑄𝐻𝐻𝐻𝐻) as a function of operating parameters are also presented. 447
Since the specific values of 𝑄𝑄𝐻𝐻𝐻𝐻 were not mentioned by McIntyre et al. (2010), simulated data is not 448
compared with experimental results for this specific parameter. Moreover, for enhanced understanding of 449
the process behavior, column composition profiles (in terms of 𝐶𝐶2𝐻𝐻6 mole fraction: 𝑦𝑦𝑀𝑀2𝐻𝐻6) at the end of each 450
process cycle step are also provided for every run at 𝐶𝐶𝑆𝑆𝑆𝑆. 451
452
Effect of the light reflux flowrate (𝑸𝑸𝑳𝑳𝑳𝑳): Run # 1 to 6 453
454
Following the procedure described in the previous section, Runs # 1 to 6 were simulated to assess the effect 455
of changing the light reflux flowrate (𝑄𝑄𝐿𝐿𝐻𝐻) on process performance when keeping constant all the remaining 456
conditions (cf. Table 2). The values of the operating parameters used while simulating these runs are shown 457
in the same table, whereas the simulation results are plotted and compared with the experimental ones in 458
Fig. 4 and 5. 459
460
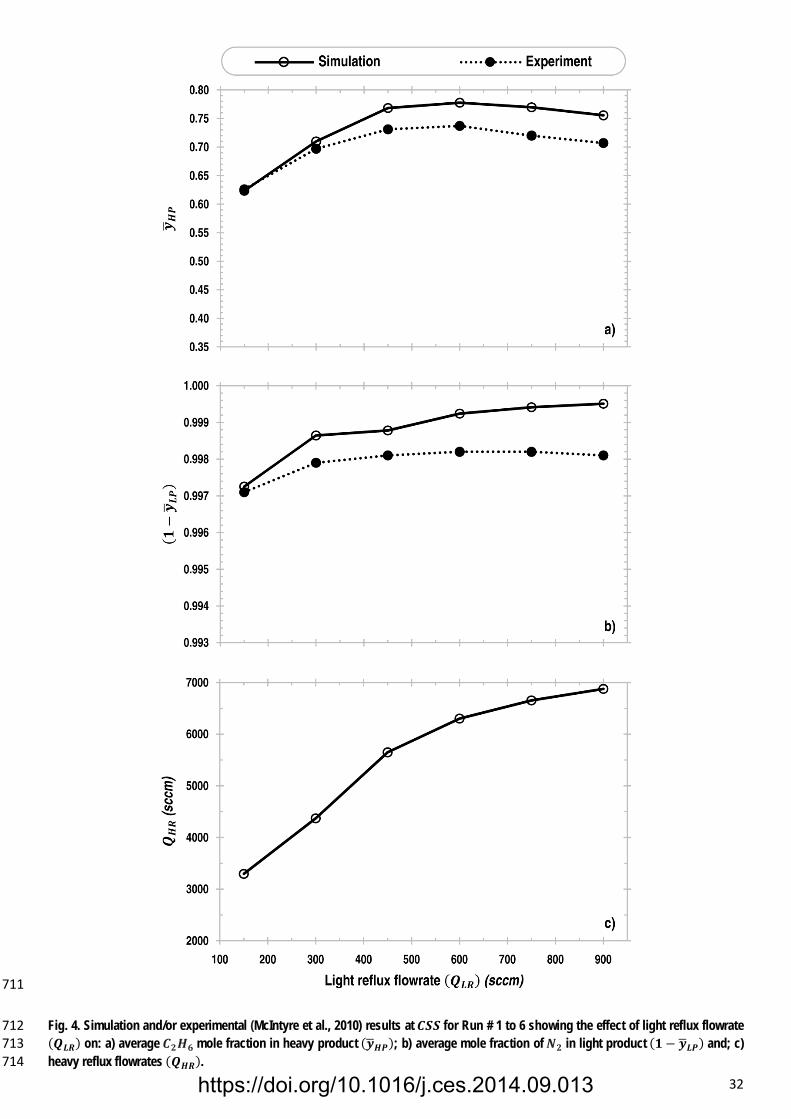
𝑄𝑄𝐹𝐹 and 𝑄𝑄𝐻𝐻𝐻𝐻 were kept practically constant as 𝑄𝑄𝐿𝐿𝐻𝐻 was increased from Run # 1 to 6. Since practically 461
constant 𝑄𝑄𝐿𝐿𝐻𝐻 was also observed in these runs, the only obvious flowrate being manipulated by the system is 462
https://doi.org/10.1016/j.ces.2014.09.013
18
𝑄𝑄𝐻𝐻𝐻𝐻 , as depicted in Fig. 4c) and also indicated by McIntyre et al. (2010). Therefore, 𝑄𝑄𝐻𝐻𝐻𝐻 increased with 463
increase in 𝑄𝑄𝐿𝐿𝐻𝐻 that, in turn, caused an increase in the flowrates of the internal recycle loop. 464
465
In agreement with the remarks reported by McIntyre et al. (2010), two competing effects come into play in 466
this case: (i) improved bed regeneration during 𝐹𝐹𝐹𝐹 due to the increase in 𝑄𝑄𝐿𝐿𝐻𝐻 (manifested by the column 467
composition profiles at the beginning and end of 𝐹𝐹𝐹𝐹 in Fig. 6) and (ii) deeper 𝐶𝐶2𝐻𝐻6 penetration into the 468
column due to the increase in 𝑄𝑄𝐻𝐻𝐻𝐻 (evident from Fig. 5c and 5d). At lower 𝑄𝑄𝐿𝐿𝐻𝐻 values, the first effect is 469
dominant, thus causing an increase in 𝑦𝑦�𝐻𝐻𝐻𝐻 (Fig. 4a) and (1 − 𝑦𝑦�𝐿𝐿𝐻𝐻) (Fig. 4b). On the contrary, 𝐶𝐶2𝐻𝐻6 470
penetration into the column (Fig. 5c and 5d) becomes dominant at higher 𝑄𝑄𝐿𝐿𝐻𝐻 values, resulting in decline of 471
𝑦𝑦�𝐻𝐻𝐻𝐻 . The initial increment in 𝑄𝑄𝐿𝐿𝐻𝐻 results in an increase in light product purity (1− 𝑦𝑦�LP), however, such 472
parameter practically remains unaffected by further increment in 𝑄𝑄𝐿𝐿𝐻𝐻 values. These practically constant light 473
product purities imply that the deeper 𝐶𝐶2𝐻𝐻6 penetration into the column due to the increase in 𝑄𝑄𝐻𝐻𝐻𝐻 was not 474
enough to significantly affect the column composition profiles at 𝑍𝑍 = 0 end (depicted in Fig. 6). It is also 475
evident from Fig. 6 that the increase in internal recycle loop (due to increase in both 𝑄𝑄𝐿𝐿𝐻𝐻 and 𝑄𝑄𝐻𝐻𝐻𝐻) from Run 476
# 1 to 6 increases the volume of adsorbent involved in the actual adsorption and desorption process. This 477
combination of effects, result in the trends depicted in Fig. 4a), 4b) and, 5, in good agreement with the 478
experimental observations. 479
480
The dip in some of the column composition profiles (in terms of 𝐶𝐶2𝐻𝐻6 mole fraction: 𝑦𝑦𝑀𝑀2𝐻𝐻6) at the end of 481
high pressure 𝑃𝑃𝑃𝑃 step beyond the feed position (𝑍𝑍 = 0.5) reported by the experimenters (depicted in Fig. 5c 482
and some other runs, to be investigated later on) are noteworthy. McIntyre et al. (2010) reported that such 483
perturbations result from the mixing of dilute ethane feed stream with an ethane rich gas inside the column 484
during the low pressure feed step (𝐹𝐹𝐹𝐹). The simulation results also show such perturbations at the end of 𝐹𝐹𝐹𝐹 485
(as depicted in Fig. 6) at the feed position. As the cycle proceeds, the experimenters report that such 486
perturbations appeared in the column composition profiles (for some of the runs) at the end of the 𝑃𝑃𝑃𝑃 step 487
beyond the feed position (𝑍𝑍 = 0.5) , while in the simulations such perturbations were only observed 488
specifically at the feed position. The model behavior seems more physically consistent: considering that 489
during PR and PU steps the flow is reversed (that is, from Z = 1 towards Z = 0), the perturbation is expected 490
https://doi.org/10.1016/j.ces.2014.09.013
19
to move towards Z = 0, that is, it should either appear also before and not only beyond the feed position 491
(𝑍𝑍 = 0.5) or be reabsorbed. 492
493
Effect of the feed/purge step duration �𝒕𝒕𝑭𝑭𝑭𝑭/𝑷𝑷𝑷𝑷�: Run # 7, 8, 1 and 9 to 12 494
495
Simulations for Run # 7, 8, 1 and 9 to 12 were performed to assess the effect of increasing feed/purge step 496
duration �𝜕𝜕𝐹𝐹𝐹𝐹/𝐻𝐻𝑃𝑃� on process performance. Again, all the remaining model parameters remained practically 497
constant (cf. Table 2), whereas the simulation results are compared to the experimental ones in Fig. 7 and 8. 498
Column composition profiles at the end of each process cycle step are provided for every run at 𝐶𝐶𝑆𝑆𝑆𝑆 in Fig. 499
9. 500
501
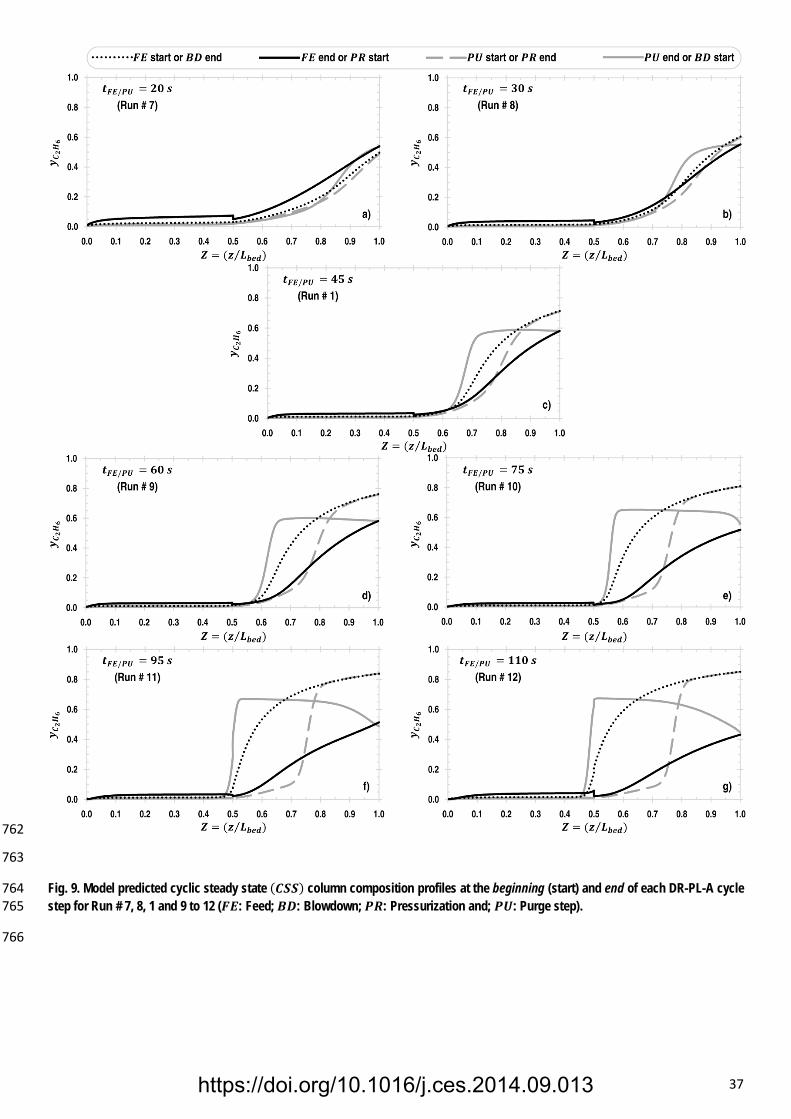
According to McIntyre et al. (2010), the increase in 𝜕𝜕𝐹𝐹𝐹𝐹/𝐻𝐻𝑃𝑃 had minimal effect on 𝐶𝐶2𝐻𝐻6 uptake by the 502
adsorbent due to the very low concentration of 𝐶𝐶2𝐻𝐻6 in the feed. However, heavy and light recycle flowrates 503
were allowed to persist longer with increasing duration of the feed/purge step (evident in Fig. 9 by the 504
increases in the volume of adsorbent involved in the actual adsorption and desorption process with increase 505
in 𝜕𝜕𝐹𝐹𝐹𝐹/𝐻𝐻𝑃𝑃): this might explain the initial surge in 𝑦𝑦�𝐻𝐻𝐻𝐻 and (1 − 𝑦𝑦�𝐿𝐿𝐻𝐻) with increase in 𝜕𝜕𝐹𝐹𝐹𝐹/𝐻𝐻𝑃𝑃. After this initial 506
increase, the two competitive effects of bed regeneration (due to increase in light recycle time: evident from 507
the column composition profiles at the beginning and end of 𝐹𝐹𝐹𝐹 depicted in Fig. 9) and 𝐶𝐶2𝐻𝐻6 penetration in 508
the column (due to increase in heavy recycle time: evident from Fig. 8c and 8d and the column composition 509
profiles at the beginning and end of 𝑃𝑃𝑃𝑃 depicted in Fig. 9) cancel each other, resulting in the stable trends 510
observed in Fig. 7a) and 7b). 511
512
Notice that the increments in 𝜕𝜕𝐹𝐹𝐹𝐹/𝐻𝐻𝑃𝑃 resulted in decline of 𝑄𝑄𝐻𝐻𝐻𝐻 (Fig. 7c). In the original paper, it was 513
mentioned that the pressure profile for all the runs was similar to the one provided for the base case (Run # 514
1); the simulation results confirmed this expectation. Table 2 shows that all operating parameters remained 515
nearly constant as 𝜕𝜕𝐹𝐹𝐹𝐹/𝐻𝐻𝑃𝑃 increased from Run # 7, 8, 1 and 9 to 12. Therefore, when increasing 𝜕𝜕𝐹𝐹𝐹𝐹/𝐻𝐻𝑃𝑃 in 516
these runs: the system managed to attain and maintain the designated pressure set points by decreasing 𝑄𝑄𝐻𝐻𝐻𝐻 . 517
https://doi.org/10.1016/j.ces.2014.09.013
20
518
The unusual column composition profiles for Run # 7 (depicted in Fig. 9a) are noteworthy, since only in this 519
run the heavy component concentration in Z = 1 at the FE start is lower than that at the FE end. In this run, 520
the short duration of low pressure 𝐹𝐹𝐹𝐹 (desorption step: since the pressure reduces from 𝑃𝑃𝐵𝐵𝐵𝐵,𝑏𝑏𝑒𝑒𝑏𝑏 to 𝑃𝑃𝐿𝐿, cf. 521
Table 1) did not allow for enough heavy product withdrawal from the bed. This phenomenon can be further 522
verified from the instantaneous heavy product composition profile during 𝐹𝐹𝐹𝐹 (depicted in Fig. 8a and 8b). 523
On the other hand, the short duration of the high pressure 𝑃𝑃𝑃𝑃 (adsorption step, where the pressure still 524
increases, cf. Fig. 3) was not enough to adsorb the incoming ethane rich heavy reflux. These combined 525
effects led to the unusual column composition profiles for Run # 7. 526
527
Effect of the heavy product flowrate (𝑸𝑸𝑯𝑯𝑷𝑷): Run # 13, 1, 14 and 15 528
529
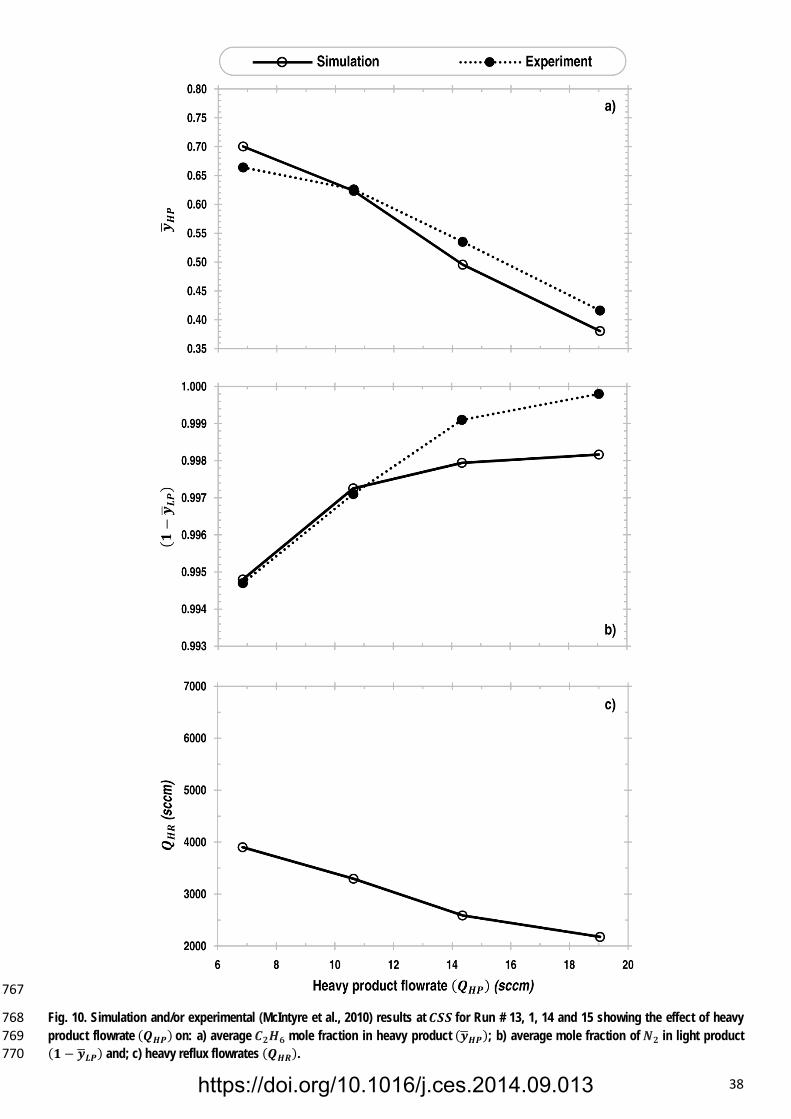
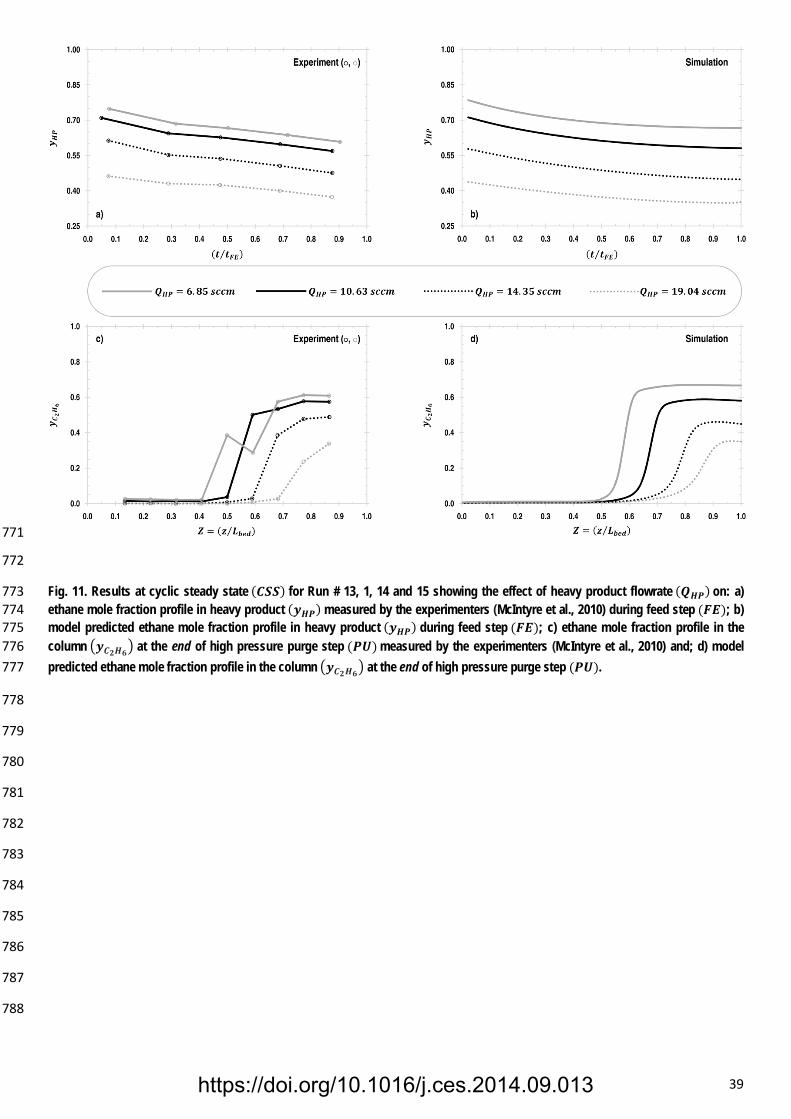
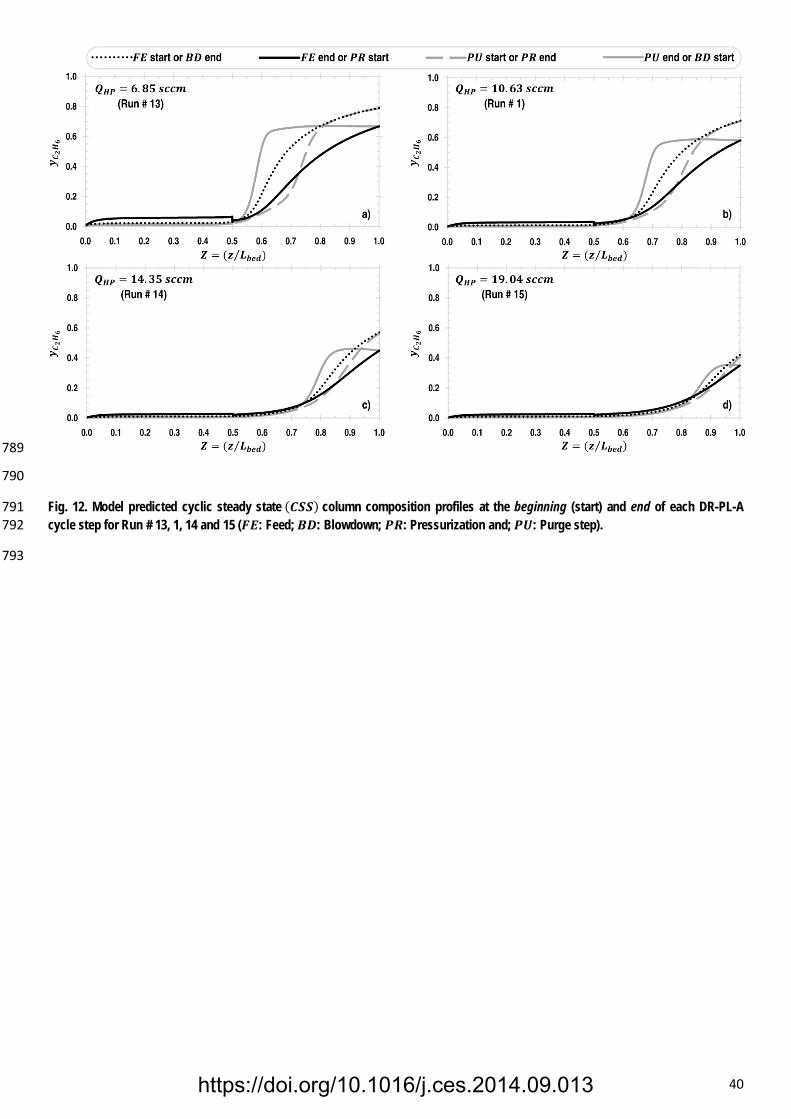
Simulations for Run # 13, 1, 14 and 15 were performed to assess the effect of increasing the heavy product 530
flowrate (𝑄𝑄𝐻𝐻𝐻𝐻) on process performance. The simulation results are plotted and compared with the 531
experimental ones in Fig. 10 and 11 whereas, column composition profiles at the end of each process cycle 532
step are depicted for every run at 𝐶𝐶𝑆𝑆𝑆𝑆 in Fig. 12. In these runs, 𝑄𝑄𝐿𝐿𝐻𝐻 holds identical values and the process is 533
always able to attain the same 𝑃𝑃𝐻𝐻 and 𝑃𝑃𝐿𝐿 set points (Table 1). Since other operating parameters practically 534
remained constant during these runs (Table 2), the decline of 𝑄𝑄𝐻𝐻𝐻𝐻 with increase in 𝑄𝑄𝐻𝐻𝐻𝐻 is apparent from Fig. 535
10c. This 𝑄𝑄𝐻𝐻𝐻𝐻 trend is in agreement with the experimental observations leading to reduced 𝐶𝐶2𝐻𝐻6 penetration 536
in the column (Fig. 11c and 11d) that, in turn, caused declining 𝑦𝑦�𝐻𝐻𝐻𝐻 trend (Fig. 10a) and rising (1− 𝑦𝑦�𝐿𝐿𝐻𝐻) 537
trend (Fig. 10b). Reduced 𝑄𝑄𝐻𝐻𝐻𝐻 also lowers the volume of adsorbent involved in the major adsorption and 538
desorption activity (as depicted in Fig. 12). The experimental and predicted heavy product composition 539
profile trends (depicted in Fig. 11a and 11b) are also in agreement with one another. 540
541
Effect of ethane mole fraction (𝒚𝒚𝑭𝑭) in the feed mixture: Run # 16, 17, 1, 18 and 19 542
543
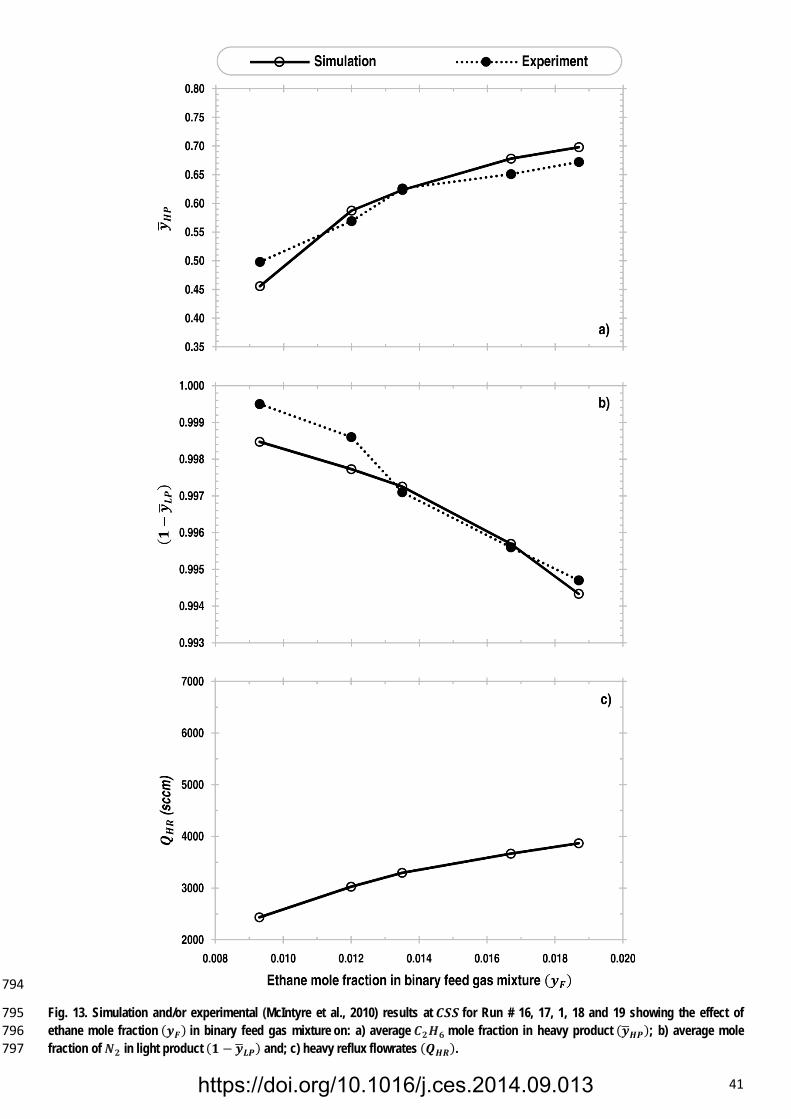
Simulations for Run # 16, 17, 1, 18 and 19 were performed to assess the effect of change in ethane mole 544
fraction (𝑦𝑦𝐹𝐹) in the binary feed gas mixture on process performance. The simulation results are compared 545
https://doi.org/10.1016/j.ces.2014.09.013
21
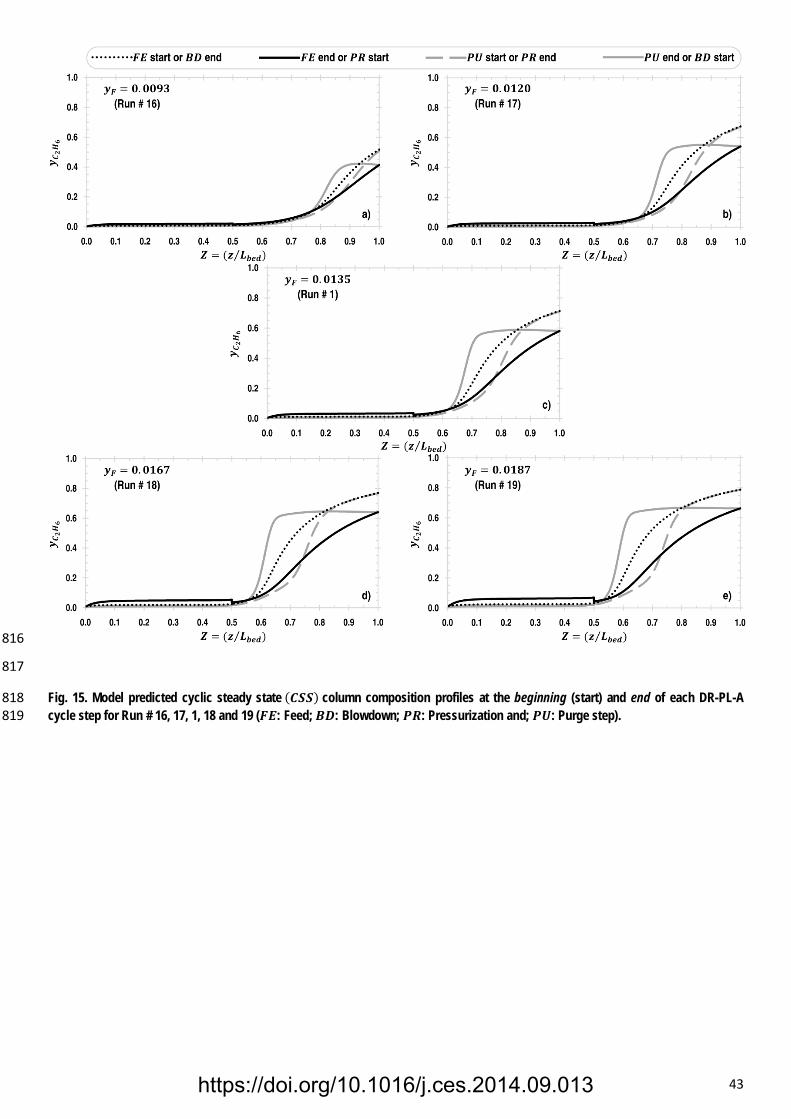
with those reported by McIntyre et al. (2010) in Fig. 13 and 14. Column composition profiles at the end of 546
each process cycle step are provided for every run at 𝐶𝐶𝑆𝑆𝑆𝑆 in Fig. 15. The parameters remaining practically 547
constant in these runs are: 𝑄𝑄𝐹𝐹 , 𝑄𝑄𝐻𝐻𝐻𝐻 , 𝑄𝑄𝐿𝐿𝐻𝐻 and 𝜕𝜕𝐹𝐹𝐹𝐹/𝐻𝐻𝑃𝑃 (Table 2). Increase in 𝑦𝑦𝐹𝐹 resulted in an increased 𝐶𝐶2𝐻𝐻6 548
(heavy component or strongly adsorbed species) uptake by the adsorbent. In this scenario, the system 549
managed to attain the same 𝑃𝑃𝐿𝐿 set point (Table 1) by increasing 𝑄𝑄𝐻𝐻𝐻𝐻 (Fig. 13c). This combined effect of 550
increased 𝐶𝐶2𝐻𝐻6 uptake and deeper 𝐶𝐶2𝐻𝐻6 penetration in the column (due to increase in 𝑄𝑄𝐻𝐻𝐻𝐻: evident from Fig. 551
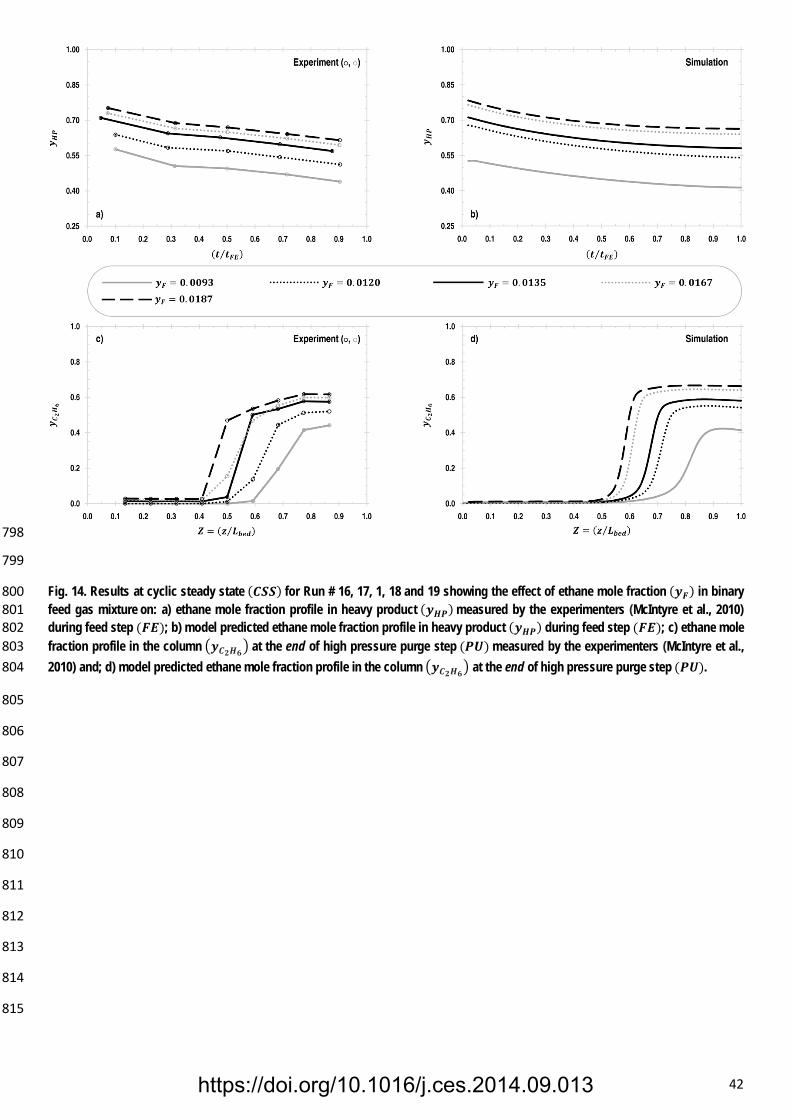
14c and 14d) lead to an increase in heavy product purity (Fig. 13a) and decrease in light product purity (Fig. 552
13b). The experimental and predicted instantaneous heavy product composition profile trends (depicted in 553
Fig. 14a and 14b) are also in agreement with one another. It can be observed that the volume of adsorbent 554
involved in the actual adsorption and desorption process increases with increase in 𝑦𝑦𝐹𝐹 . 555
556
Effect of dimensionless feed position (𝒁𝒁𝑭𝑭) 557
558
In all the 19 runs reported by McIntyre et al. (2010), the dimensionless feed position was fixed (𝑍𝑍𝐹𝐹 = 0.5). 559
Once the model was validated by comparative analysis of simulation and experimental results at 𝐶𝐶𝑆𝑆𝑆𝑆 , 560
additional simulations were performed to assess the effect of change in the dimensionless feed position (𝑍𝑍𝐹𝐹) 561
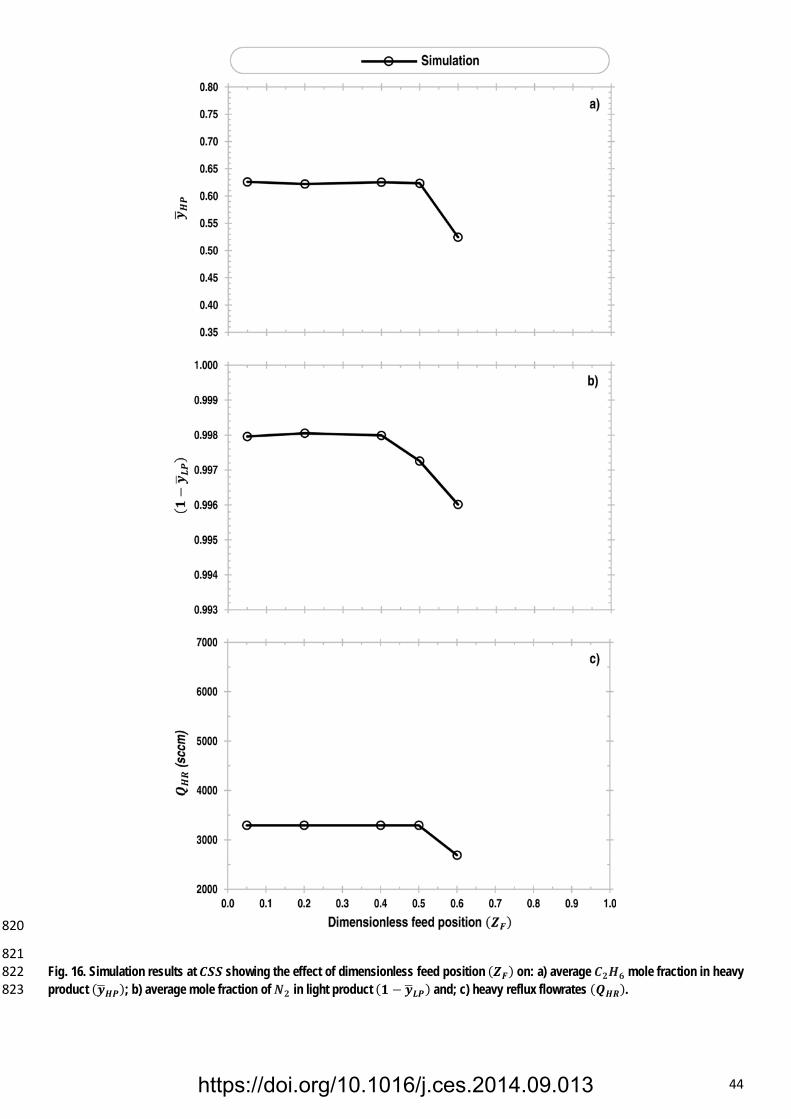
on process performance. The results of these simulations are presented in Fig. 16, 17 and 18. Note that, 562
except 𝑍𝑍𝐹𝐹, the values of all other operating parameters were identical to those of the base case (Run #1). 563
Since the total bed length (𝐿𝐿𝑏𝑏𝑏𝑏𝑏𝑏) was also held constant, by changing the dimensionless feed position we 564
actually change the lengths of the column sections. Such changes impact on the process performance in non-565
trivial way, as explained below. 566
567
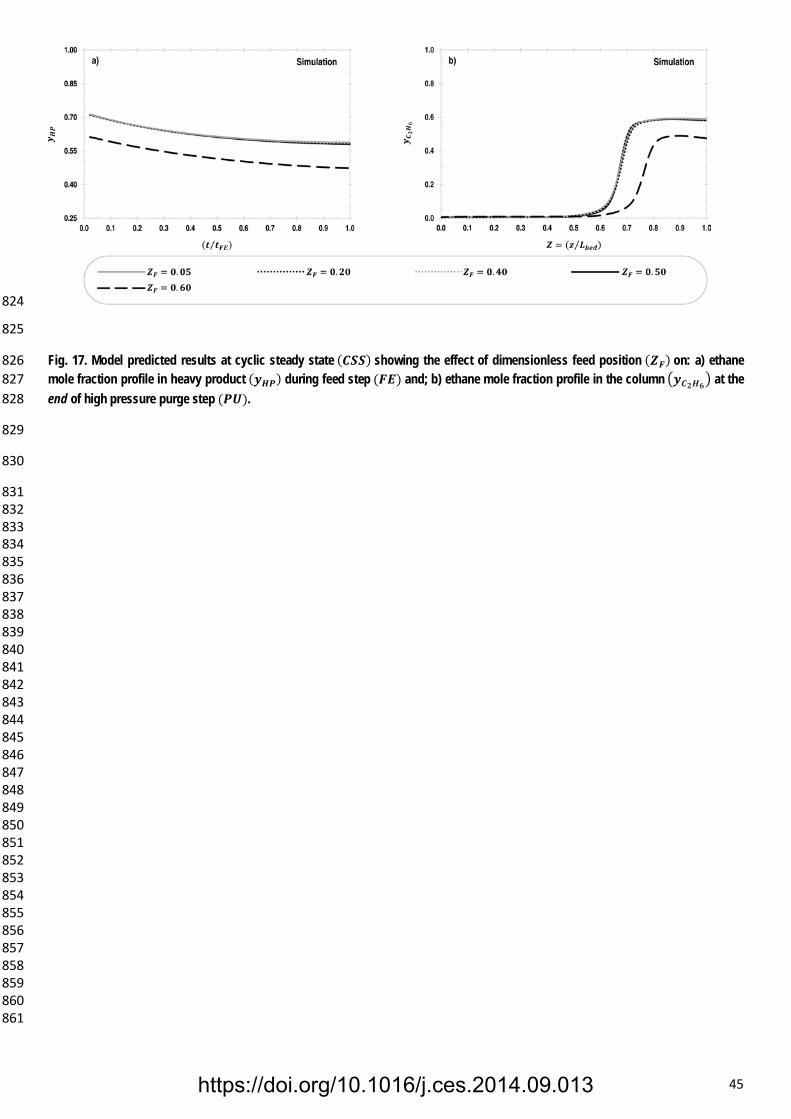
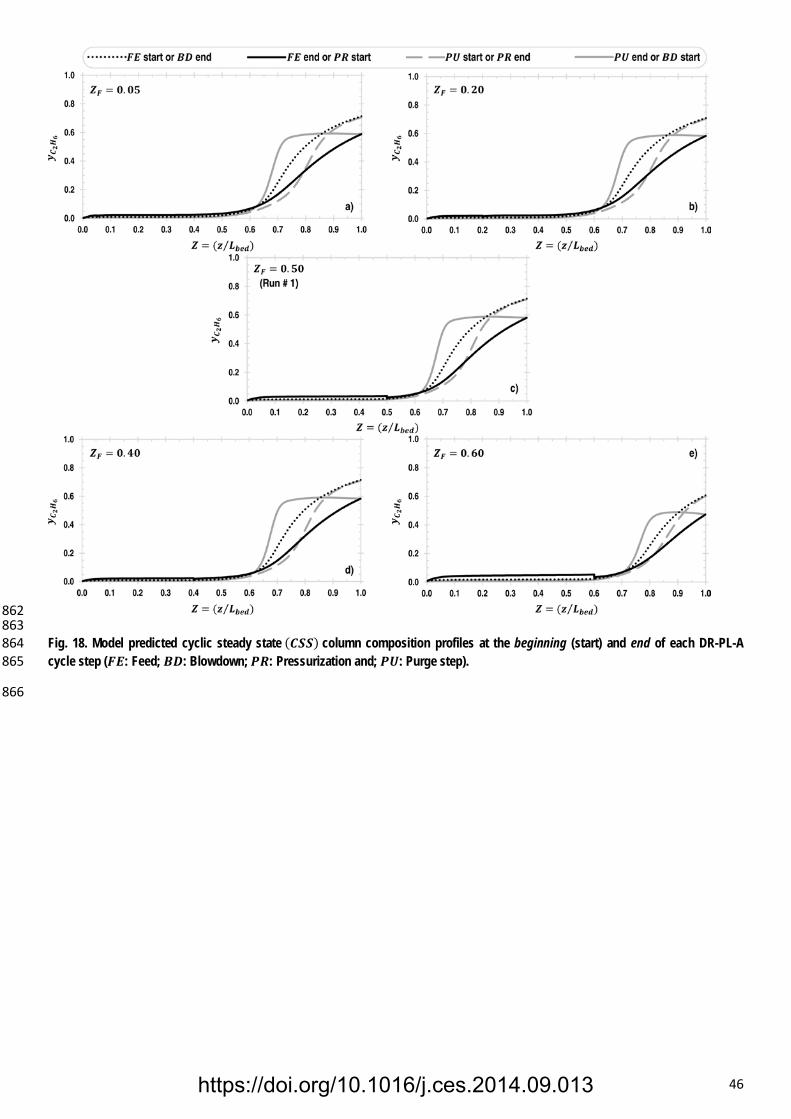
Notably, process performance remains unaffected for 𝑍𝑍𝐹𝐹 ≤ 0.5. This can be clearly understood by 568
examining the base case column composition profile reported by McIntyre et al. (2010) at the end of high 569
pressure purge (𝑃𝑃𝑃𝑃) step: it is nearly equal to the feed gas composition for 𝑍𝑍 ≤ 0.4. According to the DR-570
PL-A cycle description mentioned in section 2, after 𝑃𝑃𝑃𝑃 the bed is depressurized (𝐵𝐵𝐵𝐵) by removing gas 571
from the rectifying end (𝑍𝑍 = 1), and then the feed step (𝐹𝐹𝐹𝐹) starts. The base case simulation revealed that 572
the constant composition plateau at 𝑦𝑦𝐹𝐹 moves further right (towards 𝑍𝑍 = 1 end) during 𝐵𝐵𝐵𝐵 and extends till 573
https://doi.org/10.1016/j.ces.2014.09.013
22
𝑍𝑍 ≅ 0.5 at the start of 𝐹𝐹𝐹𝐹 (Fig. 18c). Since ethane concentration in the feed and column do not differ 574
significantly till this dimensionless position in the column, the process performance remains unaffected for 575
𝑍𝑍𝐹𝐹 ≤ 0.5 . This can be clearly understood by examining the instantaneous heavy product composition 576
profiles (Fig. 17a) and column composition profiles (Fig. 17b and 18a, 18b, 18c and 18d) for 𝑍𝑍𝐹𝐹 ≤ 0.5. 577
578
The picture changes when 𝑍𝑍𝐹𝐹 value beyond 0.5 is considered: 𝑁𝑁2 concentration in the rectifying section 579
(𝑅𝑅𝑆𝑆) increases (as evident from Fig. 17b, and 18e). Nitrogen, being the light component, desorbs much 580
quickly than ethane: then, the time required by the system to attain the low pressure (𝑃𝑃𝐿𝐿) set point (during 581
𝐹𝐹𝐹𝐹) reduces. Once 𝑃𝑃𝐿𝐿 is achieved by the system, 𝐻𝐻𝑅𝑅𝐹𝐹𝐶𝐶 closes 𝑉𝑉𝐻𝐻𝐻𝐻 (thereby ceasing 𝑄𝑄𝐻𝐻𝐻𝐻). Hence, although 582
𝑄𝑄𝐹𝐹 , 𝑄𝑄𝐻𝐻𝐻𝐻 and 𝑄𝑄𝐿𝐿𝐻𝐻 (equivalent to Run # 1) are constant, the decrease in 𝑄𝑄𝐻𝐻𝐻𝐻 (Fig. 16c) hampers the internal 583
recycle loop for 𝑍𝑍𝐹𝐹 value beyond 0.5. This causes the decline of 𝑦𝑦�𝐻𝐻𝐻𝐻 and (1 − 𝑦𝑦�𝐿𝐿𝐻𝐻) depicted in Fig. 16a) 584
and 16b), respectively. 585
586
7. Conclusions 587
588
A model developed in the frame of the commercial software Aspen Adsim® for the detailed simulation of 589
dual-reflux pressure swing adsorption process (DR-PSA) is presented. Model intricacies needed for the 590
detailed simulation of DR-PSA process are also elaborated. Even though the model can be readily applied 591
for simulating different DR-PSA configurations, we focused exclusively on DR-PL-A configuration (feed to 592
𝑃𝑃𝐿𝐿 and pressure swing with 𝐴𝐴). Simulations were performed after model adaptation to the experimental 593
apparatus and procedures reported by McIntyre et al. (2010) for recovery and enrichment of dilute ethane 594
from nitrogen. Detailed description of the approach used for simulating a reference case (the so-called base 595
case, Run # 1) is provided. 596
597
In accordance with the reported experimental modus operandi, 19 simulations were performed to analyze the 598
effects of different operating parameters on process performance: (i) light reflux flowrate (𝑄𝑄𝐿𝐿𝐻𝐻); (ii) feed or 599
purge step time �𝜕𝜕𝐹𝐹𝐹𝐹/𝐻𝐻𝑃𝑃�; (iii) heavy product flowrate (𝑄𝑄𝐻𝐻𝐻𝐻) and (iv) ethane mole fraction (𝑦𝑦𝐹𝐹) in the feed 600
mixture. At 𝐶𝐶𝑆𝑆𝑆𝑆, model predictions were found to be in good agreement with reported experimental results 601
https://doi.org/10.1016/j.ces.2014.09.013
23
in terms of: (i) average 𝐶𝐶2𝐻𝐻6 mole fraction in heavy product (𝑦𝑦�𝐻𝐻𝐻𝐻) and; (ii) average nitrogen mole fraction 602
in light product (1− 𝑦𝑦�𝐿𝐿𝐻𝐻). Pressure profile, 𝐶𝐶2𝐻𝐻6 mole fraction profile in the heavy product during 𝐹𝐹𝐹𝐹 and 603
𝐶𝐶2𝐻𝐻6 mole fraction profile in the column at the end of 𝑃𝑃𝑃𝑃 were also found to be qualitatively similar to the 604
experimental ones. For enhanced understanding of the process behavior, column composition profiles at the 605
end of each process cycle step are also provided for every run at 𝐶𝐶𝑆𝑆𝑆𝑆. Finally, since the feed position was 606
fixed in all the 19 runs reported by McIntyre et al. (2010), additional simulations were performed to assess 607
the effect of change in feed position on process performance. 608
609
610
Overall, the model exhibited reliability and versatility (it can be applied to different unit arrangements as 611
well as DR-PSA process configurations) thereby serving as an effective tool for process design, cost 612
diminution of laboratory and/or plant trails, and enhanced process understanding. 613
614
615
616
https://doi.org/10.1016/j.ces.2014.09.013
24
Notations 617
𝐴𝐴 strongly adsorbed species, heavy product/ component
𝐴𝐴𝑏𝑏𝑏𝑏𝑏𝑏 cross-sectional area of the adsorption column, m2
𝐵𝐵 weakly adsorbed species, light product/ component
𝐵𝐵𝐵𝐵 Blowdown step
𝐵𝐵𝐵𝐵𝐵𝐵 − 𝐼𝐼 Adsorption column depicted in Fig.1
𝐵𝐵𝐵𝐵𝐵𝐵 − 𝐼𝐼𝐼𝐼 Adsorption column depicted in Fig.1
𝑐𝑐𝑖𝑖 Bulk gas-phase concentration of component 𝑖𝑖, kmol/m3
𝐶𝐶𝑆𝑆𝑆𝑆 Cyclic steady state
𝐵𝐵𝑚𝑚𝑜𝑜𝑐𝑐𝑜𝑜𝑚𝑚𝑒𝑒 Diameter of each adsorption column, m
𝐵𝐵𝐾𝐾 Knudsen diffusion coefficient, m2/s
𝐵𝐵𝑀𝑀 Molecular diffusion coefficient, m2/s
𝐵𝐵𝐻𝐻 Macropore diffusion coefficient, m2/s
DR-PH-A dual-reflux pressure swing adsorption system with feed to high pressure bed and pressure swing using heavy gas
DR-PH-B dual-reflux pressure swing adsorption system with feed to high pressure bed and pressure swing using light gas
DR-PL-A dual-reflux pressure swing adsorption system with feed to low pressure bed and pressure swing using heavy gas
DR-PL-B dual-reflux pressure swing adsorption system with feed to low pressure bed and pressure swing using light gas
DR-PSA dual-reflux pressure swing adsorption
𝔽𝔽 represents that the interaction module is feeding back the recorded information
𝐹𝐹𝐹𝐹 Feed step
𝐻𝐻𝑃𝑃 Heavy product
𝐻𝐻𝑅𝑅 Heavy reflux
𝐻𝐻𝑅𝑅𝐹𝐹𝐶𝐶 Heavy reflux flowrate controller
𝐻𝐻𝑅𝑅𝐼𝐼 Heavy reflux interaction
𝐼𝐼 Interaction module
𝐼𝐼𝑃𝑃1 First isotherm parameter, mol/(kg.kPa)
𝐼𝐼𝑃𝑃2 Second isotherm parameter, 1/kPa
𝐾𝐾�𝐾𝐾,𝑖𝑖 Local Henry’s coefficient obtained from equilibrium isotherms, dimensionless
𝑘𝑘𝑀𝑀𝑇𝑇𝑀𝑀 Lumped, effective mass transfer coefficient, 1/s
𝑘𝑘𝑓𝑓 Film resistance coefficient , 1/s
𝐿𝐿𝑏𝑏𝑏𝑏𝑏𝑏 Length of each adsorption column, m
𝐿𝐿𝑃𝑃 Light product
𝐿𝐿𝑃𝑃𝐹𝐹𝐶𝐶 Light product flowrate controller
𝐿𝐿𝑅𝑅 Light reflux
𝐿𝐿𝑅𝑅𝐼𝐼 Light reflux interaction
𝐿𝐿𝐻𝐻𝑆𝑆 Length of rectifying section of the column, m
𝐿𝐿𝑆𝑆𝑆𝑆 Length of stripping section of the column, m
𝑀𝑀𝑚𝑚𝑏𝑏𝑎𝑎 Adsorbent weight, kg
𝑀𝑀𝑊𝑊 Molecular weight, kg/kmol
𝑁𝑁 Number of moles, kmol
𝑁𝑁𝐵𝐵𝐵𝐵 Total number of moles of gas released during Blowdown step, kmol
𝑁𝑁𝐻𝐻𝐻𝐻 Total number of moles of gas fed to the column during Pressurization step, kmol
https://doi.org/10.1016/j.ces.2014.09.013
25
𝑃𝑃 Pressure, total pressure, final pressure, kPa
𝑝𝑝 Partial pressure, kPa
𝑃𝑃𝐵𝐵𝐵𝐵,𝑏𝑏𝑒𝑒𝑏𝑏 Pressure at the end of blowdown step, kPa
𝑃𝑃𝐵𝐵𝐹𝐹 Partial differential equation
𝑃𝑃𝐻𝐻 High pressure, kPa
𝑃𝑃𝐼𝐼 Pressure interaction
PID Proportional-Integral-Derivative
𝑃𝑃𝐿𝐿 Low pressure, kPa
𝑃𝑃𝑅𝑅 Pressurization step
PSA Pressure swing adsorption
𝑃𝑃𝑃𝑃 Purge step
𝑄𝑄 Flowrate, sccm
𝑄𝑄𝐵𝐵𝐵𝐵 Flowrate of gas released during blowdown step, sccm
𝑄𝑄𝐵𝐵𝐵𝐵/𝐻𝐻𝐻𝐻 Flowrate of gas released during blowdown step or flowrate of gas fed to the column during pressurization step, sccm
𝑄𝑄𝐹𝐹 Flowrate of feed gas, sccm
𝑄𝑄𝐻𝐻,𝑜𝑜𝑜𝑜𝑜𝑜 Flowrate of gas released from the low pressure column during feed step, sccm
𝑄𝑄𝐻𝐻𝐻𝐻 Flowrate of heavy product, sccm
𝑄𝑄𝐻𝐻𝐻𝐻 Flowrate of heavy reflux, sccm
𝑞𝑞�𝑖𝑖 Particle-average concentration of species 𝑖𝑖 in adsorbed phase per unit mass of solid, kmol/kg
𝑞𝑞𝑖𝑖∗ Adsorbent loading of component 𝑖𝑖 which is in equilibrium with the gas-phase composition, kmol/kg
𝑄𝑄𝐿𝐿,𝑜𝑜𝑜𝑜𝑜𝑜 Flowrate of gas released from the column during purge step, sccm
𝑄𝑄𝐿𝐿𝐻𝐻 Flowrate of light product, sccm
𝑄𝑄𝐿𝐿𝐻𝐻 Flowrate of light reflux, sccm
𝑄𝑄𝐻𝐻𝐻𝐻 Flowrate of gas fed to the column during pressurization step, sccm
𝑅𝑅 Universal gas constant, (kPa.m3)/(kmol.K)
ℝ represents that the interaction module is recording information
𝑅𝑅𝐵𝐵 Reynolds number, dimensionless
𝑟𝑟𝐻𝐻 Radius of adsorbent particle, mm
𝑟𝑟𝐻𝐻 ,𝑚𝑚𝑚𝑚𝑚𝑚 Radius of macropores in adsorbent particle, m
𝑅𝑅𝑆𝑆 Rectifying section
s represents time in seconds
sec represents time in seconds
sccm represents flowrate in standard cubic centimeters per minute, std cm3/min
𝑆𝑆ℎ Sherwood number, dimensionless
𝑆𝑆𝑐𝑐 Schmid number, dimensionless
𝑆𝑆𝑆𝑆 Stripping section
𝑅𝑅 Temperature, K
𝜕𝜕 Time, s
𝜕𝜕𝑚𝑚𝑐𝑐𝑚𝑚𝑐𝑐𝑏𝑏 Time of one DR-PS-A cycle, s
𝜕𝜕𝐹𝐹𝐹𝐹 Feed step duration, s
𝜕𝜕𝐹𝐹𝐹𝐹/𝐻𝐻𝑃𝑃 Feed or purge step duration, s
𝜕𝜕𝐻𝐻𝑃𝑃 Purge step duration, s
𝑉𝑉𝑏𝑏𝑏𝑏𝑏𝑏 Adsorbent bed volume, m3
https://doi.org/10.1016/j.ces.2014.09.013
26
𝑉𝑉𝐹𝐹 represents the valve through which feed material flows
𝑣𝑣𝑔𝑔 Gas-phase superficial velocity, m/s
𝑉𝑉𝑚𝑚𝑏𝑏𝑎𝑎𝑜𝑜+𝑚𝑚𝑚𝑚𝑚𝑚𝑚𝑚𝑜𝑜 Mesoporous and macroporous volumes, m3/kg
𝑦𝑦 Mole fraction of heavy component in any stream, final composition (in terms of mole fraction of heavy component), specific concentration value, dimensionless
𝑦𝑦𝑀𝑀2𝐻𝐻6 Mole fraction of 𝐶𝐶2𝐻𝐻6, dimensionless
𝑦𝑦� Average mole fraction of heavy component in any stream, dimensionless
𝑦𝑦𝑖𝑖 Bulk gas-phase mole fraction of component 𝑖𝑖, dimensionless
𝑦𝑦𝐹𝐹 Mole fraction of heavy component in binary feed gas mixture, dimensionless
𝑦𝑦�𝐻𝐻𝐻𝐻 Average mole fraction of heavy component in heavy product stream, dimensionless
𝑦𝑦𝐻𝐻𝐻𝐻 Mole fraction of heavy component in heavy product stream, dimensionless
𝑦𝑦�𝐿𝐿𝐻𝐻 Average mole fraction of heavy component in light product stream, dimensionless
(1 − 𝑦𝑦�𝐿𝐿𝐻𝐻) Average mole fraction of light component in light product stream, dimensionless
𝑍𝑍 axial co-ordinate normalized with respect to column length, dimensionless
𝑧𝑧 position along the length of the adsorption column, axial co-ordinate, m
𝑍𝑍 = 0 Stripping section end of the column, light material is either injected-in or is released at this position during the process, dimensionless
𝑍𝑍 = 1 Rectifying section end of the column, heavy material is either injected-in or is released at this position during the process, dimensionless
𝑍𝑍𝐹𝐹 Feed injection position along the length of the adsorption column, dimensionless 618 619 Greek letters 620 621 𝜀𝜀𝑖𝑖 Interstitial (or external) porosity of the adsorbent, dimensionless
𝜀𝜀𝐻𝐻 Adsorbent particle porosity, dimensionless
𝜀𝜀𝑇𝑇 Total bed voidage, dimensionless
𝜓𝜓 Shape factor of adsorbent particle, dimensionless
𝜌𝜌 Density, kg/m3
𝜌𝜌𝐵𝐵 Bulk density of adsorbent, kg/m3
𝜌𝜌𝑔𝑔 Molar gas-phase density, kmol/m3
𝜌𝜌𝑆𝑆 Solid density of adsorbent, kg/m3
𝜏𝜏 Tortuosity of adsorbent particle, dimensionless
𝜇𝜇 Dynamic viscosity, kg/(m.s) 622 623 Symbols 624 625 represents closed valve or nonfunctional interaction
represents open valve at designated or controlled flowrate 626
627
628
https://doi.org/10.1016/j.ces.2014.09.013
27
References 629
Bhatt, T.S., Storti, G., Rota, R., 2013. Optimal design of dual-reflux pressure swing adsorption units via equilibrium theory. 630
Chemical Engineering Science 102, 42-55. 631
Diagne, D., Goto, M., Hirosi, T., 1994. New PSA process with intermediate feed inlet position and operated with dual refluxes: 632
application to carbon dioxide removal and enrichment. Journal of Chemical Engineering Japan 27 (1), 85–89. 633
Diagne, D., Goto, M., Hirosi, T., 1995a. Experimental study of simultaneous removal and concentration of CO2 by an improved 634
pressure swing adsorption process. Energy Conversion and Management 36, 431–434. 635
Diagne, D., Goto, M., Hirosi, T., 1995b. Parametric studies on CO2 separation and recovery by a dual reflux PSA process 636
consisting of both rectifying and stripping sections. Industrial and Engineering Chemistry Research 34, 3083–3089. 637
Diagne, D., Goto, M., Hirosi, T., 1996. Numerical analysis of a dual refluxed PSA process during simultaneous removal and 638
concentration of carbon dioxide dilute gas from air. Journal of Chemical Technology and Biotechnology 65, 29–38. 639
Ebner, A.D., Ritter, J.A., 2002. Equilibrium theory analysis of rectifying PSA for heavy component production. A.I.Ch.E. Journal 640
48 (8), 1679–1691. 641
Ebner, A.D., Ritter, J.A., 2004. Equilibrium theory analysis of dual reflux PSA for separation of a binary mixture. A.I.Ch.E. 642
Journal 50 (10), 2418–2429. 643
Ergun, S. (1952). Fluid flow through packed columns. Chemical Engineering Progress, 48(2), 89-94. 644
Hou, X., Liu, X., Liu, Z., Yan, F., Yuan, X.J., 2010. Flow field simulation and experimental evaluation of carbon canister based 645
on FLUENT. Computational Intelligence and Software Engineering (CiSE), International Conference 1, 4. 646
Kearns, D.T., Webley, P.A., 2006. Modeling and evaluation of dual-reflux pressure swing adsorption cycles: Part I. Mathematical 647
models. Chemical Engineering Science 61, 7223-33. 648
Knaebel, K.S., Hill, F.B., 1985. Pressure swing adsorption: development of an equilibrium theory for gas separations. Chemical 649
Engineering Science 40 (12), 2351–2360. 650
Leavitt, F.W., 1992. Duplex Adsorption Process. US Patent 5,085,674. 651
McIntyre, J.A., Holland, C.E., Ritter, J.A., 2002. High enrichment and recovery of dilute hydrocarbons by dual-reflux pressure-652
swing adsorption. Industrial and Engineering Chemistry Research 41, 3499–3504. 653
McIntyre, J.A., Ebner, A.D., Ritter, J.A., 2010. Experimental study of a dual reflux enriching pressure swing adsorption process 654
for concentrating dilute feed streams. Industrial & Engineering Chemistry Research 49 (4), 1848–1858. 655
Rhee, H.K., Aris R., and Amundson N.R., 1986. First-order partial differential equations, Vol. 1, Prentice-Hall, Englewood Cliffs, 656
NJ. 657
Ruthven, D.M., Farooq, S., Knaebel, K.S., 1994. Pressure Swing Adsorption, VCH Publishers, New York, NY. 658
Sivakumar, S.V., Rao, D.P., 2011a. Modified Duplex PSA. 1. Sharp separation and process intensification for CO2–N2–13X 659
zeolite system. Industrial & Engineering Chemistry Research 50, 3426–3436. 660
https://doi.org/10.1016/j.ces.2014.09.013
28
Sivakumar, S.V., Rao, D.P., 2011b. Modified duplex PSA. 2. Sharp separation and process intensification for N2–O2–5A zeolite 661
system. Industrial & Engineering Chemistry Research 50, 3437–3445. 662
663
Sivakumar, S.V., Rao, D.P., 2012. Adsorptive separation of gas mixtures: mechanistic view, sharp separation and process 664
intensification. Chemical Engineering and Processing 53, 31–52. 665
Skarstrom, C.W., 1959. Use of adsorption phenomena in automatic plant-type gas analysers. Annals of the New York Academy of 666
Sciences 72, 751–763. 667
Spoorthi, G., Thakur, R.S., Kaistha, N., Rao, D.P., 2011. Process intensification in PSA processes for upgrading synthetic landfill 668
and lean natural gases. Adsorption 17, 121–133. 669
Subramanian, D., Ritter, J.A., 1997. Equilibrium theory for solvent vapor recovery by pressure swing adsorption: analytical 670
solution for process performance. Chemical Engineering Science 52 (18), 3147–3160. 671
Thakur, R.S., Kaistha, N., Rao, D.P., 2011. Process intensification in duplex pressure swing adsorption. Computers and Chemical 672
Engineering 35, 973–983. 673
Tolles, E.D., Collins, E.A., Williams, R.S., 2009. Packed adsorbent systems with low flow resistance. International patent 674
PCT/US2009/041002. 675
Wilhelm, M., Soltmann, C., Koch, D., Grathwohl, G., 2005. Ceramers—functional materials for adsorption techniques. Journal of 676
the European Ceramic Society, 25 (2), 271-276. 677
Yang, R. T., Doong, S. J., 1985. Gas separation by pressure swing adsorption: A pore-diffusion model for bulk separation. AIChE 678
31 (11), 1829–1842. 679
Yoshida, M., Ritter, J.A., Kodama, A., Goto, M., Hirose, T., 2003. Enriching reflux and parallel equalization PSA process for 680
concentrating trace components in air. Industrial and Engineering Chemistry Research 42, 1795–1803. 681
Zhang, W., Thompson, K. E., Reed, A. H., Beenken, L., 2006. Relationship between packing structure and porosity in fixed beds 682
of equilateral cylindrical particles. Chemical Engineering Science, 61(24), 8060-8074. 683
684
685
686
687
https://doi.org/10.1016/j.ces.2014.09.013
29
688
Fig. 1. DR-PL-A cycle steps and flows. 689 690
691
692
693
694
695
696
https://doi.org/10.1016/j.ces.2014.09.013
30
697
Fig. 2. Schematic representation of DR-PL-A process simulation flowsheet. 698
699
700
701
702
703
704
705
706
707
https://doi.org/10.1016/j.ces.2014.09.013
31
708
Fig. 3. Base case (Run # 1) results at 𝑪𝑪𝑪𝑪𝑪𝑪 during one DR-PL-A cycle. a) Simulation and experimental pressure profiles and b) 709 simulated flow pattern of various streams (𝑭𝑭𝑭𝑭: Feed; 𝑩𝑩𝑩𝑩: Blowdown; 𝑷𝑷𝑳𝑳: Pressurization and; 𝑷𝑷𝑷𝑷: Purge step). 710
https://doi.org/10.1016/j.ces.2014.09.013
32
711
Fig. 4. Simulation and/or experimental (McIntyre et al., 2010) results at 𝑪𝑪𝑪𝑪𝑪𝑪 for Run # 1 to 6 showing the effect of light reflux flowrate 712 (𝑸𝑸𝑳𝑳𝑳𝑳) on: a) average 𝑪𝑪𝟐𝟐𝑯𝑯𝟔𝟔 mole fraction in heavy product (𝒚𝒚�𝑯𝑯𝑷𝑷); b) average mole fraction of 𝑵𝑵𝟐𝟐 in light product (𝟏𝟏 − 𝒚𝒚�𝑳𝑳𝑷𝑷) and; c) 713 heavy reflux flowrates (𝑸𝑸𝑯𝑯𝑳𝑳). 714
https://doi.org/10.1016/j.ces.2014.09.013
33
715
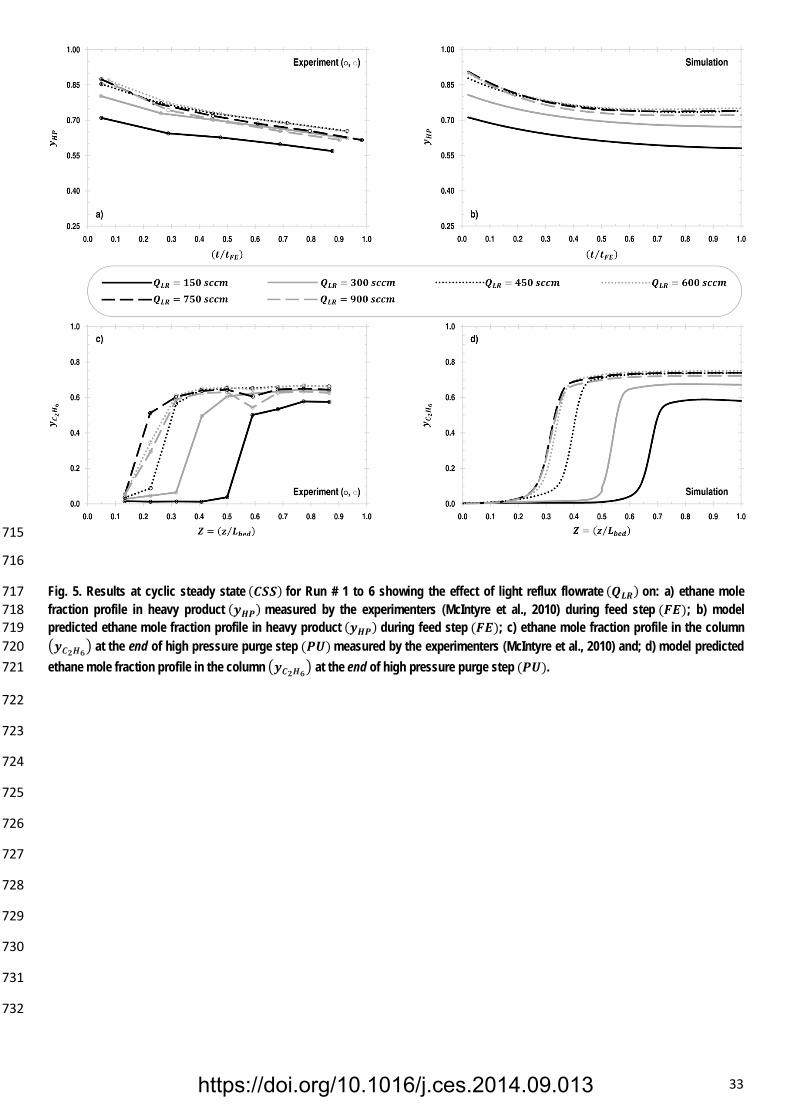
716
Fig. 5. Results at cyclic steady state (𝑪𝑪𝑪𝑪𝑪𝑪) for Run # 1 to 6 showing the effect of light reflux flowrate (𝑸𝑸𝑳𝑳𝑳𝑳) on: a) ethane mole 717 fraction profile in heavy product (𝒚𝒚𝑯𝑯𝑷𝑷) measured by the experimenters (McIntyre et al., 2010) during feed step (𝑭𝑭𝑭𝑭); b) model 718 predicted ethane mole fraction profile in heavy product (𝒚𝒚𝑯𝑯𝑷𝑷) during feed step (𝑭𝑭𝑭𝑭); c) ethane mole fraction profile in the column 719 �𝒚𝒚𝑪𝑪𝟐𝟐𝑯𝑯𝟔𝟔� at the end of high pressure purge step (𝑷𝑷𝑷𝑷) measured by the experimenters (McIntyre et al., 2010) and; d) model predicted 720 ethane mole fraction profile in the column �𝒚𝒚𝑪𝑪𝟐𝟐𝑯𝑯𝟔𝟔� at the end of high pressure purge step (𝑷𝑷𝑷𝑷). 721
722
723
724
725
726
727
728
729
730
731
732
https://doi.org/10.1016/j.ces.2014.09.013
34
733
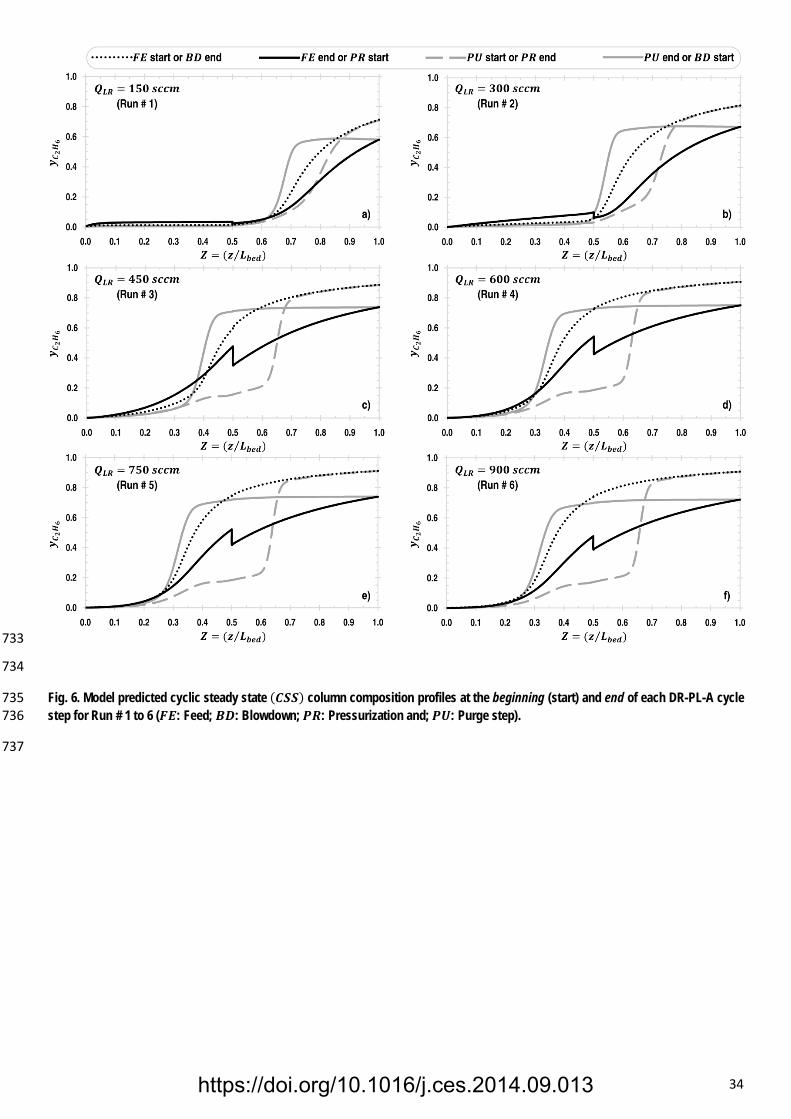
734
Fig. 6. Model predicted cyclic steady state (𝑪𝑪𝑪𝑪𝑪𝑪) column composition profiles at the beginning (start) and end of each DR-PL-A cycle 735 step for Run # 1 to 6 (𝑭𝑭𝑭𝑭: Feed; 𝑩𝑩𝑩𝑩: Blowdown; 𝑷𝑷𝑳𝑳: Pressurization and; 𝑷𝑷𝑷𝑷: Purge step). 736
737
https://doi.org/10.1016/j.ces.2014.09.013
35
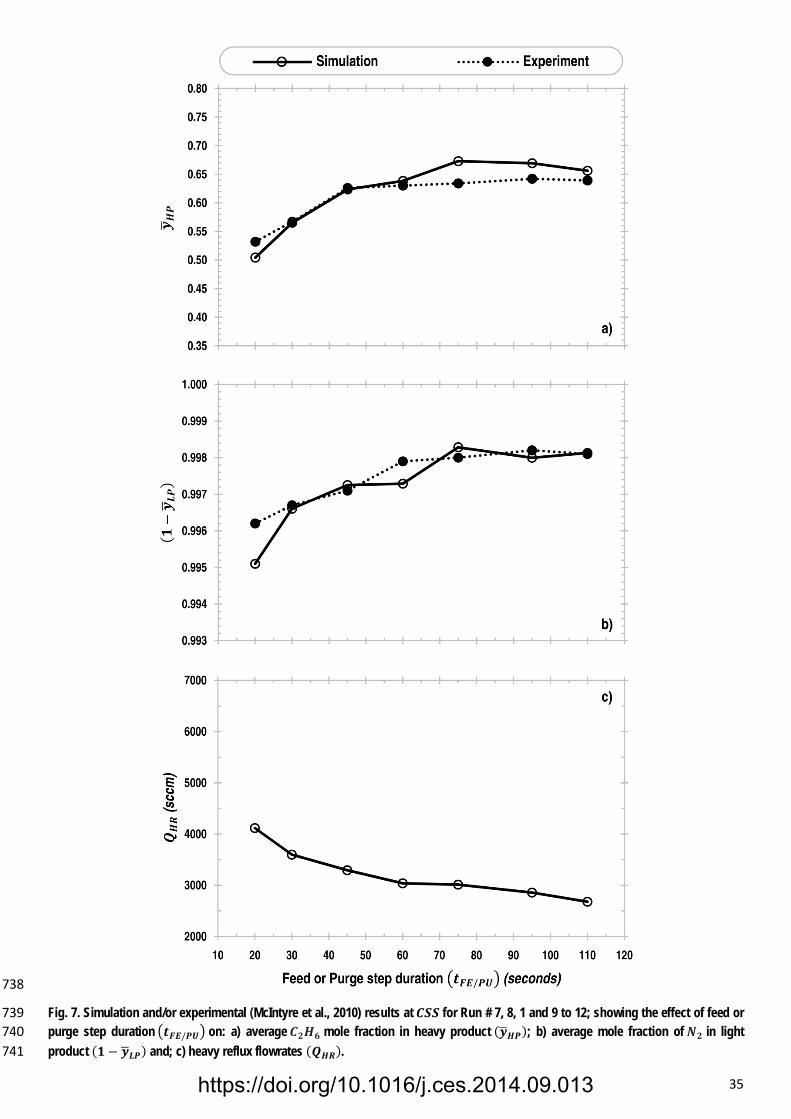
738
Fig. 7. Simulation and/or experimental (McIntyre et al., 2010) results at 𝑪𝑪𝑪𝑪𝑪𝑪 for Run # 7, 8, 1 and 9 to 12; showing the effect of feed or 739 purge step duration �𝒕𝒕𝑭𝑭𝑭𝑭/𝑷𝑷𝑷𝑷� on: a) average 𝑪𝑪𝟐𝟐𝑯𝑯𝟔𝟔 mole fraction in heavy product (𝒚𝒚�𝑯𝑯𝑷𝑷); b) average mole fraction of 𝑵𝑵𝟐𝟐 in light 740 product (𝟏𝟏 − 𝒚𝒚�𝑳𝑳𝑷𝑷) and; c) heavy reflux flowrates (𝑸𝑸𝑯𝑯𝑳𝑳). 741
https://doi.org/10.1016/j.ces.2014.09.013
36
742
743 744
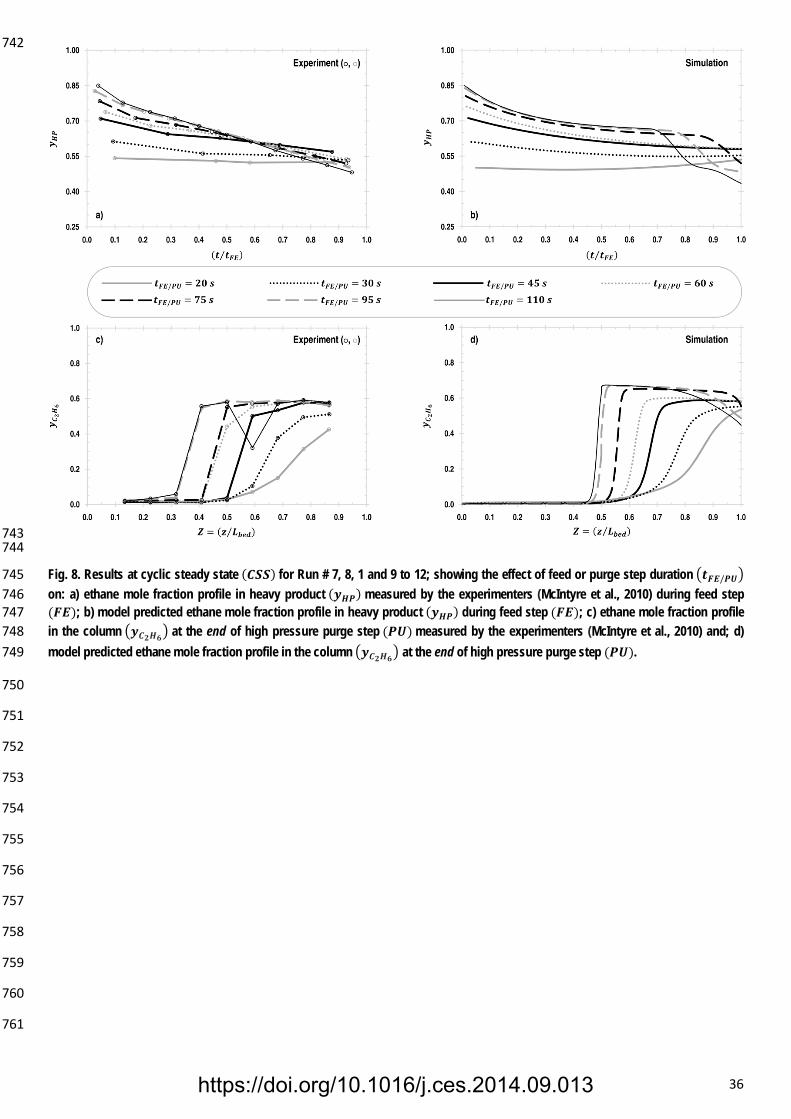
Fig. 8. Results at cyclic steady state (𝑪𝑪𝑪𝑪𝑪𝑪) for Run # 7, 8, 1 and 9 to 12; showing the effect of feed or purge step duration �𝒕𝒕𝑭𝑭𝑭𝑭/𝑷𝑷𝑷𝑷� 745 on: a) ethane mole fraction profile in heavy product (𝒚𝒚𝑯𝑯𝑷𝑷) measured by the experimenters (McIntyre et al., 2010) during feed step 746 (𝑭𝑭𝑭𝑭); b) model predicted ethane mole fraction profile in heavy product (𝒚𝒚𝑯𝑯𝑷𝑷) during feed step (𝑭𝑭𝑭𝑭); c) ethane mole fraction profile 747 in the column �𝒚𝒚𝑪𝑪𝟐𝟐𝑯𝑯𝟔𝟔� at the end of high pressure purge step (𝑷𝑷𝑷𝑷) measured by the experimenters (McIntyre et al., 2010) and; d) 748 model predicted ethane mole fraction profile in the column �𝒚𝒚𝑪𝑪𝟐𝟐𝑯𝑯𝟔𝟔� at the end of high pressure purge step (𝑷𝑷𝑷𝑷). 749
750
751
752
753
754
755
756
757
758
759
760
761
https://doi.org/10.1016/j.ces.2014.09.013
37
762
763
Fig. 9. Model predicted cyclic steady state (𝑪𝑪𝑪𝑪𝑪𝑪) column composition profiles at the beginning (start) and end of each DR-PL-A cycle 764 step for Run # 7, 8, 1 and 9 to 12 (𝑭𝑭𝑭𝑭: Feed; 𝑩𝑩𝑩𝑩: Blowdown; 𝑷𝑷𝑳𝑳: Pressurization and; 𝑷𝑷𝑷𝑷: Purge step). 765
766
https://doi.org/10.1016/j.ces.2014.09.013
38
767
Fig. 10. Simulation and/or experimental (McIntyre et al., 2010) results at 𝑪𝑪𝑪𝑪𝑪𝑪 for Run # 13, 1, 14 and 15 showing the effect of heavy 768 product flowrate (𝑸𝑸𝑯𝑯𝑷𝑷) on: a) average 𝑪𝑪𝟐𝟐𝑯𝑯𝟔𝟔 mole fraction in heavy product (𝒚𝒚�𝑯𝑯𝑷𝑷); b) average mole fraction of 𝑵𝑵𝟐𝟐 in light product 769 (𝟏𝟏 − 𝒚𝒚�𝑳𝑳𝑷𝑷) and; c) heavy reflux flowrates (𝑸𝑸𝑯𝑯𝑳𝑳). 770
https://doi.org/10.1016/j.ces.2014.09.013
39
771
772
Fig. 11. Results at cyclic steady state (𝑪𝑪𝑪𝑪𝑪𝑪) for Run # 13, 1, 14 and 15 showing the effect of heavy product flowrate (𝑸𝑸𝑯𝑯𝑷𝑷) on: a) 773 ethane mole fraction profile in heavy product (𝒚𝒚𝑯𝑯𝑷𝑷) measured by the experimenters (McIntyre et al., 2010) during feed step (𝑭𝑭𝑭𝑭); b) 774 model predicted ethane mole fraction profile in heavy product (𝒚𝒚𝑯𝑯𝑷𝑷) during feed step (𝑭𝑭𝑭𝑭); c) ethane mole fraction profile in the 775 column �𝒚𝒚𝑪𝑪𝟐𝟐𝑯𝑯𝟔𝟔� at the end of high pressure purge step (𝑷𝑷𝑷𝑷) measured by the experimenters (McIntyre et al., 2010) and; d) model 776 predicted ethane mole fraction profile in the column �𝒚𝒚𝑪𝑪𝟐𝟐𝑯𝑯𝟔𝟔� at the end of high pressure purge step (𝑷𝑷𝑷𝑷). 777
778
779
780
781
782
783
784
785
786
787
788
https://doi.org/10.1016/j.ces.2014.09.013
40
789
790
Fig. 12. Model predicted cyclic steady state (𝑪𝑪𝑪𝑪𝑪𝑪) column composition profiles at the beginning (start) and end of each DR-PL-A 791 cycle step for Run # 13, 1, 14 and 15 (𝑭𝑭𝑭𝑭: Feed; 𝑩𝑩𝑩𝑩: Blowdown; 𝑷𝑷𝑳𝑳: Pressurization and; 𝑷𝑷𝑷𝑷: Purge step). 792
793
https://doi.org/10.1016/j.ces.2014.09.013
41
794
Fig. 13. Simulation and/or experimental (McIntyre et al., 2010) results at 𝑪𝑪𝑪𝑪𝑪𝑪 for Run # 16, 17, 1, 18 and 19 showing the effect of 795 ethane mole fraction (𝒚𝒚𝑭𝑭) in binary feed gas mixture on: a) average 𝑪𝑪𝟐𝟐𝑯𝑯𝟔𝟔 mole fraction in heavy product (𝒚𝒚�𝑯𝑯𝑷𝑷); b) average mole 796 fraction of 𝑵𝑵𝟐𝟐 in light product (𝟏𝟏 − 𝒚𝒚�𝑳𝑳𝑷𝑷) and; c) heavy reflux flowrates (𝑸𝑸𝑯𝑯𝑳𝑳). 797
https://doi.org/10.1016/j.ces.2014.09.013
42
798
799
Fig. 14. Results at cyclic steady state (𝑪𝑪𝑪𝑪𝑪𝑪) for Run # 16, 17, 1, 18 and 19 showing the effect of ethane mole fraction (𝒚𝒚𝑭𝑭) in binary 800 feed gas mixture on: a) ethane mole fraction profile in heavy product (𝒚𝒚𝑯𝑯𝑷𝑷) measured by the experimenters (McIntyre et al., 2010) 801 during feed step (𝑭𝑭𝑭𝑭); b) model predicted ethane mole fraction profile in heavy product (𝒚𝒚𝑯𝑯𝑷𝑷) during feed step (𝑭𝑭𝑭𝑭); c) ethane mole 802 fraction profile in the column �𝒚𝒚𝑪𝑪𝟐𝟐𝑯𝑯𝟔𝟔� at the end of high pressure purge step (𝑷𝑷𝑷𝑷) measured by the experimenters (McIntyre et al., 803 2010) and; d) model predicted ethane mole fraction profile in the column �𝒚𝒚𝑪𝑪𝟐𝟐𝑯𝑯𝟔𝟔� at the end of high pressure purge step (𝑷𝑷𝑷𝑷). 804
805
806
807
808
809
810
811
812
813
814
815
https://doi.org/10.1016/j.ces.2014.09.013
43
816
817
Fig. 15. Model predicted cyclic steady state (𝑪𝑪𝑪𝑪𝑪𝑪) column composition profiles at the beginning (start) and end of each DR-PL-A 818 cycle step for Run # 16, 17, 1, 18 and 19 (𝑭𝑭𝑭𝑭: Feed; 𝑩𝑩𝑩𝑩: Blowdown; 𝑷𝑷𝑳𝑳: Pressurization and; 𝑷𝑷𝑷𝑷: Purge step). 819
https://doi.org/10.1016/j.ces.2014.09.013
44
820
821 Fig. 16. Simulation results at 𝑪𝑪𝑪𝑪𝑪𝑪 showing the effect of dimensionless feed position (𝒁𝒁𝑭𝑭) on: a) average 𝑪𝑪𝟐𝟐𝑯𝑯𝟔𝟔 mole fraction in heavy 822 product (𝒚𝒚�𝑯𝑯𝑷𝑷); b) average mole fraction of 𝑵𝑵𝟐𝟐 in light product (𝟏𝟏 − 𝒚𝒚�𝑳𝑳𝑷𝑷) and; c) heavy reflux flowrates (𝑸𝑸𝑯𝑯𝑳𝑳). 823
https://doi.org/10.1016/j.ces.2014.09.013
45
824
825
Fig. 17. Model predicted results at cyclic steady state (𝑪𝑪𝑪𝑪𝑪𝑪) showing the effect of dimensionless feed position (𝒁𝒁𝑭𝑭) on: a) ethane 826 mole fraction profile in heavy product (𝒚𝒚𝑯𝑯𝑷𝑷) during feed step (𝑭𝑭𝑭𝑭) and; b) ethane mole fraction profile in the column �𝒚𝒚𝑪𝑪𝟐𝟐𝑯𝑯𝟔𝟔� at the 827 end of high pressure purge step (𝑷𝑷𝑷𝑷). 828
829
830
831 832 833 834 835 836 837 838 839 840 841 842 843 844 845 846 847 848 849 850 851 852 853 854 855 856 857 858 859 860 861
https://doi.org/10.1016/j.ces.2014.09.013
46
862 863 Fig. 18. Model predicted cyclic steady state (𝑪𝑪𝑪𝑪𝑪𝑪) column composition profiles at the beginning (start) and end of each DR-PL-A 864 cycle step (𝑭𝑭𝑭𝑭: Feed; 𝑩𝑩𝑩𝑩: Blowdown; 𝑷𝑷𝑳𝑳: Pressurization and; 𝑷𝑷𝑷𝑷: Purge step). 865
866
https://doi.org/10.1016/j.ces.2014.09.013
47
867 868
Table 1. Parameter values used for all simulations. 869
870
871
872
873
874
875
876
877
878
879
880
881
882
883
884
https://doi.org/10.1016/j.ces.2014.09.013
48
885
886
Table 2. Values of the operating parameters used in Run # 1 (Base Case) to Run # 19. Parameters in bold italics in a column indicate 887 the group of runs used to study the effect of that parameter on process performance. This table is the identical to Table 2 reported by 888 McIntyre et al. (2010). 889
890
891
892
893
894
895
896
897
898
https://doi.org/10.1016/j.ces.2014.09.013

49
899
900
Table 3. Modus operandi of various valves and interaction models during different steps in the cycle organizer. ‘’ represents closed 901 valve or nonfunctional interaction; ‘’ represents open valve at designated or controlled flowrate; ‘ℝ’ represents that the interaction 902 model is recording information and ‘𝔽𝔽’ represents that the interaction model is feeding back the recorded information. 903
https://doi.org/10.1016/j.ces.2014.09.013