Embed Size (px)
Citation preview
Structure architecture interpretation of the middle Frio Formation using 3D seismic attributes and well logs: an example from the Texas Gulf Coast of the United States HAMED EL-MOWAFY1 and KURT J. MARFURT2
1 Department of Geology, Al-Azhar University, Cairo, Egypt; Consultant Geoscientist,
Apache Egypt Companies. E-mail: [email protected]
2 ConocoPhillips School of Geology and Geophysics, University of Oklahoma. E-mail:
kmarfurt @ou.edu
The introduction of 3D seismic techniques three decades ago greatly enhanced our
ability to image complex subsurface structure and stratigraphy in petroleum provinces around
the world. 3D seismic provides an efficient tool in the recognition and recovery of reserves in
both the new and mature oil fields (Nestvold, 1996). 3D seismic helps reduce dry-hole risk
resulting in better well placement. 3D seismic can also add reserves in mature producing
fields such as Stratton and Agua Dulce fields in the Texas Gulf Coast of the United States.
While the success of 3D seismic data as an exploration and development tool has been
demonstrated many times, it is important to continue documenting this success in different
geologic terranes. Therefore, the objective of this work is to show how 3D seismic data
acquired in the Texas Gulf Coast sedimentary basin results in better subsurface structural
images that were impossible to fully interpret from 2D seismic data and well logs.
Integrated approaches that use high quality data sets have a great promise for better
reservoir development and exploitation especially in mature fields such as Stratton and Agua
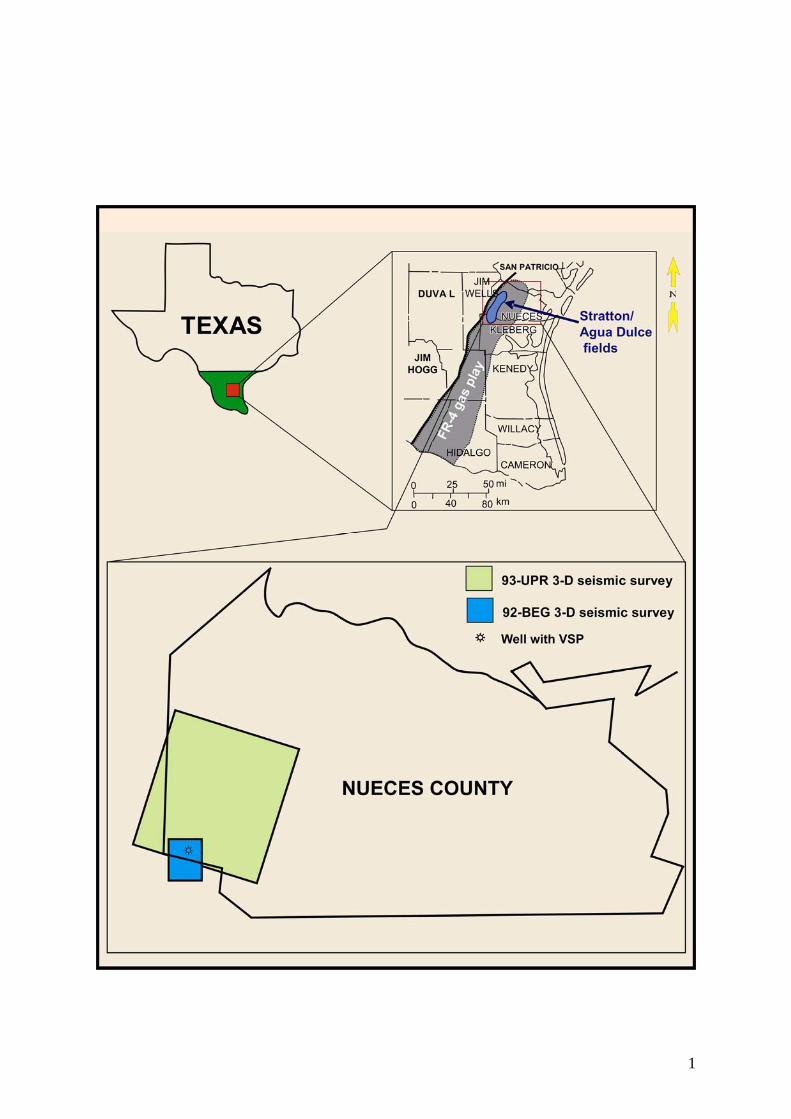
Dulce in south Texas. In the Stratton and Agua Dulce field area (Figure 1), two 3D seismic
surveys resulted in imaging previously undefined small-scale faults at the middle Frio level
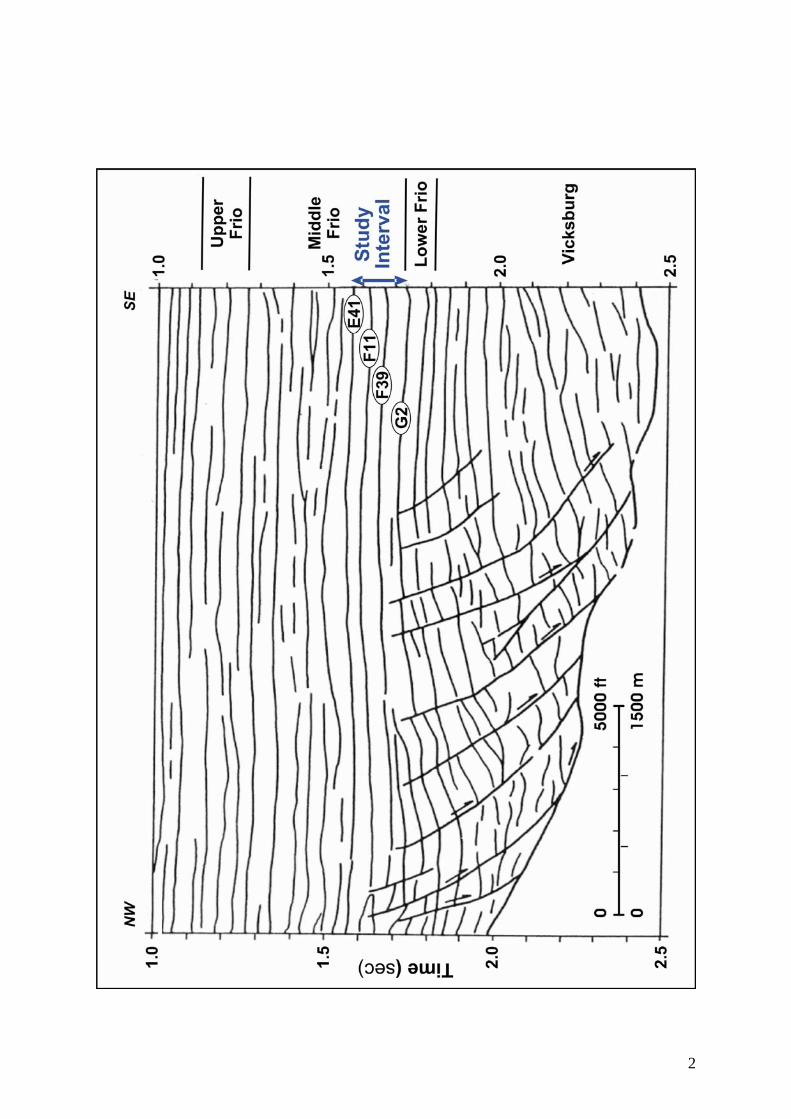
that may have resulted in more reservoir compartmentalization. Previous analysis of well logs
and 2D seismic sections in the Wardner lease of Stratton field indicate that faults die out at
the lower Frio stratigraphic level and rarely extend upward into the middle Frio; the amount
1
of fault throw is usually small and fault block rotation is minimal (Levey et al., 1993, Figure
2). We will use our 3D seismic surveys to validate this earlier interpretation.
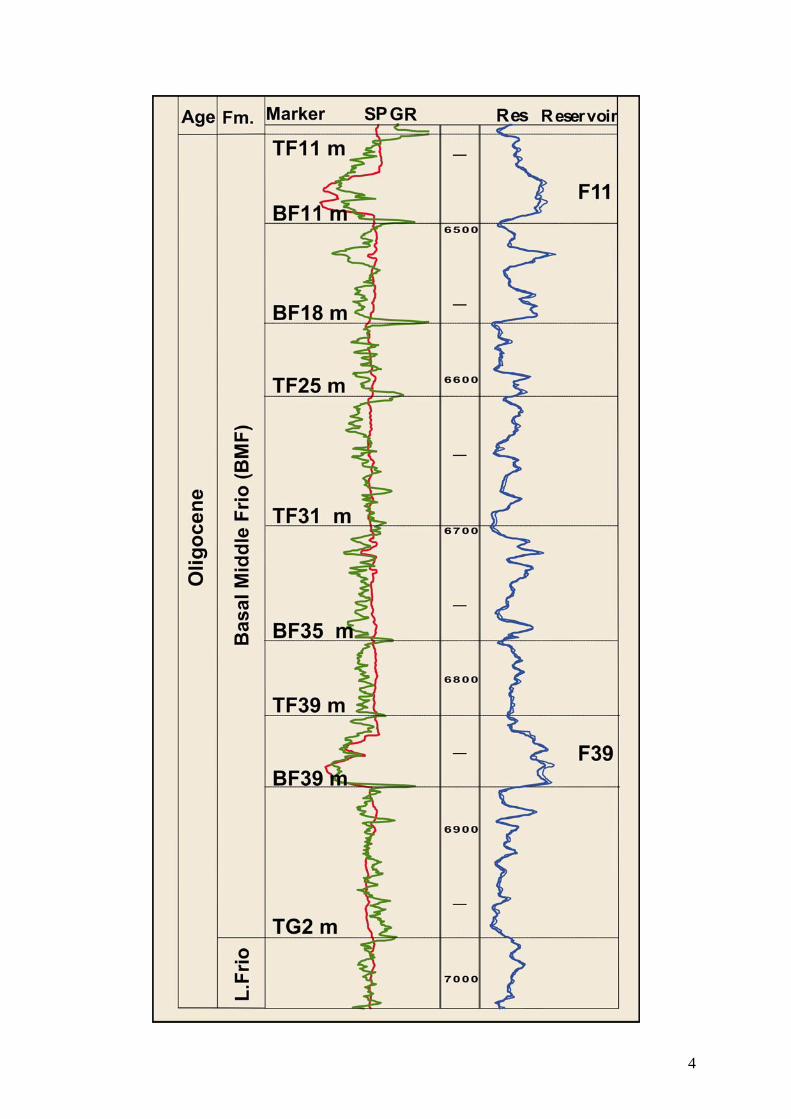
The Oligocene middle Frio Formation is a major hydrocarbon producer in the Gulf
Coast of the United States. At Stratton field, the middle Frio Formation consists of multiple
vertically-stacked reservoir sequences. The target stratigraphic interval for investigation is the
basal part of the middle Frio Formation (BMF) interval between the G2 (top lower Frio) and
the F11 horizons (Figure 3). The structural setting of the middle Frio Formation in the study
area is represented by growth faults and associated rollover anticlines.
The complex internal architecture of the middle Frio fluvial reservoirs along with the
structure complexity caused by growth faults may result in bypassed reservoirs or
compartments that have potential reserve growth. Previous studies by Levey, et al.(1993)
showed that untapped and incompletely drained reserves were encountered in the middle Frio
reservoirs. Such results inspire the use of 3D seismic to search for additional by-passed gas
resources in the BMF interval in the Stratton field area.
We used two post-stack final-time-migration 3D seismic surveys to develop a
detailed structure architecture interpretation of the middle Frio (Figure 1). The first survey is
a 90 mi2 (235 km2) 3D data set provided by Anadarko Petroleum Corporation which was
original shot in 1993 by Union Pacific Resources (UPR) Company and processed by Western
Geophysical. The second is a 7.6 mi2 (20 km2) public domain 3D seismic survey acquired in
1992 by the State of Texas Bureau of Economic Geology (BEG) at the University of Texas at
Austin and processed by Mercury International Technology Company in Tulsa, Oklahoma.
This latter ‘public domain’ survey is readily accessible through the BEG and has been the
subject of dozens of published geophysics and geology papers. It is our hope that by
presenting this smaller BEG survey in the context of the larger UPR survey, that we might
inspire others to further refine the interpretation of the smaller BEG survey.
2
INTERPRETATION OF THE MIDDLE FRIO STRUCTURE ARCHITECTURE
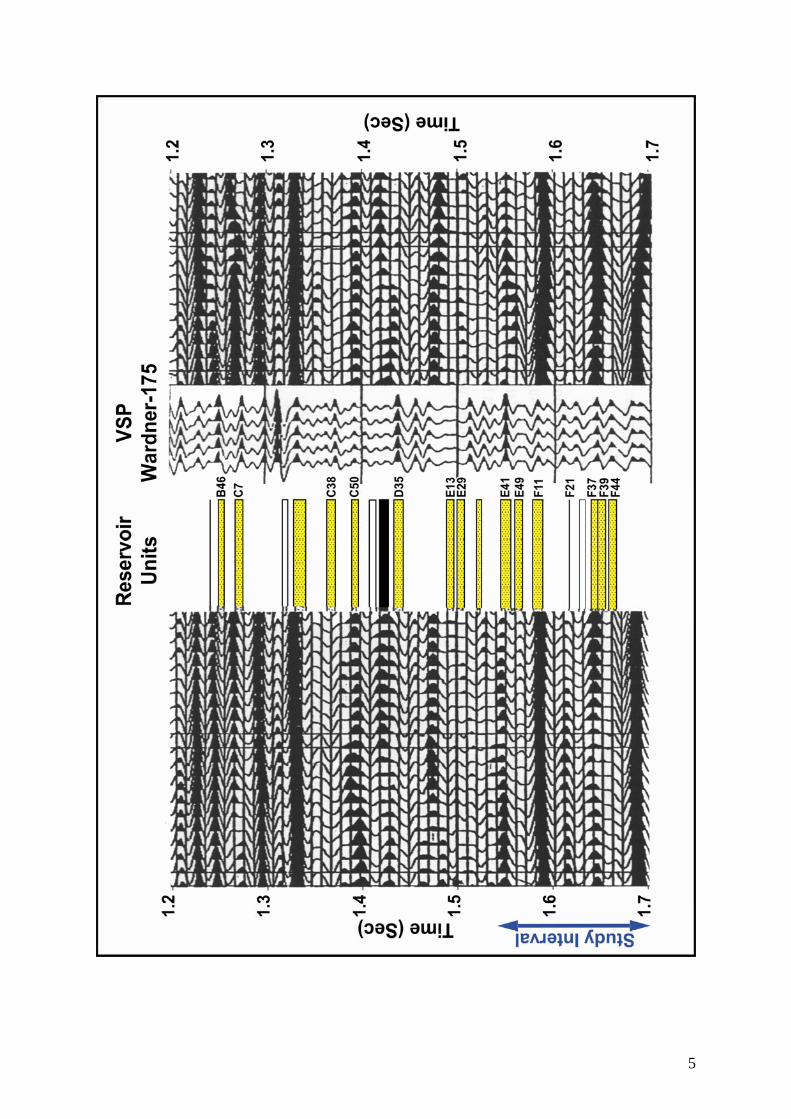
We used the vertical seismic profile (VSP) (Figure 4) acquired by the BEG at the
Wardner 175 well in Stratton field to directly tie the seismic data to the geologic horizons.
The Wardner 175 well with the VSP lies in the heart of the BEG survey and on the southern
border of the UPR survey. The two 3D seismic surveys (BEG and UPR) used in the
interpretation partially overlap in the northern Stratton field area (Figure 1).
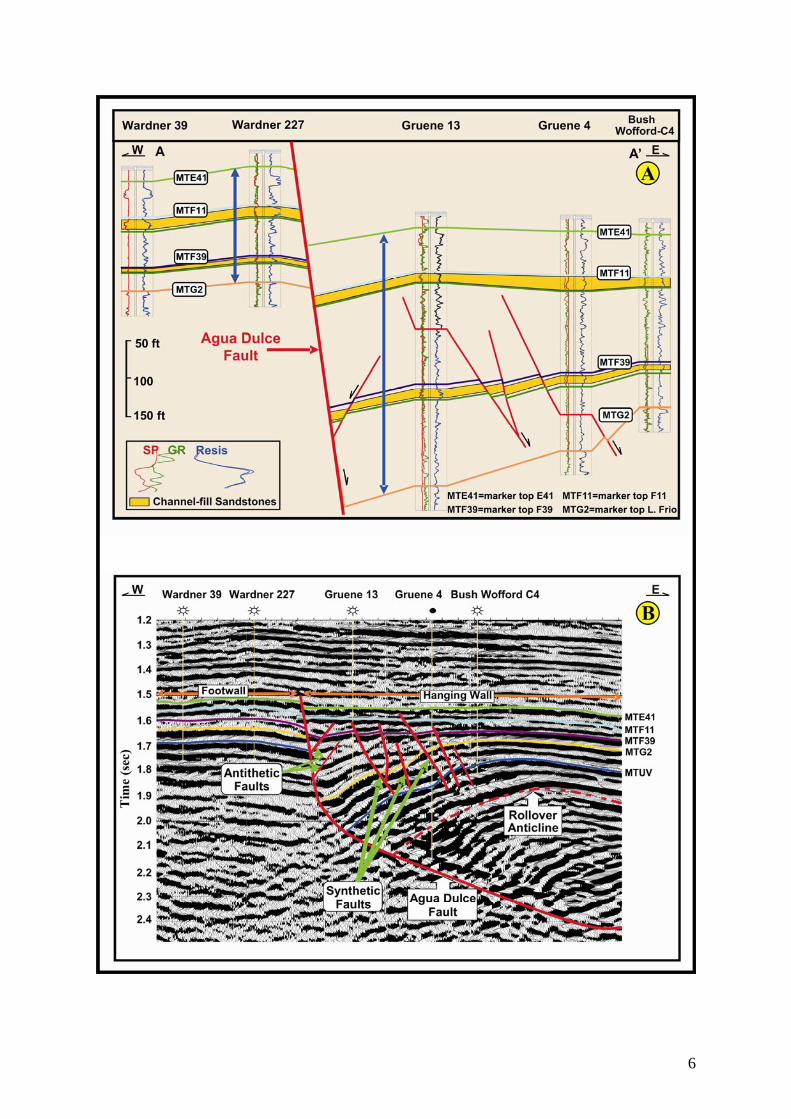
Major and Subsidiary Faults: Syndepositional or Post-Depositional? The geological
cross section (Figure 5a) illustrates the change in thickness of the interval between the marker
top E41 horizon (MTE41) and the marker top lower Frio horizon (G2) in both the hanging
wall and footwall sides of the Agua Dulce (AD) fault. Note the change in thickness of the
BMF interval in the hanging wall side at different locations relative to the AD fault. The
coincident arbitrary seismic line (Figure 5b) also illustrates that the AD fault has significant
control over total thickness variation at different locations with respect to the fault.
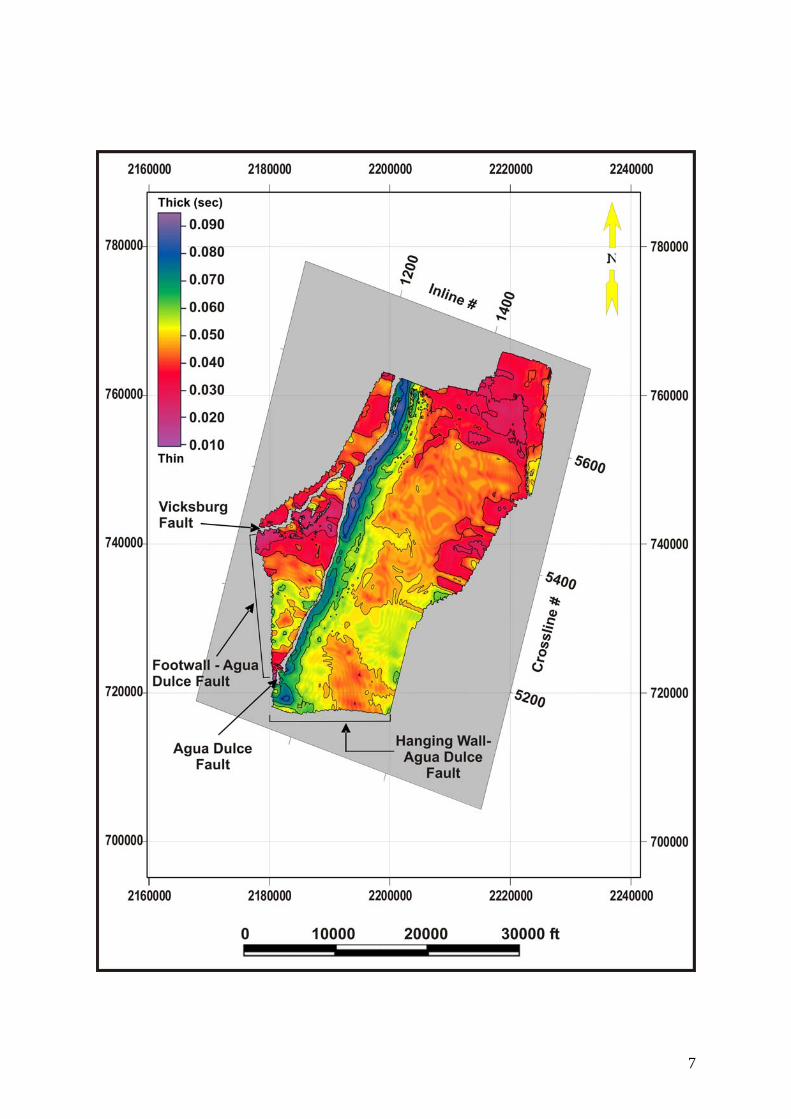
Our BMF isochron maps indicate a thick sediment section that was deposited in a
time when structurally low areas provided greater accommodation space. The thin sediment
section was deposited in a time when structurally high areas resulted in little to no deposition
of sediments corresponding to significantly smaller accommodation space. The F11-F39
vertical section (Figure 5) and isochron map (Figure 6) generated using both seismic and well
log data show thickening between reflectors on the hanging wall side of the AD fault,
suggesting that the fault was syndepositional.
To test whether or not the synthetic and antithetic faults associated with the major
growth faults were active during deposition we constructed two geological cross sections
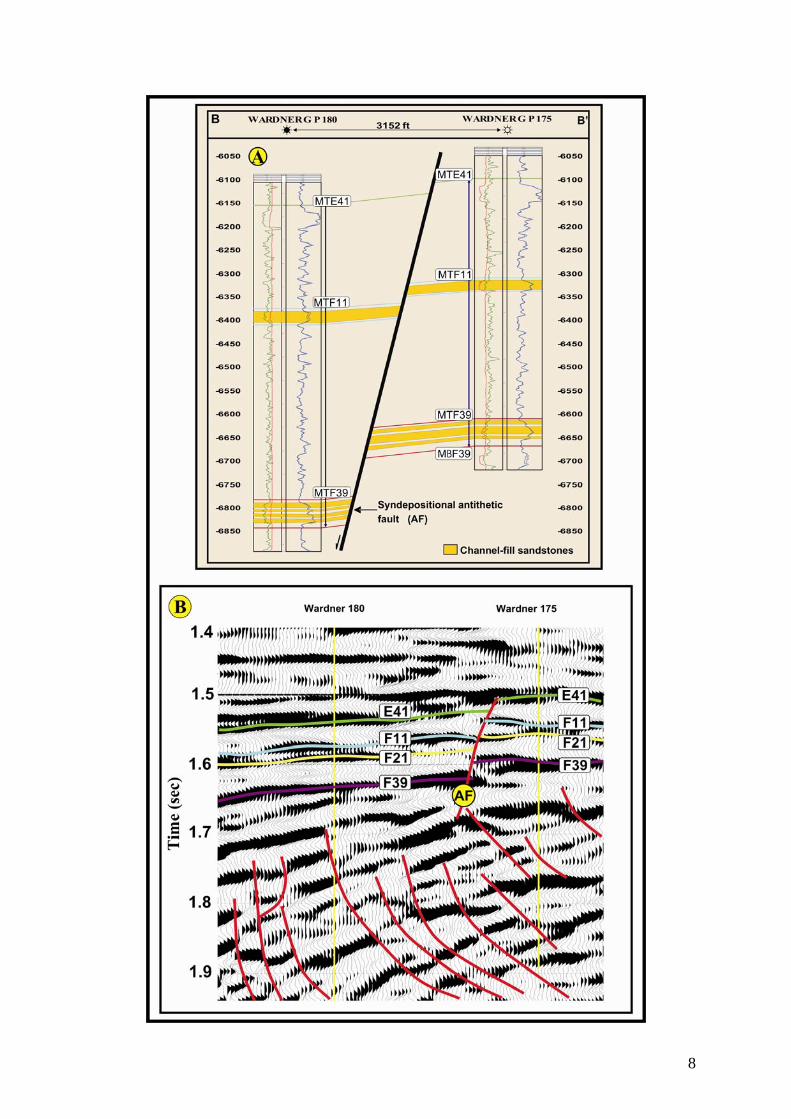
along with the coincident arbitrary seismic lines (Figures 7 and 8). Correlating the middle
3
Frio horizons (Figure 7a) indicates that the gross thickness of the interval between the marker
top E41 horizon (MTE41) and the marker base F39 horizon (MBF39) is thicker by 126 ft (38
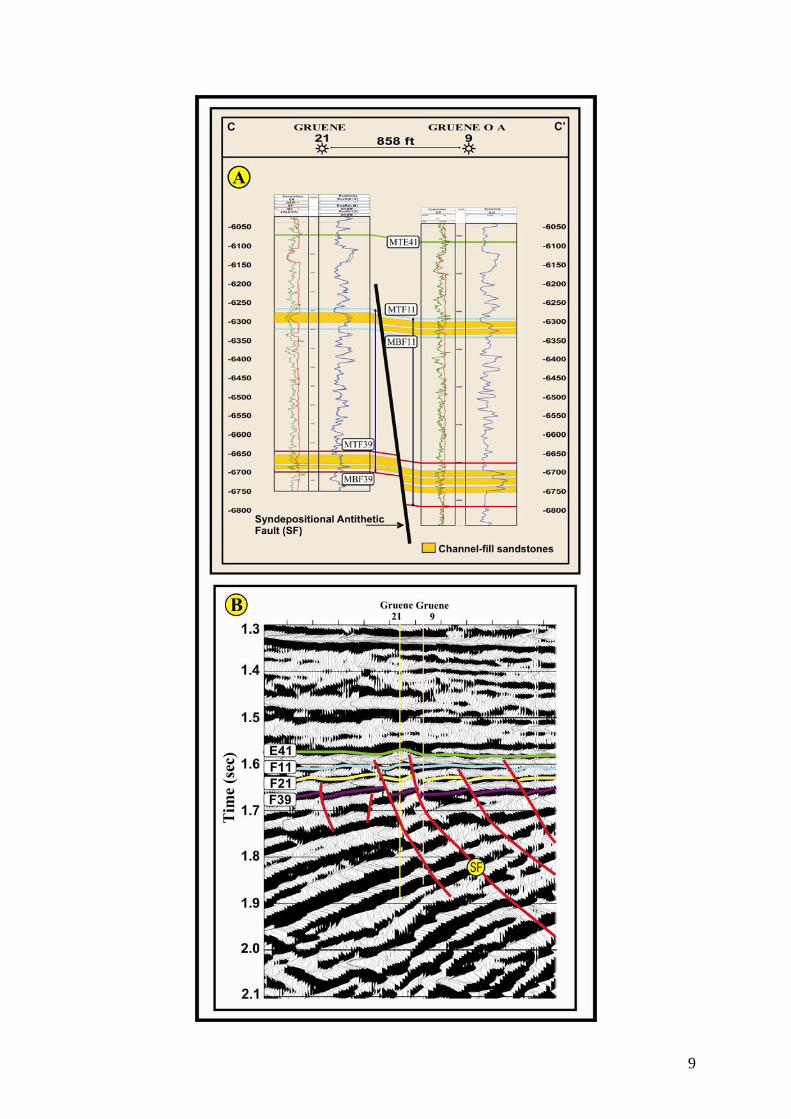
m) in the hanging wall of the antithetic fault than in the footwall block. In Figure 8a the
gross thickness of the interval between the top F11 and the base F39 in well Gruene 9 in the
hanging wall block of the synthetic fault B is 44 ft (13 m) thicker than the same interval in
well Gruene 21 located in the footwall block. These two examples indicate that the synthetic
and antithetic faults associated with the major AD growth fault are not just accommodation
faults but they are syndepositional faults that cut through the BMF interval (the interval
between G2 and F11).
Further investigation is needed to determine if these secondary faults are conduits or
seals to the migrating hydrocarbons in the Stratton and Agua Dulce fields. The middle Frio
Formation is composed of fluvial deposits in the form of point bar and crevasse splay
sandstones isolated within floodplain mudstones and siltstones. This heterogeneity makes it
possible that even a small amount of vertical fault offsets will juxtapose low-permeability
floodplain deposits against permeable sandstone reservoir rocks. Therefore, small vertical
offsets along these faults may form lateral flow barriers. Another way in which these
synthetic and antithetic faults may compartmentalize the middle Frio reservoirs is by
providing seals which follow the fault as gouge or cemented breccias which formed along
fault planes due to mechanical breakdown of rock during fault movement. Therefore the
secondary faults interpreted from the 3D seismic data sets (Figures 5-8) may impact the
lateral continuity and result in more compartmentalization of the middle Frio meandering
fluvial sandstone reservoirs. Coupled with an appropriate depositional model, mapping the
structural and stratigraphic complexity with the aid of the 3D seismic data of the BMF
interval can help better image and develop fluvial reservoirs in the Stratton and Agua Dulce
fields’ area and in the Texas Gulf Coast at large.
4
Structure framework. While the previously constructed structure maps on top of shallower
middle Frio horizons -- based on well data only -- clearly showed the AD fault, the more
subtle synthetic and antithetic faults were not recognized. Figure 9 is a structure contour map
showing Yang’s (1998) structure configuration of the F11 horizon in Stratton field. Other
than the major AD fault, there is only one minor fault mapped in the southeast corner of the
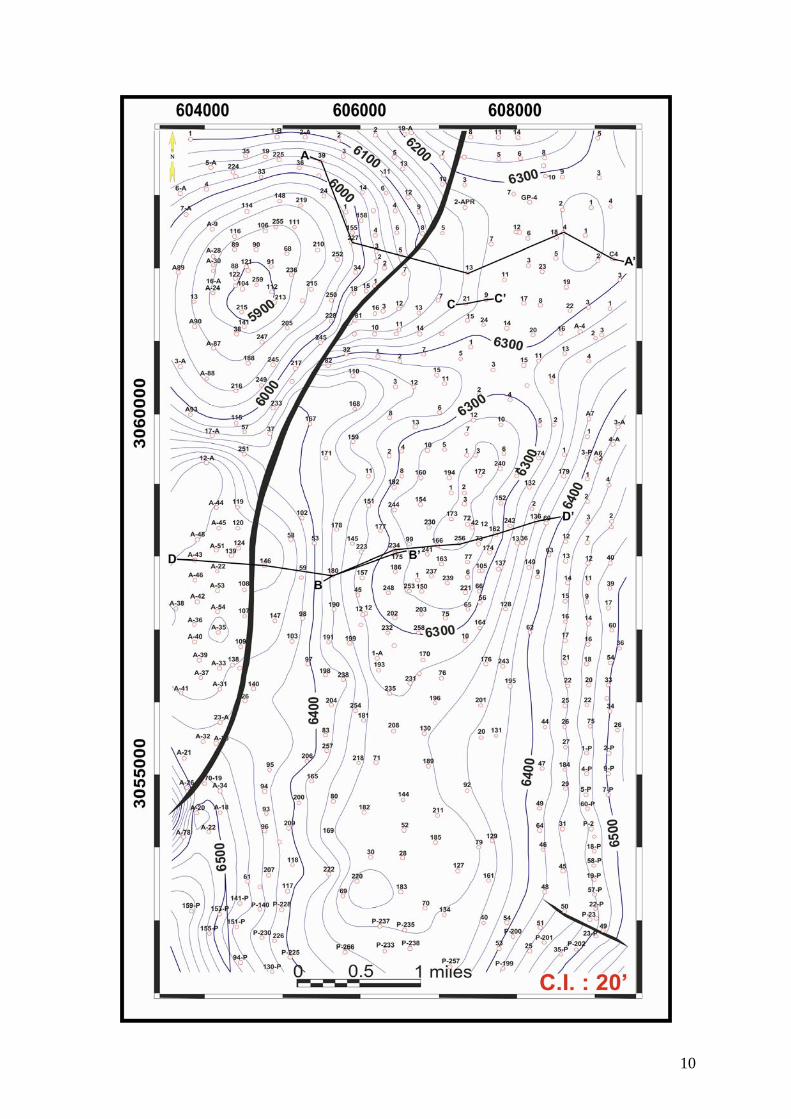
map. Figure 10 is a two-way time structure map constructed for the same F11 horizon in the
Stratton and Agua Dulce fields’ area from the BEG and the UPR 3D seismic surveys. This
map shows two major faults bounding the western side of the image area and several subtle
faults that were not shown before, at the F11 stratigraphic level and scattered at different
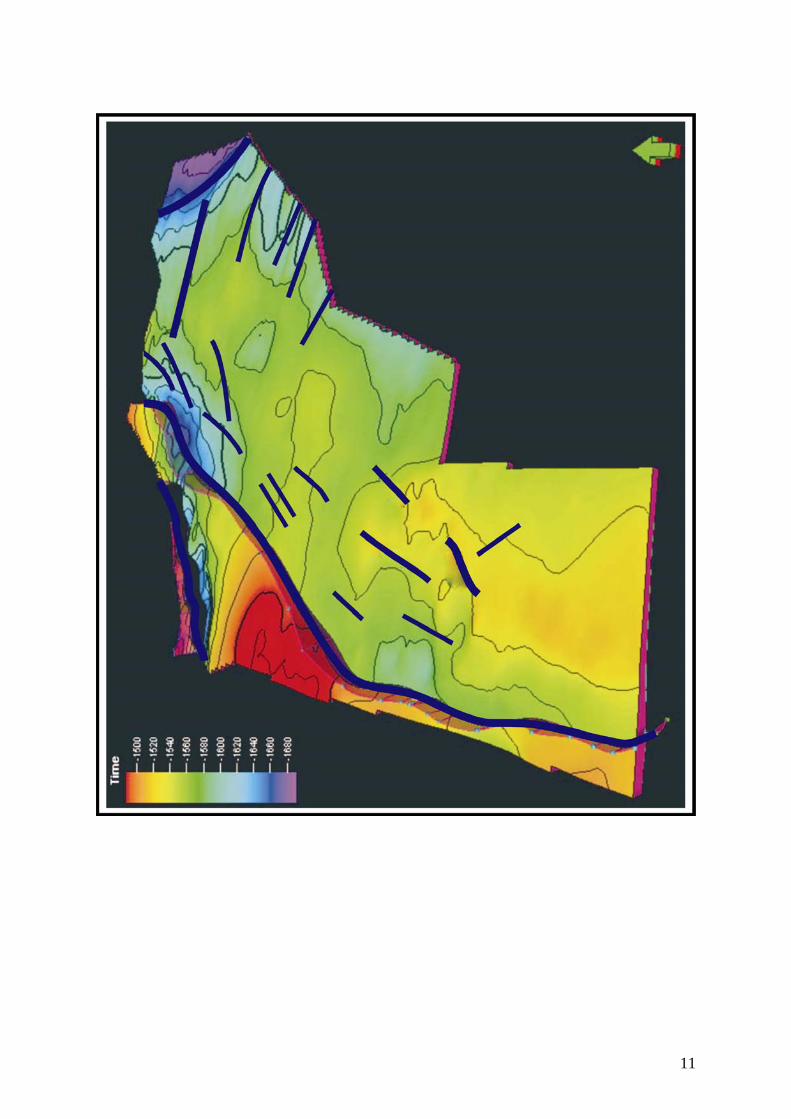
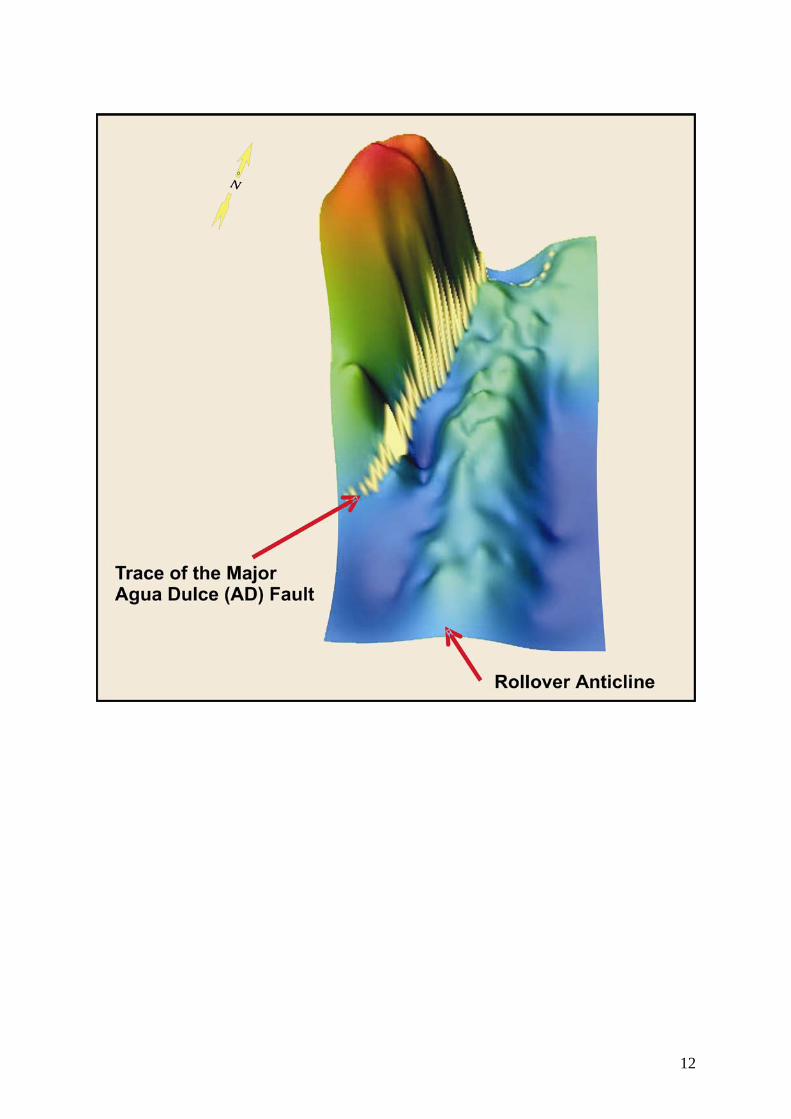
parts of the rollover anticlinal structure in the hanging wall side of the AD fault. Figure 11 is
a 3D view of the F11 horizon mapped from the BEG 3D seismic survey. Note that the surface
irregularities in the rollover anticline reflect the locations of subtle faults in the hanging wall
of the AD fault. At the deeper horizons of the middle Frio Formation (such as the F39
horizon shown in Figures 7b and 8b) the hanging wall deformation is more pronounced than
at shallower horizons. Based on seismic data only, the structure of the F39 horizon exhibits
rollover amplitudes (structural closures) that range from 150 ft (46 m) to 700 ft (213 m). At
the shallower F11 stratigraphic level, the rollover amplitudes decrease and range from 50 ft
(15 m) to 500 ft (152 m).
Nature of the growth faults. 3D seismic data volumes provide detailed information on the
imaged subsurface rock volume. In the vertical sections it gives the best view of structure
style and picking of events across the faults. In the horizontal sections it aids in accurate
delineation of fault blocks and thus results in accurate well placement. As shown from the
previous maps and cross sections (Figures 5-11), the major growth faults affect the BMF
interval and younger sediments. The nature of the subsidiary synthetic and antithetic faults is
5
estimated by looking at several vertical seismic lines from both the UPR and the BEG 3D
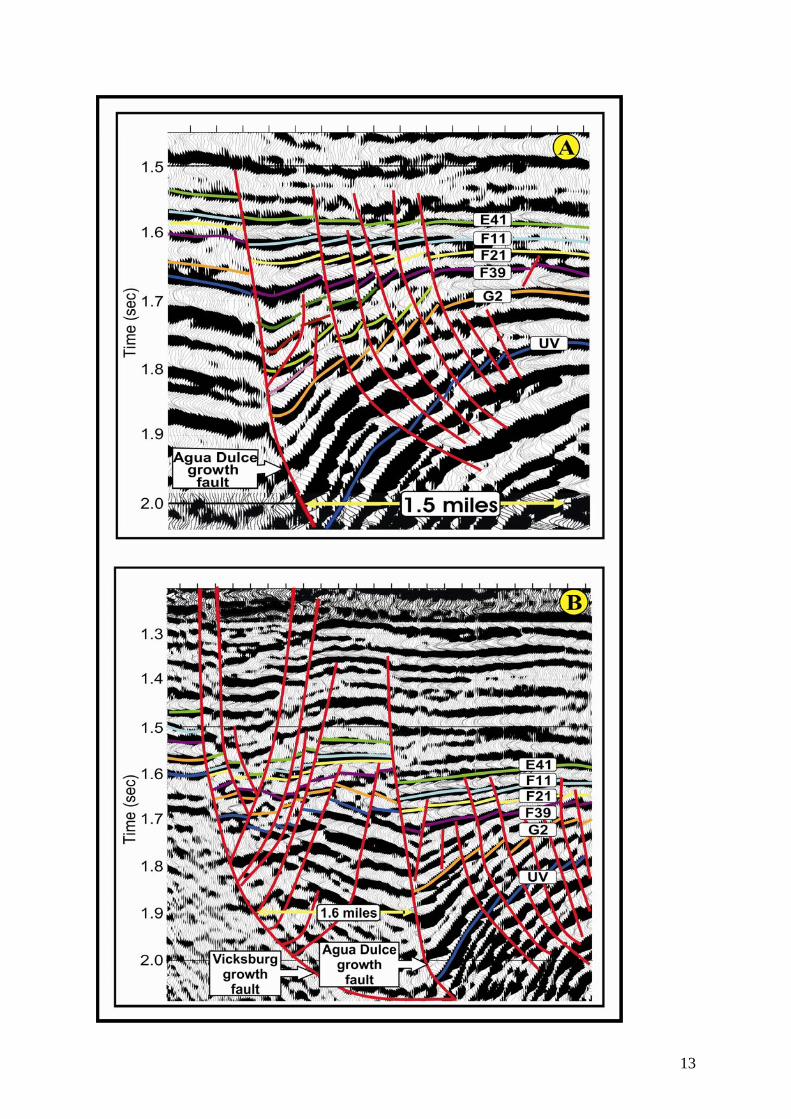
seismic surveys. The seismic crossline in Figure 12a illustrates that the BMF interval is
deformed by the subsidiary faults on the hanging wall side of the AD fault and is
accommodated mainly by synthetic faulting. The difference between the level of details in
this 3D seismic crossline and that presented by Levey et al., (1993) (Figure 2) is dramatic.
Recognizing such details from regional 2D seismic sections and well data alone is not
possible. This comparison clearly illustrates the power of 3D seismic volumes over 2D
seismic grids. The deformation is more pronounced in the area closer to the AD growth fault.
Approximately, 1.5-mile (2.4-km) distant from the trace of the AD fault in the down-basin
direction, we note an average of five secondary faults that affect the stratigraphic units of the
BMF interval (F39-F11), with the deeper horizons (e.g. F39) being more deformed than the
shallower horizons (e.g. F11). The vertical seismic section shown in Figure 12b illustrates the
deformation of the deeper middle Frio in the footwall side of the AD fault. It shows that
antithetic faulting accommodates the AD fault footwall deformation, the opposite case of the
hanging wall deformation, and is more intense in the northern part of the UPR 3D seismic
volume (southern Agua Dulce field area) than in the southern part (northern Stratton field
area). Note the difference between the structure details which appear in this seismic line and
that presented by Levey et al., (1993) (Figure 2). Several synthetic and antithetic faults affect
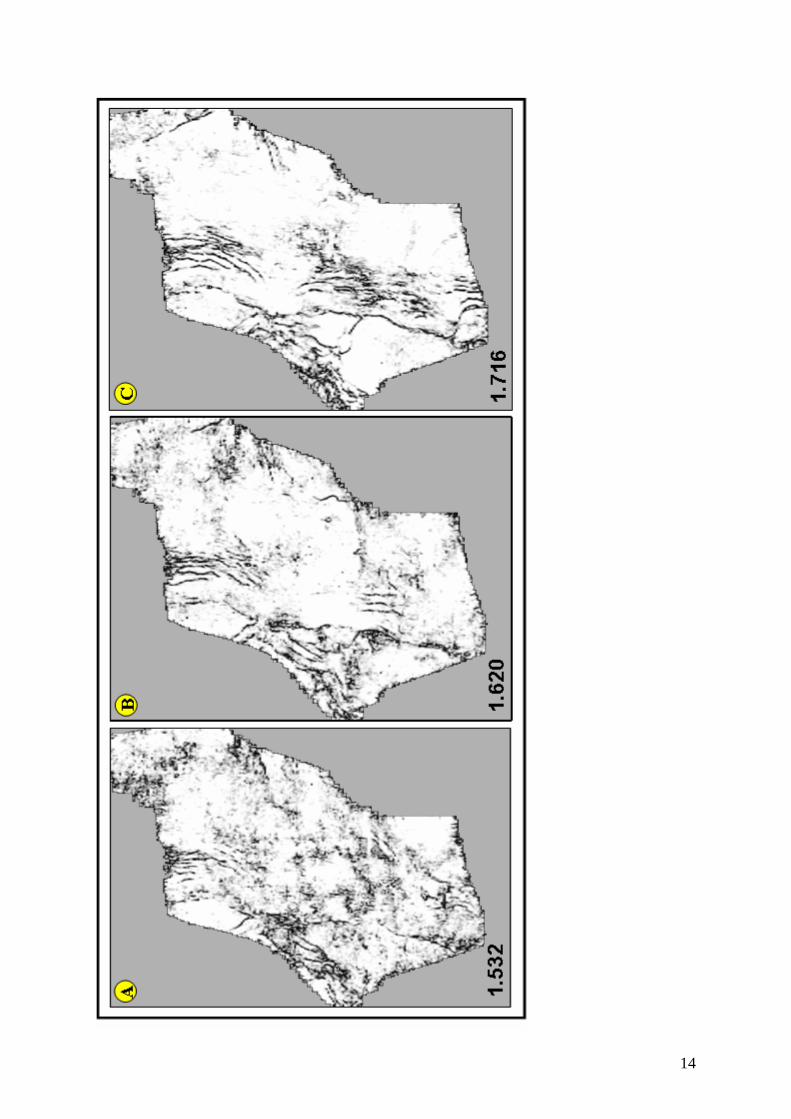
the deeper middle Frio interval (G2-E41) and younger horizons. The coherence slices shown
in Figure 13 indicate that the studied BMF interval is clearly affected at different stratigraphic
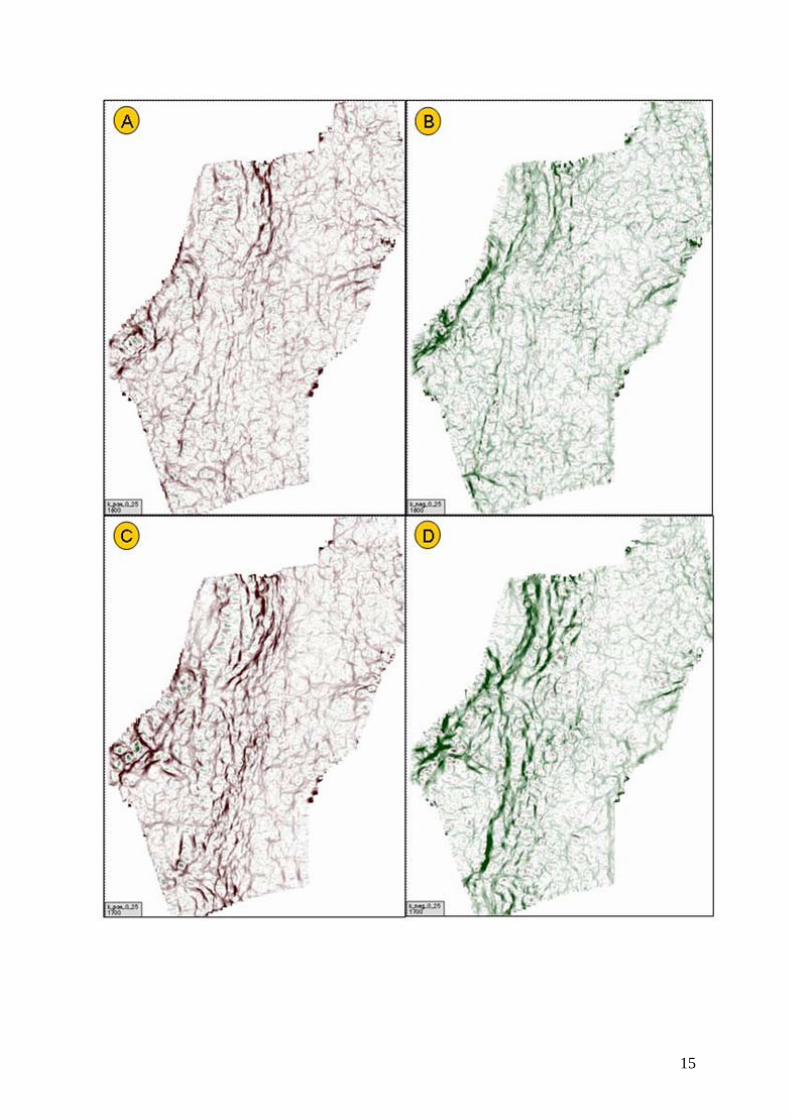
levels by several growth faults that occur in different parts of the image area. Figure 14
shows maximum positive and maximum negative curvature attributes that also indicate that
the BMF interval is deformed by many faults. These faults are assumed to result in more
compartmentalization of the fluvial channels embedded in the studied BMF stratigraphic
interval.
6

Fault offsets. The vertical displacements of the major and subsidiary growth faults mapped
in the study area were measured from both vertical seismic sections (inlines and crosslines)
and well log cross sections. Based on observations made from the two-3D seismic volumes, it
was found that the amount of fault throws of major and minor faults vary from line to line in
the seismic surveys and increases in the northern part of the UPR 3D seismic survey in the
Agua Dulce field area. The amount of vertical separation of the AD growth fault increases
with depth and ranges between 850 ft (259 m) to 1600 ft (488 m). For the subsidiary
synthetic and antithetic faults, vertical displacements range from 15 ft (5 m) to 145 ft (44 m).
These subtle small-throw faults can be a significant part in the creation of multiple reservoir
compartments within the middle Frio Formation.
Structure Architecture Model for the Middle Frio Formation. One of the objectives of
this study is to test the hypothesis of whether or not synthetic and antithetic faults cut through
the middle Frio Formation in the area of the Stratton-Agua Dulce fields. Investigating the
BMF interval (G2-F11) from the available two 3D seismic data volumes and well log data
(Figures 5-14) shows that the studied middle Frio horizons (e.g. F11 and F39) become
segmented or compartmentalized by the effect of the subsidiary synthetic and antithetic faults
associated with the major growth faults.
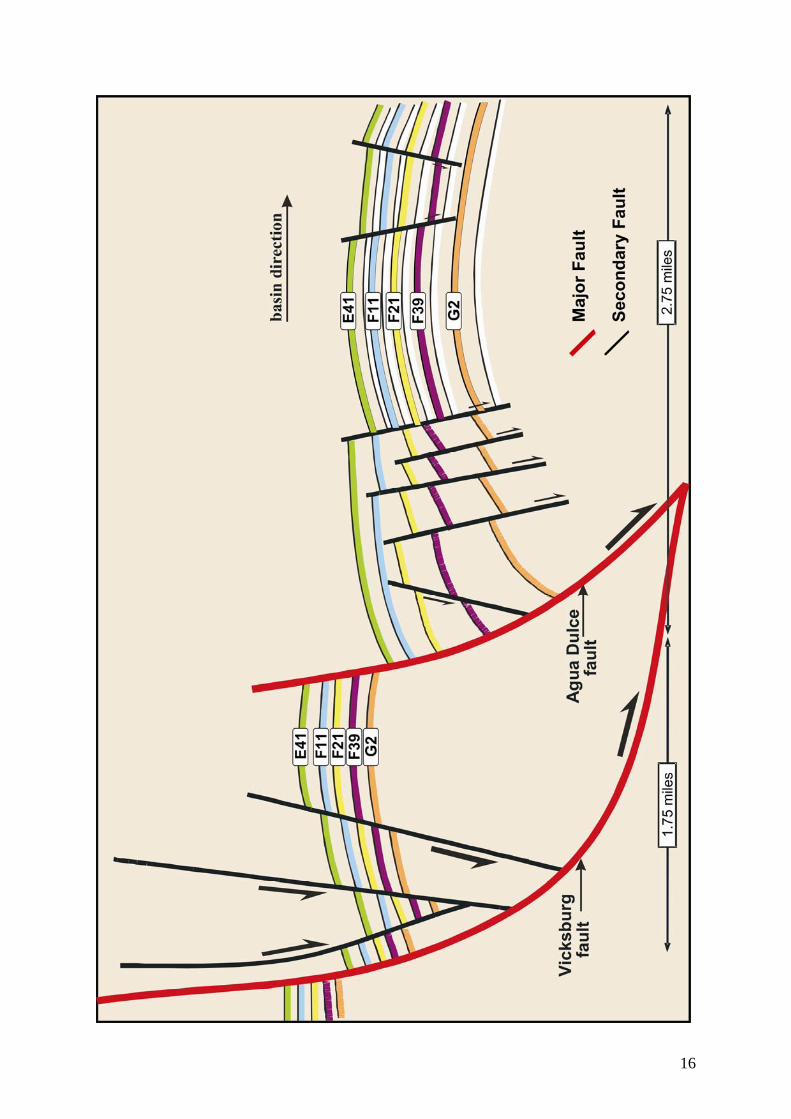
Based on these findings, we propose a new structural architecture model (Figure 15)
for the BMF interval. In this model, the interval between F11 and G2 has been broken into
several compartments by major and secondary growth faults. At about 2.75-mile (4.5-km)
distance from the trace of the AD growth fault, the BMF horizons split into several reservoir
compartments due to, on average, seven synthetic and antithetic faults cutting through this
interval. Movements along these individual faults may result in several compartmentalized
7
traps rather than one undeformed larger rollover anticlinal trap. In the footwall block of the
AD fault, antithetic faults are common and displace the BMF and younger horizons.
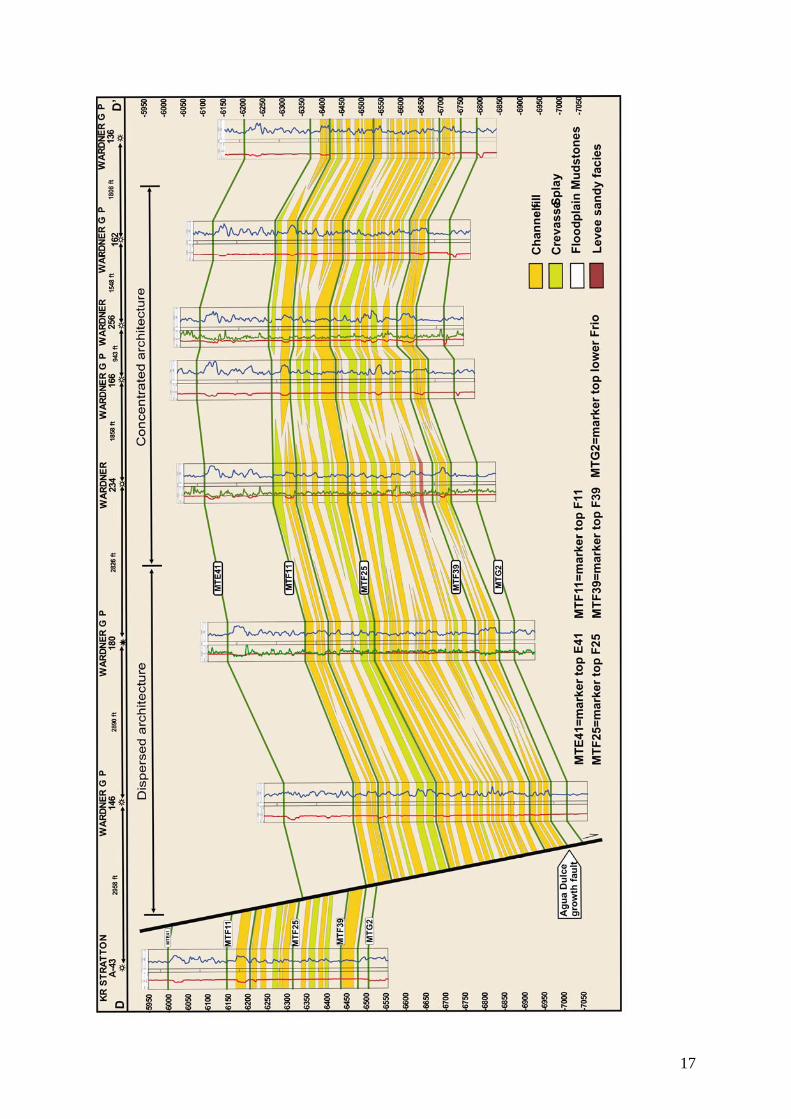
In the middle Frio Formation at Stratton field, Kerr and Jirik (1990) and Yang (1998)
recognized two architectural end members: the concentrated and the dispersed sandstone
bodies. These architectural styles were noted on the hanging wall side of the AD growth
fault. Figure 16 is a robust rollover anticline from Stratton field that shows that shows good
examples of the concentrated and the dispersed facies architectural styles. In this interval, and
based on well data and 2D seismic data (Levey et al. 1993) the structure attitude is mostly
affected by the master growth faults while all the antithetic and synthetic faults are
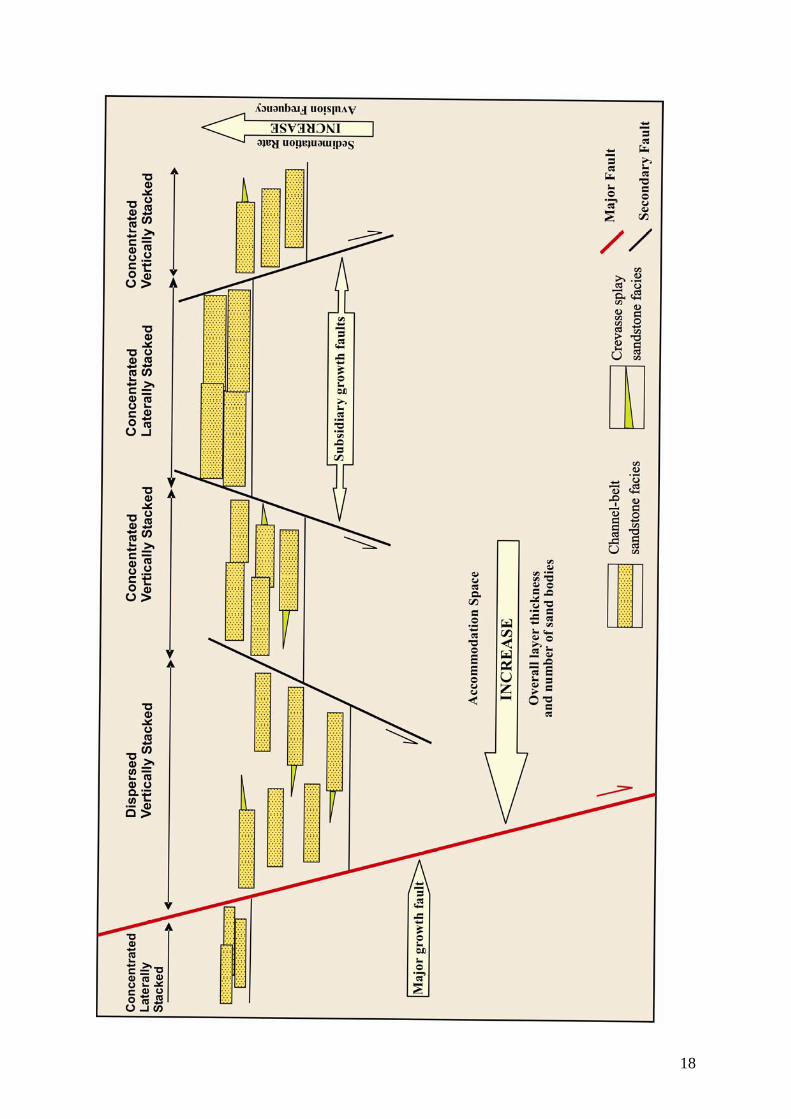
diminished. This facies architectural model proposed by Kerr and Jirik (1990) and Yang
(1998) did not account for the effect of the secondary faults on the architecture of the middle
Frio strata. This model can be modified to include the effects of the major and subsidiary
faults together on the middle Frio interval as presented by this study (Figure 17). In addition,
syndepositional movements of these growth faults may result in the creation of more
accommodation space and in the avulsion of the BMF fluvial channel belts. Thus, in order for
more development of the middle Frio reservoirs in the Stratton-Agua Dulce area and in the
Texas Gulf Coast basin as well, the structural and the facies architectural models (Figures 15
and 17) presented by this study should be taken into consideration.
CONCLUSION
In this paper, an example from the Texas Gulf Coast of the United States showed that
information extracted from two 3D seismic data volumes resulted in the enhancement and
more understanding of the structural styles and architecture and in accurate delineation of
8
reservoir blocks in the area of study. The results of this work promise for more development
opportunities in the Stratton-Agua Dulce area in the FR-4 (Frio gas play) in south Texas. At
Stratton and Agua Dulce fields in south Texas new structural and facies architectural models
proposed and show that the Vicksburg and AD faults and numerous subsidiary synthetic and
antithetic faults are syndepositional and cut through the BMF and younger horizons. These
faults affect the architecture of the sandstone bodies stacked in these intervals.
ACKNOWLEDGEMENTS
The first author is grateful to the Geosciences Department of the University of Tulsa,
Oklahoma, especially Dennis Kerr and Dr. Christopher Liner (now with Saudi Aramco) for
their guidance and help to achieve this study. Special thanks to Anadarko Petroleum
Corporation for providing the UPR 3D seismic survey and to the State of Texas Bureau of
Economic Geology for providing seismic data licenses to the University of Tulsa for use in
education and research.
Suggested Readings. “The impact of 3D seismic data on exploration, field development, and
production. In: Weimer, P., and Davis, T.L., 1996, Applications of 3D seismic data to
exploration and production. AAPG Studies in Geology, No. 42 and SEG Geophysical
Developments series No. 5, AAPG/SEG, Tulsa, p. 1-8” (by Nestvold, 1996); “Structural
Geology”. W.H. Freeman and Company, USA, P. 74-88” (by Twiss, R. and Moores, E.,
1992). “Interpretation of Three-Dimensional Seismic Data, AAPG Memoir 42, Fifth Edition,
p.55-96” (By Brown, 1999).
TABLE OF FIGURE CAPTIONS
9
Figure 1. Index map showing the location of the Stratton and Agua Dulce fields in south
Texas, the location of the UPR and the BEG 3D seismic surveys, and the well in which the
VSP survey was run.
Figure 2. Interpreted regional 2D seismic line passing through the Wardner lease area of
Stratton field showing rotation of fault blocks in the lower Frio and Vicksburg Formations
compared to the lack of faulting in the middle Frio Formation, (from Levey, et al., 1993).
Figure 3. Reference log from well Wardner 177 showing reservoir subdivisions and markers
of the basal middle Frio interval (BMF) used in this study. T= top, B= base, m= marker.
Figure 4. VSP display of Wardner 175 well (Modified from Hardage, et al., 1996). Some
horizons of interest: e.g. F11 and F39 are located at ~1.58 s and ~1.65 s, respectively. The
peaks (black-filled to the right) are top of reservoir units.
Figure 5. (a) Geological cross section showing the disparity in thickness of the BMF interval
(MTE41-MTG2) on both sides of the AD fault. The hanging wall is deformed by the rollover
anticline and a set of synthetic and antithetic faults. (b) Coincident arbitrary seismic line from
the UPR 3D seismic survey showing the AD listric normal fault and the associated structures.
Displacement on the AD growth fault occurs during sedimentation resulting in equivalent
beds being thicker in the hanging wall block than in the footwall block.
Figure 6. Isochron map extracted between F11 and F39 reflectors from the UPR 3D
seismic volume. Thick isochrons (dark colors) indicate the growth of the faults.
10
Figure 7. (a) Well log cross section showing that the minor antithetic faults associated
with the AD fault are also syndepositional (growth) faults. The growth of the fault as
measured between MTE41 and MBF39 is approximately 126 ft in the hanging wall side of
the fault. This growth is evident in the thickening of the individual layers such as F11 and
F39. Location of the cross section is indicated in Figure 9. (b) Coincident arbitrary seismic
line (from the BEG 3D seismic survey) showing the antithetic fault (AF) in Fig. 7a.
Figure 8. (a) Well log cross section showing that the subsidiary synthetic faults associated
with the AD fault are syndepositional (growth) faults. The interval between F11 and F39 are
thicker in the hanging wall by 44ft than in the footwall side of the synthetic fault. Location of
the cross section is indicated in Figure 9. (b) Arbitrary seismic line (from the UPR 3D
seismic survey) showing the synthetic fault (SF) in (a).
Figure 9. Structure contour map constructed on top of the F11 horizon in Stratton field area
based on well data, showing only the AD fault and one subsidiary fault (From Yang, 1998).
Figure 10. Time structure map constructed on top of the F11 horizon from the BEG and the
UPR 3D seismic surveys. Fault polygons indicate the locations of the major faults and
several secondary faults. These secondary faults were not shown before (compare with
Figures 2 and 9) at the F11 stratigraphic level.
Figure 11. 3D view of the F11 structure from the BEG 3D seismic survey clearly showing
surface irregularities in the hanging wall rollover anticline that indicate the locations of the
secondary faults associated with the major AD fault.
11
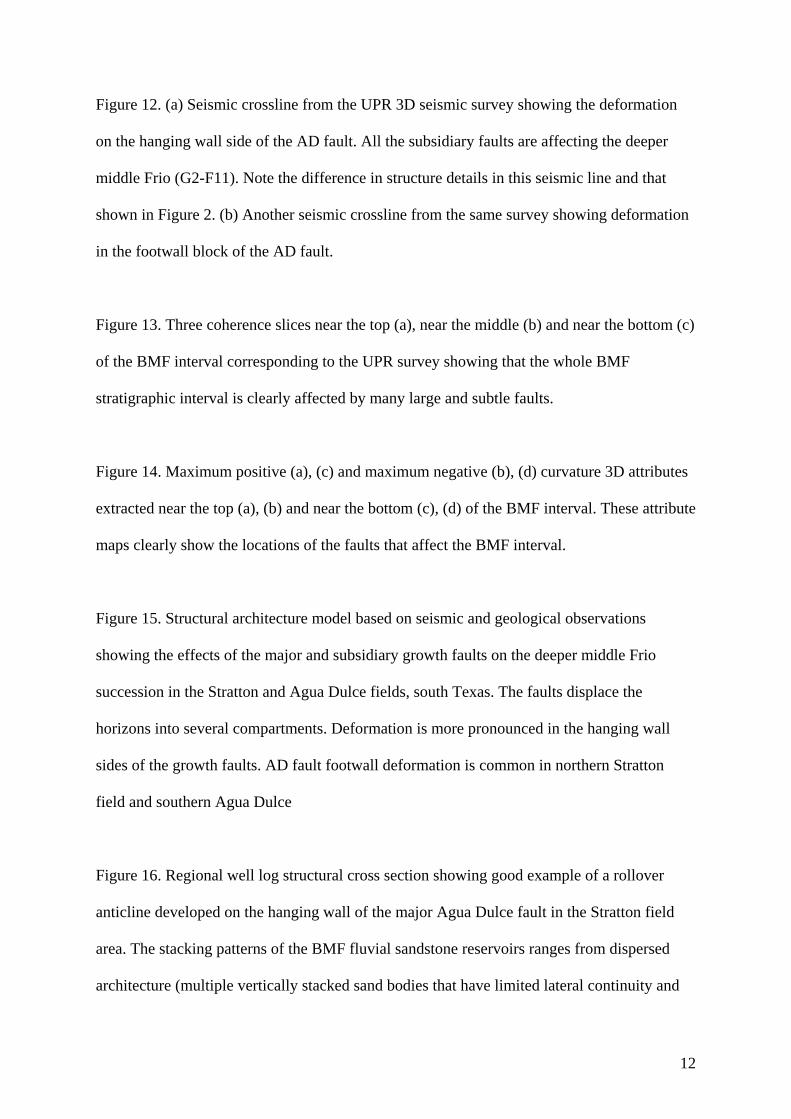
Figure 12. (a) Seismic crossline from the UPR 3D seismic survey showing the deformation
on the hanging wall side of the AD fault. All the subsidiary faults are affecting the deeper
middle Frio (G2-F11). Note the difference in structure details in this seismic line and that
shown in Figure 2. (b) Another seismic crossline from the same survey showing deformation
in the footwall block of the AD fault.
Figure 13. Three coherence slices near the top (a), near the middle (b) and near the bottom (c)
of the BMF interval corresponding to the UPR survey showing that the whole BMF
stratigraphic interval is clearly affected by many large and subtle faults.
Figure 14. Maximum positive (a), (c) and maximum negative (b), (d) curvature 3D attributes
extracted near the top (a), (b) and near the bottom (c), (d) of the BMF interval. These attribute
maps clearly show the locations of the faults that affect the BMF interval.
Figure 15. Structural architecture model based on seismic and geological observations
showing the effects of the major and subsidiary growth faults on the deeper middle Frio
succession in the Stratton and Agua Dulce fields, south Texas. The faults displace the
horizons into several compartments. Deformation is more pronounced in the hanging wall
sides of the growth faults. AD fault footwall deformation is common in northern Stratton
field and southern Agua Dulce
Figure 16. Regional well log structural cross section showing good example of a rollover
anticline developed on the hanging wall of the major Agua Dulce fault in the Stratton field
area. The stacking patterns of the BMF fluvial sandstone reservoirs ranges from dispersed
architecture (multiple vertically stacked sand bodies that have limited lateral continuity and
12
13
separated vertically by thick layers of floodplain mudstones) closer to the major growth fault
to concentrated architecture (multiple laterally stacked sand bodies that have more lateral
continuity and separated vertically by thin layers of floodplain mudstones) along the crest of
the rollover anticline. Location of the cross section is indicated in Figure 9.
Figure 17. Schematic 2D facies architectural model of the BMF stratigraphic interval.
Deformation caused by growth fault (major and subsidiary) activity is one possible factor
controlling the BMF fluvial architectural styles in the study area. Thickness and number of
sandstone bodies increase on the hanging wall sides of the growth faults relative to the
footwalls (modified from Kerr and Jirik, 1990, and Yang, 1998).
1
2

3
4
5
6
7
8
9
10
11
12
13
14
15
16
17
18