Embed Size (px)
Citation preview
The Tax Foundation is the nation’s leading independent tax policy research organization. Since 1937, our research, analysis, and experts have informed smarter tax policy at the federal, state, and local levels. We are a 501(c)(3) non-profit organization.
©2017 Tax FoundationDistributed underCreative Commons CC-BY-NC 4.0
Editor, Rachel ShusterDesigner, Dan Carvajal
Tax Foundation1325 G Street, NW, Suite 950Washington, DC 20005
202.464.6200
taxfoundation.org
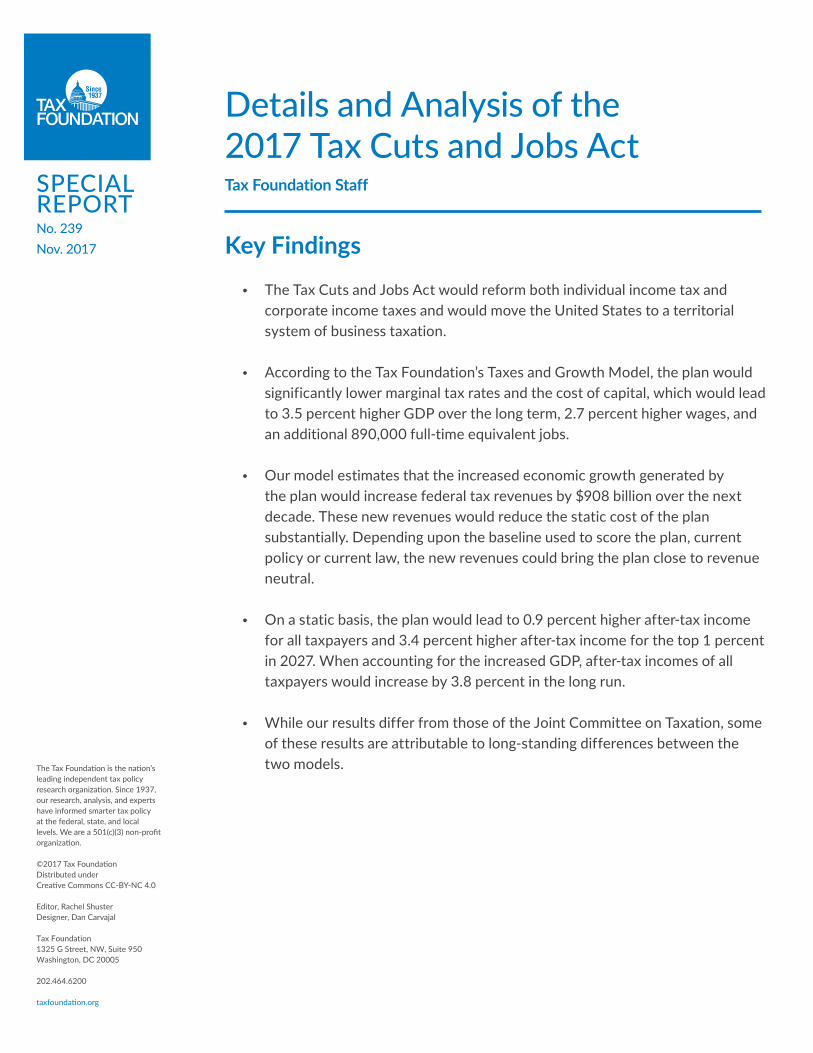
Details and Analysis of the 2017 Tax Cuts and Jobs Act
Key Findings • The Tax Cuts and Jobs Act would reform both individual income tax and
corporate income taxes and would move the United States to a territorial system of business taxation.
• According to the Tax Foundation’s Taxes and Growth Model, the plan would significantly lower marginal tax rates and the cost of capital, which would lead to 3.5 percent higher GDP over the long term, 2.7 percent higher wages, and an additional 890,000 full-time equivalent jobs.
• Our model estimates that the increased economic growth generated by the plan would increase federal tax revenues by $908 billion over the next decade. These new revenues would reduce the static cost of the plan substantially. Depending upon the baseline used to score the plan, current policy or current law, the new revenues could bring the plan close to revenue neutral.
• On a static basis, the plan would lead to 0.9 percent higher after-tax income for all taxpayers and 3.4 percent higher after-tax income for the top 1 percent in 2027. When accounting for the increased GDP, after-tax incomes of all taxpayers would increase by 3.8 percent in the long run.
• While our results differ from those of the Joint Committee on Taxation, some of these results are attributable to long-standing differences between the two models.
SPECIAL REPORTNo. 239Nov. 2017
Tax Foundation Staff
TAX FOUNDATION | 2
IntroductionOn November 2, 2017, Chairman Kevin Brady (R-TX) of the House Committee on Ways and Means released a tax reform plan, known as the Tax Cuts and Jobs Act. The plan would reform the individual income tax code by lowering tax rates on wages, investment, and business income; broadening the tax base; and simplifying the tax code. The plan would lower the corporate income tax rate to 20 percent and move the United States from a worldwide to a territorial system of taxation.
Our analysis finds that the plan would reduce marginal tax rates on labor and investment. As a result, we estimate that the plan would increase long-run GDP by 3.5 percent. The larger economy would translate into 2.7 percent higher wages and result in 890,000 more full-time equivalent jobs.
We find that the larger economy would also generate more than $900 billion more in federal tax revenues, which would substantially reduce the estimated revenue loss from the tax reform plan. The Joint Committee on Taxation estimates the static revenue loss from the plan to total $1.5 trillion over a decade. Because of technical differences between our models, the TAG model generates a slightly higher estimate of the revenue loss from the plan–$1.98 trillion using a current law baseline.
Irrespective of these differences, the $900 billion in new tax revenues generated by the economic growth would go a long way toward bringing the plan closer to revenue neutral within the first ten years.
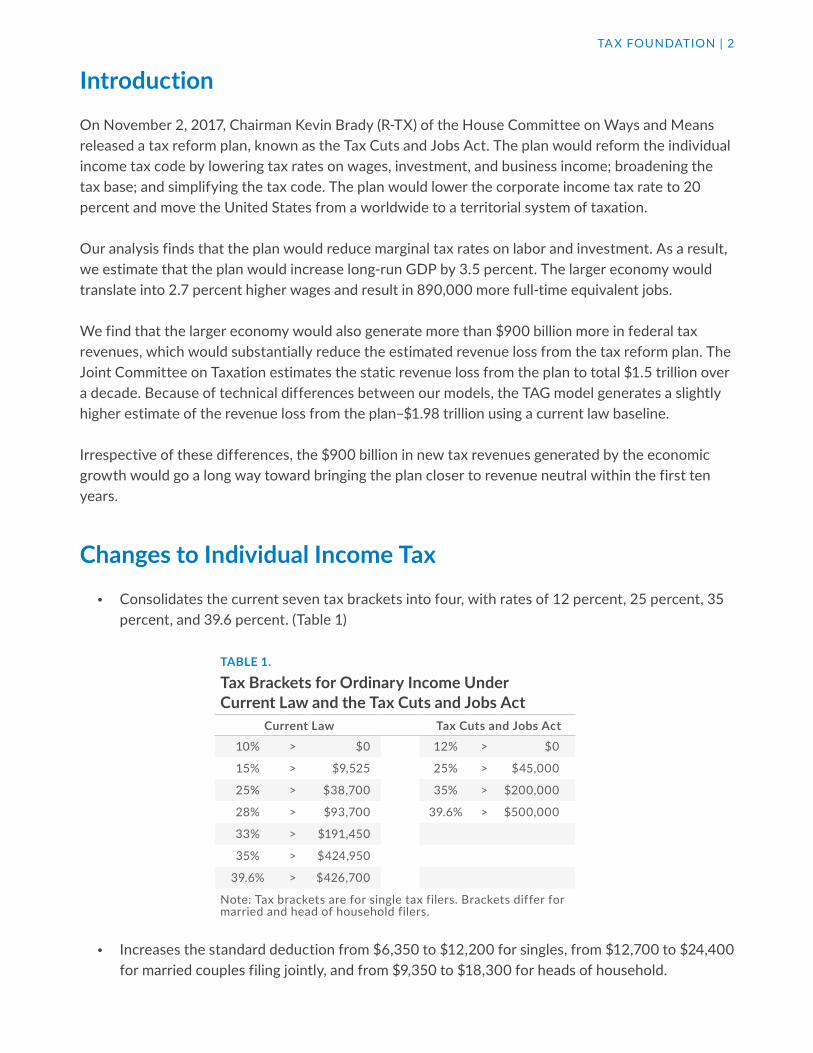
Changes to Individual Income Tax • Consolidates the current seven tax brackets into four, with rates of 12 percent, 25 percent, 35
percent, and 39.6 percent. (Table 1)
• Increases the standard deduction from $6,350 to $12,200 for singles, from $12,700 to $24,400 for married couples filing jointly, and from $9,350 to $18,300 for heads of household.
TABLE 1.
Tax Brackets for Ordinary Income Under Current Law and the Tax Cuts and Jobs Act
Current Law Tax Cuts and Jobs Act10% > $0 12% > $0
15% > $9,525 25% > $45,000
25% > $38,700 35% > $200,000
28% > $93,700 39.6% > $500,000
33% > $191,450
35% > $424,950
39.6% > $426,700
Note: Tax brackets are for single tax filers. Brackets differ for married and head of household filers.
TAX FOUNDATION | 3
• Eliminates the personal exemption. Creates a $300 personal credit, along with a $300 non-child dependent personal credit, in place for five years.
• Increases the child tax credit to $1,600, with $1,000 of the tax credit initially refundable. The refundable portion is indexed to inflation until the full $1,600 is refundable. The phaseout threshold for the child tax credit is also increased: for married households, it rises from $110,000 to $230,000.
• Retains the mortgage interest deduction, but with a cap of $500,000 of principal on newly-purchased homes. Also retains charitable contribution deductions and the deduction for state and local property taxes, the latter of which would be capped at $10,000; eliminates the remainder of the state and local tax deduction along with other itemized deductions.
• Eliminates the individual alternative minimum tax.
• Indexes tax brackets and other components using the chained CPI measure of inflation.
Changes to Business Taxes • Reduces the corporate income tax rate from 35 percent to 20 percent.
• Eliminates the corporate alternative minimum tax.
• Taxes pass-through business income at a maximum rate of 25 percent, subject to anti-abuse rules.
• Allows for capital investment, except for structures, to be fully and immediately deductible for five years, and increases the Section 179 expensing limit from $500,000 to $5 million, with an increased phaseout threshold.
• Limits the deductibility of net interest expense on future loans to 30 percent of earnings before interest, taxes, depreciation, and amortization for all businesses with gross receipts of $25 million or more.
• Restricts the deduction of net operating losses to 90 percent of net taxable income and allows net operating losses to be carried forward indefinitely, increased by a factor reflecting inflation and the real return to capital. Eliminates net operating loss carrybacks.
• Eliminates the domestic production activities deduction (section 199), and other business deductions and credits.
• Creates a territorial tax system, exempting from U.S. tax 100 percent of dividends from foreign subsidiaries.
TAX FOUNDATION | 4
• Enacts a deemed repatriation of currently deferred foreign profits, at a rate of 12 percent for cash and cash-equivalent profits and 5 percent of all other profits.
Other Tax Changes • Eliminates the federal estate taxes.
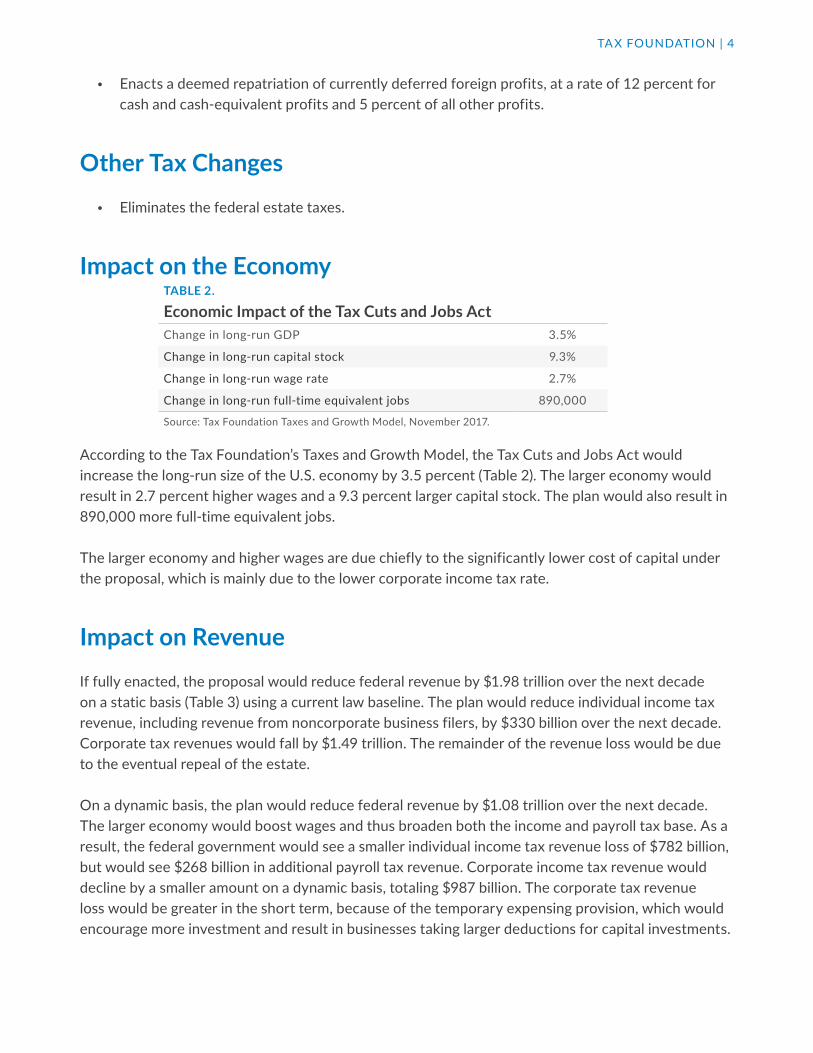
Impact on the Economy
According to the Tax Foundation’s Taxes and Growth Model, the Tax Cuts and Jobs Act would increase the long-run size of the U.S. economy by 3.5 percent (Table 2). The larger economy would result in 2.7 percent higher wages and a 9.3 percent larger capital stock. The plan would also result in 890,000 more full-time equivalent jobs.
The larger economy and higher wages are due chiefly to the significantly lower cost of capital under the proposal, which is mainly due to the lower corporate income tax rate.
Impact on RevenueIf fully enacted, the proposal would reduce federal revenue by $1.98 trillion over the next decade on a static basis (Table 3) using a current law baseline. The plan would reduce individual income tax revenue, including revenue from noncorporate business filers, by $330 billion over the next decade. Corporate tax revenues would fall by $1.49 trillion. The remainder of the revenue loss would be due to the eventual repeal of the estate.
On a dynamic basis, the plan would reduce federal revenue by $1.08 trillion over the next decade. The larger economy would boost wages and thus broaden both the income and payroll tax base. As a result, the federal government would see a smaller individual income tax revenue loss of $782 billion, but would see $268 billion in additional payroll tax revenue. Corporate income tax revenue would decline by a smaller amount on a dynamic basis, totaling $987 billion. The corporate tax revenue loss would be greater in the short term, because of the temporary expensing provision, which would encourage more investment and result in businesses taking larger deductions for capital investments.
TABLE 2.
Economic Impact of the Tax Cuts and Jobs ActChange in long-run GDP 3.5%
Change in long-run capital stock 9.3%
Change in long-run wage rate 2.7%
Change in long-run full-time equivalent jobs 890,000
Source: Tax Foundation Taxes and Growth Model, November 2017.
TAX FOUNDATION | 5
The Tax Cuts and Jobs Act contains a number of significant base broadeners. The plan would eliminate all itemized deductions except for three: the mortgage interest deduction, the charitable contribution deduction, and the deduction for state and local property taxes. The deduction for property taxes would be capped at $10,000, while the mortgage interest deduction would be capped at $500,000 of principal on a newly-purchased home. This change would increase federal revenue by $1.52 trillion over the next decade.
The plan would also expand the standard deduction and eliminate the personal exemption, but would add a personal exemption of $300 for filers and $300 for non-child dependents, and expand the child tax credit from $1,000 to $1,600. These changes, considered together, would decrease federal revenues by $266 billion over the next decade.
On the business side, the bill includes several base broadeners. First, the deduction for net interest paid would be limited to 30 percent of a company’s earnings before interest, taxes, depreciation, and amortization (EBITDA). The plan would also repeal multiple business deductions and credits, such as the deduction for entertainment expenses, the deduction for domestic production activities (section 199), the new markets tax credit, and the orphan drug credit. Deductions for net operating losses would be restricted to 90 percent of net taxable income, but could be carried forward indefinitely and increased by a factor reflecting inflation and the real return to capital. The elimination of business credits and deductions, the limit on net operating losses, and the other business changes would bring in an additional $635 billion over the next decade. The results below also account for the impact of inbound corporate profit shifting, which would result from a lower statutory rate.
The largest source of revenue loss in the first decade would be the individual and corporate rate cuts and faster depreciation of capital investments. Consolidating individual income tax brackets to 12 percent, 25 percent, 35 percent, and 39.6 percent (with a “bubble rate,” which eliminates the benefit of the 12 percent rate for high-income earners) would reduce revenues by $1.52 trillion over the next decade, while cutting the corporate income tax rate to 20 percent would reduce revenues by $1.54 trillion over the next decade. Capping the tax rate on pass-through businesses would reduce revenues by $531 billion, after accounting for the new individual bracket schedule and the anti-abuse provisions. The anti-abuse rules would include several provisions, including limiting the lower rate to 30 percent of income and exempting specific industries.1 The temporary full expensing provision and the expansion of section 179 would reduce revenue by $340 billion over the next decade.
1 Scott Drenkard and Scott Greenberg, “Explaining the Pass-Through Income Anti-Abuse Rules in the Tax Cuts and Jobs Act,” Tax Foundation, November 3, 2017, https://taxfoundation.org/pass-through-anti-abuse-rules-tax-cuts-jobs-act/.
TAX FOUNDATION | 6
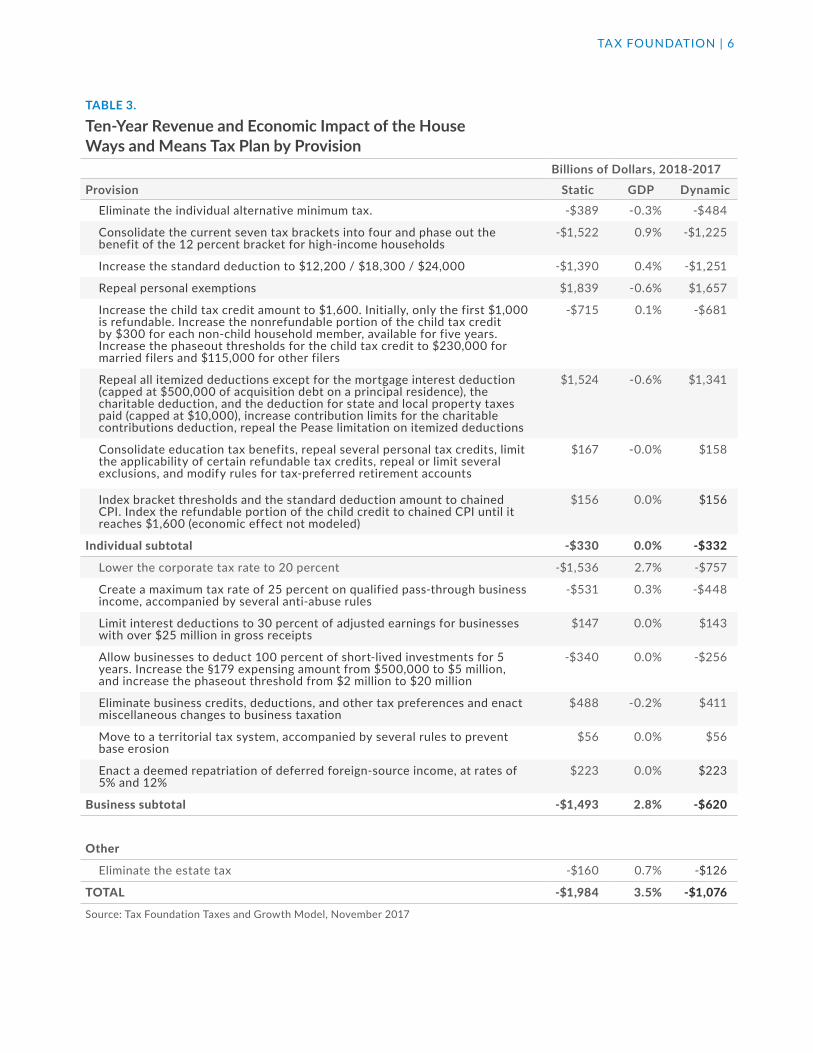
TABLE 3.
Ten-Year Revenue and Economic Impact of the House Ways and Means Tax Plan by Provision Billions of Dollars, 2018-2017Provision Static GDP Dynamic
Eliminate the individual alternative minimum tax. -$389 -0.3% -$484
Consolidate the current seven tax brackets into four and phase out the benefit of the 12 percent bracket for high-income households
-$1,522 0.9% -$1,225
Increase the standard deduction to $12,200 / $18,300 / $24,000 -$1,390 0.4% -$1,251
Repeal personal exemptions $1,839 -0.6% $1,657
Increase the child tax credit amount to $1,600. Initially, only the first $1,000 is refundable. Increase the nonrefundable portion of the child tax credit by $300 for each non-child household member, available for five years. Increase the phaseout thresholds for the child tax credit to $230,000 for married filers and $115,000 for other filers
-$715 0.1% -$681
Repeal all itemized deductions except for the mortgage interest deduction (capped at $500,000 of acquisition debt on a principal residence), the charitable deduction, and the deduction for state and local property taxes paid (capped at $10,000), increase contribution limits for the charitable contributions deduction, repeal the Pease limitation on itemized deductions
$1,524 -0.6% $1,341
Consolidate education tax benefits, repeal several personal tax credits, limit the applicability of certain refundable tax credits, repeal or limit several exclusions, and modify rules for tax-preferred retirement accounts
$167 -0.0% $158
Index bracket thresholds and the standard deduction amount to chained CPI. Index the refundable portion of the child credit to chained CPI until it reaches $1,600 (economic effect not modeled)
$156 0.0% $156
Individual subtotal -$330 0.0% -$332
Lower the corporate tax rate to 20 percent -$1,536 2.7% -$757
Create a maximum tax rate of 25 percent on qualified pass-through business income, accompanied by several anti-abuse rules
-$531 0.3% -$448
Limit interest deductions to 30 percent of adjusted earnings for businesses with over $25 million in gross receipts
$147 0.0% $143
Allow businesses to deduct 100 percent of short-lived investments for 5 years. Increase the §179 expensing amount from $500,000 to $5 million, and increase the phaseout threshold from $2 million to $20 million
-$340 0.0% -$256
Eliminate business credits, deductions, and other tax preferences and enact miscellaneous changes to business taxation
$488 -0.2% $411
Move to a territorial tax system, accompanied by several rules to prevent base erosion
$56 0.0% $56
Enact a deemed repatriation of deferred foreign-source income, at rates of 5% and 12%
$223 0.0% $223
Business subtotal -$1,493 2.8% -$620
Other
Eliminate the estate tax -$160 0.7% -$126
TOTAL -$1,984 3.5% -$1,076
Source: Tax Foundation Taxes and Growth Model, November 2017
TAX FOUNDATION | 7
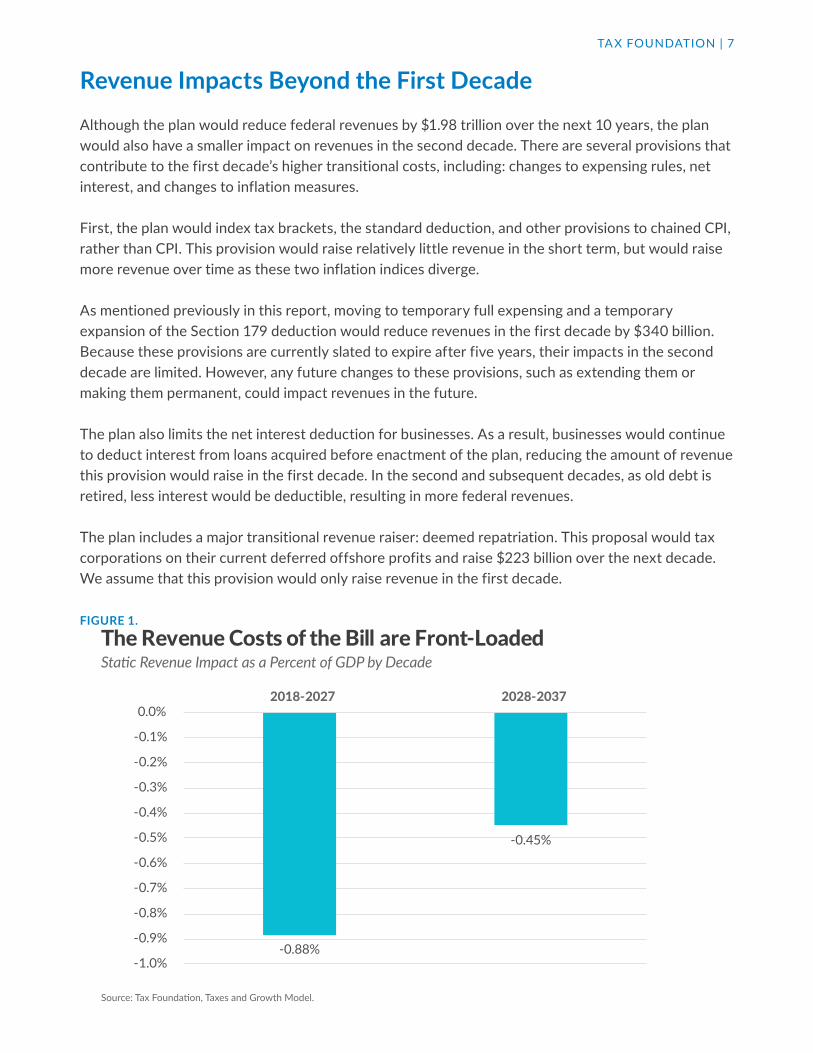
Revenue Impacts Beyond the First DecadeAlthough the plan would reduce federal revenues by $1.98 trillion over the next 10 years, the plan would also have a smaller impact on revenues in the second decade. There are several provisions that contribute to the first decade’s higher transitional costs, including: changes to expensing rules, net interest, and changes to inflation measures.
First, the plan would index tax brackets, the standard deduction, and other provisions to chained CPI, rather than CPI. This provision would raise relatively little revenue in the short term, but would raise more revenue over time as these two inflation indices diverge.
As mentioned previously in this report, moving to temporary full expensing and a temporary expansion of the Section 179 deduction would reduce revenues in the first decade by $340 billion. Because these provisions are currently slated to expire after five years, their impacts in the second decade are limited. However, any future changes to these provisions, such as extending them or making them permanent, could impact revenues in the future.
The plan also limits the net interest deduction for businesses. As a result, businesses would continue to deduct interest from loans acquired before enactment of the plan, reducing the amount of revenue this provision would raise in the first decade. In the second and subsequent decades, as old debt is retired, less interest would be deductible, resulting in more federal revenues.
The plan includes a major transitional revenue raiser: deemed repatriation. This proposal would tax corporations on their current deferred offshore profits and raise $223 billion over the next decade. We assume that this provision would only raise revenue in the first decade.
FIGURE 1.
TAX FOUNDATION
Source: Tax Foundation, Taxes and Growth Model.
Static Revenue Impact as a Percent of GDP by Decade
-1.0%
-0.9%
-0.8%
-0.7%
-0.6%
-0.5%
-0.4%
-0.3%
-0.2%
-0.1%
0.0%2018-2027 2028-2037
The Revenue Costs of the Bill are Front-Loaded
-0.88%
-0.45%
TAX FOUNDATION | 8
Taken together, these results mean that the plan would cost less in future decades. We estimate that this bill would reduce federal revenues by 0.88 percent of GDP in the first decade compared to 0.45 percent of GDP in the second decade.
Components of the Dynamic Revenue EstimateThe dynamic revenue impact of -$1,076 billion over the next decade can be broken down into three components: tax reductions, economic growth, and revenue raisers.
The tax reductions in this plan include, but are not limited to, the cut in the corporate income tax rate to 20 percent, temporary full expensing of capital investments, and the reduction in marginal tax rates for most individuals. Combined, these tax cuts would reduce federal revenues by $6.58 trillion over the next decade, if enacted alone.
The second piece is the expected increase in revenue due to economic growth. The bill would reduce marginal tax rates on work and investment. Our model finds that these marginal tax rates would significantly increase the long-run size of the economy. The larger economy would boost wages, increasing the tax base, especially for the individual income and payroll taxes. The resulting growth would reduce the 10-year cost of the plan by approximately $900 billion, on net.
Finally, the revenue raisers in the plan, such as the elimination of several itemized deductions for individuals and the repeal of many businesses tax expenditures, would significantly expand the tax base, reducing the revenue loss of the tax plan by $4.60 trillion over the next decade.
TABLE 4.
Year by Year Static Revenue Changes for the First and Second Decades10-Year Static Federal Revenue Estimate, 2018-2027 ($ billions)Year 2018 2019 2020 2021 2022 2023 2024 2025 2026 2027 2018-2027Individual Income Taxes -$199 -$166 -$148 -$142 -$127 $18 $3 -$1 -$10 -$12 -$782
Corporate Income Taxes -$168 -$152 -$151 -$135 -$114 -$18 -$40 -$54 -$90 -$120 -$1,042
Estate and Gift Taxes -$1 -$9 -$9 -$10 -$11 -$12 -$14 -$30 -$32 -$33 -$160
Total -$369 -$326 -$308 -$286 -$252 -$12 -$51 -$85 -$132 -$165 -$1,984
Second Decade Static Federal Revenue Estimate, 2028-2037 ($ billions)Year 2028 2029 2030 2031 2032 2033 2034 2035 2036 2037 2028-2036Individual Income Taxes -$5 $1 $6 $12 $19 $26 $34 $43 $52 $62 $251
Corporate Income Taxes -$115 -$120 -$124 -$129 -$134 -$138 -$144 -$149 -$154 -$160 -$1,367
Estate and Gift Taxes -$35 -$37 -$39 -$41 -$43 -$45 -$47 -$50 -$53 -$55 -$445
Total -$155 -$156 -$157 -$157 -$157 -$157 -$157 -$156 -$155 -$153 -$1,560
TAX FOUNDATION | 9
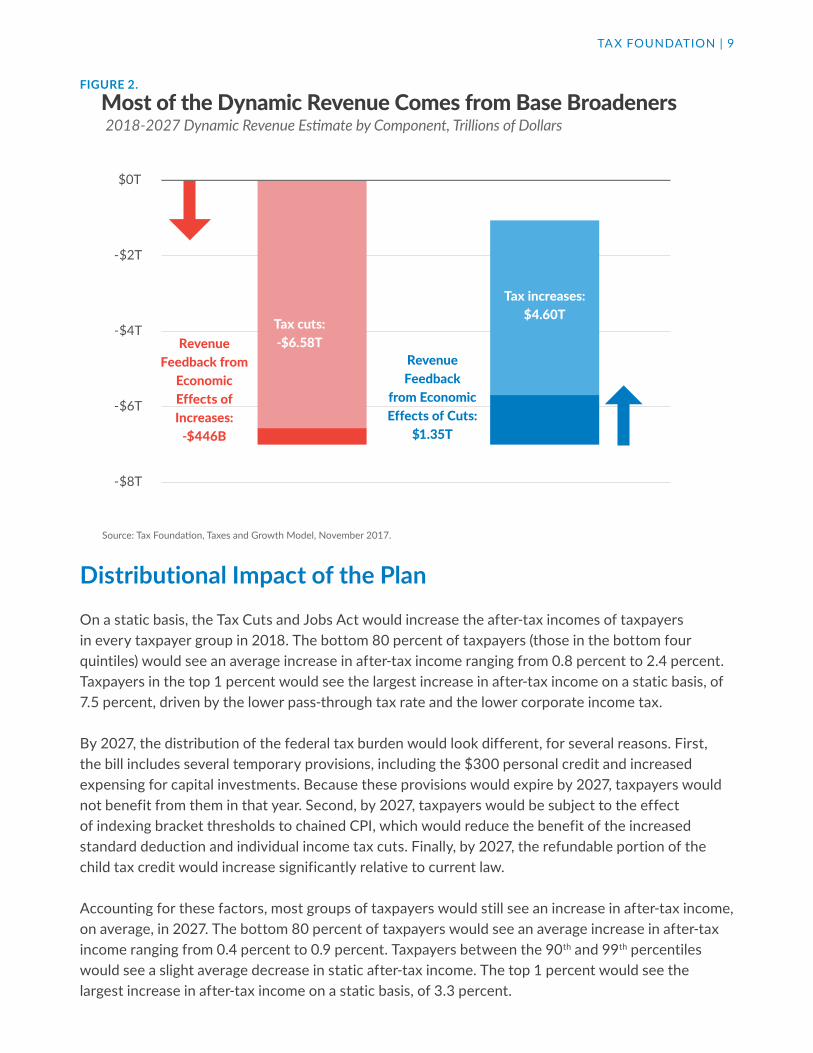
FIGURE 2.
Distributional Impact of the PlanOn a static basis, the Tax Cuts and Jobs Act would increase the after-tax incomes of taxpayers in every taxpayer group in 2018. The bottom 80 percent of taxpayers (those in the bottom four quintiles) would see an average increase in after-tax income ranging from 0.8 percent to 2.4 percent. Taxpayers in the top 1 percent would see the largest increase in after-tax income on a static basis, of 7.5 percent, driven by the lower pass-through tax rate and the lower corporate income tax.
By 2027, the distribution of the federal tax burden would look different, for several reasons. First, the bill includes several temporary provisions, including the $300 personal credit and increased expensing for capital investments. Because these provisions would expire by 2027, taxpayers would not benefit from them in that year. Second, by 2027, taxpayers would be subject to the effect of indexing bracket thresholds to chained CPI, which would reduce the benefit of the increased standard deduction and individual income tax cuts. Finally, by 2027, the refundable portion of the child tax credit would increase significantly relative to current law.
Accounting for these factors, most groups of taxpayers would still see an increase in after-tax income, on average, in 2027. The bottom 80 percent of taxpayers would see an average increase in after-tax income ranging from 0.4 percent to 0.9 percent. Taxpayers between the 90th and 99th percentiles would see a slight average decrease in static after-tax income. The top 1 percent would see the largest increase in after-tax income on a static basis, of 3.3 percent.
TAX FOUNDATION
Source: Tax Foundation, Taxes and Growth Model, November 2017.
Most of the Dynamic Revenue Comes from Base Broadeners2018-2027 Dynamic Revenue Estimate by Component, Trillions of Dollars
-$8T
-$6T
-$4T
-$2T
$0T
Tax cuts: -$6.58T
Revenue Feedback
from Economic Effects of Cuts:
$1.35T
Tax increases: $4.60T
Revenue Feedback from
Economic Effects of Increases:
-$446B
TAX FOUNDATION | 10
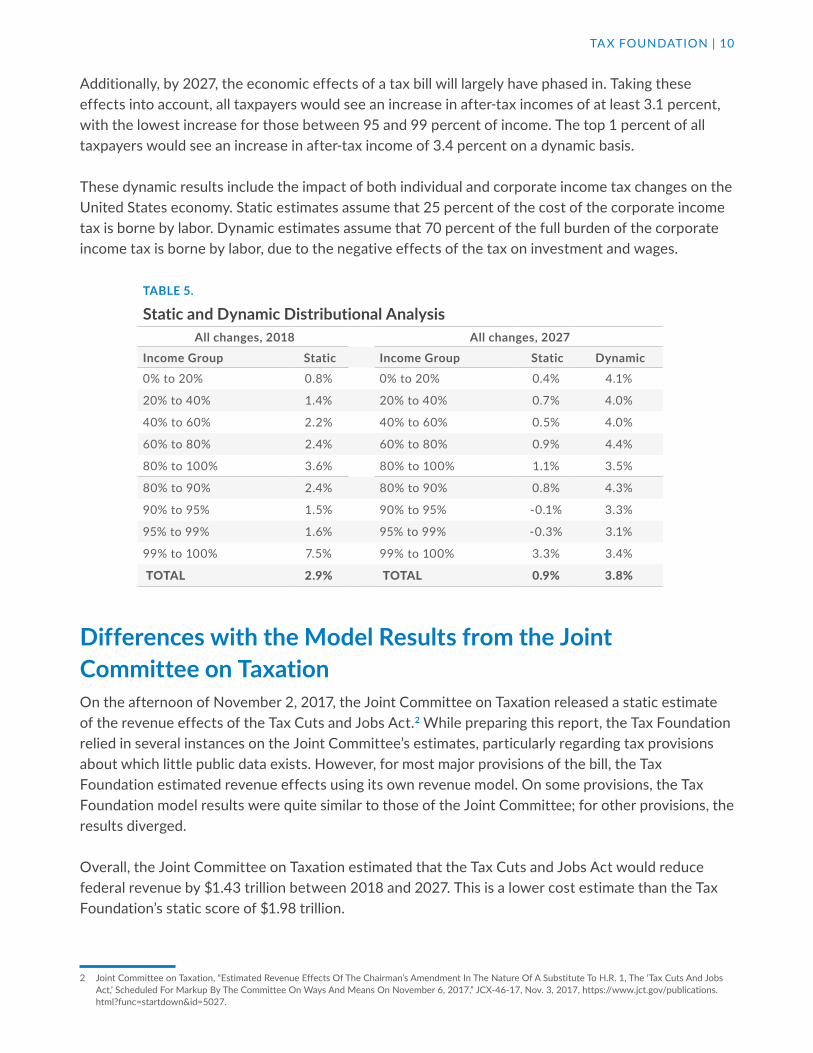
Additionally, by 2027, the economic effects of a tax bill will largely have phased in. Taking these effects into account, all taxpayers would see an increase in after-tax incomes of at least 3.1 percent, with the lowest increase for those between 95 and 99 percent of income. The top 1 percent of all taxpayers would see an increase in after-tax income of 3.4 percent on a dynamic basis.
These dynamic results include the impact of both individual and corporate income tax changes on the United States economy. Static estimates assume that 25 percent of the cost of the corporate income tax is borne by labor. Dynamic estimates assume that 70 percent of the full burden of the corporate income tax is borne by labor, due to the negative effects of the tax on investment and wages.
Differences with the Model Results from the Joint Committee on TaxationOn the afternoon of November 2, 2017, the Joint Committee on Taxation released a static estimate of the revenue effects of the Tax Cuts and Jobs Act.2 While preparing this report, the Tax Foundation relied in several instances on the Joint Committee’s estimates, particularly regarding tax provisions about which little public data exists. However, for most major provisions of the bill, the Tax Foundation estimated revenue effects using its own revenue model. On some provisions, the Tax Foundation model results were quite similar to those of the Joint Committee; for other provisions, the results diverged.
Overall, the Joint Committee on Taxation estimated that the Tax Cuts and Jobs Act would reduce federal revenue by $1.43 trillion between 2018 and 2027. This is a lower cost estimate than the Tax Foundation’s static score of $1.98 trillion.
2 Joint Committee on Taxation, “Estimated Revenue Effects Of The Chairman’s Amendment In The Nature Of A Substitute To H.R. 1, The ‘Tax Cuts And Jobs Act,’ Scheduled For Markup By The Committee On Ways And Means On November 6, 2017,” JCX-46-17, Nov. 3, 2017, https://www.jct.gov/publications.html?func=startdown&id=5027.
TABLE 5.
Static and Dynamic Distributional AnalysisAll changes, 2018 All changes, 2027
Income Group Static Income Group Static Dynamic0% to 20% 0.8% 0% to 20% 0.4% 4.1%
20% to 40% 1.4% 20% to 40% 0.7% 4.0%
40% to 60% 2.2% 40% to 60% 0.5% 4.0%
60% to 80% 2.4% 60% to 80% 0.9% 4.4%
80% to 100% 3.6% 80% to 100% 1.1% 3.5%
80% to 90% 2.4% 80% to 90% 0.8% 4.3%
90% to 95% 1.5% 90% to 95% -0.1% 3.3%
95% to 99% 1.6% 95% to 99% -0.3% 3.1%
99% to 100% 7.5% 99% to 100% 3.3% 3.4%
TOTAL 2.9% TOTAL 0.9% 3.8%
TAX FOUNDATION | 11
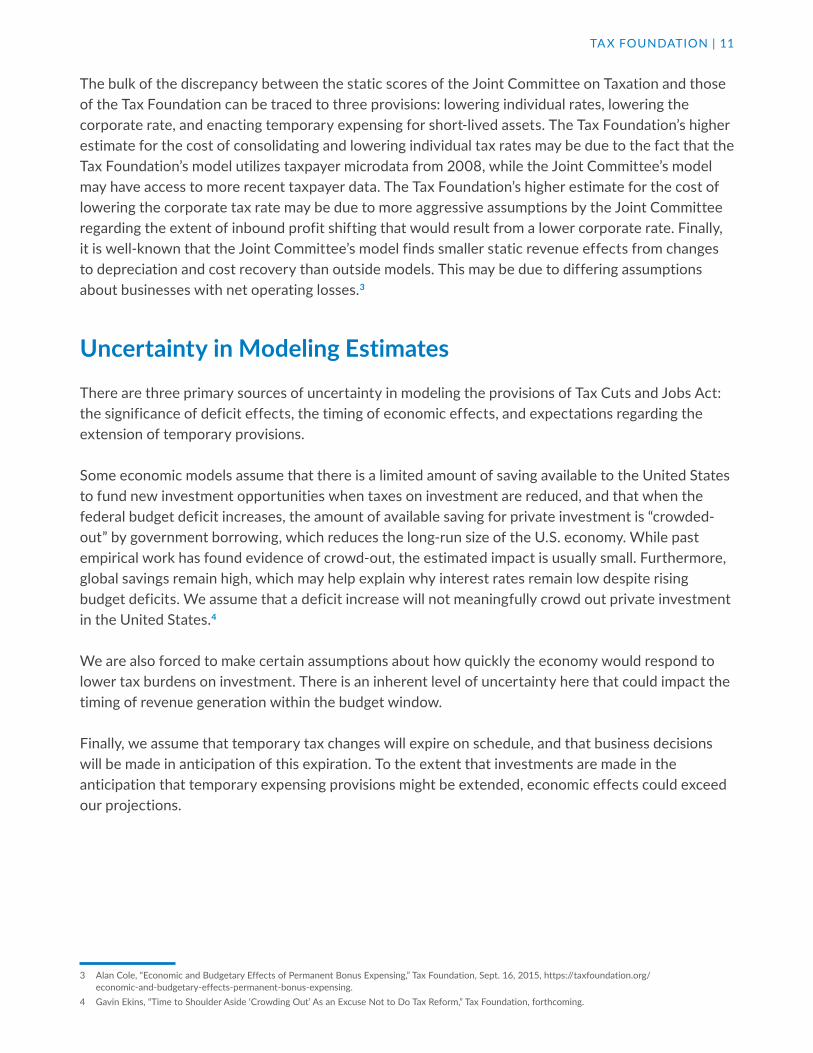
The bulk of the discrepancy between the static scores of the Joint Committee on Taxation and those of the Tax Foundation can be traced to three provisions: lowering individual rates, lowering the corporate rate, and enacting temporary expensing for short-lived assets. The Tax Foundation’s higher estimate for the cost of consolidating and lowering individual tax rates may be due to the fact that the Tax Foundation’s model utilizes taxpayer microdata from 2008, while the Joint Committee’s model may have access to more recent taxpayer data. The Tax Foundation’s higher estimate for the cost of lowering the corporate tax rate may be due to more aggressive assumptions by the Joint Committee regarding the extent of inbound profit shifting that would result from a lower corporate rate. Finally, it is well-known that the Joint Committee’s model finds smaller static revenue effects from changes to depreciation and cost recovery than outside models. This may be due to differing assumptions about businesses with net operating losses.3
Uncertainty in Modeling EstimatesThere are three primary sources of uncertainty in modeling the provisions of Tax Cuts and Jobs Act: the significance of deficit effects, the timing of economic effects, and expectations regarding the extension of temporary provisions.
Some economic models assume that there is a limited amount of saving available to the United States to fund new investment opportunities when taxes on investment are reduced, and that when the federal budget deficit increases, the amount of available saving for private investment is “crowded-out” by government borrowing, which reduces the long-run size of the U.S. economy. While past empirical work has found evidence of crowd-out, the estimated impact is usually small. Furthermore, global savings remain high, which may help explain why interest rates remain low despite rising budget deficits. We assume that a deficit increase will not meaningfully crowd out private investment in the United States.4
We are also forced to make certain assumptions about how quickly the economy would respond to lower tax burdens on investment. There is an inherent level of uncertainty here that could impact the timing of revenue generation within the budget window.
Finally, we assume that temporary tax changes will expire on schedule, and that business decisions will be made in anticipation of this expiration. To the extent that investments are made in the anticipation that temporary expensing provisions might be extended, economic effects could exceed our projections.
3 Alan Cole, “Economic and Budgetary Effects of Permanent Bonus Expensing,” Tax Foundation, Sept. 16, 2015, https://taxfoundation.org/economic-and-budgetary-effects-permanent-bonus-expensing.
4 Gavin Ekins, “Time to Shoulder Aside ‘Crowding Out’ As an Excuse Not to Do Tax Reform,” Tax Foundation, forthcoming.
TAX FOUNDATION | 12
ConclusionThe Tax Cuts and Jobs Act represents a dramatic overhaul of the U.S. tax code. Our model results indicate that the Tax Cuts and Jobs Act would be pro-growth, boosting long-run GDP by 3.5 percent and increasing the domestic capital stock by 9.3 percent. Wages, long stagnant, would increase by 2.7 percent, while the reform would produce 890,000 new jobs. These economic effects would have a substantial impact on revenues as well, as indicated by the plan’s significantly lower revenue losses under dynamic scoring. On a static basis, the plan would reduce federal revenue by $1.98 trillion over the decade, with some of the revenue loss coming from one-time transitional costs.
TAX FOUNDATION | 13
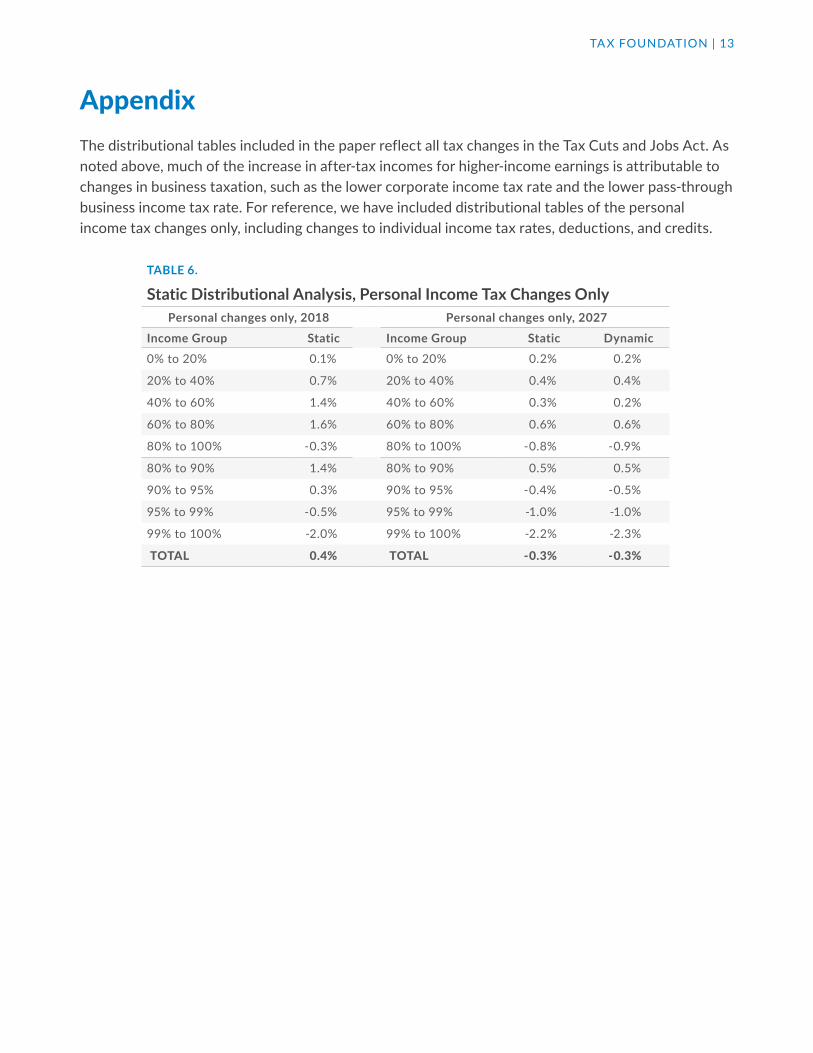
AppendixThe distributional tables included in the paper reflect all tax changes in the Tax Cuts and Jobs Act. As noted above, much of the increase in after-tax incomes for higher-income earnings is attributable to changes in business taxation, such as the lower corporate income tax rate and the lower pass-through business income tax rate. For reference, we have included distributional tables of the personal income tax changes only, including changes to individual income tax rates, deductions, and credits.
TABLE 6.
Static Distributional Analysis, Personal Income Tax Changes OnlyPersonal changes only, 2018 Personal changes only, 2027
Income Group Static Income Group Static Dynamic0% to 20% 0.1% 0% to 20% 0.2% 0.2%
20% to 40% 0.7% 20% to 40% 0.4% 0.4%
40% to 60% 1.4% 40% to 60% 0.3% 0.2%
60% to 80% 1.6% 60% to 80% 0.6% 0.6%
80% to 100% -0.3% 80% to 100% -0.8% -0.9%
80% to 90% 1.4% 80% to 90% 0.5% 0.5%
90% to 95% 0.3% 90% to 95% -0.4% -0.5%
95% to 99% -0.5% 95% to 99% -1.0% -1.0%
99% to 100% -2.0% 99% to 100% -2.2% -2.3%
TOTAL 0.4% TOTAL -0.3% -0.3%