Embed Size (px)
Citation preview
Detecting Microplastics in Water Streams Using Fluorescence Spectroscopy
Primary Authors: Amy Bigelow & Cari Campbell
Co-Authors: Fed Pinongcos, Natalie MladenovSan Diego State University – Dept. Environmental Engineering
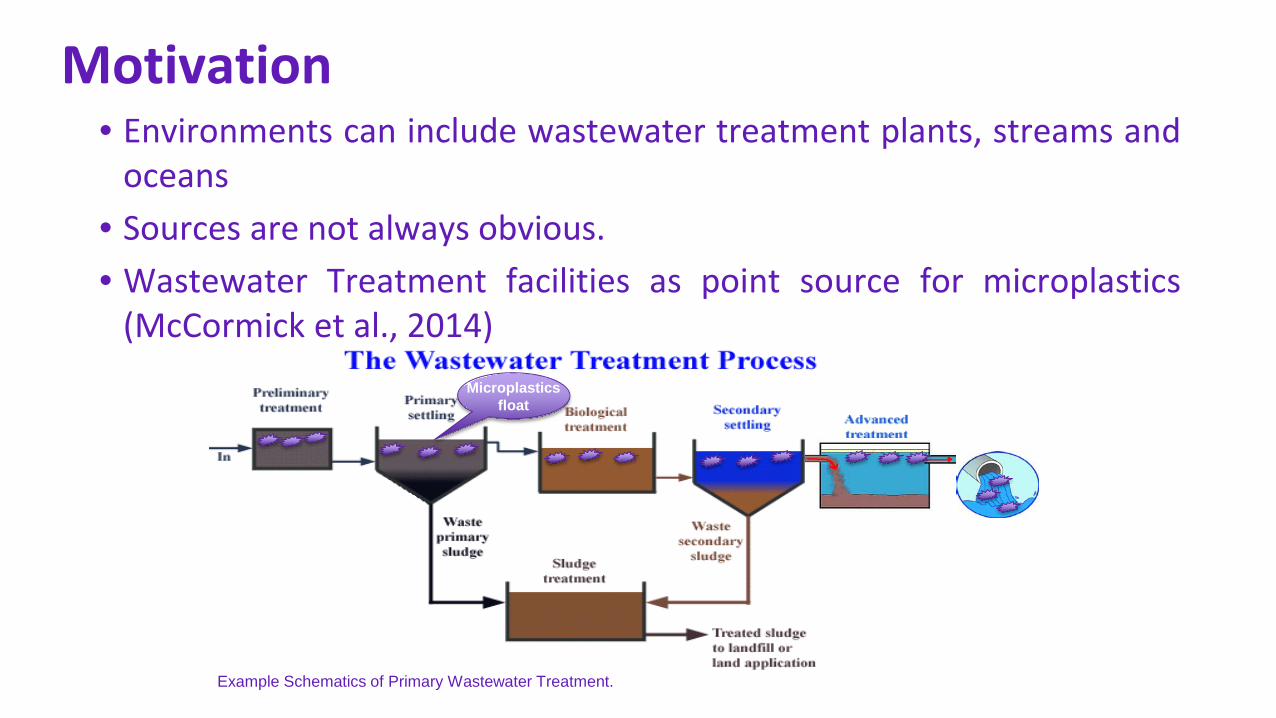
Motivation• Environments can include wastewater treatment plants, streams and
oceans• Sources are not always obvious.• Wastewater Treatment facilities as point source for microplastics
(McCormick et al., 2014)Microplastics
float
Example Schematics of Primary Wastewater Treatment.
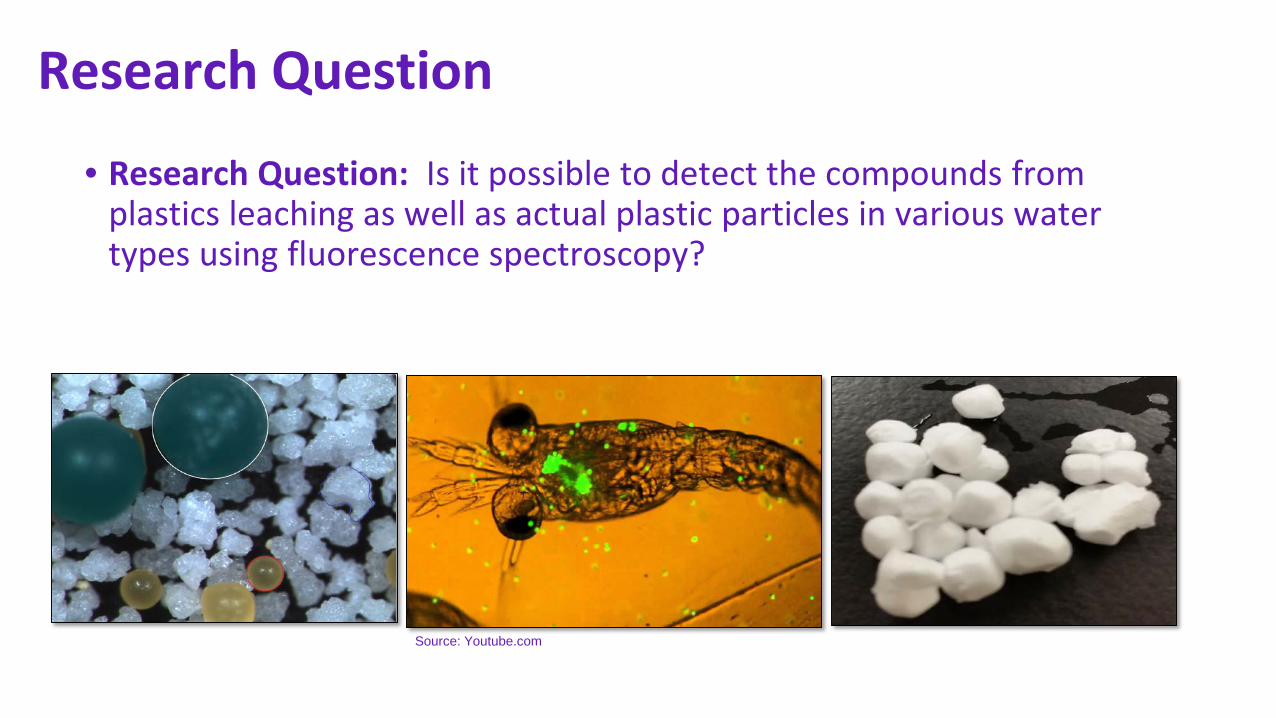
Research Question
• Research Question: Is it possible to detect the compounds from plastics leaching as well as actual plastic particles in various water types using fluorescence spectroscopy?
Source: Youtube.com
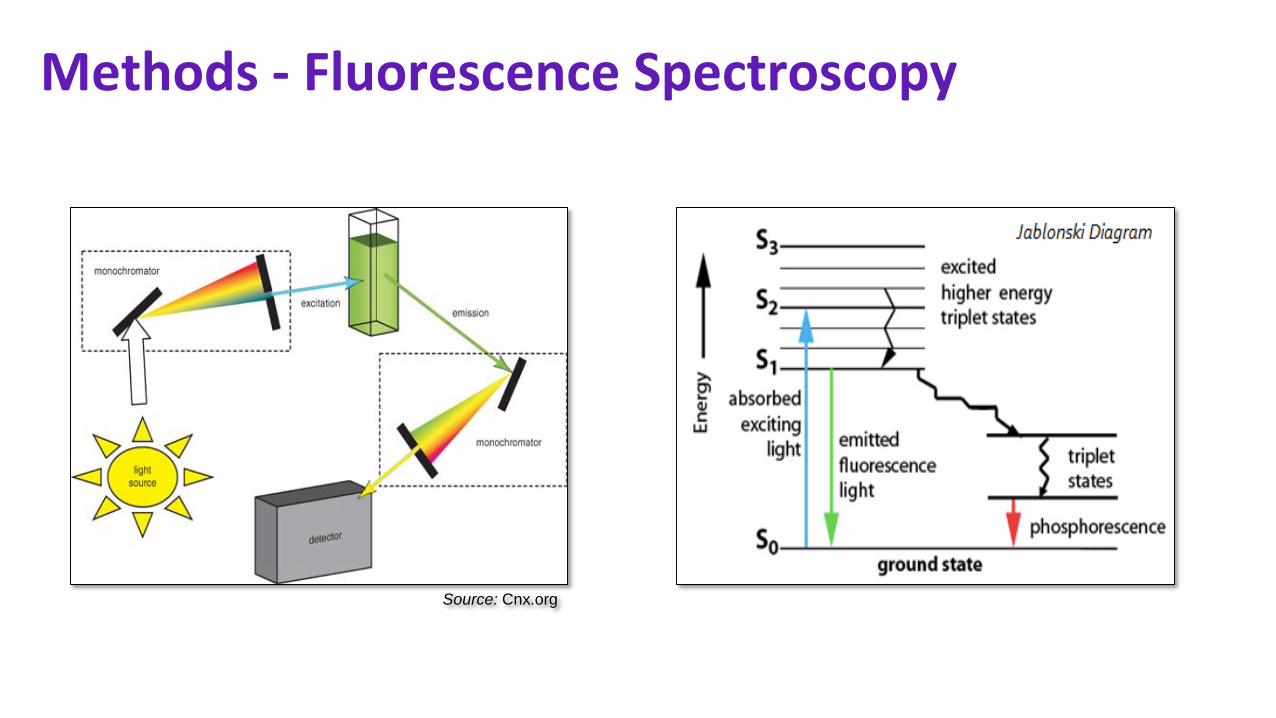
Methods - Fluorescence Spectroscopy
Source: Cnx.org
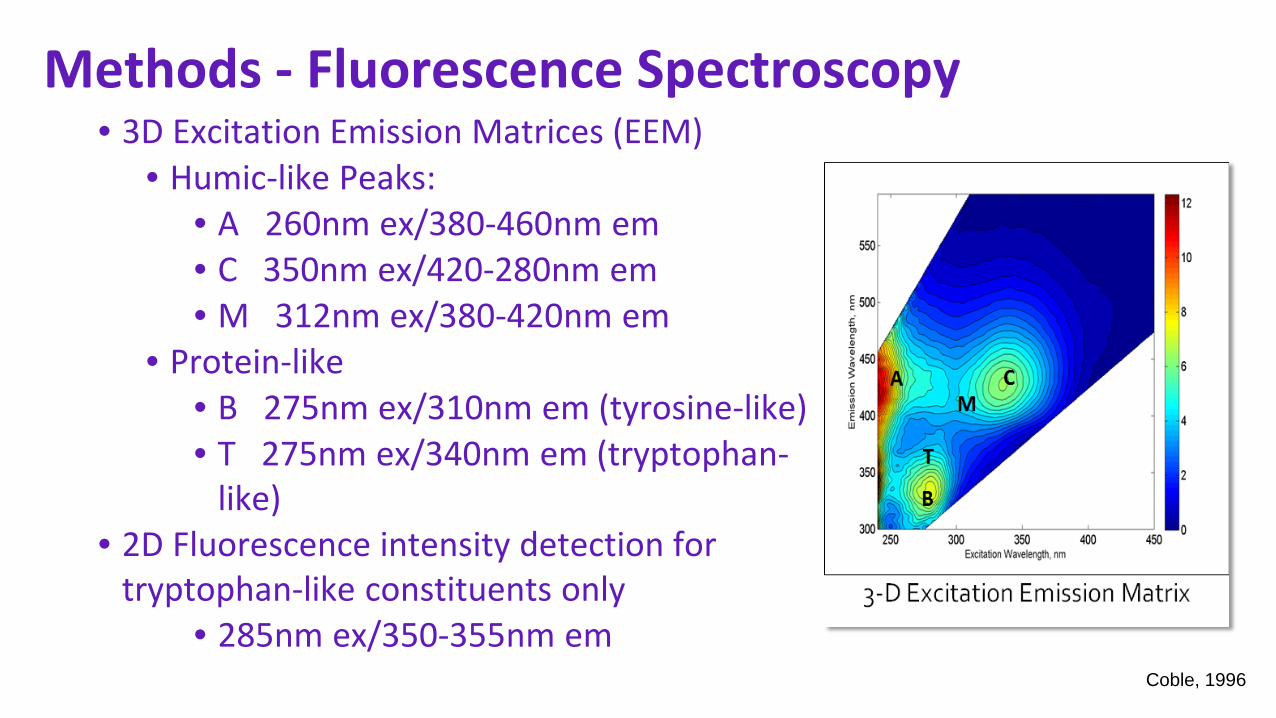
Methods - Fluorescence Spectroscopy• 3D Excitation Emission Matrices (EEM)
• Humic-like Peaks:• A 260nm ex/380-460nm em• C 350nm ex/420-280nm em• M 312nm ex/380-420nm em
• Protein-like• B 275nm ex/310nm em (tyrosine-like)• T 275nm ex/340nm em (tryptophan-
like)• 2D Fluorescence intensity detection for
tryptophan-like constituents only• 285nm ex/350-355nm em
Coble, 1996
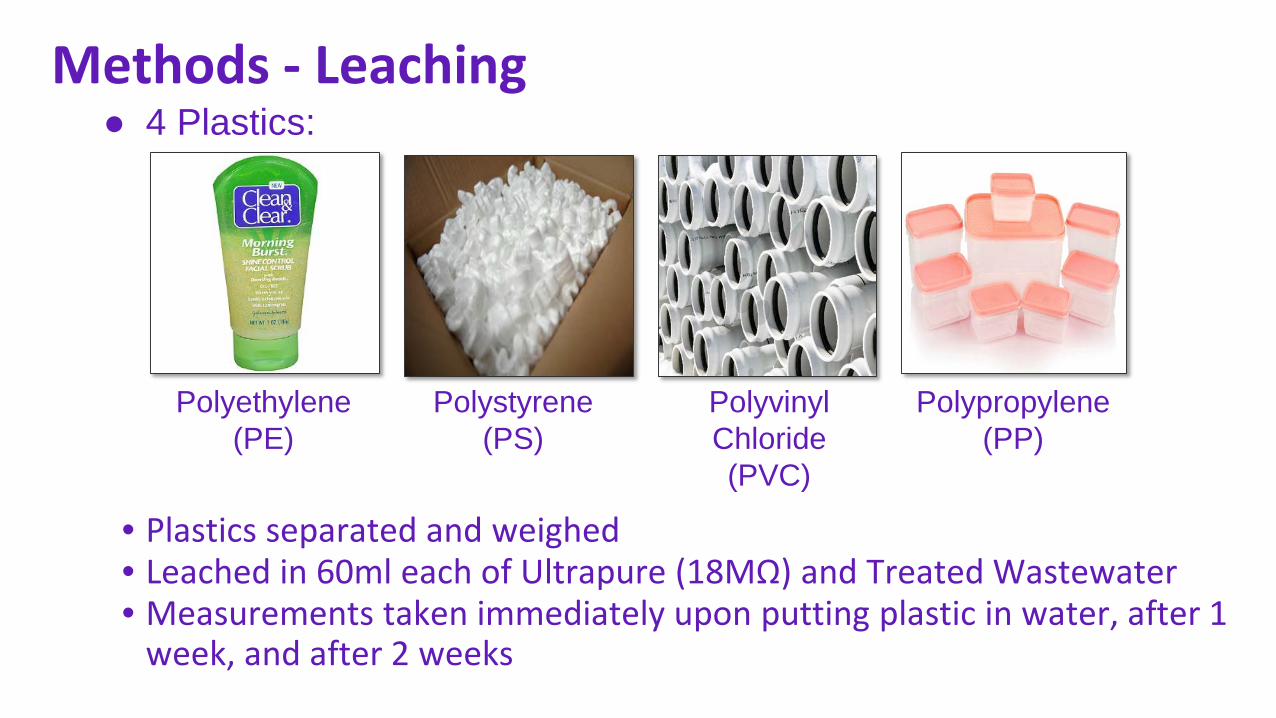
Methods - Leaching
• Plastics separated and weighed• Leached in 60ml each of Ultrapure (18MΩ) and Treated Wastewater• Measurements taken immediately upon putting plastic in water, after 1
week, and after 2 weeks
4 Plastics:
Polyethylene (PE)
Polystyrene (PS)
Polyvinyl Chloride (PVC)
Polypropylene (PP)
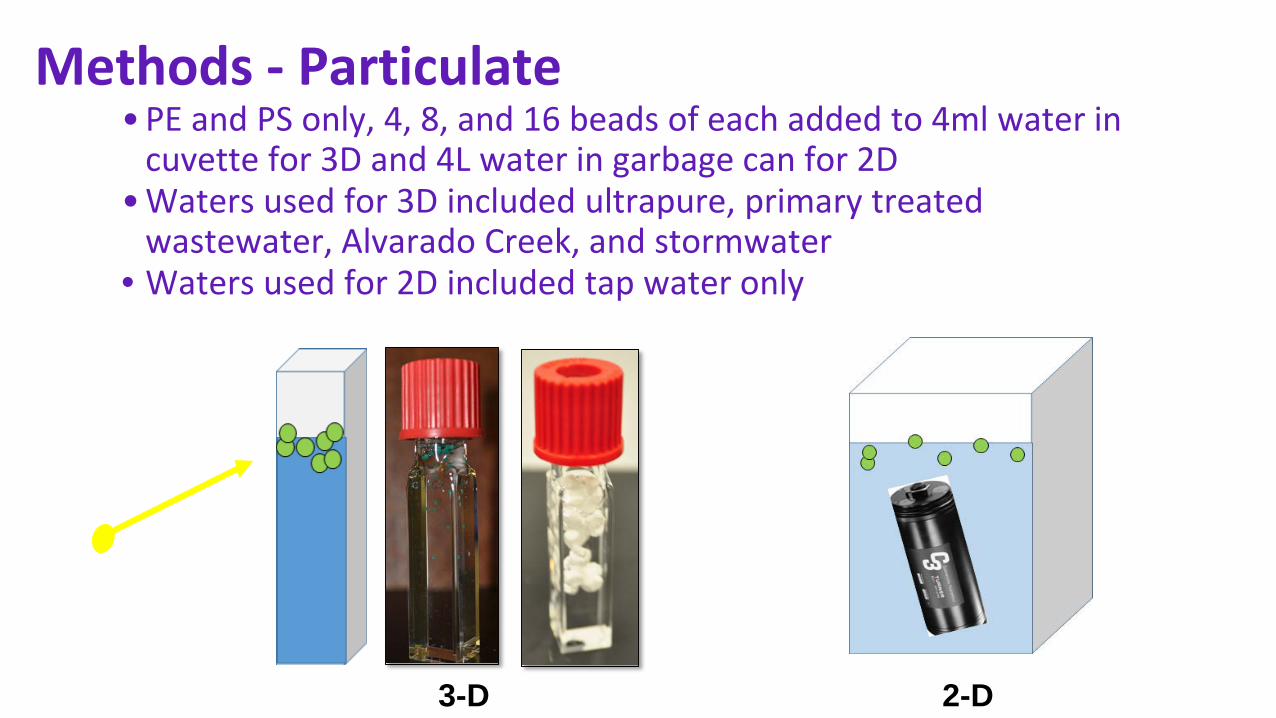
Methods - Particulate• PE and PS only, 4, 8, and 16 beads of each added to 4ml water in
cuvette for 3D and 4L water in garbage can for 2D • Waters used for 3D included ultrapure, primary treated
wastewater, Alvarado Creek, and stormwater• Waters used for 2D included tap water only
2-D3-D
Results - Leaching
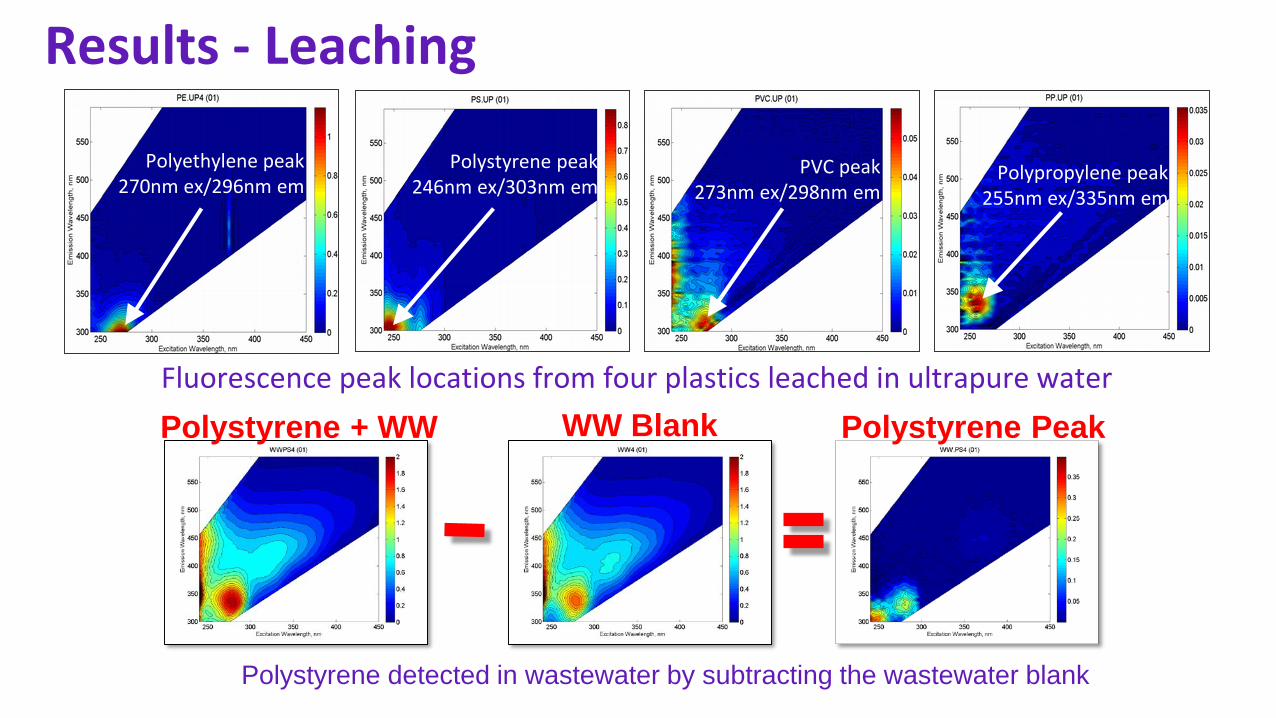
Fluorescence peak locations from four plastics leached in ultrapure water
PVC peak 273nm ex/298nm em
Polypropylene peak 255nm ex/335nm em
Polyethylene peak270nm ex/296nm em
Polystyrene peak 246nm ex/303nm em
Polystyrene PeakPolystyrene + WW WW Blank
Polystyrene detected in wastewater by subtracting the wastewater blank
Results – Leaching
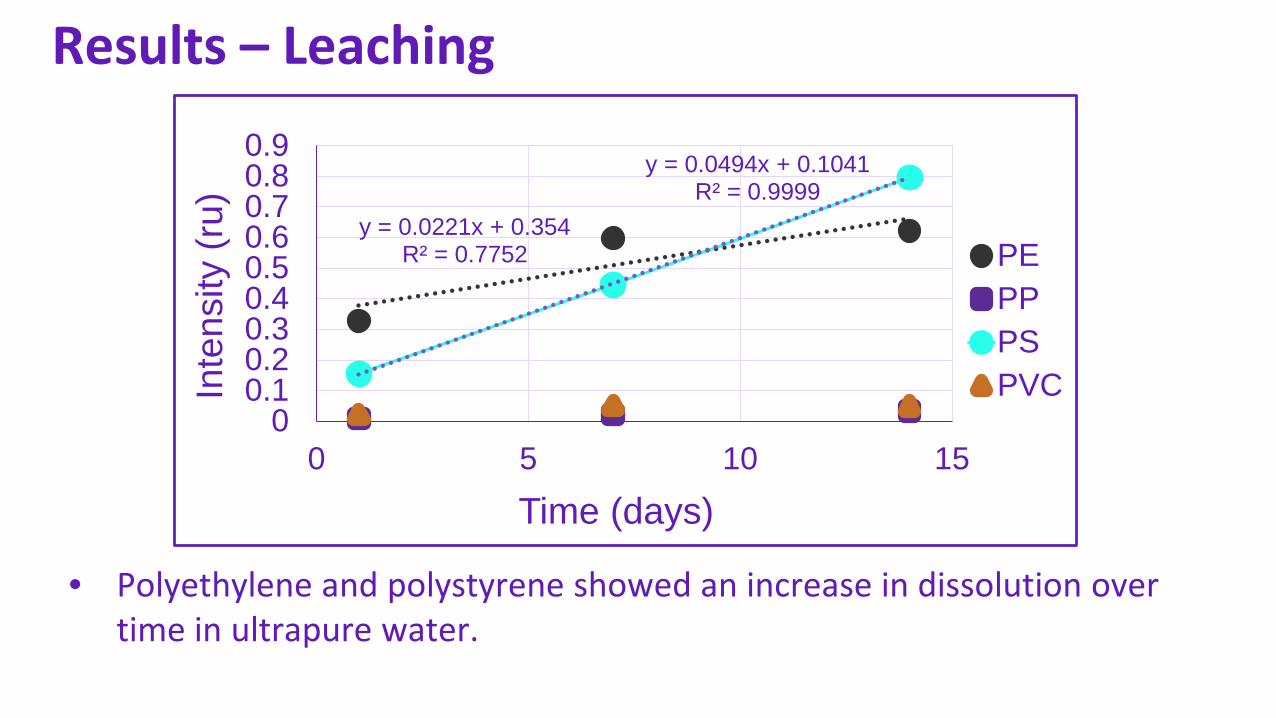
• Polyethylene and polystyrene showed an increase in dissolution over time in ultrapure water.
y = 0.0221x + 0.354R² = 0.7752
y = 0.0494x + 0.1041R² = 0.9999
00.10.20.30.40.50.60.70.80.9
0 5 10 15
Inte
nsity
(ru)
Time (days)
PEPPPSPVC
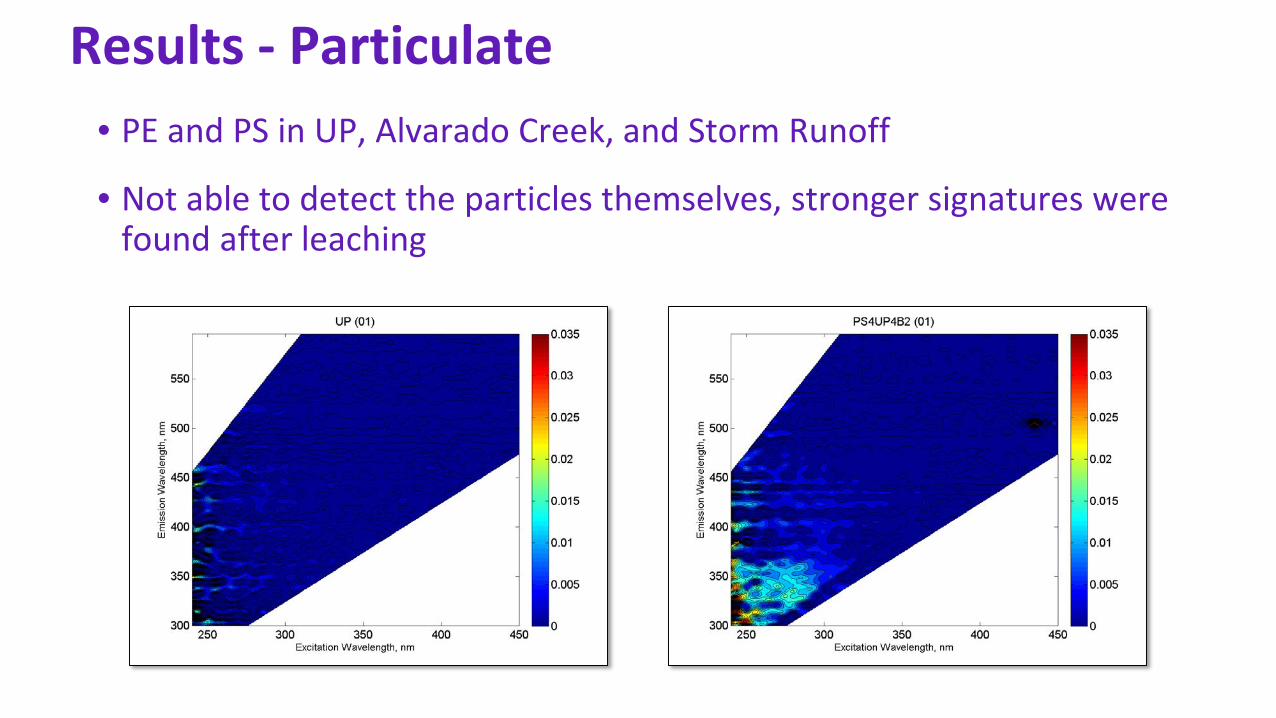
• PE and PS in UP, Alvarado Creek, and Storm Runoff
• Not able to detect the particles themselves, stronger signatures were found after leaching
Results - Particulate
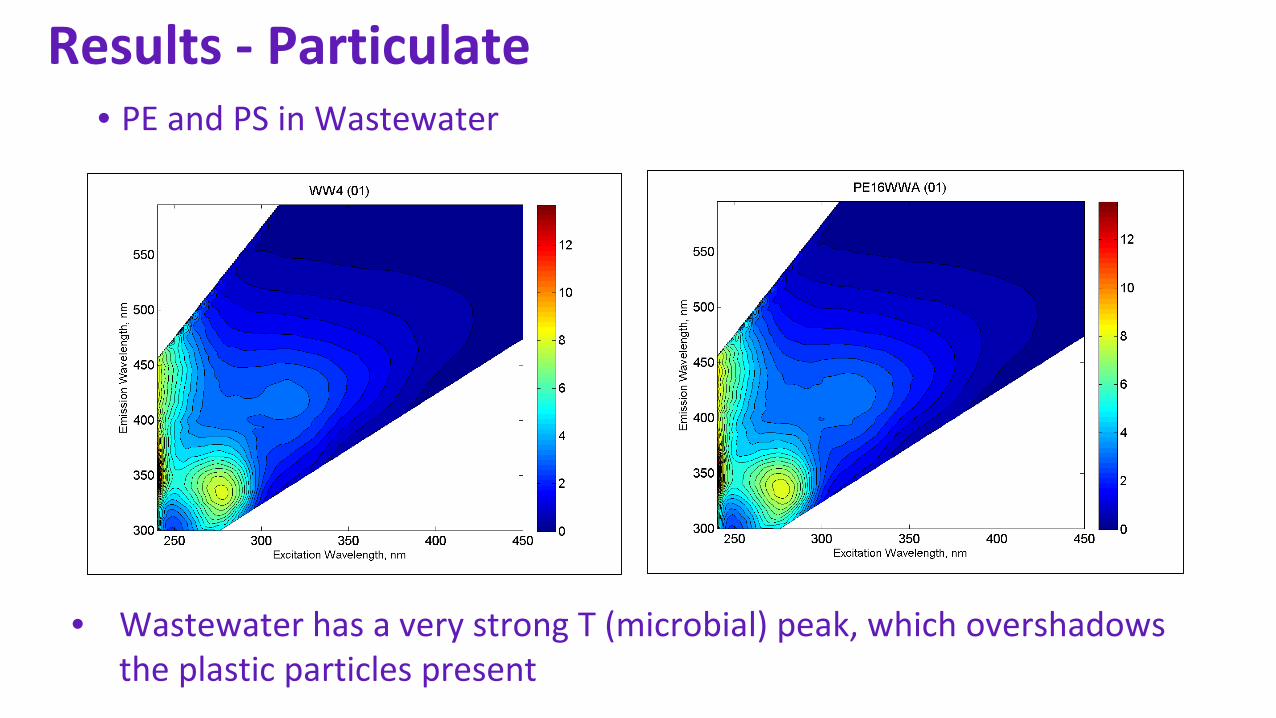
Results - Particulate• PE and PS in Wastewater
• Wastewater has a very strong T (microbial) peak, which overshadows the plastic particles present

Cyclops Detection
Detection Using Tryptophan-like Peak
SD Tapwater 8 PE + Tap PE layer + Tap 8 PS + Tap PS layer + Tap
117.34 149.44 144.09 117.34 124.47
*All values in relative fluorescence units (RFU)
Conclusion• Plastic fluorophores peaked at different excitation/emission
wavelengths
• Detection of PE and PS leaching is possible in wastewater and ultrapure water
• Highest fluorescence yield from PS and PE whereas polypropylene and PVC leached very little organic matter
• Detection of actual particles for 3D fluorescence limited to ultrapure water only
• Detection of PE only using 2D fluorescence
Future Work• Design equipment to track specific plastic type
• Testing in other water types: seawater, wastewater outfall, lakes
• Experiment with solar radiation and heat on microplastic detection

Questions?
We’d like to thank our fellow researchers: Fed Pinongcos, Loren Miller, Kyle Nelson, and Alexa Zapata as well as San Diego State University faculty member and mentor Natalie Mladenov