Embed Size (px)
Citation preview
Detecting moderator e
sales
ABSTRACT
The purpose of this study
moderator effects in empirical sales research.
coefficients were collected from 340
meta-analysis was applied to generate 1,873 construct relationships.
(correlations) means and their corrected
relationships with strong moderator effects
performance, eighty-nine construct relationships
study results, researchers not only can comprehensively understand the strength of construct
relationships but also may discover possible mo
Keywords: Moderator effects, Construct relationships, Sales r
Journal of Management and Marketing Research
Detecting moderator effects
effects on construct relationships in
ales research: a meta-analysis
Chien-Chung Chen
Stillman College
study is to identify the construct relationships that may have strong
moderator effects in empirical sales research. In this study, six thousand and seven
from 340 empirical sales articles in 12 key marketing journals.
to generate 1,873 construct relationships. According to
corrected variances, three hundred twenty-eight construct
s with strong moderator effects were identified. Further, focusing on job
construct relationships show strong moderator effects. Based on the
, researchers not only can comprehensively understand the strength of construct
relationships but also may discover possible moderators.
Moderator effects, Construct relationships, Sales research, Meta-analysis
Journal of Management and Marketing Research
Detecting moderator effects, Page 1
elationships in empirical
is to identify the construct relationships that may have strong
and seven correlation
es in 12 key marketing journals. Then,
According to the effect size
construct
sing on job
show strong moderator effects. Based on the
, researchers not only can comprehensively understand the strength of construct
analysis, Effect size
INTRODUCTION
Moderators provide certain conditions for hypothesized effects and determine whethe
the effects exist (Cortina & Folger
variable, a moderator may change the direction or strength of a construct relationship. For
example, Jaramillo, Grisaffe, Chonko, and
leadership has a positive impact on salespeople’s customer orientation; however, the influence is
weak for experienced salespeople. In other words, salespeople’s experience moderates the
relationship between servant leadership and customer orientation. Therefore, moderat
determine the establishment of a theory under certain conditions.
The concept of moderator detection is that if 1) a variance is sufficiently large or 2) a
confidence interval includes zero with positive and negative effect sizes, there is prob
more moderators. In this study, statistical power is the probability of correctly rejecting the null
hypothesis of mean of effect sizes equal to zero when the null hypothesis is false. Statistical
power was also applied for assessing the soundn
the occurrence of a Type II error. Statistical power of .8 or higher is typically deemed ac
(MacCallum, Browne, & Sugawara
higher and the 90% confidence intervals of a bivariate relationship excludes zero, we can
conclude that a significant relationship exists between their constructs.
.8 (statistical power) was used to classify the 1,873 effect sizes into two groups. T
with statistical power of .8 or higher, includes 819 construct relationships; 280 of them may have
larger variances (larger than the mean of the 819 corrected variances .0124). The second group,
with statistical power lower than .8, include
intervals including zero; 48 of them have positive and negative correlations.
According to a literature review, no study systematically analyzes construct relationships
and identifies those that may have strong
is to fully identify the construct relationships that may have strong moderator effects in empirical
sales research. Further, researchers may focus on construct relationships in order to explore
potential moderators from method, contextual, or theoretical factors.
THEORY AND BACKGROUND
According to the attributions of predictor and moderator (categorical or continuous
variables), moderator effects are tested using various methods, namely, correlatio
multiple regressions, analysis of variance (ANOVA), and hierarchical multiple regression (Baron
& Kenny, 1986; Frazier, Tix, & Barron
focus on analyses of the heterogeneity of effect sizes (s
moderators in meta-analysis, researchers have used several statistics, such as Q
confidence intervals, interval size, and the Schmidt
research studies have also used statistical power to evaluate the soundness of research findings
(e.g., Kemery, Mossholder, & Roth
1993).
Q-statistic is the most widely used method for determining whether the effect
studies are homogeneous or heterogeneous (Huedo
& Botella, 2006). A significant Q
larger than expected by sampling error;
Journal of Management and Marketing Research
Detecting moderator effects
Moderators provide certain conditions for hypothesized effects and determine whethe
Folger, 1998). Therefore, through the interaction with an independent
variable, a moderator may change the direction or strength of a construct relationship. For
Grisaffe, Chonko, and Roberts (2009) found that managers’ servant
a positive impact on salespeople’s customer orientation; however, the influence is
weak for experienced salespeople. In other words, salespeople’s experience moderates the
relationship between servant leadership and customer orientation. Therefore, moderat
determine the establishment of a theory under certain conditions.
The concept of moderator detection is that if 1) a variance is sufficiently large or 2) a
confidence interval includes zero with positive and negative effect sizes, there is prob
more moderators. In this study, statistical power is the probability of correctly rejecting the null
hypothesis of mean of effect sizes equal to zero when the null hypothesis is false. Statistical
power was also applied for assessing the soundness of meta-analysis findings, and thus avoiding
the occurrence of a Type II error. Statistical power of .8 or higher is typically deemed ac
Sugawara, 1996; McQuitty, 2004). When statistical power is .8 or
onfidence intervals of a bivariate relationship excludes zero, we can
conclude that a significant relationship exists between their constructs. In this study
.8 (statistical power) was used to classify the 1,873 effect sizes into two groups. T
with statistical power of .8 or higher, includes 819 construct relationships; 280 of them may have
larger variances (larger than the mean of the 819 corrected variances .0124). The second group,
with statistical power lower than .8, includes 281 construct relationships with confidence
intervals including zero; 48 of them have positive and negative correlations.
According to a literature review, no study systematically analyzes construct relationships
and identifies those that may have strong moderator effects. Therefore, the purpose of this study
is to fully identify the construct relationships that may have strong moderator effects in empirical
sales research. Further, researchers may focus on construct relationships in order to explore
ntial moderators from method, contextual, or theoretical factors.
BACKGROUND
According to the attributions of predictor and moderator (categorical or continuous
variables), moderator effects are tested using various methods, namely, correlatio
multiple regressions, analysis of variance (ANOVA), and hierarchical multiple regression (Baron
Barron, 2004). Studies of moderator effects in meta
focus on analyses of the heterogeneity of effect sizes (study conditions). In order to detect
analysis, researchers have used several statistics, such as Q-statistic, I
confidence intervals, interval size, and the Schmidt-Hunter ratio (75%, 90%). Moreover, several
also used statistical power to evaluate the soundness of research findings
Roth, 1987; Sackett, Harris, & Orr, 1986; Sagie &
statistic is the most widely used method for determining whether the effect
studies are homogeneous or heterogeneous (Huedo-Medina, Sa´nchez-Meca, Marı´n
2006). A significant Q-statistic value means that the variance across sample studies is
larger than expected by sampling error; this indicates that moderator effects are present. On the
Journal of Management and Marketing Research
Detecting moderator effects, Page 2
Moderators provide certain conditions for hypothesized effects and determine whether
1998). Therefore, through the interaction with an independent
variable, a moderator may change the direction or strength of a construct relationship. For
(2009) found that managers’ servant
a positive impact on salespeople’s customer orientation; however, the influence is
weak for experienced salespeople. In other words, salespeople’s experience moderates the
relationship between servant leadership and customer orientation. Therefore, moderator effects
The concept of moderator detection is that if 1) a variance is sufficiently large or 2) a
confidence interval includes zero with positive and negative effect sizes, there is probably one or
more moderators. In this study, statistical power is the probability of correctly rejecting the null
hypothesis of mean of effect sizes equal to zero when the null hypothesis is false. Statistical
analysis findings, and thus avoiding
the occurrence of a Type II error. Statistical power of .8 or higher is typically deemed acceptable
2004). When statistical power is .8 or
onfidence intervals of a bivariate relationship excludes zero, we can
In this study, a cutoff of
.8 (statistical power) was used to classify the 1,873 effect sizes into two groups. The first group,
with statistical power of .8 or higher, includes 819 construct relationships; 280 of them may have
larger variances (larger than the mean of the 819 corrected variances .0124). The second group,
s 281 construct relationships with confidence
According to a literature review, no study systematically analyzes construct relationships
moderator effects. Therefore, the purpose of this study
is to fully identify the construct relationships that may have strong moderator effects in empirical
sales research. Further, researchers may focus on construct relationships in order to explore
According to the attributions of predictor and moderator (categorical or continuous
variables), moderator effects are tested using various methods, namely, correlation methods,
multiple regressions, analysis of variance (ANOVA), and hierarchical multiple regression (Baron
2004). Studies of moderator effects in meta-analysis
tudy conditions). In order to detect
statistic, I2 index,
Hunter ratio (75%, 90%). Moreover, several
also used statistical power to evaluate the soundness of research findings
& Koslowsky,
statistic is the most widely used method for determining whether the effect sizes across
Meca, Marı´n-Martı´nez,
statistic value means that the variance across sample studies is
that moderator effects are present. On the
contrary, an insignificant Q-statistic value implies the absence of moderator effects. In addition
to Q-statistic, confidence intervals are also used to detect moderators. The concept of confidence
intervals is that if 1) a variance is sufficiently large or 2) a confidence interval includes zero, a
moderator effect probably exists (one or more moderators). A large interval indicates that there
may be several sub-populations present. The interval including zero also
probably are positive or negative effect sizes. On the other hand, if the interval is small or does
not include zero, a moderator is unlikely to be present (
Koslowsky & Sagie, 1993; Pearlman, Schmidt,
The magnitudes of variances are meaningful when the means of effect sizes are not zero.
However, there is lack of agreement regarding the number of effect sizes that are necessary. For
example, some meta-analysis studies e
effect sizes in every relationship (e.g., Witter
three or four correlations in every relationship, and, recently
(2003) as well as Carrillat, Jaramillo, and
power of effect sizes provides a less debated approach to decide the number of effect sizes for
meaningful meta-analytical results.
Statistical power is the probability of rejecting the null hypothesis when it is false; in
other words, making a correct decision. In this study, statistical power is the probability of
correctly rejecting the null hypothesis of the mean of effect sizes equal to zero when the null
hypothesis is false. A statistical power of at least .8 (
likely implies that the mean of effect sizes is meaningful; thus, a further analysis of its variance
is necessary.
This study applied statistical power, vari
identify the construct relationships that may have strong moderator effects in empirical sales
research. Moreover, Q-statistic was also used in order to determine the soundness of findings.
Taken together, these statistics are rather helpful in evaluating the effect of a moderator on
central bivariate relationships in sales. This essay includes three procedures. First, the research
procedure section presents data sources, analysis processes, and statistics used to
means, variances of effect sizes (correlation coefficients), and moderator effects. Then, the
results section presents the means and variances of effect sizes, and lists the construct
relationships that may have strong moderator effects. Most
identify construct relationships under the dimensions of effect size means and moderator
magnitudes. Thereafter, the relationships of Job performance and its related constructs
demonstrate the functions of the findin
motivation have positive and negative correlations.
limitations, implications, and subjects for future research.
RESEARCH PROCEDURE
Data Sources
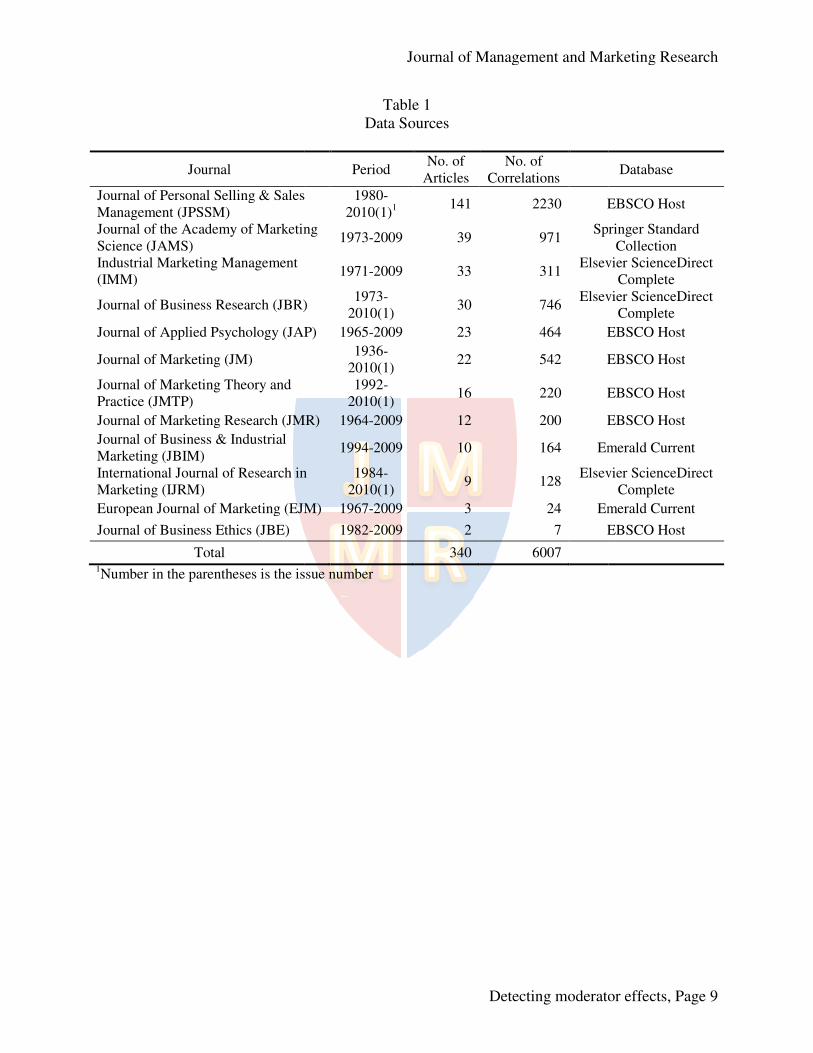
The study reviewed all the empirical sales articles from 12 key marketing journals
(JPSSM, JAMS, IMM, JBR, JAP,
databases (EBSCO Host, Elsevier ScienceDirect Complete, Emerald Current, and Springer
Standard Collection) across the period from 1936 to January 2010 (
earliest usable article was published in the
Journal of Management and Marketing Research
Detecting moderator effects
statistic value implies the absence of moderator effects. In addition
statistic, confidence intervals are also used to detect moderators. The concept of confidence
at if 1) a variance is sufficiently large or 2) a confidence interval includes zero, a
moderator effect probably exists (one or more moderators). A large interval indicates that there
populations present. The interval including zero also implies that there
probably are positive or negative effect sizes. On the other hand, if the interval is small or does
not include zero, a moderator is unlikely to be present (Kemery, Mossholder, & Dunlap
1993; Pearlman, Schmidt, & Hunter, 1980; Whitener, 1990).
The magnitudes of variances are meaningful when the means of effect sizes are not zero.
However, there is lack of agreement regarding the number of effect sizes that are necessary. For
analysis studies employed a stricter approach and suggested at least 10
effect sizes in every relationship (e.g., Witter, Okun, Stock, & Haring, 1984). Others used at least
three or four correlations in every relationship, and, recently, Arthur, Bennet, Edens, and Bell
, Jaramillo, and Mulki (2009) adopted at least five. The statistical
power of effect sizes provides a less debated approach to decide the number of effect sizes for
analytical results.
probability of rejecting the null hypothesis when it is false; in
other words, making a correct decision. In this study, statistical power is the probability of
correctly rejecting the null hypothesis of the mean of effect sizes equal to zero when the null
hypothesis is false. A statistical power of at least .8 (MacCallum et al., 1996; McQuitty
likely implies that the mean of effect sizes is meaningful; thus, a further analysis of its variance
This study applied statistical power, variances, and confidence intervals in order to
identify the construct relationships that may have strong moderator effects in empirical sales
statistic was also used in order to determine the soundness of findings.
statistics are rather helpful in evaluating the effect of a moderator on
central bivariate relationships in sales. This essay includes three procedures. First, the research
procedure section presents data sources, analysis processes, and statistics used to
means, variances of effect sizes (correlation coefficients), and moderator effects. Then, the
results section presents the means and variances of effect sizes, and lists the construct
relationships that may have strong moderator effects. Most importantly, the tables clearly
identify construct relationships under the dimensions of effect size means and moderator
magnitudes. Thereafter, the relationships of Job performance and its related constructs
demonstrate the functions of the findings. For example, Job performance and Extrinsic
motivation have positive and negative correlations. Finally, the conclusions section discusses the
limitations, implications, and subjects for future research.
the empirical sales articles from 12 key marketing journals
, JM, JMTP, JMR, JBIM, IJRM, EJM, and JBE) in four
EBSCO Host, Elsevier ScienceDirect Complete, Emerald Current, and Springer
across the period from 1936 to January 2010 (as indicated in Table 1
earliest usable article was published in the Journal of Marketing Research (JMR
Journal of Management and Marketing Research
Detecting moderator effects, Page 3
statistic value implies the absence of moderator effects. In addition
statistic, confidence intervals are also used to detect moderators. The concept of confidence
at if 1) a variance is sufficiently large or 2) a confidence interval includes zero, a
moderator effect probably exists (one or more moderators). A large interval indicates that there
implies that there
probably are positive or negative effect sizes. On the other hand, if the interval is small or does
Dunlap, 1989;
1990).
The magnitudes of variances are meaningful when the means of effect sizes are not zero.
However, there is lack of agreement regarding the number of effect sizes that are necessary. For
mployed a stricter approach and suggested at least 10
1984). Others used at least
Bennet, Edens, and Bell
(2009) adopted at least five. The statistical
power of effect sizes provides a less debated approach to decide the number of effect sizes for
probability of rejecting the null hypothesis when it is false; in
other words, making a correct decision. In this study, statistical power is the probability of
correctly rejecting the null hypothesis of the mean of effect sizes equal to zero when the null
1996; McQuitty, 2004)
likely implies that the mean of effect sizes is meaningful; thus, a further analysis of its variance
ances, and confidence intervals in order to
identify the construct relationships that may have strong moderator effects in empirical sales
statistic was also used in order to determine the soundness of findings.
statistics are rather helpful in evaluating the effect of a moderator on
central bivariate relationships in sales. This essay includes three procedures. First, the research
procedure section presents data sources, analysis processes, and statistics used to identify the
means, variances of effect sizes (correlation coefficients), and moderator effects. Then, the
results section presents the means and variances of effect sizes, and lists the construct
importantly, the tables clearly
identify construct relationships under the dimensions of effect size means and moderator-effect
magnitudes. Thereafter, the relationships of Job performance and its related constructs
gs. For example, Job performance and Extrinsic
Finally, the conclusions section discusses the
the empirical sales articles from 12 key marketing journals
) in four
EBSCO Host, Elsevier ScienceDirect Complete, Emerald Current, and Springer
as indicated in Table 1). The
) in 1971 and the
latest one in January 2010. Finally, 6,007 correlation coefficients from 340 article
collected; approximately 37% (2,230/6,007) of correlations and 41% (141/340) of articles are
from the Journal of Personal Selling & Sales Management
zero-order correlations and between latent constructs. Moreover,
between constructs, between sub
included as long as they were presented in the journal articles. For example, Katsikea,
Theodosiou, and Morgan (2007) used the following c
performance, Satisfaction of territory situation, Control system, and Behavioral performance.
Among these constructs, Control system has
Directing, and Rewarding) and B
knowledge, Sales support, Teamwork, Sales presentation, and Sales planning
study collected not only the correlations between constructs but also those between sub
constructs (e.g., Adaptive selling
constructs (e.g., Adaptive selling
Analysis Processes
Figure 1 indicates the processes used for identifying the construct relationships that may
have strong moderator effects by corrected variances (sufficiently large) and confidence intervals
(includes zero). First, Hunter and Schmidt’s (2004) meta
combine the 6,007 correlations according to different construct relationships.
construct relationships were generated with corrected means, corrected variances, confidence
intervals, Q-statistics (Lipsey & Wilson
Second, according to the statistical power values
corrected means were divided into two categories: rejecting the null hypothesis of mean effect
size equal to zero (statistical power
for this is that when the means of effect sizes are not zero, it is meaningful to discuss the
magnitudes of variances. However, when the null hypothesis cannot be rejected, it may be
because the mean of effect size is zero, or because there are positive and negative effect sizes
Third, after omitting the corrected variances close to zero in the category with statistical
power of at least .8, the mean of the 819 corrected variances (.0124) is used as the cutoff point in
order to define small and large corrected variances. Fourth,
relationships in the category with statistical power lower than .8 and found 281 with confidence
intervals including zero. Then, those with positive and negative effect sizes and with the number
of effect size no less than four were identified in order to ensure that the results are more
meaningful. Finally, the construct relationships with large intervals or intervals including zero
relationships that may have significant moderator effects in empirical sales research
listed.
Statistics Employed
1. Weighted means of correlations in the within
provided sample-size-weighted means of correlations in order to eliminate sampling error.
Assuming that sampling error is the only artifact, s
accurate than those with small ones are. Therefore, means weighted by the sample sizes of
studies provide the best estimate of population correlations when considering only sampling
Journal of Management and Marketing Research
Detecting moderator effects
latest one in January 2010. Finally, 6,007 correlation coefficients from 340 article
collected; approximately 37% (2,230/6,007) of correlations and 41% (141/340) of articles are
Journal of Personal Selling & Sales Management (JPSSM). All these correlations are
order correlations and between latent constructs. Moreover, all types of relationships
between constructs, between sub-constructs, and between constructs and sub-constructs are
included as long as they were presented in the journal articles. For example, Katsikea,
Theodosiou, and Morgan (2007) used the following constructs: Organization effectiveness, Job
performance, Satisfaction of territory situation, Control system, and Behavioral performance.
Control system has four sub-constructs (Monitoring, Evaluating,
Behavioral performance has six (Adaptive selling, Technical
knowledge, Sales support, Teamwork, Sales presentation, and Sales planning). In this case, the
study collected not only the correlations between constructs but also those between sub
Adaptive selling-Monitoring, .09) and those between constructs and sub
Adaptive selling-Job performance, .38).
the processes used for identifying the construct relationships that may
moderator effects by corrected variances (sufficiently large) and confidence intervals
(includes zero). First, Hunter and Schmidt’s (2004) meta-analysis methods are followed to
combine the 6,007 correlations according to different construct relationships. Then, 1,873
construct relationships were generated with corrected means, corrected variances, confidence
Wilson, 2001), and statistical power (Hedges &
Second, according to the statistical power values with the cutoff point .8, the 1,873
corrected means were divided into two categories: rejecting the null hypothesis of mean effect
size equal to zero (statistical power ≥ .8) and not rejecting it (statistical power < .8). The reason
he means of effect sizes are not zero, it is meaningful to discuss the
variances. However, when the null hypothesis cannot be rejected, it may be
because the mean of effect size is zero, or because there are positive and negative effect sizes
Third, after omitting the corrected variances close to zero in the category with statistical
power of at least .8, the mean of the 819 corrected variances (.0124) is used as the cutoff point in
order to define small and large corrected variances. Fourth, the study reviewed the 985
relationships in the category with statistical power lower than .8 and found 281 with confidence
intervals including zero. Then, those with positive and negative effect sizes and with the number
were identified in order to ensure that the results are more
meaningful. Finally, the construct relationships with large intervals or intervals including zero
relationships that may have significant moderator effects in empirical sales research
Weighted means of correlations in the within-study sample size. Hunter and Schmidt (2004)
weighted means of correlations in order to eliminate sampling error.
Assuming that sampling error is the only artifact, studies with large sample sizes are more
accurate than those with small ones are. Therefore, means weighted by the sample sizes of
studies provide the best estimate of population correlations when considering only sampling
Journal of Management and Marketing Research
Detecting moderator effects, Page 4
latest one in January 2010. Finally, 6,007 correlation coefficients from 340 articles were
collected; approximately 37% (2,230/6,007) of correlations and 41% (141/340) of articles are
). All these correlations are
all types of relationships
constructs are
included as long as they were presented in the journal articles. For example, Katsikea,
Organization effectiveness, Job
performance, Satisfaction of territory situation, Control system, and Behavioral performance.
Monitoring, Evaluating,
ehavioral performance has six (Adaptive selling, Technical
). In this case, the
study collected not only the correlations between constructs but also those between sub-
, .09) and those between constructs and sub-
the processes used for identifying the construct relationships that may
moderator effects by corrected variances (sufficiently large) and confidence intervals
analysis methods are followed to
Then, 1,873
construct relationships were generated with corrected means, corrected variances, confidence
Pigott, 2001).
with the cutoff point .8, the 1,873
corrected means were divided into two categories: rejecting the null hypothesis of mean effect
.8) and not rejecting it (statistical power < .8). The reason
he means of effect sizes are not zero, it is meaningful to discuss the
variances. However, when the null hypothesis cannot be rejected, it may be
because the mean of effect size is zero, or because there are positive and negative effect sizes.
Third, after omitting the corrected variances close to zero in the category with statistical
power of at least .8, the mean of the 819 corrected variances (.0124) is used as the cutoff point in
the study reviewed the 985
relationships in the category with statistical power lower than .8 and found 281 with confidence
intervals including zero. Then, those with positive and negative effect sizes and with the number
were identified in order to ensure that the results are more
meaningful. Finally, the construct relationships with large intervals or intervals including zero—
relationships that may have significant moderator effects in empirical sales research—were
study sample size. Hunter and Schmidt (2004)
weighted means of correlations in order to eliminate sampling error.
tudies with large sample sizes are more
accurate than those with small ones are. Therefore, means weighted by the sample sizes of
studies provide the best estimate of population correlations when considering only sampling
error and ignoring other artifacts
2. Corrected means of the correlations across studies. Hunter and Schmidt (2004) also used
sample sizes, measurement reliabilities, and sample correlations in order to eliminate artifacts
and correct the sample means. Since the corrected means are attenuated
larger than the sample and weighted means, and are used to ascertain the
means between latent constructs. Therefore, the corrected mean of correlations is the best
estimate of population correlations after eliminat
3. The corrected variances of the correlations across studies. In the calculation of corrected
means, the corrected variances are generated simultaneously. Similar to corrected means,
corrected variances are used to estimate the
between latent constructs after eliminating the artifacts. In other words, the corrected variance
is the difference between the total variance and sample error variance. More importantly,
corrected variances influence confidenc
moderator effects. Therefore, when corrected variances are large, there should be moderator
effects between the latent constructs.
4. The 90% confidence intervals. Following the corrected variances, the 90%
intervals were calculated using corrected means and corrected stand errors (square root of
corrected variances). In this manner, the study detected whether confidence intervals include
zero, and scrutinized the correlation values within the con
5. Statistical powers. Hedges and Pigott (2001) provided details for calculating the statistical
power in meta-analysis. Using the power of statistical tests, the probability of whether the
weighted means are different from zero was iden
number of effect size correlations.
6. Q-statistics. Following Lipsey and Wilson’s (2001) formulas, the Q
by summing the squares of each study’s effect size weighted by its inverse variance2( )EffectSize
Variance∑ ). Q-statistics follow chi
estimates - 1) degree of freedom. A significant Q
sample studies is larger than expected by sampling error
detected.
RESULTS
Construct Relationships with Large Corrected Variances
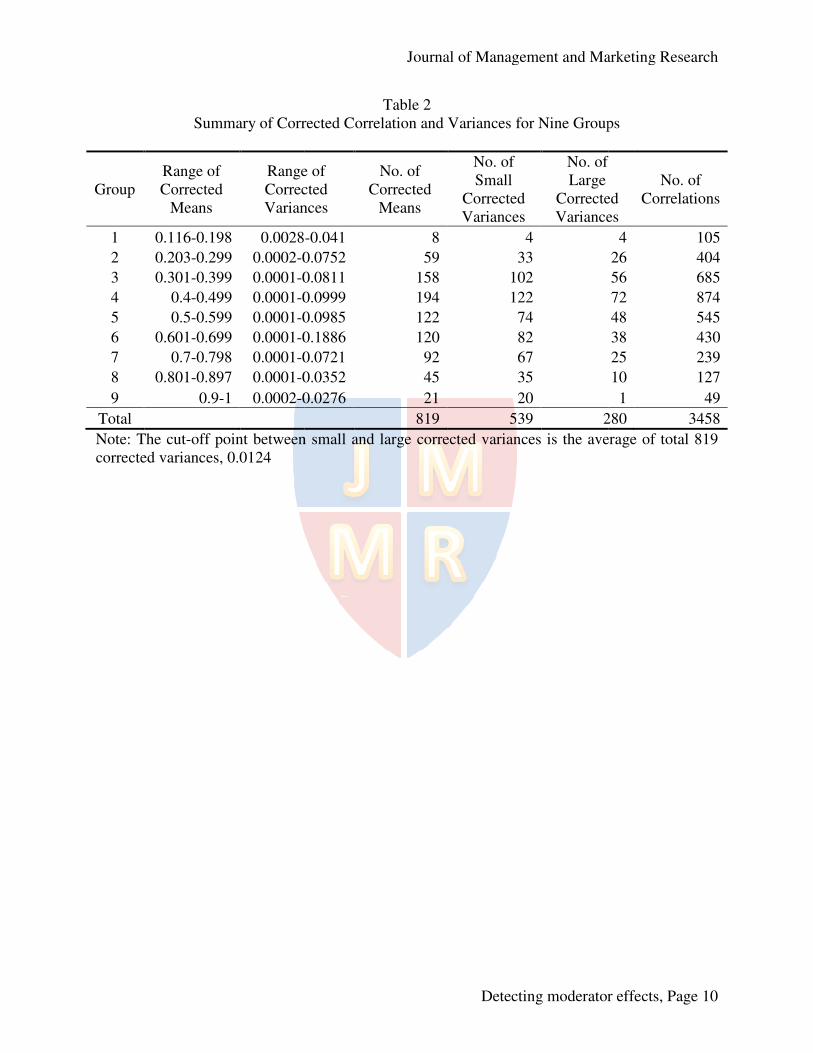
There are 819 corrected means (3
According to their absolute values of corrected means
divided into nine groups (as indicated in Table 2
and variances. The first group includes corrected means with statistical power less than .2, the
second group at least .2 but less than .3, and, following the rule, the ninth group covers corrected
means with a statistical power of at least .9. Although the ranges of corrected variances of the
nine groups are mixed, it was found that group 9 has a smaller range (.0002
groups 8 (.0001–.0352) and 1 (.0028
in group 1 with a .109 corrected mean and a .041 corrected variance. Transformational
leadership–transactional leadership is in group 9 with
variance. The groups having more frequencies of corrected means have neither small nor large
Journal of Management and Marketing Research
Detecting moderator effects
error and ignoring other artifacts.
Corrected means of the correlations across studies. Hunter and Schmidt (2004) also used
sample sizes, measurement reliabilities, and sample correlations in order to eliminate artifacts
and correct the sample means. Since the corrected means are attenuated by artifacts, they are
larger than the sample and weighted means, and are used to ascertain the “true
means between latent constructs. Therefore, the corrected mean of correlations is the best
estimate of population correlations after eliminating artifacts.
The corrected variances of the correlations across studies. In the calculation of corrected
means, the corrected variances are generated simultaneously. Similar to corrected means,
corrected variances are used to estimate the “true” variances of the “true” correlations
between latent constructs after eliminating the artifacts. In other words, the corrected variance
is the difference between the total variance and sample error variance. More importantly,
corrected variances influence confidence intervals, and large confidence intervals indicate
moderator effects. Therefore, when corrected variances are large, there should be moderator
effects between the latent constructs.
The 90% confidence intervals. Following the corrected variances, the 90% confidence
intervals were calculated using corrected means and corrected stand errors (square root of
corrected variances). In this manner, the study detected whether confidence intervals include
zero, and scrutinized the correlation values within the construct relationships.
Statistical powers. Hedges and Pigott (2001) provided details for calculating the statistical
analysis. Using the power of statistical tests, the probability of whether the
weighted means are different from zero was identified in order to resolve the debate on the
number of effect size correlations.
statistics. Following Lipsey and Wilson’s (2001) formulas, the Q-statistics were computed
by summing the squares of each study’s effect size weighted by its inverse variance
statistics follow chi-square distribution with (number of effect size
1) degree of freedom. A significant Q-statistic implies that the variance across the
sample studies is larger than expected by sampling error; thus, moderator effects can be
Construct Relationships with Large Corrected Variances
There are 819 corrected means (3,458 correlations) with statistical power larger than .8.
According to their absolute values of corrected means (overall range .116–.979), they were
as indicated in Table 2) in order to analyze the stretches of effect sizes
and variances. The first group includes corrected means with statistical power less than .2, the
.2 but less than .3, and, following the rule, the ninth group covers corrected
means with a statistical power of at least .9. Although the ranges of corrected variances of the
nine groups are mixed, it was found that group 9 has a smaller range (.0002–.0276), followed by
.0352) and 1 (.0028–.041). For instance, job satisfaction–customer orientation is
in group 1 with a .109 corrected mean and a .041 corrected variance. Transformational
transactional leadership is in group 9 with a .973 corrected mean and a .008 corrected
variance. The groups having more frequencies of corrected means have neither small nor large
Journal of Management and Marketing Research
Detecting moderator effects, Page 5
Corrected means of the correlations across studies. Hunter and Schmidt (2004) also used
sample sizes, measurement reliabilities, and sample correlations in order to eliminate artifacts
by artifacts, they are
true” correlation
means between latent constructs. Therefore, the corrected mean of correlations is the best
The corrected variances of the correlations across studies. In the calculation of corrected
means, the corrected variances are generated simultaneously. Similar to corrected means,
correlations
between latent constructs after eliminating the artifacts. In other words, the corrected variance
is the difference between the total variance and sample error variance. More importantly,
e intervals, and large confidence intervals indicate
moderator effects. Therefore, when corrected variances are large, there should be moderator
confidence
intervals were calculated using corrected means and corrected stand errors (square root of
corrected variances). In this manner, the study detected whether confidence intervals include
Statistical powers. Hedges and Pigott (2001) provided details for calculating the statistical
analysis. Using the power of statistical tests, the probability of whether the
tified in order to resolve the debate on the
statistics were computed
by summing the squares of each study’s effect size weighted by its inverse variance (
square distribution with (number of effect size
statistic implies that the variance across the
; thus, moderator effects can be
458 correlations) with statistical power larger than .8.
.979), they were
) in order to analyze the stretches of effect sizes
and variances. The first group includes corrected means with statistical power less than .2, the
.2 but less than .3, and, following the rule, the ninth group covers corrected
means with a statistical power of at least .9. Although the ranges of corrected variances of the
76), followed by
customer orientation is
in group 1 with a .109 corrected mean and a .041 corrected variance. Transformational
a .973 corrected mean and a .008 corrected
variance. The groups having more frequencies of corrected means have neither small nor large
corrected means but with statistical power between .3 and .7. Group 4 (.4
corrected means with 194, followed by group 3 (.2
the 819 corrected variances (.0124) as the cutoff point in order to identify significant large
variances. The 539 construct relationships with corrected variances smaller than .0124 are
classified into a small-corrected-
variances (over .0124) are only approximately one
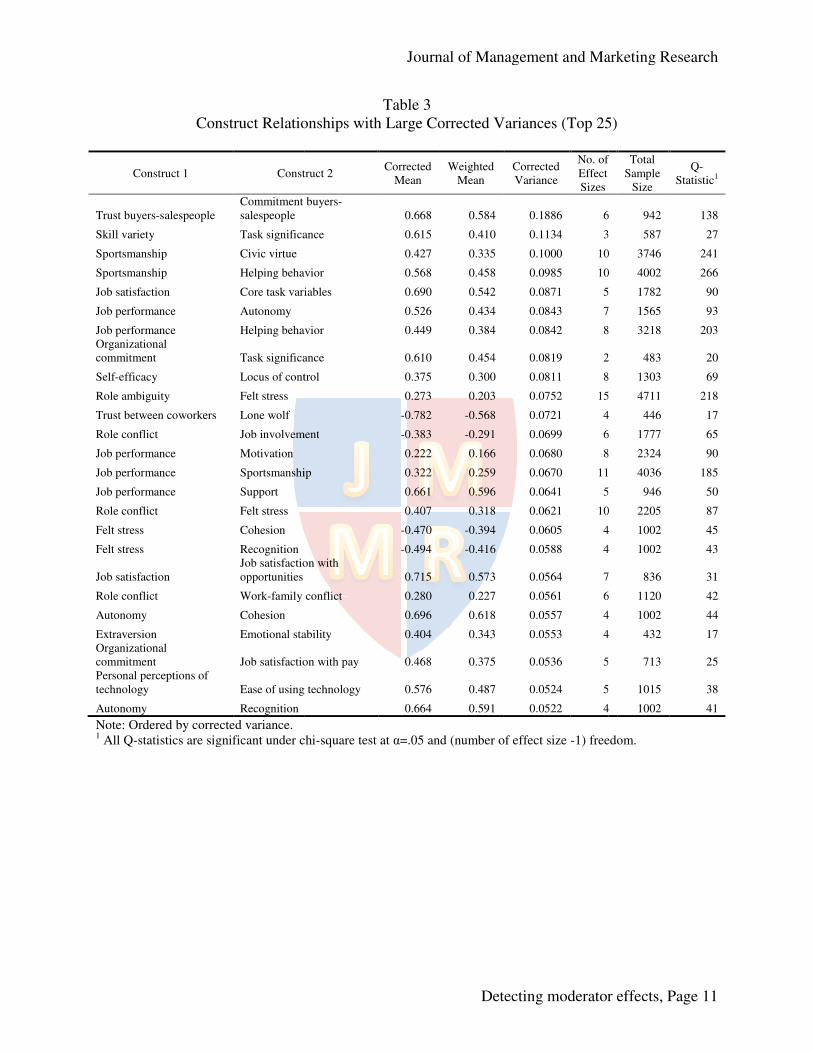
Table 3 lists the largest 25 meta
statistics of the top 25 are all significant. The top three construct relationships have corrected
variances larger than .1: Trust–Commitment between buyers and salespeople
variety–Task significance (.113), and
between buyers and salespeople relationship has the largest corrected variance (.1886) among the
280. A corrected mean of .668 indicates that approximately 45% (square of .668) of the variation
in the construct relationship is sha
The large corrected variance and significant Q
have strong moderator effects; thus, researchers can find possible moderators by comparing the
original studies. For example, the second construct rela
has three correlations: .58 (Evans et al.
.11 (Tyagi, 1985). Researchers can identify possible moderators by comparing these theories,
measures, samples, or models. In summary, the corrected variances and means help researchers
to recognize highly correlated relationships that may have strong moderator effects.
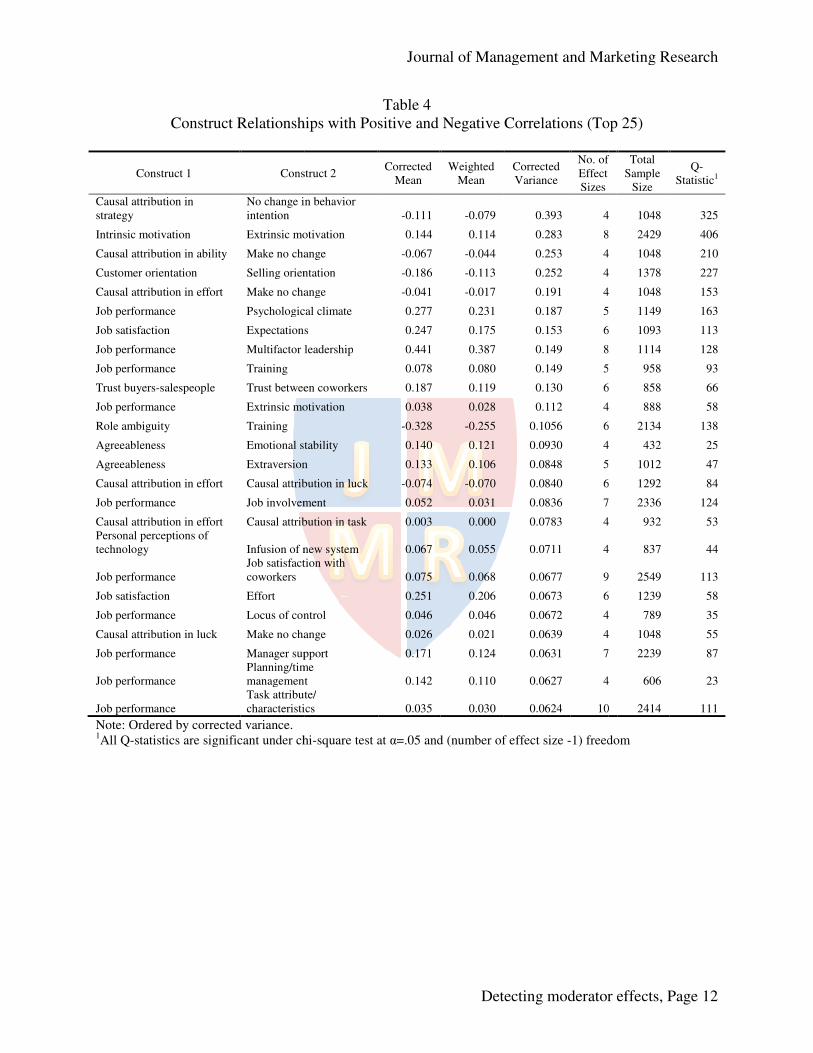
Construct Relationships with Positive and Negative Correlations
The corrected means of construct rela
correlation means are zero but because they include positive and negative correlations in the
sample studies. Table 4 lists 25 of the 48
correlations in the sample studies, and the Q
example, the construct relationships have corrected variances that are larger than .25:
attribution in strategy–No change in behavior intention
motivation (.283), Causal attribution in ability
Selling orientation (.252).
The relationship Causal attribution in strategy
largest corrected variance (.393) among the 48.
constructs (effort, ability, task, strategy, and luck) used to measure salespeople’s attributions, and
No change in behavior intention
avoid the situation, change strategy, and make no change) used to measure salespeople’s
behavior intentions. The four original correlations are .46 (
.63 (Dixon & Schertzer, 2005), .51, and
negative correlations imply that salespeople,
specific strategy, may or may not intend to change their sellin
theories, measures, samples, or models of empirical studies, researchers can find possible
moderators on the relationship Causal attribution in strategy
These listed relationships with large corrected variances and positive and negative
correlations indicate the possible
large corrected variances presented in
corrected means, while the relationships in
Journal of Management and Marketing Research
Detecting moderator effects
corrected means but with statistical power between .3 and .7. Group 4 (.4–.5) has the most
lowed by group 3 (.2–.3) with 158. The study used the average of
the 819 corrected variances (.0124) as the cutoff point in order to identify significant large
variances. The 539 construct relationships with corrected variances smaller than .0124 are
-variance category. Construct relationships with large corrected
variances (over .0124) are only approximately one-third of the samples (280/819).
lists the largest 25 meta-analytic variances from among the 280, and the
statistics of the top 25 are all significant. The top three construct relationships have corrected
Commitment between buyers and salespeople (.1886),
(.113), and Sportsmanship–Civic virtue (.1). The Trust
relationship has the largest corrected variance (.1886) among the
280. A corrected mean of .668 indicates that approximately 45% (square of .668) of the variation
in the construct relationship is shared variance.
The large corrected variance and significant Q-statistic implies that the relationship may
have strong moderator effects; thus, researchers can find possible moderators by comparing the
original studies. For example, the second construct relationship, Skill variety–Task significance
Evans et al., 2002), .34 (Naumann, Widmier, & Jackson, 2000), and
1985). Researchers can identify possible moderators by comparing these theories,
els. In summary, the corrected variances and means help researchers
to recognize highly correlated relationships that may have strong moderator effects.
Construct Relationships with Positive and Negative Correlations
The corrected means of construct relationships are probably zero not because the
correlation means are zero but because they include positive and negative correlations in the
lists 25 of the 48 construct relationships with positive and negative
correlations in the sample studies, and the Q-statistics of the top 25 are all significant. For
example, the construct relationships have corrected variances that are larger than .25:
No change in behavior intention (.393), Intrinsic motivation
Causal attribution in ability–Make no change (.253), Customer orientation
Causal attribution in strategy–No change in behavior intention
largest corrected variance (.393) among the 48. Causal attribution in strategy is one of five sub
constructs (effort, ability, task, strategy, and luck) used to measure salespeople’s attributions, and
is one of five sub-constructs (increase effort, seek assistance,
avoid the situation, change strategy, and make no change) used to measure salespeople’s
behavior intentions. The four original correlations are .46 (Dixon, Forbes, & Schertzer
2005), .51, and -.65 (Dixon, Spiro, & Jamil, 2001). These positive and
salespeople, who attribute their performance to adapting a
specific strategy, may or may not intend to change their selling behaviors. By comparing the
theories, measures, samples, or models of empirical studies, researchers can find possible
Causal attribution in strategy–No change in behavior intention
These listed relationships with large corrected variances and positive and negative
correlations indicate the possible presence of one or more moderators. The relationships with
large corrected variances presented in Table 3 are often studied because they have
corrected means, while the relationships in Table 4 are under discussed because their corrected
Journal of Management and Marketing Research
Detecting moderator effects, Page 6
.5) has the most
.3) with 158. The study used the average of
the 819 corrected variances (.0124) as the cutoff point in order to identify significant large
variances. The 539 construct relationships with corrected variances smaller than .0124 are
variance category. Construct relationships with large corrected
third of the samples (280/819).
analytic variances from among the 280, and the Q-
statistics of the top 25 are all significant. The top three construct relationships have corrected
(.1886), Skill
Trust–Commitment
relationship has the largest corrected variance (.1886) among the
280. A corrected mean of .668 indicates that approximately 45% (square of .668) of the variation
statistic implies that the relationship may
have strong moderator effects; thus, researchers can find possible moderators by comparing the
Task significance,
Jackson, 2000), and
1985). Researchers can identify possible moderators by comparing these theories,
els. In summary, the corrected variances and means help researchers
to recognize highly correlated relationships that may have strong moderator effects.
tionships are probably zero not because the true
correlation means are zero but because they include positive and negative correlations in the
construct relationships with positive and negative
statistics of the top 25 are all significant. For
example, the construct relationships have corrected variances that are larger than .25: Causal
Intrinsic motivation–Extrinsic
Customer orientation–
ange in behavior intention has the
is one of five sub-
constructs (effort, ability, task, strategy, and luck) used to measure salespeople’s attributions, and
constructs (increase effort, seek assistance,
avoid the situation, change strategy, and make no change) used to measure salespeople’s
Schertzer, 2005), -
). These positive and
who attribute their performance to adapting a
g behaviors. By comparing the
theories, measures, samples, or models of empirical studies, researchers can find possible
No change in behavior intention.
These listed relationships with large corrected variances and positive and negative
presence of one or more moderators. The relationships with
have significant
are under discussed because their corrected
means are close to zero. Therefore, researchers may explore findings that are more interesting in
terms of construct relationships with positiv
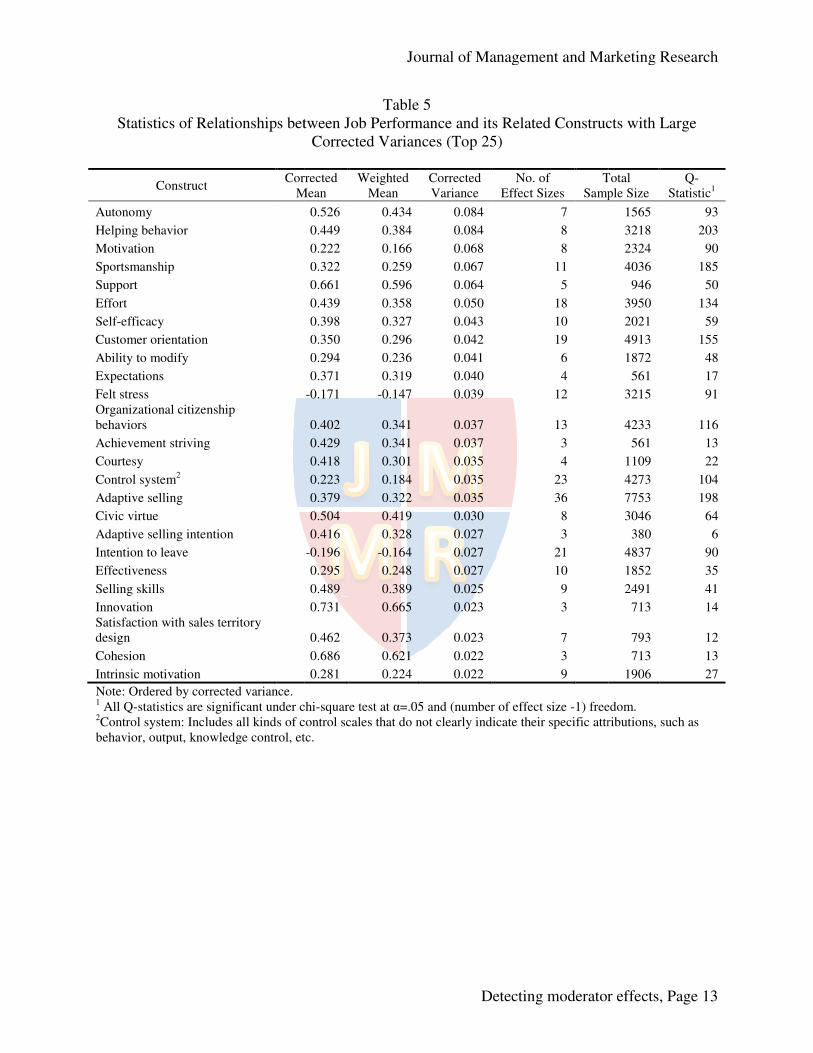
Relationships between Job Performance and its Related Constructs
Further, this study focuses on the relationships between
constructs in order to identify those that may have strong moderator effects.
from among the 68 construct relationships of
variances. For example, Autonomy
Autonomy is an important construct associated with
Autonomy–Job performance is .084, the largest among the 68 construct relationships of
performance. This indicates that alth
some moderators (e.g., manager’s support or job involvement) may strengthen the relationship,
while others (e.g., felt stress or role ambiguity) may weaken it.
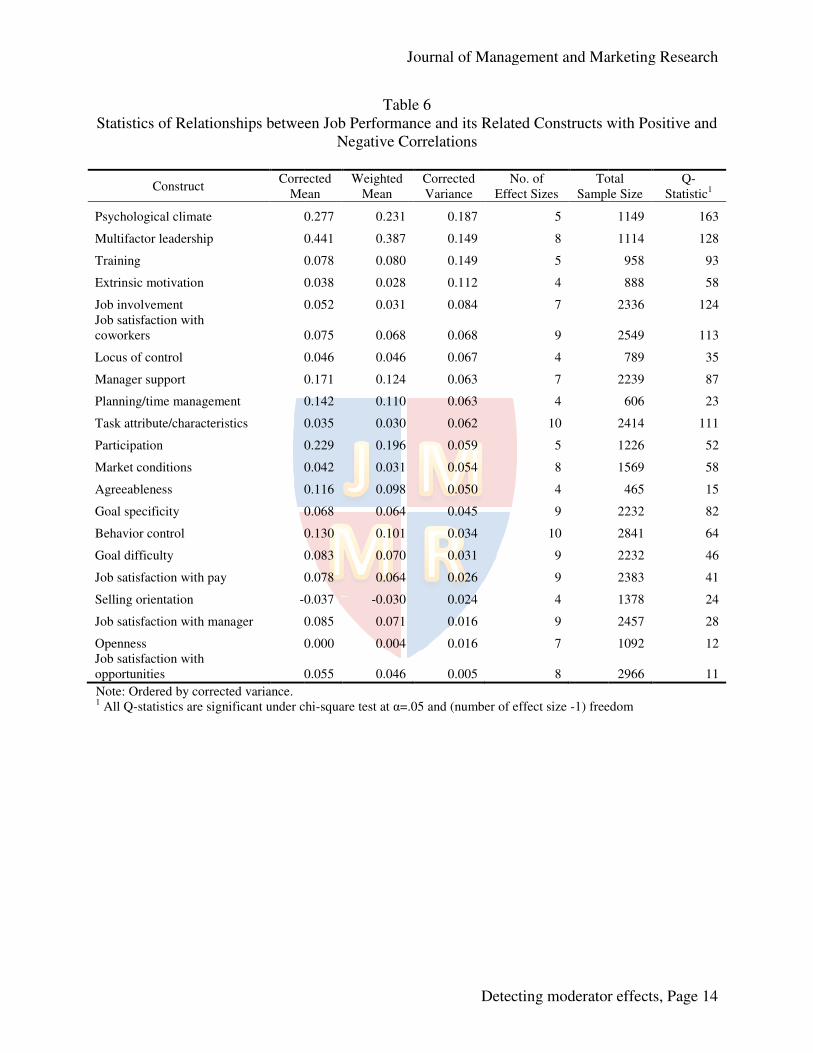
Table 6 presents the 21 construct relati
negative correlations in their confidence intervals. For example,
motivation have positive (.28 [Ingram, Lee,
2007]) and negative (-.22 [Jaramillo
is lack of agreement regarding the interaction of
moderators could be age (the elderly are less concerned with regard to monetary rewards
motivation methods (it is very difficult to
feelings or achievements rather than monetary rewards). By comparing studies with positive and
negative correlations among method, contextual, or theoretic
ignored but important moderators.
CONCLUSIONS
Theoretical and Managerial Implications
From the theoretical perspective, this is the first study to systematically seek the
moderator effects of construct relationships in
identifies construct relationships that may have strong moderator effects, which provide
researchers distinct objects to focus on. Moreover, the corrected means indicate the magnitudes
of influences between constructs. When researchers focus on a specific construct, they can
consider corrected means and variances together and find relationships that have greater
correlation and significant moderator effects. Further, the relationships that may have stron
moderator effects can be indicators for researchers to explore possible moderators by considering
method, contextual, or theoretical factors. All these findings greatly help researchers not only to
understand existing knowledge but also to create new mod
From a managerial perspective, this study indicates the different levels of influences on
the relationships between constructs in order to enable managers to realize which factors are
more influential (larger correlations) and operate the
moderator effects remind managers to be cautious when they operate those constructs under
different situations.
Journal of Management and Marketing Research
Detecting moderator effects
means are close to zero. Therefore, researchers may explore findings that are more interesting in
terms of construct relationships with positive and negative correlations.
Relationships between Job Performance and its Related Constructs
his study focuses on the relationships between Job performance
constructs in order to identify those that may have strong moderator effects. Table 5
from among the 68 construct relationships of Job performance that have large corrected
Autonomy–Job performance has a high corrected mean (.526); thus,
is an important construct associated with Job performance. The corrected variance of
is .084, the largest among the 68 construct relationships of
. This indicates that although Autonomy is positively related to Job performance
some moderators (e.g., manager’s support or job involvement) may strengthen the relationship,
while others (e.g., felt stress or role ambiguity) may weaken it.
presents the 21 construct relationships of Job performance that have positive and
negative correlations in their confidence intervals. For example, Job performance
Ingram, Lee, & Skinner, 1989] and .34 [Miao, Evans,
.22 [Jaramillo & Mulki, 2008] and -.17 [Noble, 2008]) correlations. There
is lack of agreement regarding the interaction of Job performance–Extrinsic motivation
moderators could be age (the elderly are less concerned with regard to monetary rewards
motivation methods (it is very difficult to obtain the rewards), or personality (people want good
feelings or achievements rather than monetary rewards). By comparing studies with positive and
negative correlations among method, contextual, or theoretical factors, researchers may find
ignored but important moderators.
Theoretical and Managerial Implications
From the theoretical perspective, this is the first study to systematically seek the
moderator effects of construct relationships in empirical sales research. Further, this study clearly
identifies construct relationships that may have strong moderator effects, which provide
researchers distinct objects to focus on. Moreover, the corrected means indicate the magnitudes
ween constructs. When researchers focus on a specific construct, they can
consider corrected means and variances together and find relationships that have greater
correlation and significant moderator effects. Further, the relationships that may have stron
moderator effects can be indicators for researchers to explore possible moderators by considering
method, contextual, or theoretical factors. All these findings greatly help researchers not only to
understand existing knowledge but also to create new models and theories.
From a managerial perspective, this study indicates the different levels of influences on
the relationships between constructs in order to enable managers to realize which factors are
more influential (larger correlations) and operate them efficiently (small moderator effects). The
moderator effects remind managers to be cautious when they operate those constructs under
Journal of Management and Marketing Research
Detecting moderator effects, Page 7
means are close to zero. Therefore, researchers may explore findings that are more interesting in
Job performance and its related
Table 5 lists those
that have large corrected
high corrected mean (.526); thus,
. The corrected variance of
is .084, the largest among the 68 construct relationships of Job
Job performance,
some moderators (e.g., manager’s support or job involvement) may strengthen the relationship,
that have positive and
Job performance and Extrinsic
1989] and .34 [Miao, Evans, & Zou ,
]) correlations. There
Extrinsic motivation. The
moderators could be age (the elderly are less concerned with regard to monetary rewards),
obtain the rewards), or personality (people want good
feelings or achievements rather than monetary rewards). By comparing studies with positive and
al factors, researchers may find
From the theoretical perspective, this is the first study to systematically seek the
empirical sales research. Further, this study clearly
identifies construct relationships that may have strong moderator effects, which provide
researchers distinct objects to focus on. Moreover, the corrected means indicate the magnitudes
ween constructs. When researchers focus on a specific construct, they can
consider corrected means and variances together and find relationships that have greater
correlation and significant moderator effects. Further, the relationships that may have strong
moderator effects can be indicators for researchers to explore possible moderators by considering
method, contextual, or theoretical factors. All these findings greatly help researchers not only to
From a managerial perspective, this study indicates the different levels of influences on
the relationships between constructs in order to enable managers to realize which factors are
m efficiently (small moderator effects). The
moderator effects remind managers to be cautious when they operate those constructs under
Limitations
This study has certain limitations. First, although the meta
variances, confidence intervals, and Q
they cannot identify the moderators (
Skill variety and Task significance
290; however, researchers may not recognize the moderators except by scrutinizing the original
articles. Moreover, the moderators that are not identified in the articles cannot be explored. In
other words, the collected samples decide the findings.
Second, since correlations are nondirectional, they do not indicate causal relationships.
This limits the utility of the findings, and the only way to ascertain the causal relationships is to
track the original articles or apply
and Walker (1985) and Carrillat
relationship between constructs.
Third, since the statistics (e.g., Q
corrected intervals) are based on statistical probability, it is possible to overlook some construct
relationships with strong moderator effects. In addition, the limited sample data of construct
relationships may impact the statistica
Fourth, this study presents 328 (280+48) construct relationships that may have strong
moderator effects in empirical sales research. However, these relationships are so varied that it is
difficult to integrate them into specific and meaningful models. The
focus on a specific construct, such as
Future Research
This study provides a strong fundamental basis for future research. First, researchers can
focus on a specific construct, collect all its related relationships, and then use the corrected
means to identify important or incompatible construct relationships. After scrutinizing its related
theories, researchers can create new models or verify theoretical relationships
considering the magnitudes of moderator effects, researchers can focus on a specific construct
relationship and try to discover possible moderators. Third, considering the corrected means and
variances simultaneously, researchers can focus
with stronger moderator effects in order to create interesting models. Another future research
direction is to use other meta-analytic statistics to detect moderator effects and identify the
relationships detected across different statistics.
Journal of Management and Marketing Research
Detecting moderator effects
This study has certain limitations. First, although the meta-analytic methods (corr
variances, confidence intervals, and Q-statistics) can detect whether moderators are operating,
they cannot identify the moderators (Koslowsky & Sagie, 1993; Whitener, 1990). For example,
Task significance have the second largest corrected variance (.113) among the
290; however, researchers may not recognize the moderators except by scrutinizing the original
articles. Moreover, the moderators that are not identified in the articles cannot be explored. In
mples decide the findings.
Second, since correlations are nondirectional, they do not indicate causal relationships.
This limits the utility of the findings, and the only way to ascertain the causal relationships is to
track the original articles or apply robust meta-analytic results, such as Churchill
et al. (2009). Moreover, there may be more than one causal
Third, since the statistics (e.g., Q-statistics, statistical power, corrected means, and
corrected intervals) are based on statistical probability, it is possible to overlook some construct
relationships with strong moderator effects. In addition, the limited sample data of construct
relationships may impact the statistical results.
Fourth, this study presents 328 (280+48) construct relationships that may have strong
moderator effects in empirical sales research. However, these relationships are so varied that it is
difficult to integrate them into specific and meaningful models. The alternative method is to
focus on a specific construct, such as Job performance, and discuss its related relationships.
This study provides a strong fundamental basis for future research. First, researchers can
construct, collect all its related relationships, and then use the corrected
means to identify important or incompatible construct relationships. After scrutinizing its related
theories, researchers can create new models or verify theoretical relationships. Second, after
considering the magnitudes of moderator effects, researchers can focus on a specific construct
relationship and try to discover possible moderators. Third, considering the corrected means and
variances simultaneously, researchers can focus on the more important construct relationships
with stronger moderator effects in order to create interesting models. Another future research
analytic statistics to detect moderator effects and identify the
ted across different statistics.
Journal of Management and Marketing Research
Detecting moderator effects, Page 8
analytic methods (corrected
statistics) can detect whether moderators are operating,
). For example,
rrected variance (.113) among the
290; however, researchers may not recognize the moderators except by scrutinizing the original
articles. Moreover, the moderators that are not identified in the articles cannot be explored. In
Second, since correlations are nondirectional, they do not indicate causal relationships.
This limits the utility of the findings, and the only way to ascertain the causal relationships is to
analytic results, such as Churchill, Ford, Hartley,
, there may be more than one causal
corrected means, and
corrected intervals) are based on statistical probability, it is possible to overlook some construct
relationships with strong moderator effects. In addition, the limited sample data of construct
Fourth, this study presents 328 (280+48) construct relationships that may have strong
moderator effects in empirical sales research. However, these relationships are so varied that it is
alternative method is to
, and discuss its related relationships.
This study provides a strong fundamental basis for future research. First, researchers can
construct, collect all its related relationships, and then use the corrected
means to identify important or incompatible construct relationships. After scrutinizing its related
. Second, after
considering the magnitudes of moderator effects, researchers can focus on a specific construct
relationship and try to discover possible moderators. Third, considering the corrected means and
on the more important construct relationships
with stronger moderator effects in order to create interesting models. Another future research
analytic statistics to detect moderator effects and identify the
Journal
Journal of Personal Selling & Sales
Management (JPSSM)
Journal of the Academy of Marketing
Science (JAMS)
Industrial Marketing Management
(IMM)
Journal of Business Research (JBR)
Journal of Applied Psychology (JAP)
Journal of Marketing (JM)
Journal of Marketing Theory and
Practice (JMTP)
Journal of Marketing Research (JMR)
Journal of Business & Industrial
Marketing (JBIM)
International Journal of Research in
Marketing (IJRM)
European Journal of Marketing (EJM)
Journal of Business Ethics (JBE)
Total 1Number in the parentheses is the issue number
Journal of Management and Marketing Research
Detecting moderator effects
Table 1
Data Sources
Period No. of
Articles
No. of
Correlations
Journal of Personal Selling & Sales 1980-
2010(1)1 141 2230 EBSCO Host
Journal of the Academy of Marketing 1973-2009 39 971
Springer Standard
1971-2009 33 311 Elsevier ScienceDirect
Journal of Business Research (JBR) 1973-
2010(1) 30 746
Elsevier ScienceDirect
Psychology (JAP) 1965-2009 23 464 EBSCO Host
1936-
2010(1) 22 542 EBSCO Host
1992-
2010(1) 16 220 EBSCO Host
Journal of Marketing Research (JMR) 1964-2009 12 200 EBSCO Host
1994-2009 10 164 Emerald Current
International Journal of Research in 1984-
2010(1) 9 128
Elsevier ScienceDirect
European Journal of Marketing (EJM) 1967-2009 3 24 Emerald Current
1982-2009 2 7 EBSCO Host
340 6007
Number in the parentheses is the issue number
Journal of Management and Marketing Research
Detecting moderator effects, Page 9
Database
EBSCO Host
Springer Standard
Collection
Elsevier ScienceDirect
Complete
Elsevier ScienceDirect
Complete
EBSCO Host
EBSCO Host
EBSCO Host
EBSCO Host
Emerald Current
Elsevier ScienceDirect
Complete
Emerald Current
EBSCO Host
Summary of Corrected Correlation
Group
Range of
Corrected
Means
Range of
Corrected
Variances
1 0.116-0.198 0.0028
2 0.203-0.299 0.0002-0
3 0.301-0.399 0.0001-0.0811
4 0.4-0.499 0.0001-0.0999
5 0.5-0.599 0.0001-0.0985
6 0.601-0.699 0.0001-0.1886
7 0.7-0.798 0.0001-0.0721
8 0.801-0.897 0.0001-0.0352
9 0.9-1 0.0002-0.0276
Total
Note: The cut-off point between small and large corrected variances is the average of total 819
corrected variances, 0.0124
Journal of Management and Marketing Research
Detecting moderator effects
Table 2
of Corrected Correlation and Variances for Nine Groups
Range of
Corrected
Variances
No. of
Corrected
Means
No. of
Small
Corrected
Variances
No. of
Large
Corrected
Variances
0.0028-0.041 8 4
0.0752 59 33
0.0811 158 102
0.0999 194 122
0.0985 122 74
0.1886 120 82
0.0721 92 67
0.0352 45 35
0.0276 21 20
819 539 280
off point between small and large corrected variances is the average of total 819
Journal of Management and Marketing Research
Detecting moderator effects, Page 10
Variances for Nine Groups
No. of
Large
Corrected
Variances
No. of
Correlations
4 105
26 404
56 685
72 874
48 545
38 430
25 239
10 127
1 49
280 3458
off point between small and large corrected variances is the average of total 819
Construct Relationships
Construct 1 Construct 2
Trust buyers-salespeople
Commitment buyers
salespeople
Skill variety Task significance
Sportsmanship Civic virtue
Sportsmanship Helping behavior
Job satisfaction Core task variables
Job performance Autonomy
Job performance Helping behavior
Organizational
commitment Task significance
Self-efficacy Locus of control
Role ambiguity Felt stress
Trust between coworkers Lone wolf
Role conflict Job involvement
Job performance Motivation
Job performance Sportsmanship
Job performance Support
Role conflict Felt stress
Felt stress Cohesion
Felt stress Recognition
Job satisfaction
Job satisfaction with
opportunities
Role conflict Work-family conflict
Autonomy Cohesion
Extraversion Emotional stability
Organizational
commitment Job satisfaction with pay
Personal perceptions of
technology Ease of using technology
Autonomy Recognition
Note: Ordered by corrected variance. 1 All Q-statistics are significant under chi
Journal of Management and Marketing Research
Detecting moderator effects
Table 3
Relationships with Large Corrected Variances (Top 25)
Construct 2 Corrected
Mean
Weighted
Mean
Corrected
Variance
No. of
Effect
Sizes
Commitment buyers-
0.668 0.584 0.1886 6
Task significance 0.615 0.410 0.1134 3
0.427 0.335 0.1000 10
Helping behavior 0.568 0.458 0.0985 10
Core task variables 0.690 0.542 0.0871 5
0.526 0.434 0.0843 7
Helping behavior 0.449 0.384 0.0842 8
Task significance 0.610 0.454 0.0819 2
Locus of control 0.375 0.300 0.0811 8
0.273 0.203 0.0752 15
-0.782 -0.568 0.0721 4
Job involvement -0.383 -0.291 0.0699 6
0.222 0.166 0.0680 8
Sportsmanship 0.322 0.259 0.0670 11
0.661 0.596 0.0641 5
0.407 0.318 0.0621 10
-0.470 -0.394 0.0605 4
-0.494 -0.416 0.0588 4
Job satisfaction with
0.715 0.573 0.0564 7
family conflict 0.280 0.227 0.0561 6
0.696 0.618 0.0557 4
Emotional stability 0.404 0.343 0.0553 4
Job satisfaction with pay 0.468 0.375 0.0536 5
Ease of using technology 0.576 0.487 0.0524 5
0.664 0.591 0.0522 4
statistics are significant under chi-square test at α=.05 and (number of effect size -1) freedom.
Journal of Management and Marketing Research
Detecting moderator effects, Page 11
with Large Corrected Variances (Top 25)
No. of
Effect
Total
Sample
Size
Q-
Statistic1
6 942 138
3 587 27
10 3746 241
10 4002 266
5 1782 90
7 1565 93
8 3218 203
2 483 20
8 1303 69
15 4711 218
4 446 17
6 1777 65
8 2324 90
11 4036 185
5 946 50
10 2205 87
4 1002 45
4 1002 43
7 836 31
6 1120 42
4 1002 44
4 432 17
5 713 25
5 1015 38
4 1002 41
1) freedom.
Construct Relationships
Construct 1 Construct 2
Causal attribution in
strategy
No change in behavior
intention
Intrinsic motivation Extrinsic motivation
Causal attribution in ability Make no change
Customer orientation Selling orientation
Causal attribution in effort Make no change
Job performance Psychological climate
Job satisfaction Expectations
Job performance Multifactor leadership
Job performance Training
Trust buyers-salespeople Trust between coworkers
Job performance Extrinsic motivation
Role ambiguity Training
Agreeableness Emotional stability
Agreeableness Extraversion
Causal attribution in effort Causal attribution in luck
Job performance Job involvement
Causal attribution in effort Causal attribution in task
Personal perceptions of
technology Infusion of new system
Job performance
Job satisfaction with
coworkers
Job satisfaction Effort
Job performance Locus of control
Causal attribution in luck Make no change
Job performance Manager support
Job performance
Planning/time
management
Job performance
Task attribute/
characteristics
Note: Ordered by corrected variance. 1All Q-statistics are significant under chi
Journal of Management and Marketing Research
Detecting moderator effects
Table 4
Relationships with Positive and Negative Correlations (Top 25)
Construct 2 Corrected
Mean
Weighted
Mean
Corrected
Variance
No. of
Effect
Sizes
No change in behavior
-0.111 -0.079 0.393 4
Extrinsic motivation 0.144 0.114 0.283 8
Make no change -0.067 -0.044 0.253 4
Selling orientation -0.186 -0.113 0.252 4
Make no change -0.041 -0.017 0.191 4
Psychological climate 0.277 0.231 0.187 5
Expectations 0.247 0.175 0.153 6
Multifactor leadership 0.441 0.387 0.149 8
0.078 0.080 0.149 5
Trust between coworkers 0.187 0.119 0.130 6
Extrinsic motivation 0.038 0.028 0.112 4
-0.328 -0.255 0.1056 6
Emotional stability 0.140 0.121 0.0930 4
Extraversion 0.133 0.106 0.0848 5
Causal attribution in luck -0.074 -0.070 0.0840 6
Job involvement 0.052 0.031 0.0836 7
Causal attribution in task 0.003 0.000 0.0783 4
Infusion of new system 0.067 0.055 0.0711 4
Job satisfaction with
0.075 0.068 0.0677 9
0.251 0.206 0.0673 6
Locus of control 0.046 0.046 0.0672 4
Make no change 0.026 0.021 0.0639 4
Manager support 0.171 0.124 0.0631 7
Planning/time
management 0.142 0.110 0.0627 4
Task attribute/
characteristics 0.035 0.030 0.0624 10
statistics are significant under chi-square test at α=.05 and (number of effect size -1) freedom
Journal of Management and Marketing Research
Detecting moderator effects, Page 12
with Positive and Negative Correlations (Top 25)
No. of
Effect
Total
Sample
Size
Q-
Statistic1
4 1048 325
8 2429 406
4 1048 210
4 1378 227
4 1048 153
5 1149 163
6 1093 113
8 1114 128
5 958 93
6 858 66
4 888 58
6 2134 138
4 432 25
5 1012 47
6 1292 84
7 2336 124
4 932 53
4 837 44
9 2549 113
6 1239 58
4 789 35
4 1048 55
7 2239 87
4 606 23
10 2414 111
1) freedom
Statistics of Relationships between Job Performance and
Construct Corrected
Mean
Autonomy
Helping behavior
Motivation
Sportsmanship
Support
Effort
Self-efficacy
Customer orientation
Ability to modify
Expectations
Felt stress
Organizational citizenship
behaviors
Achievement striving
Courtesy
Control system2
Adaptive selling
Civic virtue
Adaptive selling intention
Intention to leave
Effectiveness
Selling skills
Innovation
Satisfaction with sales territory
design
Cohesion
Intrinsic motivation
Note: Ordered by corrected variance. 1 All Q-statistics are significant under chi
2Control system: Includes all kinds of control scales that
behavior, output, knowledge control, etc.
Journal of Management and Marketing Research
Detecting moderator effects
Table 5
Statistics of Relationships between Job Performance and its Related Constructs with Large
Corrected Variances (Top 25)
Corrected
Mean
Weighted
Mean
Corrected
Variance
No. of
Effect Sizes
Total
Sample Size
0.526 0.434 0.084 7
0.449 0.384 0.084 8
0.222 0.166 0.068 8
0.322 0.259 0.067 11
0.661 0.596 0.064 5
0.439 0.358 0.050 18
0.398 0.327 0.043 10
0.350 0.296 0.042 19
0.294 0.236 0.041 6
0.371 0.319 0.040 4
-0.171 -0.147 0.039 12
0.402 0.341 0.037 13
0.429 0.341 0.037 3
0.418 0.301 0.035 4
0.223 0.184 0.035 23
0.379 0.322 0.035 36
0.504 0.419 0.030 8
0.416 0.328 0.027 3
-0.196 -0.164 0.027 21
0.295 0.248 0.027 10
0.489 0.389 0.025 9
0.731 0.665 0.023 3
0.462 0.373 0.023 7
0.686 0.621 0.022 3
0.281 0.224 0.022 9
statistics are significant under chi-square test at α=.05 and (number of effect size -1) freedom.
Control system: Includes all kinds of control scales that do not clearly indicate their specific attributions, such as
behavior, output, knowledge control, etc.
Journal of Management and Marketing Research
Detecting moderator effects, Page 13
its Related Constructs with Large
Total
Sample Size
Q-
Statistic1
1565 93
3218 203
2324 90
4036 185
946 50
3950 134
2021 59
4913 155
1872 48
561 17
3215 91
4233 116
561 13
1109 22
4273 104
7753 198
3046 64
380 6
4837 90
1852 35
2491 41
713 14
793 12
713 13
1906 27
1) freedom.
do not clearly indicate their specific attributions, such as
Statistics of Relationships between Job Performance and its Related Constructs with Positive and
Construct Corrected
Mean
Psychological climate 0.277
Multifactor leadership 0.441
Training 0.078
Extrinsic motivation 0.038
Job involvement 0.052
Job satisfaction with
coworkers 0.075
Locus of control 0.046
Manager support 0.171
Planning/time management 0.142
Task attribute/characteristics 0.035
Participation 0.229
Market conditions 0.042
Agreeableness 0.116
Goal specificity 0.068
Behavior control 0.130
Goal difficulty 0.083
Job satisfaction with pay 0.078
Selling orientation -0.037
Job satisfaction with manager 0.085
Openness 0.000
Job satisfaction with
opportunities 0.055
Note: Ordered by corrected variance. 1 All Q-statistics are significant under chi
Journal of Management and Marketing Research
Detecting moderator effects
Table 6
between Job Performance and its Related Constructs with Positive and
Negative Correlations
Corrected
Mean
Weighted
Mean
Corrected
Variance
No. of
Effect Sizes
Total
Sample Size
0.277 0.231 0.187 5
0.441 0.387 0.149 8
0.078 0.080 0.149 5
0.038 0.028 0.112 4
0.052 0.031 0.084 7
0.075 0.068 0.068 9
0.046 0.046 0.067 4
0.171 0.124 0.063 7
0.142 0.110 0.063 4
0.035 0.030 0.062 10
0.229 0.196 0.059 5
0.042 0.031 0.054 8
0.116 0.098 0.050 4
0.068 0.064 0.045 9
0.130 0.101 0.034 10
0.083 0.070 0.031 9
0.078 0.064 0.026 9
0.037 -0.030 0.024 4
0.085 0.071 0.016 9
0.000 0.004 0.016 7
0.055 0.046 0.005 8
statistics are significant under chi-square test at α=.05 and (number of effect size -1) freedom
Journal of Management and Marketing Research
Detecting moderator effects, Page 14
between Job Performance and its Related Constructs with Positive and
Total
Sample Size
Q-
Statistic1
1149 163
1114 128
958 93
888 58
2336 124
2549 113
789 35
2239 87
606 23
2414 111
1226 52
1569 58
465 15
2232 82
2841 64
2232 46
2383 41
1378 24
2457 28
1092 12
2966 11
1) freedom
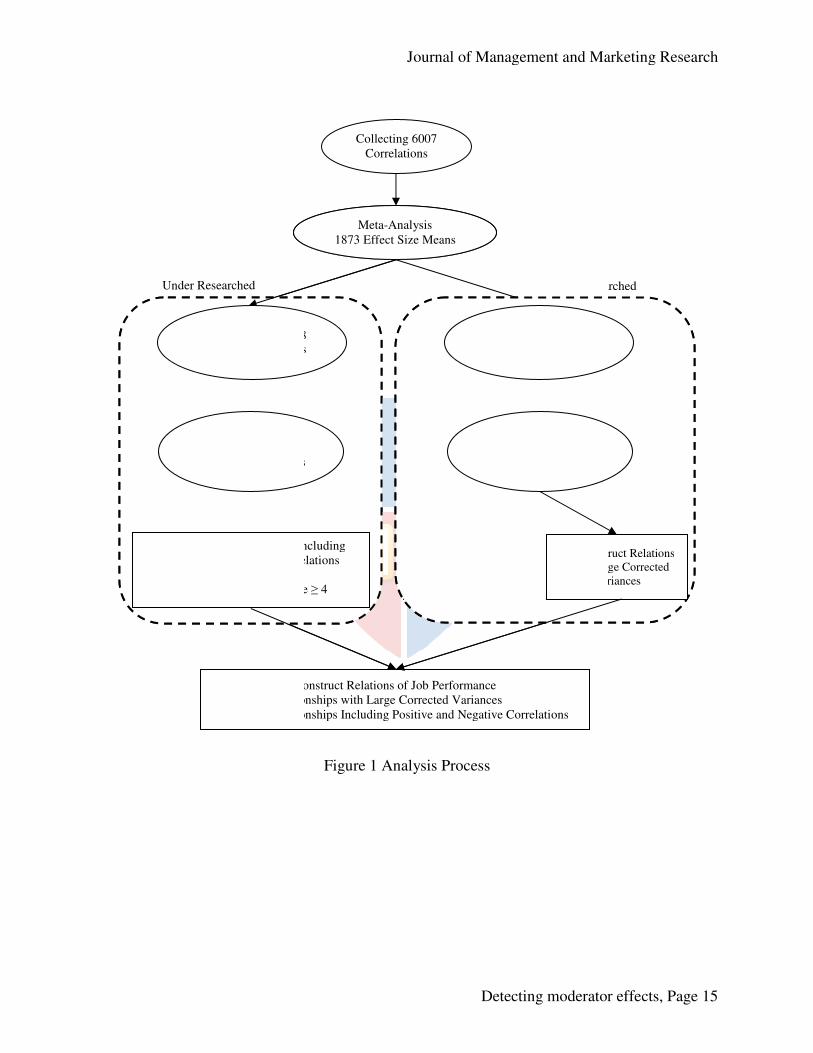
Under Researched
48 Construct Relationships Including
Positive and Negative Correlations
and
the Number of Effect Size
Construct Relations of
(1) 68 Relationships with Large Corrected Variances
(2) 21 Relationships Including Positive and Negative Correlations
Statistical Power < 0.8
985 Effect Size Means
Confidence Intervals
including 0
281 Effect Size Means
Journal of Management and Marketing Research
Detecting moderator effects
Figure 1 Analysis Process
Primarily Researched
48 Construct Relationships Including
Positive and Negative Correlations
the Number of Effect Size ≥ 4
Collecting 6007
Correlations
Meta-Analysis
1873 Effect Size Means
Statistical Power ≥ 0.8
888 Effect Size Means
Corrected
Variance > 0
819 Effect Size Means
539 Construct Relations
With Small Corrected
Variances
280 Construct Relations
With Large Corrected
Variances
Construct Relations of Job Performance
(1) 68 Relationships with Large Corrected Variances
21 Relationships Including Positive and Negative Correlations
Statistical Power < 0.8
985 Effect Size Means
281 Effect Size Means
Journal of Management and Marketing Research
Detecting moderator effects, Page 15
Primarily Researched
280 Construct Relations
With Large Corrected
Variances
REFERENCES
Arthur, W., Jr., Bennet, W., Edens, P. S., & Bell, S. T. (2003). Effectiveness of
organizations: A meta-analysis of design and evaluation features
Psychology, 88 (2), 234-245.
Baron, R. M., & Kenny, D. A. (1986). The
psychological research: Conceptual,
Personality and Social Psychology
3514.51.6.1173
Carrillat, F. A., Jaramillo, F., & Mulki, J. P. (2009). Examining the
meta-analysis of empirical
doi:10.2753/MTP1069-6679170201
Churchill, G. A., Ford, N. M., Hartley
salesperson performance: A
118. doi:10.2307/3151357
Cortina, J. M., & Folger, R. G. (1998). When
way, Jose? Organizational Research Methods
doi:10.1177/109442819813004
Dixon, A. L., Forbes, L. P., & Sch
sales success shape inexperi
Personal Selling and Sales Management
Dixon, A. L., & Schertzer, S. M. B. (2005). Bouncing b
efficacy infuence attributions and behaviors following
Selling and Sales Management
Dixon, A. L., Spiro, R. L., & Jamil
Measuring salesperson attributions and behavioral intentions
(3), 64-78. doi:10.1509/jmkg.65.3.64.18333
Evans, K. R., Schlacter, J. L., Schultz
Salesperson and sales manager perceptions of salesperson job characteristics and job
outcomes: A perceptual congruence a
Practice, 10 (4), 30-44.
Frazier, P. A., Tix, A. P., & Barron, K. E. (2004). Testing
counseling psychology research
doi:10.1037/0022-0167.51.1.115
Hedges, L. V., & Pigott, T. D. (2001)
Psychological Methods, 6
Huedo-Medina, T. B., Sa´nchez-
heterogeneity in meta-analysis
193-206. doi:10.1037/1082
Hunter, J. E., & Schmidt, F. L. (2004).
Research Findings. Thousand Oaks, CA: Sage Publications, Inc.
Ingram, T. N., Lee, K. S., & Skinner, S. J. (1989). An
motivation, commitment, and job outcomes
Management, 9 (3), 25-33.
Journal of Management and Marketing Research
Detecting moderator effects
Arthur, W., Jr., Bennet, W., Edens, P. S., & Bell, S. T. (2003). Effectiveness of training in
analysis of design and evaluation features. Journal of Applied
245. doi:10.1037/0021-9010.88.2.234
Baron, R. M., & Kenny, D. A. (1986). The moderator-mediator variable distinction in social
: Conceptual, strategic, and statistical considerations
Personality and Social Psychology, 51 (6), 1173–1182. doi:10.1037//0022
F. A., Jaramillo, F., & Mulki, J. P. (2009). Examining the impact of service quality
analysis of empirical. Journal of Marketing Theory & Practice, 17
6679170201
M., Hartley, S. W., & Walker, O. C. (1985). The determinants of
: A meta-analysis. Journal of Marketing Research
doi:10.2307/3151357
Cortina, J. M., & Folger, R. G. (1998). When is it acceptable to accept the null hypothesis
Organizational Research Methods, 1 (3), 334-350.
doi:10.1177/109442819813004
Dixon, A. L., Forbes, L. P., & Schertzer, S. M. B. (2005). Early success: How attributions for
success shape inexperienced salespersons’ behavioral intensions. Journal of
Personal Selling and Sales Management, 25 (1), 67-77.
zer, S. M. B. (2005). Bouncing back: How salesperson optimism and self
infuence attributions and behaviors following failure. Journal of Personal
Selling and Sales Management, 25 (4), 361-369.
Jamil, M. (2001). Successful and unsuccessful sales calls
salesperson attributions and behavioral intentions. Journal of Marketing
doi:10.1509/jmkg.65.3.64.18333
L., Schultz, R. J., Gremler, D. D., Pass, M., & Wolfe,
sales manager perceptions of salesperson job characteristics and job
perceptual congruence approach. Journal of Marketing Theory and
Frazier, P. A., Tix, A. P., & Barron, K. E. (2004). Testing moderator and mediator effects in
counseling psychology research. Journal of Counseling Psychology, 51 (1), 115
0167.51.1.115
D. (2001). The power of statistical tests in meta-analysis
, 6 (3), 203-217. doi:10.1037/1082-989X.6.3.203
-Meca, J., Marı´n-Martı´nez, F., & Botella, J. (2006). Assessing
analysis: Q statistic or I2 index? Psychological Methods
206. doi:10.1037/1082-989X.11.2.193
Hunter, J. E., & Schmidt, F. L. (2004). Methods of Meta-Analysis: Correcting Error and Bias in
. Thousand Oaks, CA: Sage Publications, Inc.
Ingram, T. N., Lee, K. S., & Skinner, S. J. (1989). An empirical assessment of salesperson
motivation, commitment, and job outcomes. Journal of Personal Selling and Sales
3.
Journal of Management and Marketing Research
Detecting moderator effects, Page 16
training in
Journal of Applied
mediator variable distinction in social
strategic, and statistical considerations. Journal of
1182. doi:10.1037//0022-
impact of service quality: A
(2), 95-110.
determinants of
Journal of Marketing Research, 22 (2), 103-
acceptable to accept the null hypothesis: No
attributions for
Journal of
salesperson optimism and self-
Journal of Personal
unsuccessful sales calls:
Journal of Marketing, 65
W. G. (2002).
sales manager perceptions of salesperson job characteristics and job
Journal of Marketing Theory and
moderator and mediator effects in
(1), 115-134.
analysis.
ella, J. (2006). Assessing
Psychological Methods, 11 (2),
Analysis: Correcting Error and Bias in
empirical assessment of salesperson
Journal of Personal Selling and Sales
Jaramillo, F., Grisaffe, D. B., Chonko, L. B., & Roberts, J. A. (2009). Examining the
servant leadership on sales force performance
Management, 29 (3), 257
Jaramillo, F., & Mulki, J. P. (2008)
and the salesperson. Journal of Personal Selling and Sales Management
doi:10.2753/PSS0885-3134280103
Katsikea, E., Theodosiou, M., & Morgan, R. E.
drivers of sales effectiveness in export market ventures
Marketing Science, 35 (2), 270
Kemery, E. R., Mossholder, K. W., & Dunlap, W. P. (1989).
variables: A cautionary note on transportability
168-170. doi:10.1037/0021
Kemery, E. R., Mossholder, K. W., & Roth, L. (1987). The
additive model of validity generalization
doi:10.1037/0021-9010.72.1.30
Koslowsky, M., & Sagie, A. (1993). On the
moderator effects in meta
695-699. doi:10.1002/job.4030140708
Lipsey, M. W., & Wilson, D. B.
Publications, Inc.
MacCallum, R. C., Browne, M. W., & Sugawara, H.M. (1996). Power
determination of sample size for covariance structure modeling
1 (2), 130-149. doi:10.1037/1082
McQuitty, S. (2004). Statistical power and structural equation models in business research
Journal of Business Research
Miao, C. F., Evans, K. R., & Zou
systems – intrinsic and extrinsic motivation revisited
(5), 417-586. doi:10.1016/j.jbusres.2006.12.005
Naumann, E., Widmier, S. M., & Jackson, D. W., Jr. (2000). Examining the
work attitudes and propensity to leave among expatriate salespeople
Selling and Sales Management
Noble, C. H. (2008). The influence of job security on field sales manager satisfaction
frontline tensions. Journal of Personal Selling and Sales Management
doi:10.2753/PSS0885-3134280303
Pearlman, K., Schmidt, F. L., & Hunter, J. E. (1980). Validity
used to predict job proficiency and training success in clerical occupations
Applied Psychology, 65 (4), 373
Sackett, P. R., Harris, M. M., & O
analysis of correlational data
resistance to Type I error.
doi:10.1037/0021-9010.71.2.302
Sagie, A., & Koslowsky, M. (1993). Detecting
and comparison of techniques
doi:10.1111/j.1744-6570.1993.tb00888.x
Tyagi, P. K. (1985). Work motivation through the design of
Personal Selling and Sales Management
Journal of Management and Marketing Research
Detecting moderator effects
Jaramillo, F., Grisaffe, D. B., Chonko, L. B., & Roberts, J. A. (2009). Examining the
servant leadership on sales force performance. Journal of Personal Selling and Sales
(3), 257-275. doi:10.2753/PSS0885-3134290304
P. (2008). Sales effort: The intertwined roles of the leader, customers,
Journal of Personal Selling and Sales Management, 28
3134280103
Katsikea, E., Theodosiou, M., & Morgan, R. E. (2007). Managerial, organizational, and external
drivers of sales effectiveness in export market ventures. Journal of the Academy of
(2), 270-283. doi:10.1007/s11747-007-0041-5
Kemery, E. R., Mossholder, K. W., & Dunlap, W. P. (1989). Meta-analysis and moderator
cautionary note on transportability. Journal of Applied Psychology
170. doi:10.1037/0021-9010.74.1.168
Kemery, E. R., Mossholder, K. W., & Roth, L. (1987). The power of the Schmid and Hunter
odel of validity generalization. Journal of Applied Psychology
9010.72.1.30
Koslowsky, M., & Sagie, A. (1993). On the efficacy of credibility intervals as indicators of
moderator effects in meta-analytic research. Journal of Organizational Behavior
699. doi:10.1002/job.4030140708
(2001). Practical Meta-Analysis. Thousand Oaks, CA: SAGE
MacCallum, R. C., Browne, M. W., & Sugawara, H.M. (1996). Power analysis and
determination of sample size for covariance structure modeling. Psychological Methods
149. doi:10.1037/1082-989X.1.2.130
power and structural equation models in business research
Journal of Business Research, 57 (2), 175-183. doi:10.1016/S0148-2963(01)00301
Zou, S. (2007). The role of salesperson motivation in sales control
intrinsic and extrinsic motivation revisited. Journal of Business Research
.1016/j.jbusres.2006.12.005
Naumann, E., Widmier, S. M., & Jackson, D. W., Jr. (2000). Examining the relationship between
work attitudes and propensity to leave among expatriate salespeople. Journal of Personal
Selling and Sales Management, 20 (4), 227-241.
influence of job security on field sales manager satisfaction
Journal of Personal Selling and Sales Management, 28
3134280303
Hunter, J. E. (1980). Validity generalization results for tests
used to predict job proficiency and training success in clerical occupations
(4), 373-406. doi:10.1037/0021-9010.65.4.373
Sackett, P. R., Harris, M. M., & Orr, J. M. (1986). On seeking moderator variables in the meta
analysis of correlational data: A Monte Carlo investigation of statistical power and
. Journal of Applied Psychology, 71 (2), 302-310.
9010.71.2.302
Sagie, A., & Koslowsky, M. (1993). Detecting moderators with meta-analysis: A
and comparison of techniques. Personnel Psychology, 46 (3), 629-640.
6570.1993.tb00888.x
motivation through the design of salesperson jobs. Journal of
Personal Selling and Sales Management, 5 (1), 41-51.
Journal of Management and Marketing Research
Detecting moderator effects, Page 17
Jaramillo, F., Grisaffe, D. B., Chonko, L. B., & Roberts, J. A. (2009). Examining the impact of
Journal of Personal Selling and Sales
intertwined roles of the leader, customers,
, 28 (1), 37-51.
organizational, and external
Journal of the Academy of
analysis and moderator
Journal of Applied Psychology, 74 (1),
ower of the Schmid and Hunter
Journal of Applied Psychology, 72 (1), 30-37.
efficacy of credibility intervals as indicators of
f Organizational Behavior, 14 (7),
. Thousand Oaks, CA: SAGE
analysis and
Psychological Methods,
power and structural equation models in business research.
2963(01)00301-0
role of salesperson motivation in sales control
Journal of Business Research, 60
relationship between
Journal of Personal
influence of job security on field sales manager satisfaction: Exploring
, 28 (3), 247-261.
generalization results for tests
used to predict job proficiency and training success in clerical occupations. Journal of
seeking moderator variables in the meta-
investigation of statistical power and
310.
An evaluation
Journal of
Whitener, E. M. (1990). Confusion of
Applied Psychology, 75 (3), 315
Witter, R. A., Okun, M. A., Stock, W. A., & Haring, M. J. (1984). Education and
well-being: A meta-analysis
doi:10.2307/1163911
Journal of Management and Marketing Research
Detecting moderator effects
Whitener, E. M. (1990). Confusion of confidence intervals and credibility intervals
(3), 315-321. doi:10.1037/0021-9010.75.3.315
. A., Okun, M. A., Stock, W. A., & Haring, M. J. (1984). Education and
analysis. Educational Evaluation and Policy Analysis
Journal of Management and Marketing Research
Detecting moderator effects, Page 18
confidence intervals and credibility intervals. Journal of
. A., Okun, M. A., Stock, W. A., & Haring, M. J. (1984). Education and subjective
Educational Evaluation and Policy Analysis, 6 (2), 165-173.