Embed Size (px)
Citation preview

brief communications
nature methods | VOL.7 NO.3 | MARCH 2010 | 203
or inside cells5. Neither of these applications used smFRET to address protein conformational changes related to function.
Ensemble FRET studies of molecular function are common in live cells using transfected protein chimeras with fluorescent proteins as a donor-acceptor pair. Variable expression levels make single-molecule application of this approach challenging. Additionally, the large fluorescent moieties limit the choice of attachment location and may inhibit close approach of linked domains. We circumvented these limitations by using cysteine mutation in bacterially expressed, recombinant proteins to allow site-specific attachment of small, organic fluorophores. Approaches using unnatural amino acids for site-specific label-ing can be used for proteins not amenable to cysteine mutation6. High-resolution structures guided our designs for labeling sites such that smFRET could confidently report conformation. We microinjected dilute solutions of labeled proteins into cells and viewed them using objective-type total internal reflection fluores-cence microscopy (TIRFM) with spectrally resolved detection for smFRET analysis (Online Methods).
We demonstrated our approach with SNARE proteins involved in cellular membrane fusion. SNAREs on vesicles form a complex with other SNAREs on membranes targeted for fusion. Many SNARE proteins, including those we studied, are unstructured when mono-meric and undergo a dramatic folding transition upon entering into SNARE complex, a 10-nm-long coiled-coil of four α-helices7. We designed dual-labeled SNAREs that emit low FRET when not in a complex but could either yield low or high FRET depending on dye location when folded into a SNARE complex (Fig. 1a,b).
Our first experiments used the neuronal SNARE SNAP-25. Upon forming SNARE complex with its partner SNAREs synapto-brevin (on vesicles) and syntaxin (on the plasma membrane), the SNARE domains of SNAP-25 (SN1 and SN2) assemble into parallel α-helices such that initially well-separated parts of the protein are brought together (Fig. 1a). We labeled SNAP-25 with a donor (Cy3 or Alexa Fluor 555) and an acceptor (Cy5 or Alexa Fluor 647), one in SN1 and the other in SN2 (similar to another ensemble, genetically encoded FRET study8). High FRET occurs if both label sites are at the C-terminal (CC) or N-terminal ends (NN) of SN1 and SN2, whereas low FRET occurs if one dye is in the N-terminal end of SN1 and the other dye is in the C-terminal end of SN2 (NC) (Fig. 1a,b). Isolated SNAP-25 is unstructured, yielding low FRET. We verified these behaviors in vitro (Online Methods and Supplementary Fig. 1).
We injected these double-labeled soluble SNAP-25s (SNAP-25–CC and SNAP-25–NC) into BS-C-1 adherent cells while imag-ing with objective-type TIRFM. A diffuse fluorescence emission rapidly spread throughout the cell (Supplementary Videos 1–3). Immediately after injection, discrete points of emission in the donor and acceptor channels for SNAP-25–CC (Fig. 1c–e) indicated that
detecting the conformation of individual proteins in live cellsJohn J Sakon & Keith R Weninger
We combined single-molecule fluorescence resonance energy transfer (smfret) with single-particle tracking in live cells to detect the in vivo conformation of individual proteins. We site-specifically labeled recombinant snare proteins with a fret donor and acceptor before microinjecting them into cultured cells. individual proteins rapidly incorporated into folded complexes at the cell membrane, demonstrating the potential of this method to reveal dynamic interactions within cells.
Dynamic conformational changes are important for function in many proteins. X-ray crystallography and NMR spectroscopy pro-vide atomic-level details of the averaged behavior of an ensemble of molecules, but protein motions are not commonly revealed. Single-molecule spectroscopic methods allow access to the con-formational dynamics and transient associations of biomolecules that can be fundamental to biological function1. Unfortunately, biomolecular function in purified assays can be different than in native environments. Molecular crowding, regulatory interactions and cellular feedback networks all obscure the physiological relevance of many quantitative in vitro studies. Applying struc-tural and biochemical methodologies in an in vivo setting would address these issues, but such live-cell applications are challenging2. Ensemble fluorescence resonance energy transfer (FRET) studies are widely used to measure interactions and conformations aver-aged over many molecules inside cells. Extending this approach to the single-molecule level will enable observations hidden by ensemble averaging. Interrogating individual molecules can reveal heterogeneous subpopulations in the ensemble and can detect multiple pathways or intermediate states during dynamic transitions that are often unsynchronizable across populations inside cells. Here we combined single-molecule FRET (smFRET) measurements, which can report molecular conformations at nanometer resolution, with single-particle tracking to observe individual soluble N-ethylmaleimide–sensitive factor attachment protein receptor (SNARE) proteins entering into membrane- tethered complexes in live cells.
Single-molecule fluorescence observations are used extensively in live cells for tracking3. Extensions to smFRET detection in unper-turbed live cell contexts have been limited to detection of small-molecule ligands binding protein targets on the exterior surface4
Department of Physics, North Carolina State University, Raleigh, North Carolina, USA. Correspondence should be addressed to K.R.W. ([email protected]).
Received 12 August 2009; Accepted 9 decembeR 2009; published online 31 jAnuARy 2010; doi:10.1038/nmeth.1421
© 2
010
Nat
ure
Am
eric
a, In
c. A
ll ri
gh
ts r
eser
ved
.

204 | VOL.7 NO.3 | MARCH 2010 | nature methods
brief communications
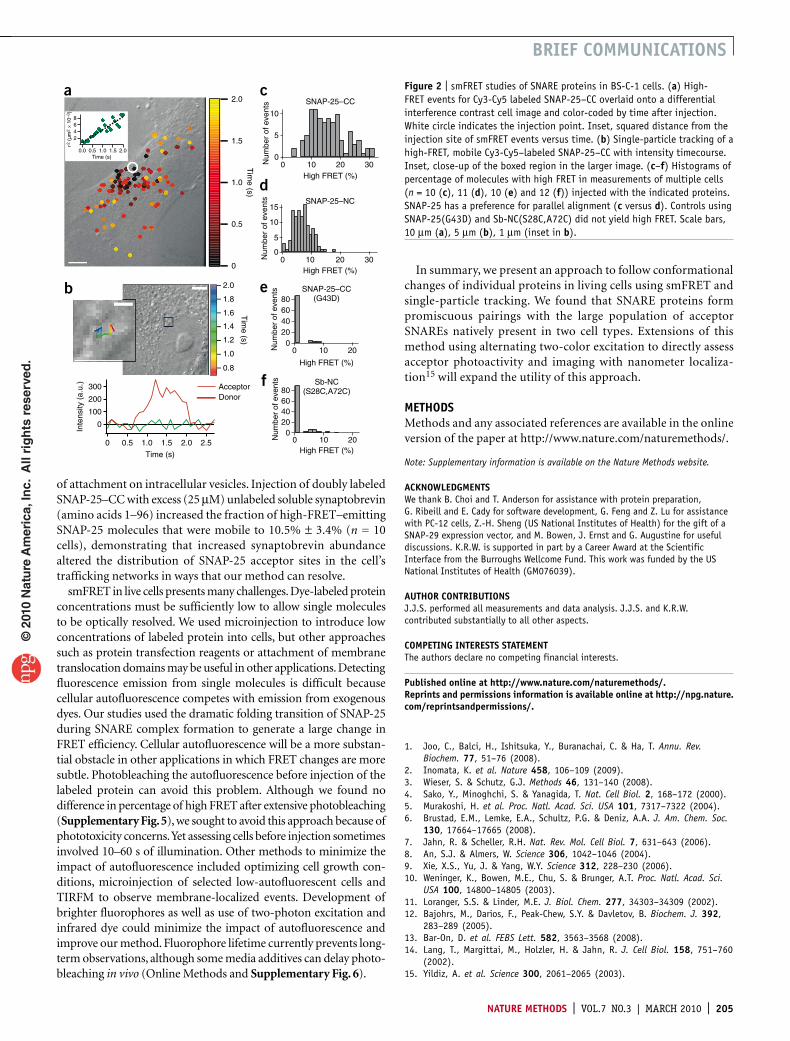
some molecules became membrane-localized. Diffusing soluble molecules appeared blurred with our 100 ms exposures (stopped-motion imaging can be used to image soluble molecules9), but the membrane-tethered SNAREs appeared as diffraction-limited spots. We compared single-molecule locations and spatial trajectories to images of the cell obtained before and after fluorescence imaging (Fig. 2a,b). High-FRET events spreading from the injection site indi-cated diffusion of the soluble protein in the cell (Fig. 2a).
Examination of fluorescence intensities for membrane-bound molecules revealed sudden steps with anticorrelated donor and acceptor emission that are characteristic of smFRET (Fig. 1c,d and Supplementary Fig. 2). The emission of high FRET indicated folding of SNAP-25–CC into SNARE complexes (Fig. 1e). Control experiments in which we injected mixtures of donor-only and acceptor-only SNAP-25 showed no high FRET (Supplementary Table 1 and Supplementary Fig. 3).
Precise injection efficiencies varied, so we normalized high accep-tor emission events to the total single molecules imaged per cell. Comparing histograms of this percentage of molecules with high FRET for experiments across many cells revealed that SNAP-25–CC yielded about twice the percentage of high FRET as SNAP-25–NC (Fig. 2c,d). High FRET from SNAP-25–NC indicates that in vivo antiparallel SNARE complex assembly can occur10.
Several experiments confirmed that the high-FRET signal resulted from SNARE complex formation. SNAP-25–CC(G43D), with a mutation that prevents SNARE complex formation in vitro and in vivo11, yielded no high-FRET events above back-ground (Fig. 2e, Supplementary Video 3 and Supplementary Table 1). Furthermore, injections of synaptobrevin lacking a transmembrane domain labeled with donor and acceptor dyes at opposite ends of the helix-forming region, keeping them 7 nm apart in complex (Sb-NC), also produced no high-FRET events above background (Fig. 2f, Supplementary Table 1 and Supplementary Fig. 3).
We compared SNAREs from distinct trafficking pathways (SNAP-25 and SNAP-29) in two different cell types. SNAP-29 is widely expressed
in most tissues, whereas SNAP-25 is neuron-specific. Therefore, we compared neuron-like PC-12 (neuroendocrine) cells to BS-C-1 green monkey kidney epithelial cells, which do not express SNAP-25. We observed both proteins participating efficiently in SNARE complex formation in both cell lines (Supplementary Table 1 and Supplementary Fig. 3). Despite some variability, we found that SNAREs from distinct cellular pathways can substitute for each other in assembled complexes in living cells. This lack of specificity is not completely unanticipated because SNAREs are well known to assemble promiscuously in vitro with many noncognate partners7. Our in vivo observation of SNARE promiscuity supports other findings that implicate non-SNARE factors in maintaining proper vesicular trafficking in cells7,12.
We observed smFRET resulting from SNARE complex assembly immediately after injection (Fig. 2a), indicating that binding sites are available to quickly accept SNAREs in the natural resting state of these cells. Immunoassay12 and binding studies in permeabilized cells13,14 indicate that ~90% of the native syntaxin at the plasma membrane is available for forming SNARE complex, whereas exogenous SNAP-25 and synaptobrevin both rapidly assemble into SNARE complex on plasma membranes. Our studies extend these conclusions to real-time analysis of fully intact, living cells.
Applying smFRET in live cells allowed observations not possible with ensemble approaches, particularly revealing behaviors of small subpopulations. For example, our experiments determined from the duration of individual, high-FRET binding events that SNAP-25 separated into two populations (10% and 90%) with exponentially distributed lifetimes differing by a factor of 4 (Supplementary Note and Supplementary Fig. 4). The two lifetimes could reflect two distinct bound states in the high-FRET conformation, possibly the binary and ternary SNARE complexes, that would not be differ-entiated in ensemble measurements. Single-particle tracking also allowed us to individuate molecules based upon mobility. Most high-FRET–emitting (>0.7) SNAP-25 molecules did not move, but 3.5% ± 1.5% of molecules (n = 10 cells) diffused with mobility near 0.25 µm2 s−1 (Fig. 2b and Supplementary Note), possibly because
C
N
N
C
SNAP-25–CC
SNAP-25–NC
a
SNAP-25–NC (8.0 nm)SNAP-25–CC
(1.5 nm)
b
c
d300
200
100
0Inte
nsity
(a.
u.)
3210Time (s)
AcceptorDonor
Acceptor (Cy5)
Donor (Cy3)2.0 s 2.3 s1.8 s1.7 s1.0 s0.7 s
N C
SN1 SN2
N C
SN1 SN2
High FRET
Low FRET
40
20
0
Num
ber
of e
vent
s
1.51.00.50.0FRET efficiency
e
figure 1 | smFRET detection in live cells. (a) Schematic of SNAP-25–CC and SNAP-25–NC label site locations. Isolated SNAP-25 (left) is unstructured, resulting in low FRET because of the large separation of the label attachment sites. When SNAP-25 enters SNARE complex (right; synaptobrevin and syntaxin are not shown) the SNAP-25–CC and SNAP-25–NC constructs yield high- and low-FRET states, respectively. Gray circles represent the approximate label sites. (b) Location of label sites (gray circles) in assembled SNARE complex (Protein Data Bank (PDB) identifier: 1sfc; syntaxin, red; synaptobrevin, blue; SNAP-25, green). SNAP-25–CC construct was designed such that dye distances are less than 2 nm apart in the final SNARE complex and give high FRET. SNAP-25–NC was designed so dyes are 8 nm apart in parallel complex and give low FRET. (c) Detail of a movie of fluorescence emission in the donor (bottom) and acceptor (top) channel taken from the boxed location indicated in the differential interference contrast image for SNAP-25–CC in a BS-C-1 cell. Time after injection is indicated. Scale bars, 10 µm (left), 0.5 µm (right). (d) Intensity timecourse for smFRET example from c. Green illumination was active for entire interval plotted. (e) FRET efficiency histogram for single-molecule events occurring in supplementary Video 1 using Cy3-Cy5 labeled SNAP-25–CC in a BS-C-1 cell accumulated for 0.2 s (FRET < 0.5) and 1.0 s (FRET > 0.5) to sufficiently populate both peaks.
© 2
010
Nat
ure
Am
eric
a, In
c. A
ll ri
gh
ts r
eser
ved
.
nature methods | VOL.7 NO.3 | MARCH 2010 | 205
brief communications
of attachment on intracellular vesicles. Injection of doubly labeled SNAP-25–CC with excess (25 µM) unlabeled soluble synaptobrevin (amino acids 1–96) increased the fraction of high-FRET–emitting SNAP-25 molecules that were mobile to 10.5% ± 3.4% (n = 10 cells), demonstrating that increased synaptobrevin abundance altered the distribution of SNAP-25 acceptor sites in the cell’s trafficking networks in ways that our method can resolve.
smFRET in live cells presents many challenges. Dye-labeled protein concentrations must be sufficiently low to allow single molecules to be optically resolved. We used microinjection to introduce low concentrations of labeled protein into cells, but other approaches such as protein transfection reagents or attachment of membrane translocation domains may be useful in other applications. Detecting fluorescence emission from single molecules is difficult because cellular autofluorescence competes with emission from exogenous dyes. Our studies used the dramatic folding transition of SNAP-25 during SNARE complex formation to generate a large change in FRET efficiency. Cellular autofluorescence will be a more substan-tial obstacle in other applications in which FRET changes are more subtle. Photobleaching the autofluorescence before injection of the labeled protein can avoid this problem. Although we found no difference in percentage of high FRET after extensive photobleaching (Supplementary Fig. 5), we sought to avoid this approach because of phototoxicity concerns. Yet assessing cells before injection sometimes involved 10–60 s of illumination. Other methods to minimize the impact of autofluorescence included optimizing cell growth con-ditions, microinjection of selected low-autofluorescent cells and TIRFM to observe membrane-localized events. Development of brighter fluorophores as well as use of two-photon excitation and infrared dye could minimize the impact of autofluorescence and improve our method. Fluorophore lifetime currently prevents long-term observations, although some media additives can delay photo-bleaching in vivo (Online Methods and Supplementary Fig. 6).
In summary, we present an approach to follow conformational changes of individual proteins in living cells using smFRET and single-particle tracking. We found that SNARE proteins form promiscuous pairings with the large population of acceptor SNAREs natively present in two cell types. Extensions of this method using alternating two-color excitation to directly assess acceptor photoactivity and imaging with nanometer localiza-tion15 will expand the utility of this approach.
methodsMethods and any associated references are available in the online version of the paper at http://www.nature.com/naturemethods/.
Note: Supplementary information is available on the Nature Methods website.
acknoWledgmentsWe thank B. Choi and T. Anderson for assistance with protein preparation, G. Ribeill and E. Cady for software development, G. Feng and Z. Lu for assistance with PC-12 cells, Z.-H. Sheng (US National Institutes of Health) for the gift of a SNAP-29 expression vector, and M. Bowen, J. Ernst and G. Augustine for useful discussions. K.R.W. is supported in part by a Career Award at the Scientific Interface from the Burroughs Wellcome Fund. This work was funded by the US National Institutes of Health (GM076039).
author contributionsJ.J.S. performed all measurements and data analysis. J.J.S. and K.R.W. contributed substantially to all other aspects.
comPeting interests statementThe authors declare no competing financial interests.
Published online at http://www.nature.com/naturemethods/. reprints and permissions information is available online at http://npg.nature.com/reprintsandpermissions/.
1. Joo, C., Balci, H., Ishitsuka, Y., Buranachai, C. & Ha, T. Annu. Rev. Biochem. 77, 51–76 (2008).
2. Inomata, K. et al. Nature 458, 106–109 (2009).3. Wieser, S. & Schutz, G.J. Methods 46, 131–140 (2008).4. Sako, Y., Minoghchi, S. & Yanagida, T. Nat. Cell Biol. 2, 168–172 (2000).5. Murakoshi, H. et al. Proc. Natl. Acad. Sci. USA 101, 7317–7322 (2004).6. Brustad, E.M., Lemke, E.A., Schultz, P.G. & Deniz, A.A. J. Am. Chem. Soc.
130, 17664–17665 (2008).7. Jahn, R. & Scheller, R.H. Nat. Rev. Mol. Cell Biol. 7, 631–643 (2006).8. An, S.J. & Almers, W. Science 306, 1042–1046 (2004).9. Xie, X.S., Yu, J. & Yang, W.Y. Science 312, 228–230 (2006).10. Weninger, K., Bowen, M.E., Chu, S. & Brunger, A.T. Proc. Natl. Acad. Sci.
USA 100, 14800–14805 (2003).11. Loranger, S.S. & Linder, M.E. J. Biol. Chem. 277, 34303–34309 (2002).12. Bajohrs, M., Darios, F., Peak-Chew, S.Y. & Davletov, B. Biochem. J. 392,
283–289 (2005).13. Bar-On, D. et al. FEBS Lett. 582, 3563–3568 (2008).14. Lang, T., Margittai, M., Holzler, H. & Jahn, R. J. Cell Biol. 158, 751–760
(2002).15. Yildiz, A. et al. Science 300, 2061–2065 (2003).
a
Tim
e (s)
8642
r2 (
µm2
× 10
–3)
Time (s)2.01.51.00.50.0
2.0
1.5
1.0
0.5
0
SNAP-25–CC
SNAP-25–CC(G43D)
SNAP-25–NC
Sb-NC
Num
ber
of e
vent
s
f
d
e
c
High FRET (%)
10
5
03020100
80604020
020100
15
10
5
03020100
806040200
20100
(S28C,A72C)
High FRET (%)
High FRET (%)
High FRET (%)Time (s)
Tim
e (s)
2.0
1.8
1.6
1.4
1.2
1.0
0.8
b
300
200
100
0
2.52.01.51.00.50
Inte
nsity
(a.
u.)
AcceptorDonor
Num
ber
of e
vent
sN
umbe
r of
eve
nts
Num
ber
of e
vent
s
figure 2 | smFRET studies of SNARE proteins in BS-C-1 cells. (a) High-FRET events for Cy3-Cy5 labeled SNAP-25–CC overlaid onto a differential interference contrast cell image and color-coded by time after injection. White circle indicates the injection point. Inset, squared distance from the injection site of smFRET events versus time. (b) Single-particle tracking of a high-FRET, mobile Cy3-Cy5–labeled SNAP-25–CC with intensity timecourse. Inset, close-up of the boxed region in the larger image. (c–f) Histograms of percentage of molecules with high FRET in measurements of multiple cells (n = 10 (c), 11 (d), 10 (e) and 12 (f)) injected with the indicated proteins. SNAP-25 has a preference for parallel alignment (c versus d). Controls using SNAP-25(G43D) and Sb-NC(S28C,A72C) did not yield high FRET. Scale bars, 10 µm (a), 5 µm (b), 1 µm (inset in b).
© 2
010
Nat
ure
Am
eric
a, In
c. A
ll ri
gh
ts r
eser
ved
.

nature methods doi:10.1038/nmeth.1421
online methodsProteins. Expression and purification of SNAP-25, soluble syntaxin-1a fragment (residues 1–264, Sx) and synaptobrevin-2 soluble fragment (residues 1–96, Sb) have been described else-where10,16–18. Briefly, proteins were expressed in Escherichia coli BL21(DE3) with thrombin-cleavable, 6His tags and purified using combinations of Ni-NTA, ion exchange and gel filtration chromato-graphies. The 6His tags were removed with thrombin. Previously described mutations were K76C,Q197C for SNAP-25–CC (SN25CC) and Q20C-Q197C for SNAP-25–NC (SN25NC)18 in a SNAP-25 template with the four native cysteines mutated to serines. Mutations not previously described in SNAP-25(G43D) and Sb (S28C-A72C in Sb-NC_28_72, A5C-A72C in Sb-NC_5_72) were created using the Quikchange (Stratagene) method.
A pet28c vector encoding 6His-tagged, human SNAP-29 (ref. 19) was a gift from Z.-H. Sheng20. SNAP-29 contains no cysteines; therefore SN29NN was generated by mutations R51C,Y198C, which align with the SNAP-25–NN label sites18.
SNAP-29 was expressed in E. coli BL21(DE3). Cultures (super broth with 50 µg ml−1 kanamycin sulfate) were grown to OD600 nm of 1.0 at 37 °C while shaking. The temperature was decreased to 24 °C, 0.5 mM IPTG was added, and cells were collected after 8–10 h. For denaturing purification, cells were resuspended at 0.2 g ml−1 in lysis buffer (10 mM Tris, 100 mM NaH2PO4 and 5 M urea (pH 8.0)), disrupted by sonication and centrifuged at 10,000g for 30 min at 4 °C. Supernatant was bound to Ni-NTA beads for 1 h at 4 °C. Beads were washed with lysis buffer at pH 8.0 and then at pH 6.8 followed by elution in pH 5.9 lysis buffer. SNAP-29 at 50–100 µM aggregated unless urea was present above 2 M. SNAP-29 was dialyzed into buffer A (20 mM Tris and 2.5 M urea (pH 7.3)) and then purified on a MonoQ column (GE Biosciences) on a linear gradient in buffer A from 0 to 1 M NaCl (peak elution, ~225 mM NaCl). Molecular weight and purity were verified by SDS-PAGE (Phastgel; GE Biosciences). The 6His tag was not removed from SN29NN.
Dye labeling. As described elsewhere10,16–18,21, proteins were incubated with a tenfold molar excess of maleimide dyes at pH 7.4 for 4 h, followed by gel filtration (PD10; GE Biosciences) and extensive dialysis to remove unbound dye. Experiments with double-labeled protein used equimolar mixtures of donor and acceptor dye (either Alexa Fluor 555–Alexa Fluor 647 (Invitrogen) for SN25NC, SN29NN, Sb-NC_28_72, and Sb-NC_5_72 or Cy3-Cy5 (GE Healthcare) for SN25CC). The two cysteines were not selective for specific dyes, so 50% of double-labeled molecules had one donor and one acceptor, and the other double-labeled molecules had either two donors or two acceptors. Dye-labeling efficiencies of double-labeled proteins were, for donor and acceptor, respec-tively: SN25CC, 53 and 43%; SN29NN, 50 and 46%; SN25NC, 48 and 56%; Sb-NC_5_72, 28 and 26%; and Sb-NC_28_72, 45 and 40%. The second dye was omitted from reactions for singly labeled control experiments.
Characterization of in vitro FRET from double-labeled proteins. We encapsulated single proteins inside 100 nm diameter, biotinylated liposomes22, which were immobilized on a biotinylated-BSA and streptavidin-coated surface in a chamber between a quartz microscope slide and a glass coverslip. We mea-sured smFRET from the immobilized proteins using prism-type,
total internal reflection (TIR) illumination23,24 with the same filters and detection used for in vivo work (below). SNAP-29 was diluted in urea-free buffer so that final urea was <7 mM before liposome encapsulation. FRET from isolated SN25NC was 0.3 (U.B. Choi and K.R.W.; unpublished data) and from SN29NN is 0.37 (Supplementary Fig. 1a). FRET from SN25NC and SN25CC in parallel, SNARE complex with Sx and Sb is reported elsewhere18 as 0.3 and 0.9, respectively.
We verified that SNAP-29 formed SDS-resistant SNARE com-plex with Sx and Sb. SN29NN, Sx and Sb were mixed in that order at 1:2:5 (molar ratio) with urea always present at 2.5 M. The mixture (<0.1 ml) was dialyzed against 1 liter of buffer (20 mM Tris and 300 mM NaCl (pH 8.0), 2 mM β-mercaptoethanol, 5% (vol/vol) glycerol) with a Slide-A-Lyzer MINI Dialysis Unit (Pierce). The dialysis buffer was preheated to 37 °C before the sample was added. After the protein mixture in the dialysis unit had been in 37 °C buffer for 10 min, the dialysis flask was placed at 4 °C for 12 h with stirring. SDS-PAGE of the resulting com-plex (Supplementary Fig. 1c) showed the SN29NN-containing SNARE complex was SDS-stable without boiling and dissociated upon boiling in SDS buffer. FRET from the SN29NN SNARE complex was measured by the liposome encapsulation method (above) as 0.82 (Supplementary Fig. 1b).
Cell culture and media. BS-C-1 cells were grown to ~80% conflu-ency on coverslips in modified Eagle medium (DMEM) with 10% heat-inactivated FBS and 1% gentomycin. PC-12 cells were grown to ~50% confluency on coverslips coated with poly(l-lysine) in DMEM with 10% horse serum, 5% FBS and 1% pen-strep. Before culture, coverslips were cleaned (by sequential sonication in soapy water (Alconox), acetone, ethanol, 1 M KOH and deion-ized water), autoclaved and stored in sterile deionized water. All cell culture reagents were purchased from HyClone.
We used Erie Scientific glass coverslips (25 mm circular, number 1.5; ThermoFisher Scientific) as they had the lowest autofluorescence among the glass coverslips we tested. To further reduce fluores-cence backgrounds, we changed the cell culture medium at least 2 h before imaging to fluorescence-free MEM (without phenol red; Gibco) with 20 mM HEPES, 1% gentomycin, 2 mM Trolox (Sigma) and 200 µM cyclooctatetraene (COT; Alfa Aesar). Trolox-containing medium was stirred overnight before use25.
Microscopy. We built an objective-type TIR system23,24 using an Olympus IX71 microscope with a 60×, 1.45 numerical aper-ture (NA) or a 100×, 1.4 NA (UIS2) oil-immersion objective (Olympus). An expanded, 7 mW, 532 nm laser beam focused on the back focal plane of the objective lens traveled parallel to the optic axis so that changing the distance from the optic axis con-trolled the beam’s incident angle at the coverslip-media inter-face. We usually worked in full TIR although incident angles just below the threshold for TIR were occasionally used to generate a propagating beam that entered the sample at a steep angle. The critical angle for TIR at a glass-water interface is 61°. The maxi-mum incident angles achievable with 1.4 and 1.45 NA lenses are near 67° and 73°, respectively. In TIR with incident angles above the critical angle, an evanescent light wave penetrates beyond the glass toward the cell with an exponential decay constant of 100–200 nm depending on the precise angle. Thus TIR limits illumination to molecules near the membrane adhered to the
© 2
010
Nat
ure
Am
eric
a, In
c. A
ll ri
gh
ts r
eser
ved
.

nature methodsdoi:10.1038/nmeth.1421
coverslip. Alternately, the ‘near-TIR’ method imaged deeper objects while still providing lower backgrounds than normal illumination. FRET efficiency ratio was not affected by the inten-sity of the excitation light or position in an evanescent wave. Supplementary Video 1 is ‘near-TIR’ and the microinjector tip is visible above the cell, whereas Supplementary Video 2 is TIR and the microinjector tip is not visible.
Fluorescence emission collected by the objective was split into donor and acceptor spectral ranges with a Dualview (Photometrics; with 645dcxr mirror and filters: donor-HQ585/70m, acceptor- HQ700/75m; Chroma) and recorded with a Cascade 512B electron-multiplying charge-coupled device (emCCD) camera (Roper Scientific). In analysis, 7% leakage of donor signal into the acceptor channel was subtracted.
Differential interference contrast (DIC) optics were used to image cellular structures. The polarizer between the objective and the camera required for DIC was removed for fluorescence imaging. A heated sample stage maintained cells at 37 °C during imaging on the microscope. Imaging at room temperature (21 °C) increased cellular autofluorescence.
Microinjection. We microinjected proteins at ~10–100 nM using a Femtojet (Eppendorf) while observing cells in place on the microscope under DIC imaging. The injection volume was estimated at 1–10% of the cell volume by comparing the total fluorescence intensity of cells injected with known dye concen-trations to the intensity of single dyes. All proteins were injected in solutions containing 50 mM Tris, 150 NaCl (pH 7.4), 1 mM DTT, except for SN29NN, which was injected in the same buffer including ~50–75 mM urea (remaining after dilution from the stock containing high urea to maintain protein solubility).
Typically, a cell was selected based upon its flat, isolated appear-ance in a DIC image and its relatively low autofluorescence under green laser illumination. The initial imaging to choose cells typi-cally involved 10–60 s of laser exposure, which could bleach some autofluorescence background. This prebleaching was not required for smFRET measurements in many cells. An initial DIC image was acquired for the selected cell. Cells were then microinjected under DIC illumination to ensure proper filling and then the green laser was turned on 2–5 s after injection. Movies were recorded with 100-ms exposures during and after injection. DIC images were reacquired at the end to verify cell morphology after microinjection.
Success of injection by an experienced operator was highly probable using the Femtojet, so often injections were performed with only green laser light illuminating the cells. Experiments in Supplementary Videos 1–3 were performed with such green illumination active during injection.
Data analysis. We used custom software to identify localized peaks in either the donor or acceptor channels of the movies by requiring the mean intensity of 9 pixel areas to be 3–8 times above the s.d. of the background. The threshold was adjusted on a cell-by-cell basis for reliable identification and verified by eye. The identified spots were mapped to the complementary donor or acceptor channel, background was subtracted (calculated pixel by pixel using the mean value of the 16 pixels surrounding a 3 × 3 pixel region of interest) and intensity timecourses were extracted. A FRET histogram (Fig. 1e) for single-molecule events occurring
in Supplementary Video 1 using SN25CC in BS-C-1 cells was assembled by accumulating the average FRET emission level for each molecule detected within 0.2 s (FRET < 0.5) and 1.0 s (FRET > 0.5) after injection. The different duty cycles yielded suf-ficient populations in both peaks. This FRET efficiency histogram was consistent with expectations from the structure of the SNARE complex26,27 and in vitro smFRET measurements18. Correcting the areas under the two Gaussian-shaped peaks near FRET efficiencies of 0 and 1 by the duty cycle of detection yielded percentage of high FRET (%highFRET) from this cell to be 22%, consistent with the values reported in Figure 2c for many more cells.
Single molecules were confirmed by the emission levels as well as single-step transitions at the beginning and end of events. The presence of anticorrelated intensity jumps of the donor and acceptor intensities (where the acceptor dye emission vanishes owing to bleaching and the donor dye emission rises simultaneously) con-firmed smFRET interactions (Fig. 1c–d and Supplementary Fig. 2). However, many high-smFRET events did not show this anticorre-lation. Commonly, high acceptor emission would commence and end abruptly without donor emission (Supplementary Fig. 2g,h). Because the acceptor bleached faster than the donor in our sys-tem, this observation suggests fast SNAP-25 and SNAP-29 binding and unbinding. Molecules with low FRET emission, indicative of membrane localization without SNARE complex formation, typically did not show such transient binding (Supplementary Videos 1–3).
To compare the efficiency of generating high-smFRET events across different proteins and different injections of multiple cells, we analyzed data as fractions (%highFRET) of the number of high-FRET events (#highFRET, FRET > 0.7) divided by the sum of #highFRET and low FRET (#donorOnly, FRET < 0.7) events (%highFRET = 100 × #highFRET / (#highFRET + #donor Only)) for each of the first ten frames after an injection during a 10 Hz movie. Those ten values of %highFRET accumulated for around ten cells were assembled into histograms (Fig. 2c–f and Supplementary Fig. 3) for the different combinations of proteins and cells used. The averages of these datasets are compared in Supplementary Table 1. This quantity represents the amount of high FRET resulting from SNARE complex formation relative to the total amount of protein injected.
Details of single-particle tracking and residence time analyses are available in the Supplementary Note.
Control experiments. Injections of protein-free buffer resulted in occasional ‘false positive’ events in the donor channel, but no high smFRET events were observed as spots in the acceptor channel.
To test whether high-smFRET signals resulted from aggregation of dye-labeled proteins, we prepared donor-only and acceptor-only SNAP-25 by labeling a construct containing only one label site (K76C) with Alexa Fluor 555 or Alexa Fluor 647 (SN25C). Equal concentrations of the donor-only and acceptor-only SNAP-25 were mixed and microinjected into BS-C-1 cells as described above. No high smFRET events were detected when we used these mixtures for experiments (n = 14 cells; Supplementary Table 1 and Supplementary Fig. 3g).
To examine the effects of the illumination protocol or the injection on the cells, we conducted multiple microinjections of the same cell. Using the standard protocol above, BS-C-1 cells
© 2
010
Nat
ure
Am
eric
a, In
c. A
ll ri
gh
ts r
eser
ved
.

nature methods doi:10.1038/nmeth.1421
were injected with double-labeled SN25CC, and a dataset was acquired. Then 2 min of green laser illumination was used to bleach the injected dye. After bleaching, a second injection was performed on the same cell and a new dataset was acquired. The two datasets were analyzed for %highFRET and histograms of the first and second injection were similar, with average values of 13.6 and 13.7, respectively (Supplementary Fig. 5), which was also similar to the average value of the initial SN25CC study (Fig. 2c). The %HighFRET from PC-12 cells under the same double injec-tion and photobleaching protocol also did not change appreciably. This result demonstrates that the laser exposure and micro-injections did not substantially alter the behavior of SNAP-25 in the cells.
Assessing effectiveness of additives for improving dye lifetime in vivo. We used additives in our imaging solutions common in in vitro single-molecule fluorescence studies to improve dye life-time and stability. To quantify their effect inside cells, we used fluorescently labeled polystyrene beads. Amino-polystyrene microspheres (0.1 µm; Polysciences) were labeled with NHS–Alexa Fluor 647 per manufacturer’s instructions at densities of near 50 dyes per bead. Labeled microspheres were diluted in buffer (50 mM phosphate and 150 mM NaCl (pH 7.4)), sonicated and microinjected into BS-C-1 cells. The beads were brighter than single dyes and diffused more slowly, which simplified tracking and analysis of photobleaching rates.
We measured photobleaching of microsphere-attached Alexa Fluor 647 inside cells with media additives. Fluorescence-free medium with 2 mM Trolox25,28 and 200 µM cyclooctatetraene was added to cells 4 h before imaging. Just before imaging, 240 µg ml−1 glucose oxidase (Sigma), 50 µg ml−1 catalase (Sigma) and 2%
glucose were also sometimes added to the medium. Fluorescence of Alexa Fluor 647 was directly excited using objective-type near-TIR with 1.5 mW of 635 nm laser light, observed through a 650 nm long-pass filter and recorded with an emCCD. The beads were tracked in the 10 Hz movies by custom software and background subtracted intensity timecourses were extracted (Supplementary Fig. 6). The decay of the fluorescence intensity was fit to single exponentials and the average of the time constants for multiple tracked beads in several cells was plotted (Supplementary Fig. 6). An improvement of a factor of 4 in lifetime of dyes in the cell interior was achieved with combinations of the additives in the external medium.
16. Bowen, M.E., Weninger, K., Brunger, A.T. & Chu, S. Biophys. J. 87, 3569–3584 (2004).
17. Bowen, M.E., Weninger, K., Ernst, J., Chu, S. & Brunger, A.T. Biophys. J. 89, 690–702 (2005).
18. Weninger, K., Bowen, M.E., Choi, U.B., Chu, S. & Brunger, A.T. Structure 16, 308–320 (2008).
19. Steegmaier, M. et al. J. Biol. Chem. 273, 34171–34179 (1998).20. Su, Q., Mochida, S., Tian, J.H., Mehta, R. & Sheng, Z.H. Proc. Natl. Acad.
Sci. USA 98, 14038–14043 (2001).21. Li, Y., Augustine, G.J. & Weninger, K. Biophys. J. 93, 2178–2187 (2007).22. Boukobza, E., Sonnenfeld, A. & Haran, G. J. Phys. Chem. B 105, 12165–
12170 (2001).23. Roy, R., Hohng, S. & Ha, T. Nat. Methods 5, 507–516 (2008).24. Stuurman, N. & Vale, R. in Live Cell Imaging: A laboratory manual (eds.
Goldman, R.D. & Spector, D.L.) 585–602 (Cold Springs Harbor Laboratory Press, Woodbury, 2005).
25. Cordes, T., Vogelsang, J. & Tinnefeld, P. J. Am. Chem. Soc. 131, 5018–5019 (2009).
26. Sutton, R.B., Fasshauer, D., Jahn, R. & Brunger, A.T. Nature 395, 347–353 (1998).
27. Brunger, A.T. Q. Rev. Biophys. 38, 1–47 (2005).28. Rasnik, I., McKinney, S.A. & Ha, T. Nat. Methods 3, 891–893 (2006).
© 2
010
Nat
ure
Am
eric
a, In
c. A
ll ri
gh
ts r
eser
ved
.


![Conformation of Amino Acid Side-chains in Proteins0].pdf · J. Mol. Biol. (1978) 125, 357-386 Conformation of Amino Acid Side-chains in Proteins Unit& de Biochimie Cellulaire, DLpartement](https://img.pdfslide.net/doc/110x75/5ec8bcfae43631454d3b56dd/conformation-of-amino-acid-side-chains-in-0pdf-j-mol-biol-1978-125-357-386.jpg)