Embed Size (px)
Citation preview
DETECTION OF ADULTERATION OF FAT IN MILK USING SPECIALLY DESIGNED DUAL PURPOSE
GERBER BUTYROMETER
THESIS SUBMITTED TO THE
NATIONAL DAIRY RESEARCH INSTITUTE, KARNAL
(DEEMED UNIVERSITY)
IN PARTIAL FULFILMENT OF THE REQUIREMENTS
FOR THE AWARD OF THE DEGREE
MASTER OF TECHNOLOGY IN
DAIRY CHEMISTRY
BY
RATHOD GOPAL HARISHCHANDRA B.Tech (DT)
DAIRY CHEMISTRY DIVISION
NATIONAL DAIRY RESEARCH INSTITUTE (I.C. A. R.)
KARNAL-132001 (HARYANA), INDIA
2012
Regn. No. 2021001

Dedicated
To
My Beloved Parents
&My Guide
ACKNOWLEDGEMENT
I take this opportunity to express my profound sense of gratitude to my major advisor Dr. Darshan Lal, Principal Scientist in DC Division for his novel ideas, valuable advice, able guidance and encouragement during the course of this investigation. His faith in my knowledge and hard work made this work a challenging and enjoyable experience. Every niche of this investigation is a beautiful conglomeration of ideas, appreciation and amalgamation of rich concepts borrowed from the members of advisory committee Dr. Raman Seth, Dr. Vivek Sharma, Dr. S. K. Kanawjia and Dr. D. K. Thompkinson.
I feel honored while extending my gratefulness to Dr. A. K. Shrivastava, Director, NDRI, Dr. G. R. Patil, Joint Director (Academics) and Dr. S. L. Goswami, Joint Director (Research), NDRI for providing the necessary infrastructural facilities to conduct this study. I am deeply indebted to all the Scientists of the Dairy Chemistry Division, for their valuable suggestions, good wishes and cordial assistance during my study and research at NDRI.
I am immensely grateful to my lab mates Neelam mam, Anil sir, and Prashant for their valuable support during my entire research work. I would like to elicit the gesture of indebtedness to Nilu sir, Aakash bhai, Santosh sir, Rahul sir, Sonam mam, Meenakshi mam, Ankit sir, and Prabhakar Sir, for helping me affectionately from time to time with their kind and humble thoughts.
My deep sense of gratitude and warm regards to Jagatji, Kulvinderji, Balwantji, Ingleji, Rajivji, Yadavji, Deepakji and Shakuntala mam for their help and co-operation extended during the course of this study. I thank all my friends Samriddhi, Vaibhao, Somnath, Ambar, Vivek, Shashank, Prashant, Pranoti, Prachi, Snehal, Siddhartha,

Shreyash, and Seniors who always let me an empathetic ear and was more than willing to help me and the good times spent with all of them remain unforgettable.
I shall cherish my association and support rendered by my juniors Saurabh, Suvartan, Pankaj, Jagdish, Shailesh and Mukesh for their Unending support and moral boosting is always remembered.
My Aai, Baba, Jijaji & my big brother are the earthy Gods in my life who deserve much more than what I can weigh in words. Their silent prayers, aesthetic love and affection, support and steel belief in my capabilities have enabled me to make this endeavor a successful one. Support and love rendered by my sisters Megha, Sindhu, Pratibha and Seema can’t be forgotten.
Above all, I wish to acknowledge the almighty GOD without whose blessing; this would have never a success.
Date: June, 2011
Place: Karnal Gopal H. Rathod

, , , औ । औ । , औ , औ
, ।
, ,
( , औ ) औ ( , ,
) । , ( .
. .) , ( . . .) , औ
. . . । . . . , . . . । , . . .
। . . . । , ( औ
, 20% ) . . . औ . . . । , । , । ,
, 1.083 ।
(5% औ )। , 20% (15% )। 20% (10% )। । औ (5 औ 10%) . . .
5 ,
औ 10% ( ) ।
, ।
, । ,
, , , । ,
।
ABSTRACT
Milk is considered as a nutritionally complete food and it is a natural source that contains high quality nutrients needed for good health. A rapid growth in demand for milk and milk products has led to the adulteration of milk. Earlier, mostly ghee used to be adulterated with foreign oils and fats, but there are some reports of addition of foreign fats and oils directly into milk, as generally milk is sold on the basis of its fat content. Therefore, the present project was undertaken to detect of adulteration of fat in milk using specially designed dual purpose Gerber butyrometer, using three vegetable oils (groundnut, soybean and sunflower oil) and three body fats (goat, buffalo and sheep body fat) as adulterants. For this study, four tests such as Apparent Solidification Time (AST) test, Complete Liquefaction Time (CLT) test, Butyro–refractometer (BR) reading at 40°C and thin layer chromatography of unsaponifiable matter were planned to be undertaken. While standardizing the AST test to be applied on Gerber butyrometer fat column, it was observed that there were problems of very large variations in the AST values among the samples as well as among the butyrometers for the same sample. Therefore, this part of the study on AST test was not continued further for its application. During CLT test also large variations among the samples were observed. Moreover, it was observed that 70-90% of all the milk samples adulterated with the three vegetable oils and three body fats individually (@ 20% level on fat basis) were within the limits of CLT values of pure cow and buffalo milks and failed to be detected. Therefore, it was concluded that this test cannot be recommended to be used for screening the milk for milk fat purity. The results on the BR readings obtained by Gerber butyrometer method were found to be lower than those obtained by heat clarification method. Therefore, in order to directly get the correct BR reading using Gerber butyrometer method, a correction factor of 1.083 was developed. After correcting the BR reading of fat isolated from milk by Gerber butyrometer method, adulteration of cow milk with vegetable oils was detectable at all the adulteration levels studied, except groundnut oil and sunflower oil at 5% level of adulteration (on fat basis). However, adulteration of cow milk with animal body fats was not detectable below 20 % level of adulteration (on fat basis), except pig body fat which was detectable even at 15% level. Adulteration of buffalo milk with vegetable oils was not detectable below 20 % level of adulteration (on fat basis) except soy bean oil which was detectable even at 10% level. Adulteration of buffalo milk with animal body fats was not detectable at all the levels studied. TLC of unsaponifiable matter extracted from heat clarified fat obtained from pure buffalo milk and buffalo milk adulterated with vegetable oils (5 and 10%) revealed that on the basis of additional bands matching with the tocopherols, as low as 5% adulteration of milk (on fat basis) with soy bean oil and 10% adulteration of milk (on fat basis) with groundnut oil and sunflower oil could be detected easily. The study on the effect of addition of formalin on BR reading of milk fat revealed that there was not much change in the BR reading of the fat whether obtained by Gerber butyrometer method or heat clarification method for the pure as well as adulterated milk samples. When the formalin preserved milk samples were stored for three months, it was observed that there was no change in the BR reading of heat clarified fats. However, in case of Gerber butyrometer method, upto one month of storage no change in the BR reading was observed, but after two months of storage, difficulty in the fat isolation was encountered. Therefore, for formalin preserved milk samples application of Gerber butyrometer method for recording the BR reading of isolated fat cannot be recommended.

Chapter
No.
Title Page No.
1.0 INTRODUCTION 1 – 3
2.0 REVIEW OF LITERATURE 4-29
2.1 METHODS OF DETECTION OF ADULTERATION APPLICABLE TO MILK FAT
5
2.1.1 METHODS BASED ON PHYSICAL PROPERTIES
5
2.1.1.1 Melting Point 5
2.1.1.2 Apparent solidification time (AST) test 6
2.1.1.3 Complete liquefaction (CLT) test 7
2.1.1.4 Crystallization time test 8
2.1.1.5 Bomer value 9
2.1.1.6 Butyro Refractometer (BR) Reading 9
2.1.1.7 Opacity Test 10
2.1.1.8 Critical Temperature of Dissolution (CTD)
11
2.1.1.9 Fractionation of Milk Fat 11
2.1.1.10 Spectroscopic Methods 13
2.1.1.11 Dilatation Behavior 15
2.1.1.12 Microscopic Examination of Fat 16
2.1.1.12 Differential Thermal Analysis (DTA) and Differential Scanning Calorimetry (DSC)
16
2.1.2 METHODS BASED ON CHEMICAL PROPERTIES
17
2.1.2.1 Tests based on fatty acids 17
2.1.2.2 Tests based on the nature and content of unsaponifiable constituents
20
2.1.2.3 Tests based on whole fat/triglycerides 22
2.1.3 METHODS BASED ON TRACER COMPONENTS OF FATS AND OILS
25
2.1.4 MISCELLANEOUS METHODS 26
2.1.4.1 Tests for mineral oils 26
2.1.4.2 Tests for cottonseed oils 26
2.1.4.3 Color based platform test for detection of vegetable oils/fats in ghee
27
2.2 METHODS OF DETECTION OF ADULTERATION APPLICABLE DIRECTLY TO MILK
28
CONTENTS
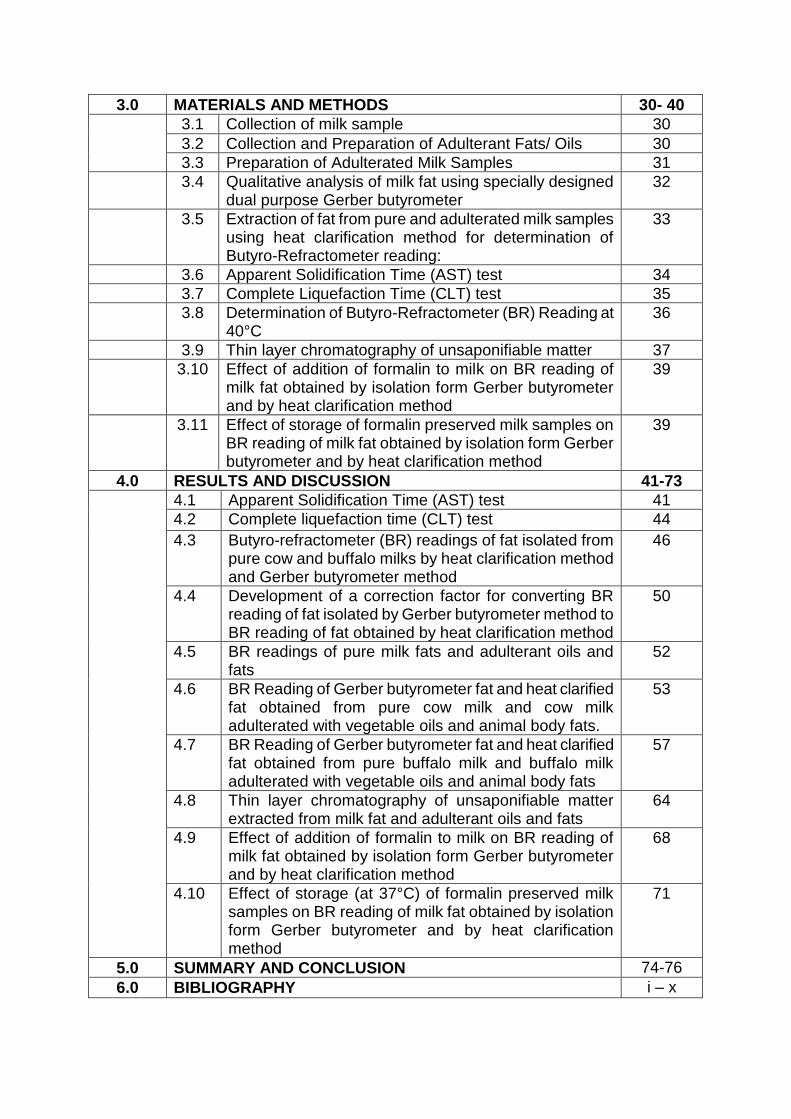
3.0 MATERIALS AND METHODS 30- 40
3.1 Collection of milk sample 30
3.2 Collection and Preparation of Adulterant Fats/ Oils 30
3.3 Preparation of Adulterated Milk Samples 31
3.4 Qualitative analysis of milk fat using specially designed dual purpose Gerber butyrometer
32
3.5 Extraction of fat from pure and adulterated milk samples using heat clarification method for determination of Butyro-Refractometer reading:
33
3.6 Apparent Solidification Time (AST) test 34
3.7 Complete Liquefaction Time (CLT) test 35
3.8 Determination of Butyro-Refractometer (BR) Reading at 40°C
36
3.9 Thin layer chromatography of unsaponifiable matter 37
3.10 Effect of addition of formalin to milk on BR reading of milk fat obtained by isolation form Gerber butyrometer and by heat clarification method
39
3.11 Effect of storage of formalin preserved milk samples on BR reading of milk fat obtained by isolation form Gerber butyrometer and by heat clarification method
39
4.0 RESULTS AND DISCUSSION 41-73
4.1 Apparent Solidification Time (AST) test 41
4.2 Complete liquefaction time (CLT) test 44
4.3 Butyro-refractometer (BR) readings of fat isolated from pure cow and buffalo milks by heat clarification method and Gerber butyrometer method
46
4.4 Development of a correction factor for converting BR reading of fat isolated by Gerber butyrometer method to BR reading of fat obtained by heat clarification method
50
4.5 BR readings of pure milk fats and adulterant oils and fats
52
4.6 BR Reading of Gerber butyrometer fat and heat clarified fat obtained from pure cow milk and cow milk adulterated with vegetable oils and animal body fats.
53
4.7 BR Reading of Gerber butyrometer fat and heat clarified fat obtained from pure buffalo milk and buffalo milk adulterated with vegetable oils and animal body fats
57
4.8 Thin layer chromatography of unsaponifiable matter extracted from milk fat and adulterant oils and fats
64
4.9 Effect of addition of formalin to milk on BR reading of milk fat obtained by isolation form Gerber butyrometer and by heat clarification method
68
4.10 Effect of storage (at 37°C) of formalin preserved milk samples on BR reading of milk fat obtained by isolation form Gerber butyrometer and by heat clarification method
71
5.0 SUMMARY AND CONCLUSION 74-76
6.0 BIBLIOGRAPHY i – x
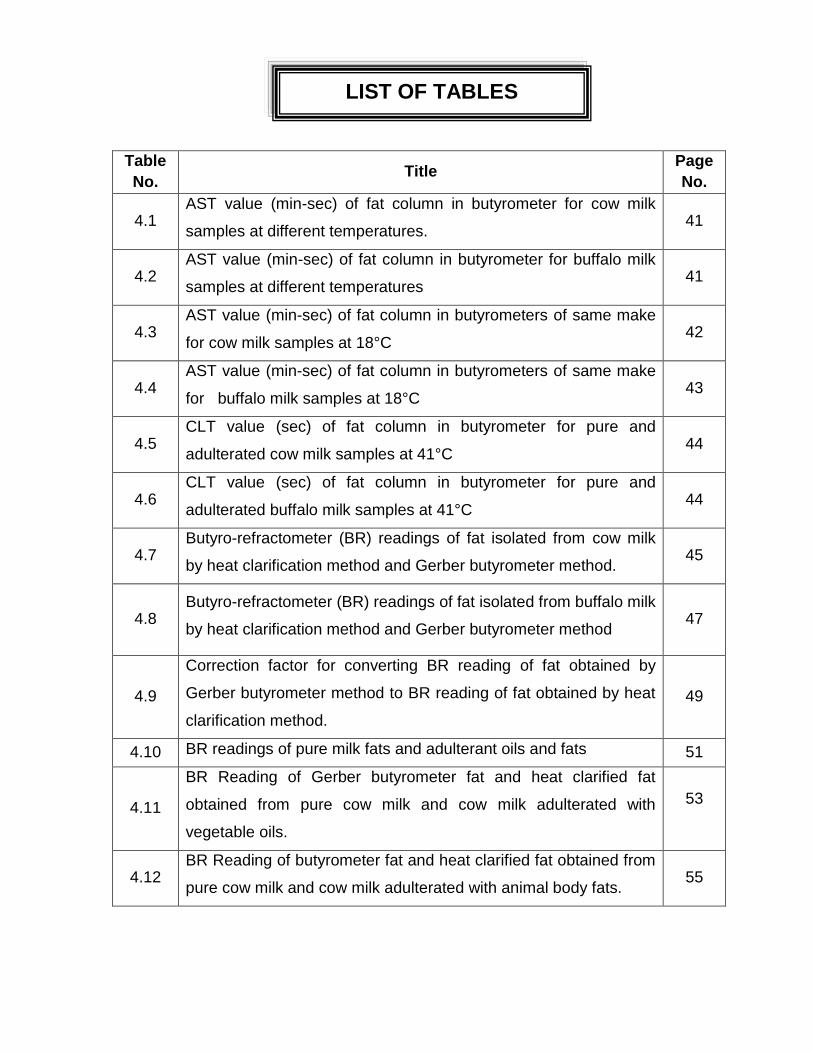
Table
No. Title
Page
No.
4.1 AST value (min-sec) of fat column in butyrometer for cow milk
samples at different temperatures. 41
4.2 AST value (min-sec) of fat column in butyrometer for buffalo milk
samples at different temperatures 41
4.3 AST value (min-sec) of fat column in butyrometers of same make
for cow milk samples at 18°C 42
4.4 AST value (min-sec) of fat column in butyrometers of same make
for buffalo milk samples at 18°C 43
4.5 CLT value (sec) of fat column in butyrometer for pure and
adulterated cow milk samples at 41°C 44
4.6 CLT value (sec) of fat column in butyrometer for pure and
adulterated buffalo milk samples at 41°C 44
4.7 Butyro-refractometer (BR) readings of fat isolated from cow milk
by heat clarification method and Gerber butyrometer method. 45
4.8 Butyro-refractometer (BR) readings of fat isolated from buffalo milk
by heat clarification method and Gerber butyrometer method 47
4.9
Correction factor for converting BR reading of fat obtained by
Gerber butyrometer method to BR reading of fat obtained by heat
clarification method.
49
4.10 BR readings of pure milk fats and adulterant oils and fats 51
4.11
BR Reading of Gerber butyrometer fat and heat clarified fat
obtained from pure cow milk and cow milk adulterated with
vegetable oils.
53
4.12 BR Reading of butyrometer fat and heat clarified fat obtained from
pure cow milk and cow milk adulterated with animal body fats. 55
LIST OF TABLES

4.13 BR Reading of butyrometer fat and heat clarified fat obtained from
pure buffalo milk and buffalo milk adulterated with vegetable oils 57
4.14
BR Reading of butyrometer fat and heat clarified fat obtained from
pure buffalo milk and buffalo milk adulterated with animal body
fats.
59
4.15
Effect of addition of formalin to cow milk on BR reading of milk fat
obtained by isolation from Gerber butyrometer and by heat
clarification method.
68
4.16
Effect of addition of formalin to buffalo milk on BR reading of milk
fat obtained by isolation from Gerber butyrometer and by heat
clarification method.
69
4.17
Effect of storage (at 37°C) of formalin preserved cow milk samples
on BR reading of milk fat obtained by isolation from Gerber
butyrometer and by heat clarification method
71
4.18
Effect of storage (at 37°C) of formalin preserved buffalo milk
samples on BR reading of milk fat obtained by isolation form
Gerber butyrometer and by heat clarification method.
72

Fig.
No. Title Page No.
3.1 Modified Gerber butyrometer 31
4.1 TLC of unsaponifiable matter of pure milk fat and adulterants
along with standards. 64
4.2 TLC of unsaponifiable matter of pure milk fat and vegetable
oils along with standards
65
4.3 TLC of unsaponifiable matter of pure milk fat and 5%
adulterated milk fats along with standards 66
4.4
TLC of unsaponifiable matter of pure milk fat and 10% adulterated
milk fats along with standards 66
LIST OF FIGURES
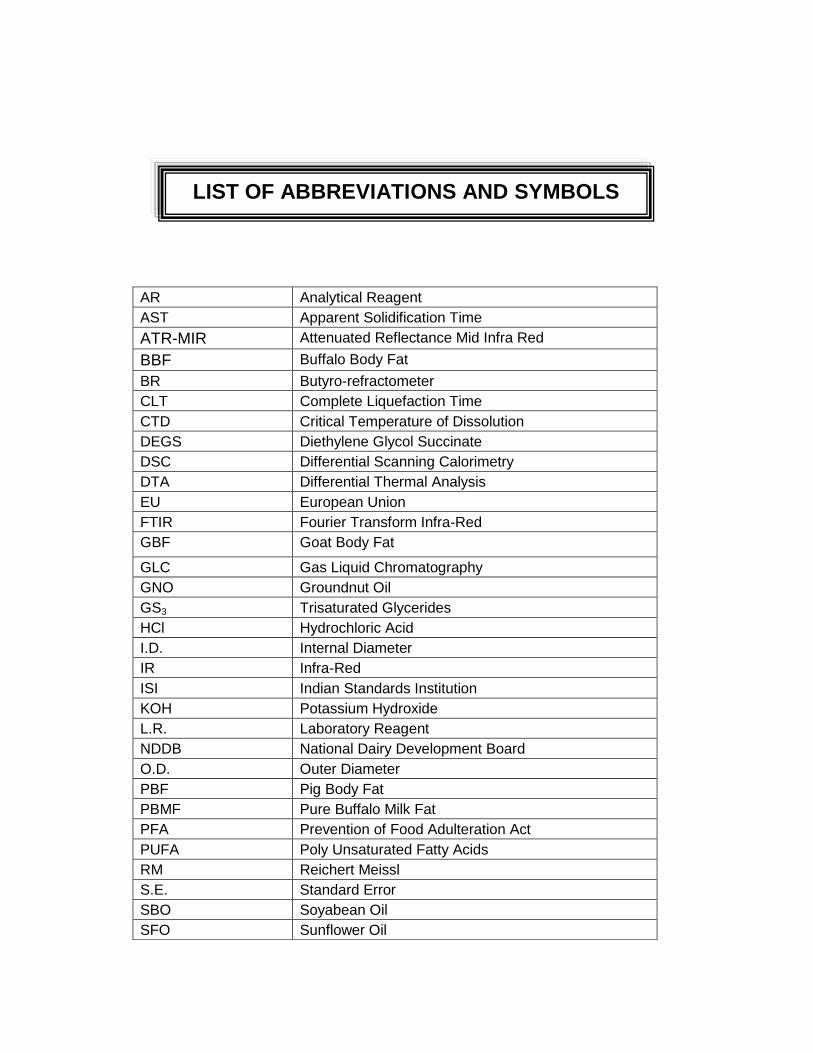
AR Analytical Reagent
AST Apparent Solidification Time
ATR-MIR Attenuated Reflectance Mid Infra Red
BBF Buffalo Body Fat
BR Butyro-refractometer
CLT Complete Liquefaction Time
CTD Critical Temperature of Dissolution
DEGS Diethylene Glycol Succinate
DSC Differential Scanning Calorimetry
DTA Differential Thermal Analysis
EU European Union
FTIR Fourier Transform Infra-Red
GBF Goat Body Fat
GLC Gas Liquid Chromatography
GNO Groundnut Oil
GS3 Trisaturated Glycerides
HCl Hydrochloric Acid
I.D. Internal Diameter
IR Infra-Red
ISI Indian Standards Institution
KOH Potassium Hydroxide
L.R. Laboratory Reagent
NDDB National Dairy Development Board
O.D. Outer Diameter
PBF Pig Body Fat
PBMF Pure Buffalo Milk Fat
PFA Prevention of Food Adulteration Act
PUFA Poly Unsaturated Fatty Acids
RM Reichert Meissl
S.E. Standard Error
SBO Soyabean Oil
SFO Sunflower Oil
LIST OF ABBREVIATIONS AND SYMBOLS

STG Saturated Triglycerides
TLC Thin Layer Chromatography
USM Unsaponifiable matter
UV Ultraviolet
% Percent
Infinite
< Less than
> Greater than and equal to
°C Degree centigrade
µ Micron
µl Microlitre
µm Micrometer
b.p. Boiling Point
C4:0 fatty acid Fatty acid with 4 carbon and no double bond
cm Centimeter
Cm-1 Wave Number
Fig. Figure
g Gram
L18 Liquid fraction obtained at 18°C
mµ Milli micron
Min Minute
ml Millilitre
mm Millimeter
N Normal
nm Nanometer
Rf Resolution factor
v/v Volume by volume
w/v Weight by volume

CHAPTER - 1
__________________
Introduction
───────────────

1 Introduction
1. INTRODUCTION
Milk and honey are the only diets whose sole function in nature is food. Milk
has been a significant source as a food for humans since the dawn of history. It is
considered as a nutritionally complete food and is a natural source that contains
high quality nutrients needed for good health. The nutrients present in milk are
proteins, lipids, lactose, minerals and vitamins. All the constituents of milk have
their own importance in providing energy and promoting human health and
growth. The natural function of milk proteins is to supply young mammals with the
essential amino acids required for the development of muscular and other
protein-containing tissues, and with a number of biologically active proteins, e.g.
immunoglobulins, vitamin-binding, metal-binding proteins and various protein
hormones. Lipids, a concentrated form of energy also serves as a source of
essential fatty acids and fat soluble vitamins (A, D, E, K). Lactose aids in brain
development, while minerals are important for enzyme activity, bone formation,
osmoregulation. Milk also contains water soluble vitamins (B complex vitamins
and ascorbic acid) which perform vital functions such as energy transfer and
regulation of metabolic activities in the body.
Today, India is ‘The Oyster’ of the global dairy industry. From a milk deficient
country in the early 1960s, India has emerged today as the largest milk producer
in the world with an annual production of 121.8 million tonnes according the latest
estimates for 2010-2011 (www.nddb.org/statistics/milkproduction.html). Milk
production in India serves three main sectors, viz., household sector, un-
organized sector and organized sector. The first two sectors account over 80% of
milk produced in India and remaining 20% is handled by the organized sector.
Almost 50% of the total milk produced is consumed in the form of liquid milk and
45% is converted into traditional products like butter, ghee, paneer, khoa, curd,
malai etc., and only 5% of the milk goes into the production of western products
like milk powder, cheese etc. The Indian dairy industry is rapidly growing and
trying to keep pace with the galloping progress around the world.
A rapid growth in demand for milk and milk products has led to the
adulteration of milk. The menace of adulteration has reached to an alarming
stage in recent years. Adulterants like water, salt, sugar, urea, hydrogen

2 Introduction
peroxide, pond water, wheat flour, baking soda, formalin and different vegetable
oils and animal body fats are used by unsocial elements. Some adulterants are
used for increasing the volume of milk, while others are used for increasing the
shelf life of milk. Adulteration is mostly motivated by economic greed. Either a
more expensive ingredient is substituted with cheaper one, or a valued
component is partially or fully removed in the hope that the consumer does not
notice the difference. One of such components of milk is milk fat. Milk fat being
the costliest edible fat increasingly catches the attention of the fraudulent people
for an easy adulteration with far cheaper oils and fats of vegetable and animal
origin. By adulterating the milk fat with animal body fats, the unscrupulous traders
are not only robbing the people of their money, but also playing with the religious
sentiments, especially of the vegetarian section of the society. Earlier mostly
ghee used to be adulterated with foreign oils and fats and accordingly several
methods were developed for the detection of adulterants in ghee. But there are
some reports of addition of foreign fats and oils directly into milk, as generally
milk is sold on the basis of its fat content.
Milk adulteration adversely affects the consumer health and also the dairy
industry. Fraudulent malpractices create unfair competition. This leads to market
distortions, which in turn may impact the local or even the international trade.
Therefore, authentication of milk and milk products through quality testing is
important to both consumers as well as processors. Several tests have been
developed for detecting adulteration in milk and milk products such as ghee.
Unfortunately, the tests which are applicable for detecting adulteration in ghee
cannot be directly applied to milk because milk is not a single phase emulsion;
rather it is an oil- in-water type emulsion. Therefore, the fat phase of milk has to
be separated from its aqueous phase before applying any test for checking the
adulteration of fat. Keeping in view the need of rapid test which can be applied to
milk for detecting adulteration right at platform where milk is either accepted or
rejected, a novel approach was suggested by Lal et al (1998) which involves
isolation of fat from milk using specially designed dual purpose modified Gerber
butyrometer followed by determination of BR reading of isolated fat. This
approach was based on testing mustard oil added to milk (Arora et al, 1996).
Subsequently the same approach was used for detecting cottonseed oil added to
3 Introduction
milk (Boghra and Borkhatriya, 2004). However, there is a lack of information
regarding detection of other vegetable oils and body fats added to milk
Hence, keeping these aspects in mind, the present research work was
contemplated with the following objectives:
1) Detection of different vegetable oils (groundnut oil, soybean oil and
sunflower oil) added individually to milk at various levels.
2) Detection of different body fats (buffalo body fat, goat body fat and pig body
fat) added individually to milk at various levels.

CHAPTER - 2
─────────────────────────
Review of Literature ─────────────────────────
4 Review of literature
2. REVIEW OF LITERATURE
Lipids form one of the most important constituents of milk and milk
products. Major part of milk lipids consists of triglycerides (generally called fats).
Minor components of milk lipids include partial glycerides (mono- and di-
glycerides), phospholipids, fat soluble vitamins, cholesterol, squalene, waxes,
etc. Milk lipids play an important role in the economics, nutrition, flavour and
physico-chemical properties of milk and milk products. In most of the pricing of
milk and milk products, milk fat plays a significant role. It is also the richest
source of energy, carrier of fat soluble vitamins and essential fatty acids. It plays
an important role in the flavour problems which are closely related to body,
texture and consumer acceptability.
Role of milk fat in pricing of milk and milk products as well as its variable
chemical composition coupled with the intention of the traders to increase the
margin of profit, encourages the adulteration of milk fat with the far cheaper fats
and oils of vegetable and animal origin. The commonly used adulterants are
vegetable oils and fats, animal body fats, mineral oils, starchy material, etc.
Earlier mostly ghee used to be adulterated with foreign oils and fats and
accordingly several methods were developed for the detection of adulterants in
ghee. These methods were based on differences in the nature and contents of
major/minor components of ghee and adulterant fats/oils. Now-a-days, a new
trend of addition of foreign fats/oils directly into milk has been gaining
momentum, as generally milk is sold on the basis of its fat content. Unfortunately,
the tests, which are applicable for detecting adulteration in ghee, cannot be
directly applied to milk because milk is not a single-phase emulsion. Rather, it is
an oil-in-water type emulsion. Therefore, the fat phase of milk has to be
separated from its aqueous phase before applying any test for checking the
adulteration of milk fat.
This review delineates the current status of our knowledge with regard to
the various methods commonly used for the detection of adulteration of milk fat
with foreign fats. Most of the methods available are applicable to ghee, whereas

5 Review of literature
very few are applicable to milk. Therefore, the literature in this respect is
reviewed under the following two heads:
1) Methods of detection of adulteration applicable to milk fat
2) Methods of detection of adulteration applicable directly to milk
2.1 METHODS OF DETECTION OF ADULTERATION APPLICABLE TO MILK
FAT
The information under this head is divided into following four sub-heads: -
1) Methods based on physical properties, 2) Methods based on chemical
properties, 3) Methods based on tracer components of fats and oils, and 4)
Miscellaneous methods.
2.1.1 METHODS BASED ON PHYSICAL PROPERTIES
Physical properties of oils and fats are important criteria for judging their
quality and have also been used to determine their authenticity. Several methods,
which were used to check the authenticity of ghee on the basis of physical
properties, are as follows.
2.1.1.1 Melting Point
Melting point (slip point) of various oils and fats varies over a wide range
and this property has been employed for checking the adulteration of milk fat.
Body fats (36-51.3°C) and vanaspati (37.8-38°C) have slightly higher melting
point (Winton and Winton, 1999) while vegetable oils (20-30°C) have slightly
lower melting point than milk fat (28-41°C) as reviewed by Kumar et al. (2002).
Singhal (1973) reported that buffalo milk fat (33.4-34.2°C) has slightly higher
melting point than cow milk fat (30.6-31.2°C) and ghee from cotton tract area
showed considerably higher melting point (43.0-44.0°C) which resembled with
6 Review of literature
that of animal body fats (43.9-51.0°C). The study, however, concluded that
adulteration up to 20 percent level did not introduce significant changes in the
melting point of ghee and, therefore, the method was not found useful for the
detection of adulteration. Sharma and Singhal (1995) also confirmed these
observations using body fats and vanaspati.
2.1.1.2 Apparent solidification time (AST) test
The AST test was developed by Kumar et al. (2009a) to detect adulteration
of milk fat with vegetable oils and animal body fats. The apparent solidification
time is determined by taking three grams of melted fat sample in test tube (10.0 X
1.0 internal diameter) to apparently become solidified at 18°C.
Studies conducted by Kumar et al. (2009a, 2010) on the solidification
behavior of various oils and fats including milk fat in terms of AST at the selected
temperature (18°C) have revealed that the average AST values for buffalo and
cow milk fat were 2 min 40 sec and 3 min 10 sec, respectively. The average AST
values of pig body fat, goat body fat and vanaspati were 1 min 30 sec, 40 sec
and 1 min 50 sec, respectively. On the other hand, all the vegetable oils studied
remained liquid for an indefinite period. Addition of vegetable oils caused an
increase in the AST values of buffalo and cow pure milk fat, whereas the addition
of body fats and vanaspati (hydrogenated vegetable oils) resulted in the decrease
in the AST values of buffalo and cow pure milk fat, depending on the amount of
adulterant oils and fats added. Taking into account the overall range of AST
values at 18°C pertaining to fresh, stored and seasonal samples of both buffalo
and cow pure milk fat as the criteria for the detection of adulteration, it was found
that the technique could detect the addition of individual vegetable oils at all the
levels in case of cow milk fat but not in buffalo milk fat. Adulteration of buffalo milk
fat with vanaspati (hydrogenated vegetable fat) was detectable at levels ≥10%,
but not in cow milk fat. Addition of goat body fat to both cow and buffalo milk fat
was detectable at levels ≥ 10%, whereas pig body fat was detectable only in
buffalo milk fat at levels ≥ 10%.

7 Review of literature
2.1.1.3 Complete liquefaction time (CLT) test
This test was developed by Amit Kumar (2008) to detect adulteration of
milk fat with foreign fats and oils. The complete liquefaction time (CLT) of the fat
samples was recorded by observing the time taken by the solidified fat samples
to get melted completely at a 44oC.
At 44oC, the CLT values of pure cow ghee samples ranged from 2 min 12
sec to 3 min 15 sec with the mean of 2 min 52 sec, while that of pure buffalo
ghee ranged from 2 min 35 sec to 3 min 15 sec with the mean of 2 min 57 sec.
There were large variation between CLT values of ghee samples collected over a
period of whole year both for cows and buffaloes. Further, it was observed that
both (cow and buffalo) type of ghee samples showed higher CLT values in the
summer months (May to September) and lower CLT values in the winter months
(November to March).
Addition of vegetable oils (palm, rice bran and soybean) caused a
decrease, whereas addition of body fats (buffalo, goat and pig) resulted in an
increase in the CLT values of cow and buffalo pure ghee at 44°C. This decrease
or increase observed in CLT values caused by the addition of adulterant oils/ fats
to ghee depended upon the amount of adulterants added. Higher the quantity of
adulterant added, greater was the effect. However, in case of ghee samples
containing body fats, samples with pig body fat showed slightly lower increase in
CLT values than the samples containing buffalo and goat body fats.
Taking into account the overall range of CLT values at 44oC, i.e. from 2
min 12 sec to 3 min 15 sec for pure ghee (cow and buffalo) as the criteria for the
detection of adulteration, a perusal of the results on CLT values of adulterated
ghee samples revealed that addition of vegetable oils individually at the levels of
5, 10 and 15 percent to either cow ghee or buffalo ghee was not detectable.
However, among animal body fats, buffalo and goat body fats in either of the
8 Review of literature
ghee were detectable at 10% level while pig body fat was detected only at higher
(15%) level of adulteration.
2.1.1.4 Crystallization time test
The Crystallization time test is defined as the time taken for the onset of
crystallization of milk fat at 170C when dissolved in a solvent mixture consisting of
Acetone and Benzene (3.5:1.0). Panda and Bindal (1998b) studied the
crystallization behavior at 17°C of fat dissolved in a solvent mixture of acetone
and benzene (3.5:1) and reported that ghee, ghee adulterated with body fats
(10%), and ghee adulterated with vegetable oils and fats (10% level) took 19 min,
3 to 15 min and 22 to 23 min, respectively to crystallize. They concluded from the
study that even low level adulteration of animal body fats and vegetable oils and
fats could be detected in ghee.
Kumar (2008) applied this test on samples of both cow and buffalo pure
ghee pertaining to whole of the year collected on bimonthly basis, as well as the
ghee samples added with adulterants (animal body fats and vegetable oils)
individually at 5, 10 and 15% levels. Crystallization time for the pure cow ghee
and pure buffalo ghee samples ranged from 6 min 50 s to 16 min 20 s and from 6
min 30s to 12 min 30 s with the mean of 11 min 4s and 8 min 42 s, respectively.
The crystallization time of ghee samples increased when the samples were
adulterated with vegetable oils (palm, rice bran and soybean) while it was found
to decrease for ghee samples adulterated with animal (buffalo and goat) body
fats. The extent of increase and decrease was dependent on the level of
adulteration with the vegetable oil and animal body fat, respectively. Higher the
level of adulteration, greater was the effect. The crystallization time was highest
in the month of May while it was lowest in July. Generally, crystallization time is
expected to be higher if the fat has more unsaturated fatty acid i.e. crystallization
time will be increased with the increase in BR reading and iodine value of the fat.
They concluded that the crystallization time test is a useful tool to detect addition
of animal body fats particularly, buffalo and goat body fat to milk fat at 5% level.
9 Review of literature
However, pig body fat could not be detected by this test when added to milk fat at
any of the levels studied. Using the same test, recently Sofia et al. (2010) also
observed that crystallization time of ghee adulterated with coconut oil @ 5% or
palm oil @ 10% was higher (20-34 min) than that of pure cow ghee (16-20 min)
and can be employed for detection.
2.1.1.5 Bomer Value
Bomer value is defined as the sum of the melting point of saturated
triglycerides (isolated by diethyl ether method) and twice the difference between
this melting point and that of the fatty acids obtained after the saponification of
these triglycerides. The Bomer value of both cow and buffalo ghee ranges from
63 to 64, whereas those of animal body fats, e.g., goat, sheep and buffalo ranges
from 68 to 69 and that of pig body fat from 75 to 76. Singhal (1980, 1987)
reported that the Bomer value of ghee increased on adulteration with body fats
even in the presence of vegetable oils, but not when vegetable oils alone were
added. The method could be used as a confirmatory test for the detection of pig
body fat in ghee. However, genuine cotton tract ghee which behaved similar to
adulterated ghee samples could not be sorted out by this test and hence may be
mistaken as adulterated ghee. Sharma and Singhal (1996) also successfully
applied this test for the detection of body fats (buffalo, goat and pig) and
vanaspati added to buffalo ghee at 20 percent level, irrespective of mode of
adulteration either directly to ghee or through milk.
2.1.1.6 Butyro Refractometer (B.R.) Reading
The values for B.R. readings of milk fat (40-45) and vegetable oils and fats
(above 50) are so wide apart (Singhal, 1980; Gunstone et al., 1994) that this
property could be safely employed as an index for milk fat adulteration with
vegetable oils and fats, except coconut oil (35-39) and palm oil (39-40). Feeding
of cottonseed oil raises the B.R. by 5 units in case of ghee (Rangappa and
Achaya, 1974). The B.R. readings of animal body fats are in the range of 44 to 51

10 Review of literature
(Singhal, 1980). Adulteration of milk fat with animal body fats (Singhal, 1973;
Sharma and Singhal, 1995) and vanaspati (Sharma and Singhal, 1995) at a level
of 5 to 20 percent increased its B.R. readings. Recently, some workers (Arora et
al., 1996; Lal et al., 1998) have developed a simple platform test for the detection
of vegetable oil (refined mustard oil) added to milk at a level higher than 10
percent of the original fat on the basis of increase in B.R. reading of the fat. Arun
Kumar (2003) reported that using general limit of B.R. reading as 40-43,
adulteration of vegetable oil up to 5% in cow ghee and 15% in buffalo ghee can
be detected. Amit Kumar (2008) noticed that the adulteration of ghee with animal
body fat up to 15% level studied could not be detected by using B.R. reading.
2.1.1.7 Opacity Test
Singhal (1980) developed an opacity test to detect the adulteration of ghee
with animal body fats, based on the time taken by the melted fat sample to
become opaque (O.D. 0.5) at 23°C using 590 nm (yellow) filter and observed
that the normal ghee took more than 35 minutes, whereas animal body fats
(buffalo, goat and sheep) took only 10 to 20 seconds to become opaque. He
concluded that the adulteration with buffalo, goat and sheep body fats at 5
percent level and above could be safely detected by opacity test. However, the
limitations of this test are that the detection of pig body fat up to 10 percent level
is difficult and ghee from cotton tract area also cannot be distinguished. Test also
fails to detect the body fats in ghee in the presence of vegetable oils (Singhal,
1987). Sharma and Singhal (1996) carried out the opacity test at 25°C for pure
fats (ghee, body fats and vanaspati) and adulterated ghee samples (5, 10 and
20% level) and observed almost the similar results as reported earlier by Singhal
(1980). Panda and Bindal (1998a) also studied the opacity profile of pure ghee
and adulterants using the opacity test given by Singhal (1980), but with certain
modifications. They recorded the opacity time as the time required by a fat
sample at 23°C to acquire the O.D. in the range of 0.14 to 0.16 and consequent
transmittance of 68 to 72 showing the onset of solidification of fat. They reported
that the opacity time of pure ghee (14-15 min) was much higher than that of ghee
adulterated with animal body fats (2-9 min at 10% level and 3-11 min at 5% level

11 Review of literature
of adulteration) and much lower than that of ghee adulterated with vegetable oils
(21-25 min at 10% level and 19-21 min at 5% level of adulteration).
2.1.1.8 Critical Temperature of Dissolution (CTD)
Critical temperature of dissolution (temperature at which turbidity appears
on gradual cooling of the fat dissolved in a warm solvent or solvent mixture) is a
characteristic of a particular fat (Rangappa and Achaya, 1974; Boghra et al.,
1981). Bhide and Kane (1952) observed the CTD values for ghee and vanaspati
in the range of 39 to 45°C and 62 to 72°C, respectively, employing a 2:1 (v/v)
mixture of 95 percent ethanol and iso-amyl alcohol, and reported that gross
adulteration of ghee with vanaspati could easily be detected. Similarly, the
presence of body fats in ghee was detected by employing either a single solvent
such as absolute alcohol (Delforno, 1964) or a solvent mixture of 95 percent ethyl
alcohol and iso-amyl alcohol in 2:1 (Bhide and Kane, 1952). Likewise, CTD was
used for distinguishing oleo margarine from butter by Felman and Lepper (1950),
using 95 percent ethyl alcohol and iso-amyl alcohol (2:1) as solvent and detection
of mineral oils in milk fat by Kane and Ranadive (1951) using aniline. The CTD
test seems to be simple, but its efficacy is greatly affected by the free acidity
(FFA) and rancidity (peroxides). Arun kumar (2003), using solvent mixture (ethyl
alcohol and iso-amyl alcohol in 2:1), reported that adulteration of ghee up to 15%
level with vegetable oils, vanaspati and body fats could not be detected by CTD
value.
2.1.1.9 Fractionation of Milk Fat
Fractionation of fat with or without the use of solvent under suitable
conditions of time and temperature combinations, followed by examination of
fractions thus obtained has been exploited by some workers as a tool to detect
foreign fats in milk fat. Different solvents that have been used for fractionation
purpose include ethyl alcohol, acetone, hexane, isopropyl alcohol and 2-nitro
propane. Bhalerao and Kummerow (1954) separated the fat into solid (30%) and

12 Review of literature
liquid (70%) fractions after dissolving it in the hot absolute alcohol and
maintaining the same at 20°C for 2 hours. The insoluble fraction was further
fractionated using acetone at 0°C and keeping it overnight in order to increase
the concentration of adulterant in one of these fractions. The acetone soluble
fraction was iodinated and subsequently subjected to refractive index
measurement. Using this method, the presence of foreign fats at 10 percent level
could be detected. Arumughan and Narayanan (1979) fractionated the buffalo
and cow ghee at 29°C/3 days and reported that solid fraction of ghee differed
from the liquid fraction and from whole ghee in physico-chemical characteristics
and fatty acid composition. Similar observation was made by Arora and Rai
(1997) on goat ghee. Farag et al. (1983) carried out the fractional crystallization
of fat (pure and adulterated ghee samples) dissolved in silver nitrate-saturated
methanol/ acetone (70:30) in a ratio of 1:10 at 22, 7 and –8°C and the three
fractions obtained were subjected to GLC for their fatty acid profile. They reported
that for detecting adulteration, 18:0 and 18:1 fatty acids are of great importance in
first fraction, where as 22:0 is important in second and third fraction.
Arun Kumar (2003) reported that fractionation of milk fat into solid and
liquid fraction did not offer any extra help using BR. reading. However, using
apparent solidification time (AST) test, fractionation technique could extend help
in the detection of adulteration of cow ghee especially with the mixtures of goat
body fat with vegetable oils even at 5% level, which otherwise was not possible in
the un-fractionated ghee samples. According to Amit Kumar (2008), solvent
fractionation offered help in lowering the detection limit of adulteration in terms of
iodine value of last liquid fraction. He also reported that complete liquification time
(CLT) test can help considerably to detect the adulteration in ghee especially at
44°C without fractionation. However fractionation technique has offered further
advantage in lowering the detection limits particularly when the CLT is done at
46°C which otherwise could not be possible without fractionation, when mixture
(body fats and vegetable oils) is added.

13 Review of literature
2.1.1.10 Spectroscopic Methods
Spectroscopic methods using visible (400-800 mµ), ultraviolet (200-400
mµ) and infrared (2-15 µ) regions have been used by many workers for
characterizing fats and oils.
2.1.1.10.1 Tests Based on Visible Spectroscopy
Jha (1981) applied this technique for the detection of Cheuri (Madhuca
butyracea) fat in ghee, a common adulterant in Nepal. Pure ghee showed no
absorption band in visible range (600-700 nm), whereas Cheuri fat showed an
absorption band with maxima between 640 and 680 nm. Even 5 percent Cheuri
fat content added to ghee could be detected in this range.
2.1.1.10.2 Tests Based on Ultraviolet (UV) Spectroscopy
UV absorption spectroscopy has been applied for characterizing the
various oils and fats including milk fat. Singhal (1973) and Sharma (1989)
scanned the UV spectra of cow ghee, buffalo ghee and animal body fats (buffalo,
goat, pig and sheep) between 200 to 320 nm after dissolving the fats in n-hexane
and observed a maximum absorption between 220 to 230 nm. However, cow
ghee showed another small maximum at 270 nm. These workers also examined
the UV spectrum of unsaponifiable matter extracted from ghee and animal body
fats between 200 to 320 nm and observed an absorption maxima between 215 to
220 nm. The ghee samples showed a second maxima at 270 nm, which was
shifted to 260 nm (Singhal, 1973) or to 280 nm (Sharma, 1989) in case of animal
body fats. However on this basis, adulterated ghee could not be differentiated
from pure ghee (Sharma, 1989; Kumar, et al., 2010)
14 Review of literature
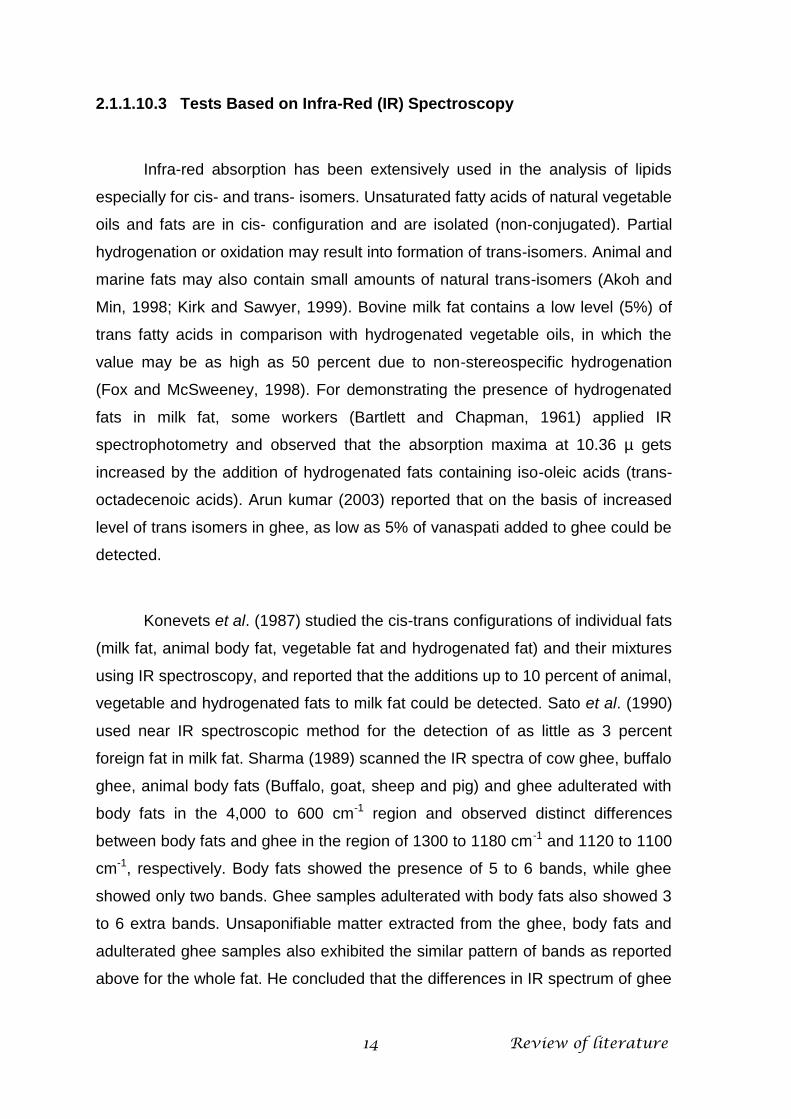
2.1.1.10.3 Tests Based on Infra-Red (IR) Spectroscopy
Infra-red absorption has been extensively used in the analysis of lipids
especially for cis- and trans- isomers. Unsaturated fatty acids of natural vegetable
oils and fats are in cis- configuration and are isolated (non-conjugated). Partial
hydrogenation or oxidation may result into formation of trans-isomers. Animal and
marine fats may also contain small amounts of natural trans-isomers (Akoh and
Min, 1998; Kirk and Sawyer, 1999). Bovine milk fat contains a low level (5%) of
trans fatty acids in comparison with hydrogenated vegetable oils, in which the
value may be as high as 50 percent due to non-stereospecific hydrogenation
(Fox and McSweeney, 1998). For demonstrating the presence of hydrogenated
fats in milk fat, some workers (Bartlett and Chapman, 1961) applied IR
spectrophotometry and observed that the absorption maxima at 10.36 µ gets
increased by the addition of hydrogenated fats containing iso-oleic acids (trans-
octadecenoic acids). Arun kumar (2003) reported that on the basis of increased
level of trans isomers in ghee, as low as 5% of vanaspati added to ghee could be
detected.
Konevets et al. (1987) studied the cis-trans configurations of individual fats
(milk fat, animal body fat, vegetable fat and hydrogenated fat) and their mixtures
using IR spectroscopy, and reported that the additions up to 10 percent of animal,
vegetable and hydrogenated fats to milk fat could be detected. Sato et al. (1990)
used near IR spectroscopic method for the detection of as little as 3 percent
foreign fat in milk fat. Sharma (1989) scanned the IR spectra of cow ghee, buffalo
ghee, animal body fats (Buffalo, goat, sheep and pig) and ghee adulterated with
body fats in the 4,000 to 600 cm-1 region and observed distinct differences
between body fats and ghee in the region of 1300 to 1180 cm-1 and 1120 to 1100
cm-1, respectively. Body fats showed the presence of 5 to 6 bands, while ghee
showed only two bands. Ghee samples adulterated with body fats also showed 3
to 6 extra bands. Unsaponifiable matter extracted from the ghee, body fats and
adulterated ghee samples also exhibited the similar pattern of bands as reported
above for the whole fat. He concluded that the differences in IR spectrum of ghee

15 Review of literature
and body fats could be used to detect ghee adulteration with body fats at 10
percent level.
Koca et al., (2010) studied temperature-controlled attenuated total
reflectance-mid-infrared (ATR-MIR) spectroscopy combined with multivariate
analysis as a simple and rapid method for the determination of butter adulteration
as a dairy food system. Commercial samples of butter fat were adulterated with
margarine fat at levels ranging from 0% to 100% (v/v). Partial least square
regression (PLSR) models gave standard error of cross-validation (SECV) of
<1.2% (v/v) and correlation coefficients (r) > 0.99. Excellent predicting capabilities
were obtained using an external validation set consisting of butter adulterated
with margarines at ratios of 2.5%, 13%, and 45%. Additionally, infrared
spectroscopy provided distinctive bands that allowed discrimination of butter and
margarine samples by forming well separated clusters for the different products
evaluated.
2.1.1.11 Dilatation Behavior
This property is based on the thermal expansion behavior of milk fat.
Using this property, Kalsi (1984) reported different solid and liquid fractions of
milk fat from different species in the temperature range of 10 to 80°C and
observed that solid and liquid fractions in equal proportions are obtained at 33, 30
and 24.5°C in case of buffalo, cow and goat milk fats, respectively. Kumar, et al.
(2007) applied this method for detection of adulteration in ghee. He studied the
proportion of solid and liquid fractions of pure and adulterated ghee at 5, 10 and
15% level and observed that the ratio of solid to liquid fraction for pure cow and
buffalo ghee was 2.37 and 3.10 respectively. On the basis of solid/liquid ratio, it
was found that vegetable oils could be detected in cow ghee while body fats and
vanaspati could be detected in buffalo ghee even at 5% level.

16 Review of literature
2.1.1.12 Microscopic Examination of Fat
Microscopic examination of the sterol crystals (Den Herder, 1955; IDF,
1965; BIS, 1981) has also been employed in the detection of adulteration of milk
fat with the foreign fats especially vegetable fats. If the sterol crystals only show
the form of a parallelogram with an obtuse angle of 100°, which is characteristic
for cholesterol, the fat sample is considered to be free from vegetable fat.
However, if the sterol crystals show the elongated hexagonal form with an apical
angle of 108°, which is characteristic for phytosterols, or if some of the sterol
crystals have a re-entry angle (Swallow’s tail), which is characteristic for mixtures
of cholesterol and phytosterols, the fat sample is considered to contain vegetable
fat. Arun kumar (2003) reported that adulteration of ghee samples with 15%
groundnut oil could be confirmed using this parameter.
2.1.1.13 Differential Thermal Analysis (DTA) and Differential Scanning
Calorimetry (DSC)
DTA and DSC are both closely related thermo-analytical techniques which
measure the physical properties such as phase transition and specific heats of
foods as a function of temperature. DTA measures the difference in temperature
(t) between a sample and an inert reference material as a function of
temperature. In DSC thermograms, the area delineated by the output curve is
directly proportional to the total amount of energy transferred in or out of the
sample.
Patel and Frede (1991) observed that the crystallization and melting
behaviour of buffalo milk fat was perceptibly different from that of cow milk fat, the
former generally beginning to solidify and melt at higher temperature, exhibiting a
higher solid fat content at a particular temperature in the melting range using
DSC technique. DTA and DSC have been used by different investigators for the
detection of foreign fats in milk fat. Antila et al. (1965) detected 5 percent coconut
fat, cocoa fat and hardened vegetable fat in butterfat by DSC based on the

17 Review of literature
differences in the shape of melting curves. However, tallow, lard and vegetable
oil added at 5 percent level in butterfat could not be detected by this method.
Roos and Tuinstra (1969) using DTA showed that addition of 5 to 10 percent of
beef tallow in butterfat changed the solidification curve as solidification started
earlier and showed two distinct minima in the curve. Lambelet et al. (1980)
detected goat body fat (more than 10%) in ghee by DTA technique on the basis
of differences in melting diagram and crystallization patterns of goat body fat and
ghee. Using DSC, detection of foreign fats like pig and buffalo body fats
(Lambelet and Ganguly, 1983) beef suet (Amelotti et al., 1983) and chicken fat
(Coni et al., 1994) in milk fat was reported. The method, however, failed to detect
coconut oil, cotton tract ghee and other animal body fats.
Aktas and Kaya (2001) carried out a study in which differential scanning
calorimetry (DSC) melting and crystallization curves of butterfat, beef body fat
(BBF) and margarine were formed by cooling gradually from 70 to 40°C. Then
margarine and BBF were added to butterfat at the rates of 5, 10 and 20% in order
to investigate their curves. When BBF or margarine was added to butterfat, 1.
and 2. peak areas increased in crystallization curves of butterfat with 2. peak
being more discernible. Results obtained show that DSC technique could be
used in order to determine adulteration of butterfat.
2.1.2 METHODS BASED ON CHEMICAL PROPERTIES
Several chemical methods based on fatty acids, triglycerides,
unsaponifiable matter, and specific tests using GLC, TLC, paper
chromatography, etc. have been used to characterize the various fats and oils
with a view to check the purity of milk fat.
2.1.2.1 TESTS BASED ON FATTY ACIDS
Before the advent of modern analytical techniques, like, GLC, TLC, paper
chromatography, etc., physico-chemical constants such as Reichert-Meissl,
18 Review of literature
Polenske, iodine, saponification values and BR reading were used as a measure
of fatty acids. However, these constants give information about the groups of
acids rather than individual fatty acids. Based on the differences in the fatty acids,
either as a group or individually, several tests have been developed for detecting
adulteration of milk fat with foreign fats, which are described below:
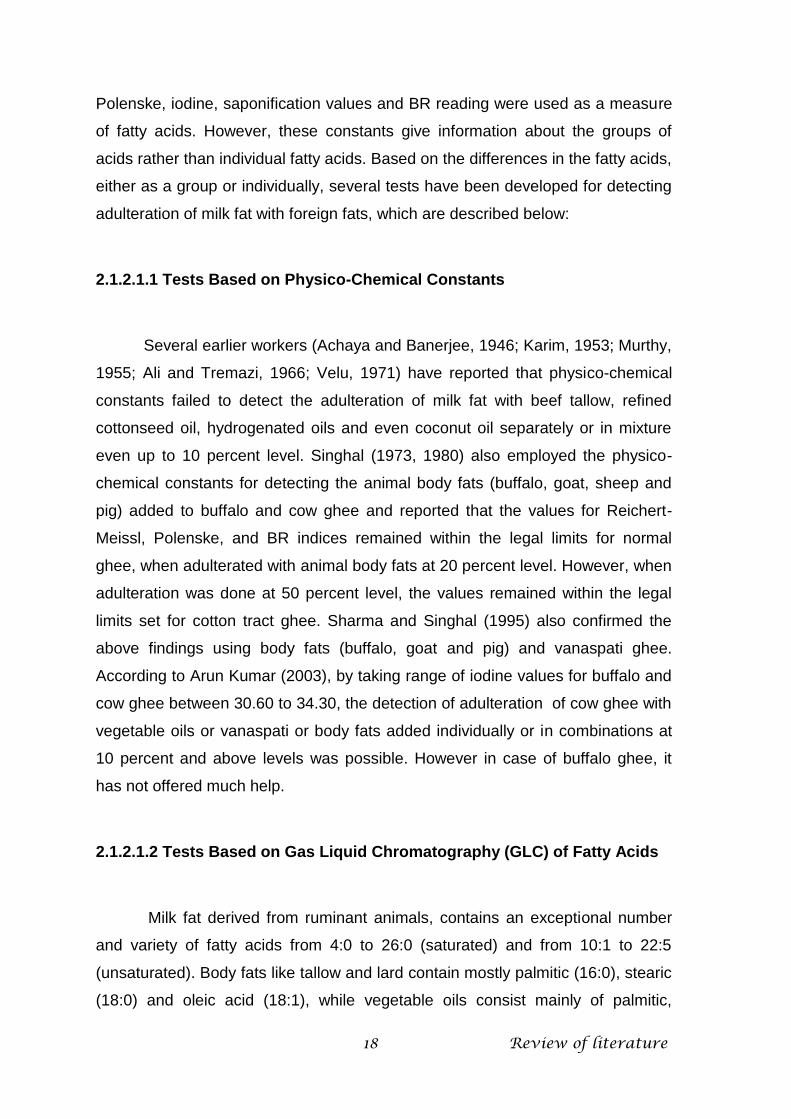
2.1.2.1.1 Tests Based on Physico-Chemical Constants
Several earlier workers (Achaya and Banerjee, 1946; Karim, 1953; Murthy,
1955; Ali and Tremazi, 1966; Velu, 1971) have reported that physico-chemical
constants failed to detect the adulteration of milk fat with beef tallow, refined
cottonseed oil, hydrogenated oils and even coconut oil separately or in mixture
even up to 10 percent level. Singhal (1973, 1980) also employed the physico-
chemical constants for detecting the animal body fats (buffalo, goat, sheep and
pig) added to buffalo and cow ghee and reported that the values for Reichert-
Meissl, Polenske, and BR indices remained within the legal limits for normal
ghee, when adulterated with animal body fats at 20 percent level. However, when
adulteration was done at 50 percent level, the values remained within the legal
limits set for cotton tract ghee. Sharma and Singhal (1995) also confirmed the
above findings using body fats (buffalo, goat and pig) and vanaspati ghee.
According to Arun Kumar (2003), by taking range of iodine values for buffalo and
cow ghee between 30.60 to 34.30, the detection of adulteration of cow ghee with
vegetable oils or vanaspati or body fats added individually or in combinations at
10 percent and above levels was possible. However in case of buffalo ghee, it
has not offered much help.
2.1.2.1.2 Tests Based on Gas Liquid Chromatography (GLC) of Fatty Acids
Milk fat derived from ruminant animals, contains an exceptional number
and variety of fatty acids from 4:0 to 26:0 (saturated) and from 10:1 to 22:5
(unsaturated). Body fats like tallow and lard contain mostly palmitic (16:0), stearic
(18:0) and oleic acid (18:1), while vegetable oils consist mainly of palmitic,

19 Review of literature
stearic, oleic and linoleic (18:2) acids. Coconut oil is the best known exception,
containing lauric (12:0) and myristic (14:0) acids in very large amount (Rangappa
and Achaya, 1974).
Some workers (Wolff, 1960; Francesco and Avancini, 1961; Boniforti,
1962) employed GLC technique and reported that the milk fat sample with a ratio
of C12:0 / C10:0 fatty acids >1.6 or C4 / C6+C8 fatty acids >1.8 was considered
to be adulterated with margarine, coconut oil or tallow or pig body fat trans-
esterified with butyric acid. Similarly, many other workers used the different fatty
acids ratios for checking the adulteration of milk fat with vegetable oils,
margarine, beef tallow, lard, goat body fat, substituted fats, synthetic fats, etc.
(Toppino et al., 1980; Ulberth, 1994; Sharma and Singhal, 1996; Panda and
Bindal, 1997; Arun kumar, 2003). Farag et al. (1983) determined the fatty acid
profile of 3 fractions separated by fractional crystallization from cow and buffalo
ghee adulterated with lard and margarine at various levels and reported that the
amounts of 16:0, 18:0 and 18:1 acids were significantly changed with different
adulteration levels and can be used as a marker to detect the admixture. Sharma
and Singhal (1996) analyzed the buffalo ghee samples adulterated with body fats
(buffalo, goat, pig) and vanaspati at 20 percent level and noted that short and
medium chain fatty acids decreased while long chain fatty acids increased on
adulteration. Panda and Bindal (1997) employed this technique for the detection
of adulteration in ghee with vegetable oils at level as low as 5 percent using
C18:2 or C22:1 as marker acid. Arun kumar (2003) found that the adulteration of
ghee with body fats or vanaspati at 15 percent level and above could be detected
using different fatty acid ratios like C14:0 / C16:0 and C18:0 / C18:1 whereas,
presence of even 5 percent vegetable oils in ghee could be detected easily, using
fatty acid ratios such as C14:0 / C18:2, C16:0 / C18:2, C18:0 / C18:2, as well as
linoleic acid (C18:2) as a marker fatty acid.

20 Review of literature
2.1.2.2 TESTS BASED ON THE NATURE AND CONTENT OF
UNSAPONIFIABLE CONSTITUENTS
The unsaponifiable matter (USM) which constitutes less than 2 percent by
weight of fat is a repository of so many valuable constituents, like, sterols
(cholesterol and phytosterols), fat soluble vitamins (A, D, E, K), hydrocarbons
such as squalene, pigments, etc. Mineral oil, if added to oils and fats, will appear
in USM (Kirk and Sawyer, 1999).
Sterols and tocopherols are the two most important constituents of USM,
which have been used to detect the vegetable fats in milk fat by using various
techniques like GLC, TLC, paper chromatography, etc.
2.1.2.2.1 Tests Based on Sterols
Sterols which represent maximum share of the USM range from 0.24 to
0.5 percent in butterfat, 0.03 to 0.14 percent in body fats and 0.03 to 0.5 percent
in vegetable oils (Arun Kumar, 2003). Cholesterol is the characteristic sterol of
animal fats, while sterols from plant sources consist of a mixture collectively
called as phytosterols and include ß-sitosterol, stigmasterol, campesterol,
brassicasterol, etc. Low concentration of cholesterol is also reported in the sterol
fractions of vegetable oils and fats (Kirk and Sawyer, 1999). In addition to
cholesterol, milk fat contains traces of lanosterol, dihydrolanosterol and ß-
sitosterol (Webb et al., 1987). The sterols can help to distinguish between fats of
animal and vegetable origin, since the melting point of cholesterol acetate
(112.76-116.40°C) is substantially lower than that of the acetates of any of the
phytosterols (126-137°C). Adulteration of milk fat with vegetable oils is confirmed
when melting point is more than 117°C (IDF, 1965; BIS, 1981).
A circular paper chromatographic method based on the difference in the
behaviour of USM isolated from fats in ghee using a solvent mixture of methyl
alcohol: petroleum ether: water (80:10:10; v/v) was developed by Ramachandra

21 Review of literature
and Dastur (1959) who reported that the spot of USM of ghee moved as a whole
along with the solvent front, while that of ghee adulterated with animal body fats
at 5 percent level or vanaspati at 10 percent level did not move at all. Sharma
(1989) applied paper chromatography to the USM of ghee, body fats and their
mixture, and observed that USM from ether soluble fractions of ghee adulterated
with 10 percent buffalo body fat exhibited two spots. However, pig body fat in
ghee could not be detected.
Ramamurthy et al. (1967) using thin layers of CaCO3 and soluble starch
(10 g + 4 g) impregnated with liquid paraffin and a solvent system consisting of
methanol:acetic acid:water (20:5:1; v/v) as a developer reported that the
presence of cottonseed oil, groundnut oil, sesame oil and hydrogenated fats at 10
to 13 percent level and coconut oil at 25 percent level in ghee could be detected
on the basis of Rf values of 0.53 and 0.44 for cholesterol and phytosterols,
respectively. Sharma (1989) carried out TLC of USM of ghee and animal body
fats using hexane : ether : glacial acetic acid : ethyl alcohol (25:20:5:1, v/v) as the
solvent system and reported that ghee samples adulterated with 10 percent body
fats resulted in the appearance of an extra spot due to dihydrocholesterol present
in body fats. Recently Kumar et al (2005a) also studied the TLC profile of USM
and reported the detection of groundnut oil and vanaspati in ghee on the basis of
appearance of additional bands in case of vegetable fat and their absence in milk
fat.
Using GLC technique, ß-sitosterol has been shown to be an index of
vegetable fat addition (Homberg and Bielefeld, 1979), however, by this method,
addition of body fats cannot be detected as body fats also have cholesterol.
2.1.2.2.2 Tests Based on Tocopherol
Vitamin E derivatives, consisting of 4 tocopherol and 4 tocotrienol isomers,
each designated as alpha, beta, gamma and delta on the basis of chromanol
ring, are now collectively known as tocochromanols (earlier commonly referred to

22 Review of literature
as tocopherols). The tocopherols have a saturated side chain, whereas
tocotrienols have an unsaturated side chain. Generally, seed oils are rich sources
of tocopherols whereas the tocotrienols are found predominantly in palm oil and
cereal oils such as barley and rice bran oil. They are the important constituents of
unsaponifiable matter of natural oils and fats which range from 0.002 to 0.005
percent in butterfat, 0.05 to 0.168 percent in vegetable oils and 0.0005 to 0.0029
percent in body fats (Kumar et al, 2002). Thus, tocopherol content of butterfat is
low as compared to most vegetable oils and fats, with the exception of coconut oil
(0.0083%). Therefore, addition of vegetable fats to butter will result in a
significant increase in tocopherol content of adulterated butterfat. Accordingly,
some workers (Keeney et al., 1971) have reported that vegetable fats and oils
added to ghee could be detected on the basis of tocopherol content. However,
body fats and coconut oil added to milk fat could not be detected.
Cow milk contains exclusively α-tocopherol while human milk has 75% α-
tocopherol. The dominance of α-tocopherol is probably because of the fact that
mammals selectively absorb and deposit α-tocopherol in their tissues (Webb et
al, 1987 & Fox, 1995). However, Amit Kumar (2008) using HPLC analysis of
tocopherol isomers found appreciable proportion of all the three tocopherols
studied (α, γ, δ) in pure cow and buffalo ghee. He thus concluded that
adulteration of ghee with vegetable oils could not be detected on the basis of
tocopherol isomers, as vegetable oils also contain all the three tocopherols.
2.1.2.3 TESTS BASED ON WHOLE FAT/TRIGLYCERIDES
2.1.2.3.1 Tests based on thin layer chromatography (TLC) of whole fat
Sebastian and Rao (1974) detected the presence of vegetable oils and
fats in ghee (butterfat) to the extent of even 5 percent by employing TLC
technique using a self-coated silica gel glass plate and solvent mixture consisting
of cyclohexane, ethyl acetate and water (600:200:1) as developing solution on
the basis of appearance of bands more than the specific bands of pure ghee.

23 Review of literature
Paradkar et al. (2001) modified the method of Sebastian and Rao (1974) and
applied HPTLC on aluminium plates precoated with silica gel 60F254 using the
same solvent system. They reported that palm oil and groundnut oil adulteration
could be detected on the basis of appearance of some extra bands in adulterated
samples.
2.1.2.3.2 Tests based on gas liquid chromatography of triglycerides
Butterfat is composed predominantly of triglycerides with 26 to 52 carbon
number, while animal depot fats and common vegetable oils other than coconut
and palm kernel oil have mainly 50 to 54 carbon number. Coconut and palm
kernel oil contain short and medium chain length triglycerides with 30 to 52
carbon number, a range almost similar to butterfat (Parodi, 1969; Rangappa and
Achaya, 1974).
Using GLC, Kuksis and McCarthy (1964) detected the presence of
vegetable fat and lard in butterfat at 5 to 10 percent level based on the increase
in the content of high molecular weight triglycerides, C52 and C54 peaks,
respectively. Guyot (1978) found the ratio of C52/C50 was <1 in pure butter and
between 2 & 3-4, in case of beef tallow & lard, respectively. He concluded that
the C52 / C50 ratio together with C52 / C38 ratio gave a valuable indication of the
possible addition of tallow or lard to butter. Marjanovic et al. (1984) reported that
adulteration of the milk fat with margarine at 5 to 10% level could be detected on
the basis that margarine had more triglycerides with 48 to 54 acyl carbon atoms
than milk fat. Similarly, Luf et al. (1987) could also detect 5 to 10 percent of beef
tallow and lard as well as vegetable oils / fats in butter based on C52:0 / C40:0 and
C50:0 - C54:0 / C38:0 – C40:0 triglycerides, respectively.
Precht (1990, 1992a) designed a multiple linear regression equation on
the GLC profile of triglycerides by which foreign fats could be detected with
substantially improved sensitivity. Currently, European Union (EU) applies the
method of Precht (1992a) as an official method for evaluating the milk fat purity.
24 Review of literature
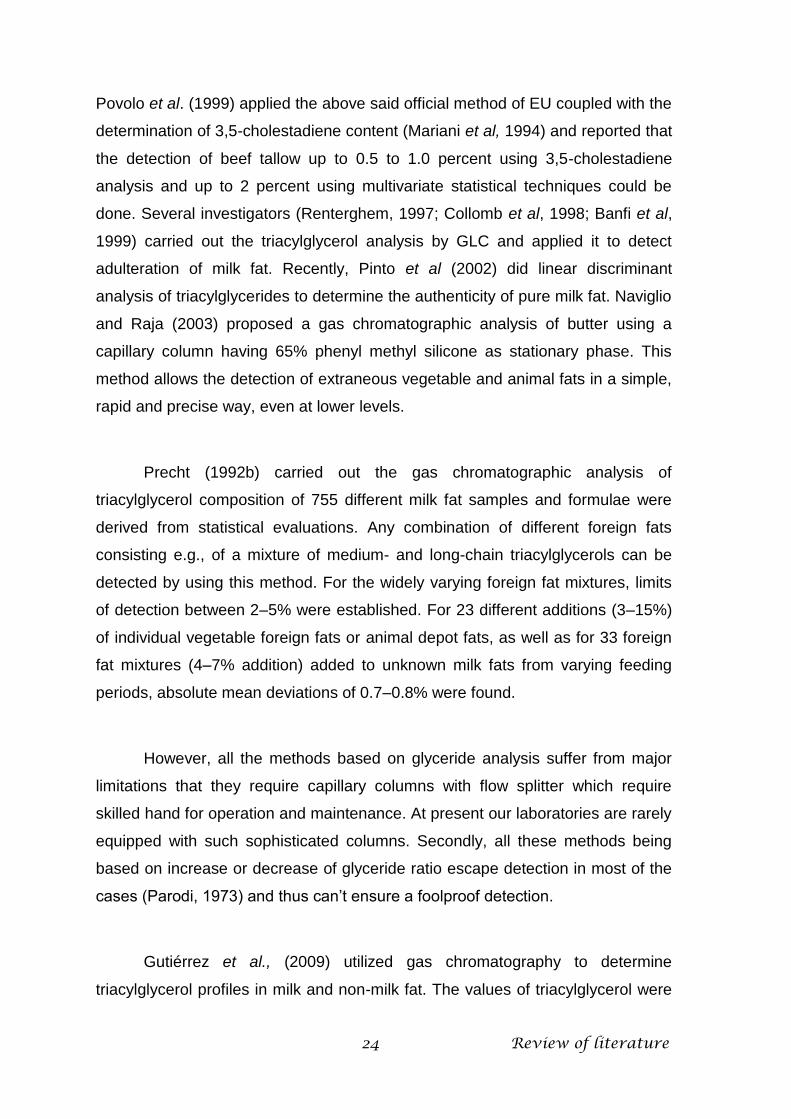
Povolo et al. (1999) applied the above said official method of EU coupled with the
determination of 3,5-cholestadiene content (Mariani et al, 1994) and reported that
the detection of beef tallow up to 0.5 to 1.0 percent using 3,5-cholestadiene
analysis and up to 2 percent using multivariate statistical techniques could be
done. Several investigators (Renterghem, 1997; Collomb et al, 1998; Banfi et al,
1999) carried out the triacylglycerol analysis by GLC and applied it to detect
adulteration of milk fat. Recently, Pinto et al (2002) did linear discriminant
analysis of triacylglycerides to determine the authenticity of pure milk fat. Naviglio
and Raja (2003) proposed a gas chromatographic analysis of butter using a
capillary column having 65% phenyl methyl silicone as stationary phase. This
method allows the detection of extraneous vegetable and animal fats in a simple,
rapid and precise way, even at lower levels.
Precht (1992b) carried out the gas chromatographic analysis of
triacylglycerol composition of 755 different milk fat samples and formulae were
derived from statistical evaluations. Any combination of different foreign fats
consisting e.g., of a mixture of medium- and long-chain triacylglycerols can be
detected by using this method. For the widely varying foreign fat mixtures, limits
of detection between 2–5% were established. For 23 different additions (3–15%)
of individual vegetable foreign fats or animal depot fats, as well as for 33 foreign
fat mixtures (4–7% addition) added to unknown milk fats from varying feeding
periods, absolute mean deviations of 0.7–0.8% were found.
However, all the methods based on glyceride analysis suffer from major
limitations that they require capillary columns with flow splitter which require
skilled hand for operation and maintenance. At present our laboratories are rarely
equipped with such sophisticated columns. Secondly, all these methods being
based on increase or decrease of glyceride ratio escape detection in most of the
cases (Parodi, 1973) and thus can’t ensure a foolproof detection.
Gutiérrez et al., (2009) utilized gas chromatography to determine
triacylglycerol profiles in milk and non-milk fat. The values of triacylglycerol were

25 Review of literature
subjected to linear discriminant analysis to detect and quantify non-milk fat in milk
fat. The samples of raw milk fat were adulterated with non-milk fats (Fish oil &
corn oil) in proportions of 0, 5, 10, 15, and 20%. The first function obtained from
the linear discriminant analysis allowed the correct classification of 94.4% of the
samples with levels <10% of adulteration. The triacylglycerol values of the
ultrapasteurized milk fats were evaluated with the discriminant function,
demonstrating that one industry added non-milk fat to its product in 80% of the
samples analyzed.
2.1.3 METHODS BASED ON TRACER COMPONENTS OF FATS AND OILS
Tracers are those compounds which are present in adulterant, either
naturally or by addition, but absent in pure ghee. Addition of some tracer
components has been suggested as a rapid and reliable tool to identify the
foreign fat in milk fat. Among tracers, in India, sesame oil is added (5% by weight)
to vanaspati according to food laws (PFA, 2010) for its detection in ghee by
Baudouin test. The method is based on the development of a permanent crimson
color due to the reaction between furfural and sesamol formed by the hydrolysis
of sesamolin (present in sesame oil) in the presence of concentrated HCl.
Another tracer is tannins which are assumed to be present as impurities in palm
oil. Ghee samples adulterated with palm oil gave purssian blue colour with
potassium ferricyanide and ferric chloride reagent. However, limitation of this
method is that the ghee samples having BHA as antioxidant also gave positive
test (Bector & Sharma, 2002).
Gamma oryzanol, a natural tracer, having antioxidant and cholesterol
lowering properties, is found to be present in the rice bran oil exclusively. It was
revealed to be a mixture of phytosteryl ferulates comprising cycloartenyl ferulate,
24- methylenecycloartenyl ferulate, and campesteryl ferulate as major
components (Iqbal et al, 2005; Chen et al, 2005). Crude rice bran oil can contain
≤ 2% (V/V) oryzanol (Norton, 1995). This compound has been indicated as a
marker of rice bran oil in other edible oils (Singhal et al, 1997). Recently Kumar et

26 Review of literature
al. (2008, 2009b) has developed a TLC and colorimetric methods for detection of
rice bran oil in ghee, qualitatively, even at 5 and 2% levels of adulteration
respectively.
2.1.4 MISCELLANEOUS METHODS
2.1.4.1 Tests for Mineral Oils
Adulteration of common edible oils with cheaper mineral oils, such as
paraffin oil, heavy and light fuel oil, petroleum jelly, etc. has become widespread
phenomenon because of the price difference. Unlike oils and fats, mineral oils are
not saponifiable by alkali. This characteristic behaviour of mineral oils has been
used as the basis for their detection in edible oils and fats. Venkatachalam and
Sundaram (1957) could detect the presence of even 1 percent of mineral oil in
ghee by saponifying the test sample (1 ml) with aqueous potash followed by
addition of alcohol (50%) and thorough shaking. Appearance of turbidity indicated
the presence of mineral oil. Kumar et al (2005b) have also reported the detection
of liquid paraffin added to ghee at the rate of 0.5% and above using Holde’s test
as described by Winton and Winton (1999).
2.1.4.2 Tests for Cottonseed Oils
Fatty acids containing cyclopropene ring, viz., malvalic (C18:-0) and
sterculic (C19:0) acids which are altogether absent in milk fat, but are
characteristic of cottonseed oil (Bailey et al., 1966; Pandey and Suri, 1982) have
been used as a tool by few workers (Shenstone and Vickery, 1959; Gunstone,
1969) for the detection of cottonseed oil in milk fat and also to distinguish cotton
tract ghee from normal ghee (Singhal, 1980) using Halphen test or methylene
blue reduction test.

27 Review of literature
Halphen test is based on the development of a crimson colour due to the
reaction between cyclopropenoic acids (constituents of cottonseed oil) and
Halphen reagents (1% sulphur solution in CS2 and equal volume of iso-amyl
alcohol) after incubation for an hour in a boiling bath of saturated sodium chloride
solution. Singhal (1980) developed a methylene blue reduction test for the
identification of cotton tract ghee and reported that the colour of methylene blue
dissolved in chloroform: methanol (1:1) was decolourised by cotton tract ghee or
ghee added with cottonseed oil due to the presence of cyclopropenoic acids.
2.1.4.3 Color based platform test for detection of vegetable oils/fats in
ghee
The Bieber’s test, hitherto employed for the detection of almond oil
adulteration with Kernel oil, was suitably modified by Sharma et al (2007) to
detect the adulteration of ghee with vegetable oils. Based on this rapid color
based test, their results showed the presence of orange brown color in case of
refined vegetable oils & fats, whereas in case of pure ghee samples no color was
observed. By this method adulteration of ghee with different vegetable oils to the
tune of 5-7% could be detected.
The above part of review reveals that although several methods based on
the physico-chemical characteristics of oils and fats have been developed to
detect the various types of adulterant fats such as animal body fats and
vegetable oils in milk fat, but most of the methods are quite tedious, time
consuming and have one or the other limitation. The detection methods available
till date are mainly based on the physico-chemical constants, fatty acid profile,
sterol analysis, partial solidification behavior, etc.

28 Review of literature
2.2 METHODS OF DETECTION OF ADULTERATION APPLICABLE
DIRECTLY TO MILK:
As reported above in the previous section (2.1), it can be noticed that most of
the methods of detection of adulteration of milk fat are developed for the clarified
milk fat / Ghee. A survey of literature reveals that very few methods have been
developed which can be directly applied to milk for detecting milk fat adulteration.
The detection of milk fat adulteration has to be done right at the reception dock
itself where milk is to be either accepted or rejected on the basis of its quality,
because very little can be done afterwards once the milk is accepted and
converted into milk products like butter, ghee etc. As the milk cannot be held at
the reception dock for longer time for its acceptance or rejection, it therefore
requires rapid tests for knowing the quantity and purity of milk fat. Moreover, it
appears that the fat has to be isolated from milk before subjecting it to testing for
authentication.
The technique for isolation of fat from milk for detecting adulteration of milk fat
at the platform is very difficult and time consuming and therefore, there is a great
demand for a rapid test to detect adulteration of milk with foreign fats and oils. A
rapid test based on Butyrorefractometer (BR) reading for detecting adulteration of
milk with refined mustard oil was developed by Arora et al (1996). This test
involves the use of a modified (specially designed dual purpose) Gerber
butyrometer having both ends open so that after reading the fat percentage in the
butyrometer column the fat can be isolated with the help of a syringe and can be
further used for determining the purity of milk fat using BR reading at 40°C, which
is the simplest test of fat that can be easily performed at the milk reception dock
itself. BR reading test, which requires only 2-3 drops of fat, is an important
indicator of adulteration in milk fat with foreign fats especially vegetable oils and
fats whose BR readings are much higher than milk fat, with the exception of
coconut oil and palm oil whose BR values are close to that of milk fat.

29 Review of literature
BR reading of the isolated fat as obtained in the above test was different from
that of normal heat clarified fat from the same milk sample, due to the inherent
effect of Gerber acid on milk fat. In order to account for this difference, a
correction factor was applied to the observed reading to get actual BR reading,
as follows:
Actual BR at 40°C = observed BR at 40°C + (0.08 Χ observed BR at 40°C)
This method which was developed at NDRI, has been also adopted by Bureau
of Indian Standards (BIS, 1960). But this method has one limitation that the
change in BR reading upto 10 % level of addition remained within the legal limit.
Same approach was used by Boghra and Borkhatriya (2004), for detecting
cottonseed oil in milk. Skim milk, milk with 2% fat and milk with 4% fat was
adulterated with cottonseed oil @ 1%, 2%, 4%, 6%. A different correction factor
(0.0909) was given by them, which they reported that the difference in their
correction factor as compared to that reported by Arora et al (1996) might be
attributed to variations in nature and types of fatty acids in milk specific to region,
breed and species of the animals as well as the feeding practices followed.
Apart from these, there are no reports on the detection of other vegetable oils
and also animal body fats added directly to milk. Therefore, in the present
investigation, a systematic study was undertaken on the detection of adulteration
of milk with some vegetable oils and body fats using specially designed dual
purpose Gerber butyrometer.

CHAPTER - 3
────────────────────────────
Materials and Methods ─────────────────────────────
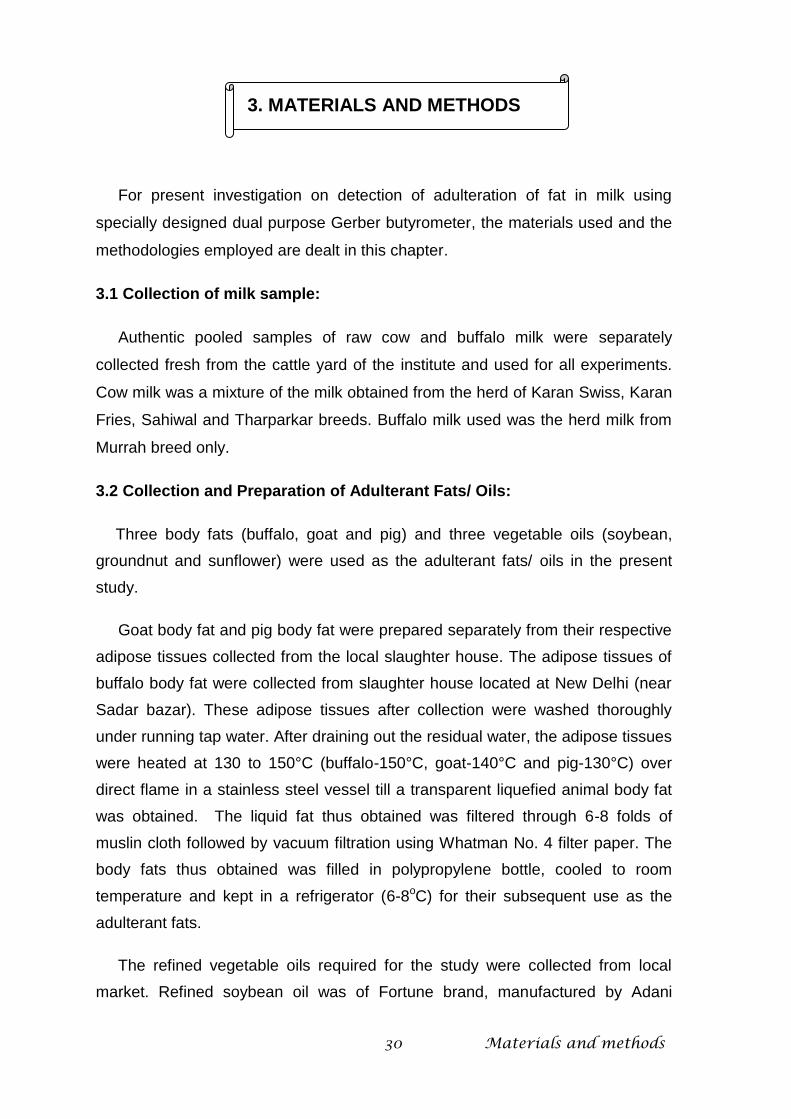
30 Materials and methods
3. MATERIALS AND METHODS
For present investigation on detection of adulteration of fat in milk using
specially designed dual purpose Gerber butyrometer, the materials used and the
methodologies employed are dealt in this chapter.
3.1 Collection of milk sample:
Authentic pooled samples of raw cow and buffalo milk were separately
collected fresh from the cattle yard of the institute and used for all experiments.
Cow milk was a mixture of the milk obtained from the herd of Karan Swiss, Karan
Fries, Sahiwal and Tharparkar breeds. Buffalo milk used was the herd milk from
Murrah breed only.
3.2 Collection and Preparation of Adulterant Fats/ Oils:
Three body fats (buffalo, goat and pig) and three vegetable oils (soybean,
groundnut and sunflower) were used as the adulterant fats/ oils in the present
study.
Goat body fat and pig body fat were prepared separately from their respective
adipose tissues collected from the local slaughter house. The adipose tissues of
buffalo body fat were collected from slaughter house located at New Delhi (near
Sadar bazar). These adipose tissues after collection were washed thoroughly
under running tap water. After draining out the residual water, the adipose tissues
were heated at 130 to 150°C (buffalo-150°C, goat-140°C and pig-130°C) over
direct flame in a stainless steel vessel till a transparent liquefied animal body fat
was obtained. The liquid fat thus obtained was filtered through 6-8 folds of
muslin cloth followed by vacuum filtration using Whatman No. 4 filter paper. The
body fats thus obtained was filled in polypropylene bottle, cooled to room
temperature and kept in a refrigerator (6-8oC) for their subsequent use as the
adulterant fats.
The refined vegetable oils required for the study were collected from local
market. Refined soybean oil was of Fortune brand, manufactured by Adani
31 Materials and methods
Wilmar Ltd., and refined groundnut oil was of Ginni brand, manufactured by Amrit
Banaspati Co. Ltd., while refined sunflower oil Ginni brand, manufactured Amrit
Banaspati Co. Ltd. After collection, all samples of refined vegetable oils were kept
in a refrigerator (6-8oC) till their use as adulterant oils.
3.3 Preparation of Adulterated Milk Samples:
For the preparation of adulterated milk samples, body fats were heated to
60-70°C for 10 minutes before mixing, while vegetable oils were heated at 60°C
for 5 minutes before mixing. The adulterant fats/oils were added to milk
individually at 5, 10, 15 and 20% levels on the basis of fat content of milk. The
mixing for one minute was done using blender after heating the milk at 65°C, to
get homogeneous mixture.
3.4 Qualitative analysis of milk fat using specially designed dual purpose
Gerber butyrometer:
3.4.1 Reagents and materials:
1. Gerber Sulphuric acid - density: 1.807 to 1.812 g/ml at 27°C
corresponding to a concentration of sulphuric acid from 90-91 % by
weight (AR Grade, s. d. Fine-chem, Ltd. Mumbai)
2. Amyl alcohol (AR Grade, s. d. Fine-chem, Ltd. Mumbai)
3. Modified Gerber butyrometers (ISI marked, Benny make,Jupitor Glass
Works Benny Impex Pvt. Ltd.)
4. Lock Stoppers and a key (ISI marked, Benny make)
5. Gerber centrifuge (benny impex pvt. Ltd)
6. Milk pipette, 10.75 ml (ISI marked, Borosil make,)
7. Water bath with temperature control (The Laboratory Glassware Co.,
Ambala Cantt., India)
8. An automatic system for delivering 1ml of amyl alcohol (Jain Scientific
Glass works., Ambala Cantt)
9. An automatic system for delivering 10ml of sulphuric acid (Jain Scientific
Glass works., Ambala Cantt)
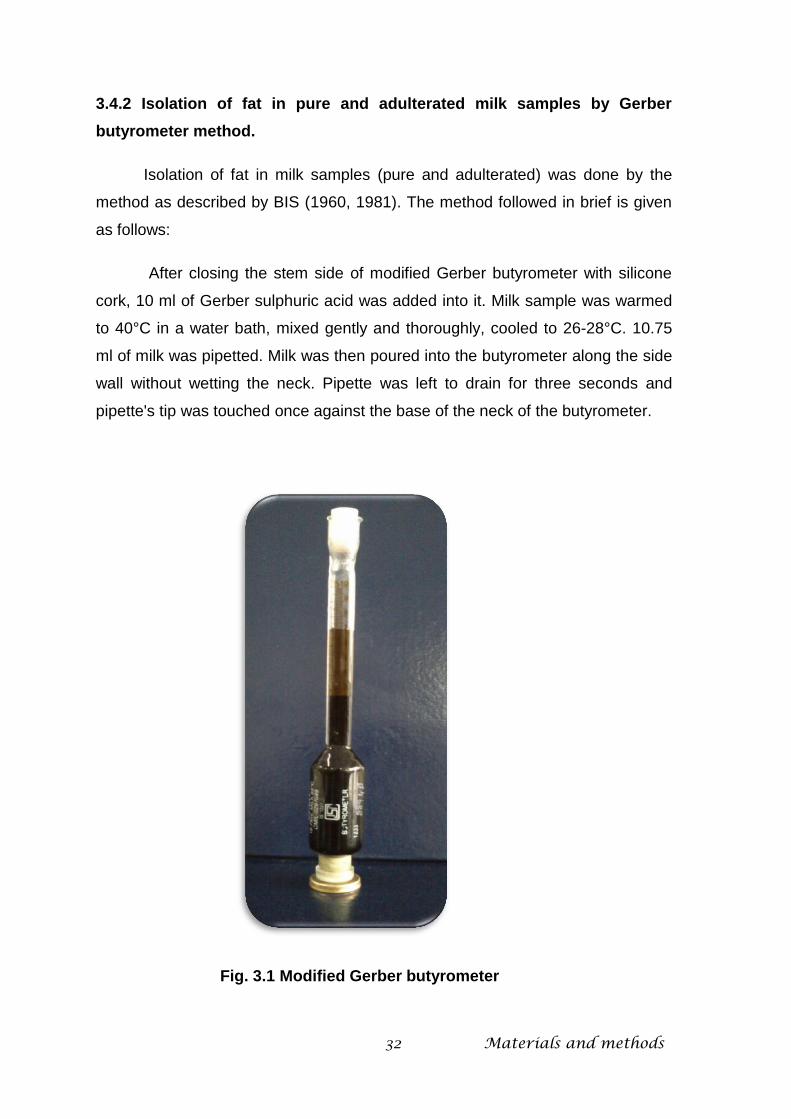
32 Materials and methods
3.4.2 Isolation of fat in pure and adulterated milk samples by Gerber
butyrometer method.
Isolation of fat in milk samples (pure and adulterated) was done by the
method as described by BIS (1960, 1981). The method followed in brief is given
as follows:
After closing the stem side of modified Gerber butyrometer with silicone
cork, 10 ml of Gerber sulphuric acid was added into it. Milk sample was warmed
to 40°C in a water bath, mixed gently and thoroughly, cooled to 26-28°C. 10.75
ml of milk was pipetted. Milk was then poured into the butyrometer along the side
wall without wetting the neck. Pipette was left to drain for three seconds and
pipette's tip was touched once against the base of the neck of the butyrometer.
Fig. 3.1 Modified Gerber butyrometer

33 Materials and methods
Then, 1 ml of Amyl alcohol was added. Volume in the butyrometer was
maintained with distilled water whenever it was necessary. Butyrometers were
then closed with lock stopper, shaken and inverted until complete digestion of
casein particles was achieved. Butyrometers were then kept in a water bath for 5
minutes at 65 ± 2°C. The butyrometers were put in Gerber centrifuge, so as to
conform to radial symmetry, and as evenly spaced as possible, in order to protect
bearings of the centrifuge. Centrifugation was done for 5 minutes at 1100 rpm
Centrifuge was allowed to come to rest. Butyrometers were removed and placed
in water bath for 5 minutes at 65 ± 2°C.
Then a portion of the fat column was drawn out of the modified Gerber
butyrometer with the aid of pasture pipette for determination of Butyro-
Refractometer reading, as described in section 3.8.
3.5 Extraction of fat from pure and adulterated milk samples using heat
clarification method for determination of Butyro-Refractometer reading:
3.5.1 Materials:
1) Electric heater (Vikrant, Jain Enterprises, India)
2) Spatula (stainless steel)
3) Funnel
4) Filter paper: Whatman no.4, England
5) Centrifuge (REMI laboratory centrifuge)
6) Beaker
3.5.2 Method of extraction of fat from milk:
Pure and adulterated milk samples were warmed to 40°C and then centrifuged
at 3000 RPM for 5 minutes in a centrifuge. The cream plug from the centrifuge
tubes was removed with the help of spatula. The cream plug thus obtained was
then subjected to heat clarification in a beaker over electric heater till the
transparent fat was obtained and the residue was slightly brown. The
34 Materials and methods
temperature at this stage was around 110-115°C. The contents were then filtered
through Whatman no.4 filter paper so as to obtain the clear fat.
3.6 Apparent Solidification Time (AST) test
Apparent Solidification Time (AST) test was previously developed by Kumar
et al., (2009a) for the detection of adulteration of clarified milk fat (Ghee) with
foreign fats and oils. This test was performed in the test tube of the specific
dimensions at a particular temperature and was based on the principle of partial
solidification behaviour of milk fat. The time taken by the melted fat sample to
become apparently solidified at a given temperature was taken as the basis of
this test for detecting the presence of foreign oils and fats in milk fat. In the
present study, this test was modified slightly so as to be performed on the fat
column in the milk butyrometer itself. The AST test in the milk butyrometer was
carried out as described below:
3.6.1 Materials:
1) Water bath maintained at 60±2°C
2) Refrigerated water bath (J Lab Tech, Daihan Labtech Co. Ltd., Korea)
3) Stopwatch
3.6.2 Methodology for AST test:
For this test, after completion of Gerber fat test (section 3.4.2), the
butyrometers were kept in water bath maintained at 60±2°C for 10 minutes for
pre-equilibration. The butyrometers were then transferred to refrigerated water
bath maintained at different temperatures (21, 20, 19, 18 and 17°C). The
butyrometers were observed constantly until the apparent solidification of fat
column in Gerber butyrometer took place, which was confirmed by non-
movement of fat column on tilting the butyrometer. At this stage, when the fat
column was apparently solidified, the time taken for the same was recorded as
Apparent Solidification Time (AST) using stopwatch.

35 Materials and methods
3.7 Complete Liquefaction Time (CLT) test
This test was previously developed by Amit Kumar (2008) for the detection of
adulteration of clarified milk fat (Ghee) with foreign fats. This test was performed
in the test tube of the specific dimensions at a particular temperature. In CLT test,
the time taken by the solidified milk fat to completely liquefy forms the basis of
this test. At particular temperature solidified milk fat takes characteristic time to
liquefy, whereas addition of foreign fat or oil to milk fat may increase or decrease
this time, depending upon the type of adulterant. In the present study, the CLT
test was modified slightly so as to be performed on the fat column in the
butyrometer itself. The CLT test in the milk butyrometer was carried out as
described below:
3.7.1 Materials:
1) Water bath maintained at 60±2°C
2) Water bath maintained at 41±0.2°C
3) Refrigerator (6-8°C)
4) Stopwatch
3.7.2 Methodology for CLT test:
After completing the fat test (see section 3.4.2), the butyrometers were kept in
the water bath maintained at 60±2°C for 10 minutes for pre-equilibration. These
butyrometers were then placed in refrigerator (at 6-8°) for 45 minutes for
apparent solidification. Then butyrometers were transferred to water bath
maintained at 41±0.2°C and observed constantly until the complete liquefaction
of fat column in Gerber butyrometer took place, which was confirmed by
movement of fat column on tilting the butyrometer. At this stage, when the fat
column was completely liquefied, the time taken for the same was recorded as
Complete Liquefaction Time (CLT) using stopwatch.

36 Materials and methods
3.8 Determination of Butyro-Refractometer (BR) Reading at 40°C
Butyro-Refractometer (BR) reading of fat sample (isolated from
butyrometer and heat clarified fat) was determined by the method as described
by BIS (1981).
3.8.1 Materials:
1) Butyro-Refractometer (PERFIT, India)
2) Circulatory water bath (PERFIT, India)
2) Glass rod
3) Tissue paper
4) Diethyl ether (s.d. Fine-chem Ltd., Mumbai, India)
3.8.1 Methodology for determination of Butyro-Refractometer (BR) Reading at
40°C of fat isolated from butyrometer:
Before determining the BR reading of a sample, the temperature of the
Butyro-Refractometer was adjusted to 40.0 ± 0.1°C using circulatory water bath
and the prisms were cleaned with diethyl ether and dried completely. The Butyro-
Refractometer was calibrated with the standard provided by the company before
taking the reading of different samples. A drop of the fat was drawn out from the
modified Gerber butyrometer using pasture pipette and was placed on the lower
prism of the Butyro-Refractometer and the prisms were closed and held for 2
minutes. After adjusting the instrument and light to get the most distinct reading
possible and bringing the temperature to 40°C, the BR reading of the fat was
recorded.
3.8.2 Methodology for determination of Butyro-Refractometer (BR) Reading at
40°C of heat clarified fat:
The Butyro-Refractometer was conditioned as mentioned above and then
a drop of the molten heat clarified fat (see section 3.5) was placed on the lower
37 Materials and methods
prism of the Butyro-Refractometer and the prisms were closed and held for 2
minutes. After adjusting the instrument and light to get the most distinct reading
possible and bringing the temperature to 40°C, the BR reading of the fat was
recorded.
3.9 Thin layer chromatography of unsaponifiable matter
In order to check the presence of vegetable oils in milk samples, technique
of thin layer chromatography (TLC) was applied on the heat clarified fat using the
method of Arun Kumar (2005).
3.9.1 Reagents and materials:
1) TLC plates (Silica Gel 60, F254, MERCK specialities private Ltd, Mumbai,
India)
2) Ethyl alcohol (s.d. Fine-chem Ltd., Mumbai, India)
3) 50 percent (w/v) potassium hydroxide solution
4) Distilled water
5) Separating funnel
6) Peroxide-free diethyl ether (s.d. Fine-chem Ltd., Mumbai, India)
7) Sodium sulphate (anhydrous) (LR grade, Qualigens fine chemicals,
Mumbai, India)
8) Water bath
9) Chloroform (GR grade, MERCK specialities private Ltd, Mumbai, India)
10) Chromatographic vessel
11) Cyclohexane:ethyl acetate:water in the proportion of 600:200:1
12) Oven maintained at 100oC (Narang Scientific Works Pvt. Limited, New
Delhi, India)
13) Phosphomolybdic acid in ethanol (98%, v/v)
14) Reference solution consisting of pure cholesterol ester, cholesterol, β-
sitosterol, tocopherol mixture (ɑ, δ, γ- tocopherol), vitamin A, Vitamin D,
and carotene.
15) Chromatographic sprayer

38 Materials and methods
3.9.2 Method:
3.9.2.1 Extraction of unsaponifiable matter from the samples
Accurately, 5.0 g of heat clarified fat wae weighed and saponified by
refluxing with 50 ml of ethyl alcohol and 7 ml of 50 percent (w/v) potassium
hydroxide solution for 30 minutes. After cooling, 150 ml of distilled water were
added and the contents were transferred to a separating funnel. The
unsaponifiable matter was extracted three times with 50 ml of peroxide-free
diethyl ether each time. All the three ether extract were combined together and
washed with water to make it alkali free. The alkali-free ether extract was dried
over sodium sulphate (anhydrous) and finally the ether was evaporated on water
bath under reduced pressure.
3.9.2.2 Application of unsaponifiable matter on TLC plates and its development
By means of a micropipette,3 µl of unsaponifiable matter extracted from
the heat clarified fat (cow and buffalo) after dissolving in chloroform, were spotted
on the TLC plates at a distance of about 2 cm from the bottom.
These plates were introduced into chromatographic vessel having solvent
mixture consisting of Cyclohexane: Ethyl acetate: Water in the proportion of
600:200:1 by volume, as developing solution. The plates were developed
according to ascending chromatographic technique. The development was
discontinued when the solvent (developer) front had travelled over height of
about 1 cm below the other end of the plate. The developed plates were dried in
the air for 5 minutes to remove excess of the solvent followed by drying in an
oven maintained at 100oC for 3 minutes. The plates were then taken out and
allowed to cool at room temperature and sprayed uniformly with 10 percent
phosphomolybdic acid in ethanol (98%, v/v). The plates were kept back in drying
oven till distinct bluish bands were developed which took 3 to 5 minutes.
Simultaneously, reference solution consisting of pure cholesterol ester,
cholesterol, and phytosterols (ergosterol and stigmasterol) were also run under
similar conditions.
39 Materials and methods
3.10 Effect of addition of formalin to milk on BR reading of milk fat obtained
by isolation from Gerber butyrometer and by heat clarification method.
For preservation purposes, formalin (40% formaldehyde, Qualigens fine
chemicals, Mumbai, India) is the only preservative permitted to be added at the
rate of 0.4% to the milk samples meant for chemical analysis (PFA, 2010).
Therefore, in order to see whether addition of formalin has any effect on the BR
reading of the fat isolated from milk either by modified Gerber method or heat
clarification method, formalin at a level of 0.4% was added to pure and
adulterated milk samples (at 20% level of adulteration with vegetable oils and
body fats separately). Immediately after the addition of formalin to these milk
samples, the fat was isolated for determining the BR reading as described below.
In case of isolation of fat from formalin treated milk samples using Gerber
butyrometer, the modified method of fat estimation in formalin treated samples as
given by Raj and Singhal (1987) was followed, in which concentration of sulphuric
acid was increased to 95% instead of routine 90-91% as the addition of formalin
interferes with the fat test when less concentrated acid is used. In the present
study, specially designed dual purpose Gerber butyrometers were used in place
of normal butyrometers.
In case of isolation of fat by heat clarification method from formalin treated
samples, the normal method of obtaining heat clarified milk fat as described
earlier (see section 3.5) was followed. Isolated fats were then used for
determining BR reading in the same way as described earlier (see section 3.8).
3.11 Effect of storage of formalin preserved milk samples on BR reading of
milk fat obtained by isolation from Gerber butyrometer and by heat
clarification method.
In order to study the effect of storage of formalin treated milk samples on
BR reading of milk fat obtained either by isolation form Gerber butyrometer or by
heat clarification method, formalin at a level of 0.4% was added only to pure milk
samples (separately pooled cows and buffaloes milk) in glass stoppered bottles
of 250 ml capacity and the milk samples containing formalin were stored at 37°C
for three months. Fresh milk samples immediately before and after the addition of
40 Materials and methods
formalin were analysed for fat content and BR reading of the isolated fat. During
storage also, the samples were drawn at one month interval and analysed for fat
content and BR reading of isolated fat. Nine bottles each of formalin treated milk
samples were separately stored for cow and buffalo milks. At the interval of
storage of one month, every time a new set of three bottles were drawn each for
cow and buffalo milks added with formalin for the analysis of fat content and BR
reading of the isolated fat. For this part of study, three trials were conducted each
for cow and buffalo milk.
For fat estimation in formalin preserved samples by Gerber butyrometer,
the modified method given by Raj and Singhal (1987) was followed, in which
concentration of sulphuric acid was increased to 95% instead of routine 90-91%,
with the exception that in this study, specially designed dual purpose Gerber
butyrometer having both ends open was used in place of normal butyrometer.
After reading the fat percentage in the butyrometer, a portion of the fat
from the butyrometer column was drawn out with the help of pasture pipette and
analysed for BR reading as described earlier (see section 3.8.1). In case of
isolation of fat by heat clarification method from formalin treated samples, the
normal method of obtaining heat clarified milk fat as described earlier (see
section 3.5) was followed. Isolated fats were then used for determining BR
reading in the same way as described earlier (see section 3.8.2).

CHAPTER - 4
───────────────────────────
Results and Discussion ───────────────────────────

41 Results and discussion
4. RESULTS AND DISCUSSION
A study on the detection of adulteration of fat in milk using specially designed
dual purpose Gerber butyrometer was carried out in the present investigation. The
first objective was aimed to detect different vegetable oils added to milk at various
levels. The second objective was to detect different body fats added to milk at
various levels. To meet the objectives of the study, three vegetable oils (groundnut,
soybean, sunflower), three body fats (goat, buffalo and pig) were procured from the
local market, whereas pooled cow and buffalo milk samples were collected from the
Institute’s Cattle Yard. Adulterated milk samples were prepared by adding the
preheated adulterant oils and fats individually to milk at 5, 10, 15 and 20 percent
levels on the basis of fat content in milk, followed by mixing with a blender after
preheating milk to about 60-65°C.
For checking the adulteration of milk with foreign fats, four tests such as
Apparent Solidification Time (AST) test, Complete Liquefaction Time (CLT) test,
Butyro–refractometer (BR) reading at 40°C of milk fat obtained by isolation form
Gerber butyrometer and by heat clarification method and thin layer chromatography
of unsaponifiable matter were planned to be undertaken. In addition to these
experiments, effect of addition of formalin to milk on BR reading of milk fat obtained
by isolation form Gerber butyrometer and by heat clarification method, effect of
storage of formalin preserved milk samples on BR reading of milk fat obtained by
isolation from Gerber butyrometer and by heat clarification method and thin layer
chromatography of unsaponifiable matter obtained from pure as well as adulterated
milk samples were also studied.
In whole of the study, unless otherwise mentioned, ten trials were conducted.
The results obtained in the present investigation for the above mentioned
parameters are presented in the Tables 4.1 to 4.18 and Figures 4.1 to 4.4.
4.1 Apparent Solidification Time (AST) test:
For conducting the AST test on the fat column in the Gerber butyrometer,
attempts were made to select the temperature at which the fat column takes
reasonably less time to get solidified. For this, experiments were conducted at 17 to
21°C (in a refrigerated water bath) on ten different pooled samples of cow and

42 Results and discussion
buffalo milks and the results obtained on the time taken by the fat column at different
temperatures are given in Tables 4.1 and 4.2.
Table 4.1 AST value (min-sec) of fat column in butyrometer for cow milk samples at
different temperatures
Table 4.2 AST value (min-sec) of fat column in butyrometer for buffalo milk samples
at different temperatures
It can be seen from the Table 4.1 that the time taken by the fat column at
temperatures of 21, 20, 19, 18 and 17°C in case of cow milk samples ranged from
Sample AST value (min-sec)
21°C 20°C 19°C 18°C 17°C
1 32-12 30-05 12-30 01-16 00-52
2 15-29 07-28 01-40 01-20 01-03
3 30-00 08-35 07-15 05-13 02-10
4 17-00 10-57 14-02 13-40 03-40
5 18-50 12-30 06-30 08-09 01-35
6 30-20 20-03 12-30 05-10 02-26
7 42-00 34-03 17-03 09-15 03-35
8 41-23 30-33 03-02 02-00 01-02
9 42-25 32-43 07-49 01-59 00-59
10 27-00 25-12 01-28 00-45 00-40
Mean±S.E. 29-56±03-20 21-21±03-35 08-38±02-12 05-27±01-36 02-20±00-21
Sample AST value (min-sec)
21°C 20°C 19°C 18°C 17°C
1 09-02 01-35 01-09 01-01 00-59
2 22-50 12-01 10-30 03-35 01-43
3 40-00 08-32 03-44 02-23 01-50
4 12-35 03-59 02-35 01-53 00-59
5 25-15 15-30 04-32 03-50 01-50
6 19-50 09-40 05-20 02-53 01-10
7 27-12 13-02 08-04 04-57 01-02
8 17-35 08-42 04-55 03-23 00-59
9 08-52 01-32 09-43 04-22 00-51
10 21-04 11-10 06-21 02-43 01-02
Mean±S.E. 18-55±03-21 08-57±01-52 06-09±00-57 03-01±00-22 01-24±00-07

43 Results and discussion
15-29 to 42-25, 07-28 to 34-03, 01-40 to 17-03, 00-45 to 13-40 and 00-40 to 03-40,
respectively with an average of 29-56±03-20, 21-21±03-35, 08-38±02-12, 05-27±01-
36 and 02-20±00-21, respectively. The corresponding values for buffalo milk
samples were found as 08-52 to 40-00, 01-32 to 15-30, 01-09 to 10-30, 01-01 to 04-
57 and 00-51 to 01-50, respectively with an average of 18-55±03-21, 08-57±01-52,
06-09±00-57, 03-01±00-22 and 01-24±00-07 respectively. Temperatures above 21
and 17°C were not taken up for the study because at 21°C the samples took
sufficient large, while at 17°C the samples took very less time to get apparently
solidified.
The study revealed that there are large variations in the AST values
among the samples at all the temperatures studied both for cow and buffalo milk
samples. Therefore, in order to understand the large variations in the AST values
observed for individual samples experiments were conducted on recording the AST
values for the same milk sample using different butyrometers of the same make.
These experiments, however, were carried out only at 18°C and the results so
obtained are given in Tables 4.3 and 4.4. It can be seen from these tables that for
the same milk samples there were large variations in the AST values, which may
possibly be due to the reason that the wall thickness of the butyrometers used in the
experiments may not be the same.
Table 4.3 AST value (min-sec) of fat column in butyrometers of same make for cow
milk samples at 18°C
Cow milk sample
AST value (min-sec) for different Gerber butyrometers
1 2 3 4 5 6 7 8 9 10
1 01-57 01-56 02-14 01-27 01-54 01-34 01-45 02-59 02-50 01-27
2 05-18 07-29 05-00 05-27 05-59 03-10 03-50 04-43 04-20 03-39
3 30-00 33-00 40-00 59-00 25-00 27-00 50-00 25-00 35-00 57-00
4 09-00 20-00 28-00 22-00 21-00 27-00 08-22 17-00 32-00 40-00
5 01-20 01-02 01-36 56-00 01-00 01-03 01-01 01-18 01-30 57-00
6 01-55 01-59 03-70 05-27 01-59 01-20 01-37 02-10 02-50 09-50

44 Results and discussion
Table 4.4 AST value (min-sec) of fat column in butyrometers of same make for
buffalo milk samples at 18°C
Therefore, keeping in view the very large variations observed for AST values
among the samples as well as among the butyrometers for the same sample, this
part of the study on AST test was not continued further for its application in detecting
the adulteration of milk with foreign oils and fats.
4.2 Complete liquefaction time (CLT) test:
After having encountered a problem of variations among the samples as well as
among the butyrometers for the same sample in case of AST test, only a limited
study restricted to one temperature (41°C) at which the milk fat is supposed to be
completely liquid was carried out. Only the pure cow and buffalo milk samples along
with milk samples adulterated at highest level of adulteration (20% on fat basis)
studied were taken up for this part of the study. The results thus obtained on the time
taken by fat column of the Gerber butyrometer for complete liquefaction for above
said samples are given in Table 4.5 and 4.6.
It can be clearly seen from the Tables 4.5 and 4.6 that although the average
values reveal a visible trend of decreasing and increasing CLT values with the
addition of vegetable oils and animal body fats respectively, but as noticed in case of
AST test here also it was observed that there were large variations among the
samples which again may possibly be due to the variations in the wall thickness of
the butyrometers used in the experiment.
Buffalo milk sample
AST value (min-sec) for different Gerber butyrometers
1 2 3 4 5 6 7 8 9 10
1 02-51 02-50 03-50 04-22 02-30 02-40 02-50 02-01 04-20 05-27
2 02-47 03-10 03-20 02-57 02-10 02-59 02-49 03-20 04-10 02-42
3 05-00 01-55 01-29 01-34 01-54 01-27 01-25 01-59 02-10 01-27
4 25-00 23-00 38-00 21-00 22-00 39-00 17-00 59-00 27-00 23-00
5 01-57 02-10 03-01 02-59 01-50 01-30 01-59 02-10 03-10 02-57
6 07-08 09-10 16-56 08-50 04-44 02-02 16-02 02-50 03-50 01-59
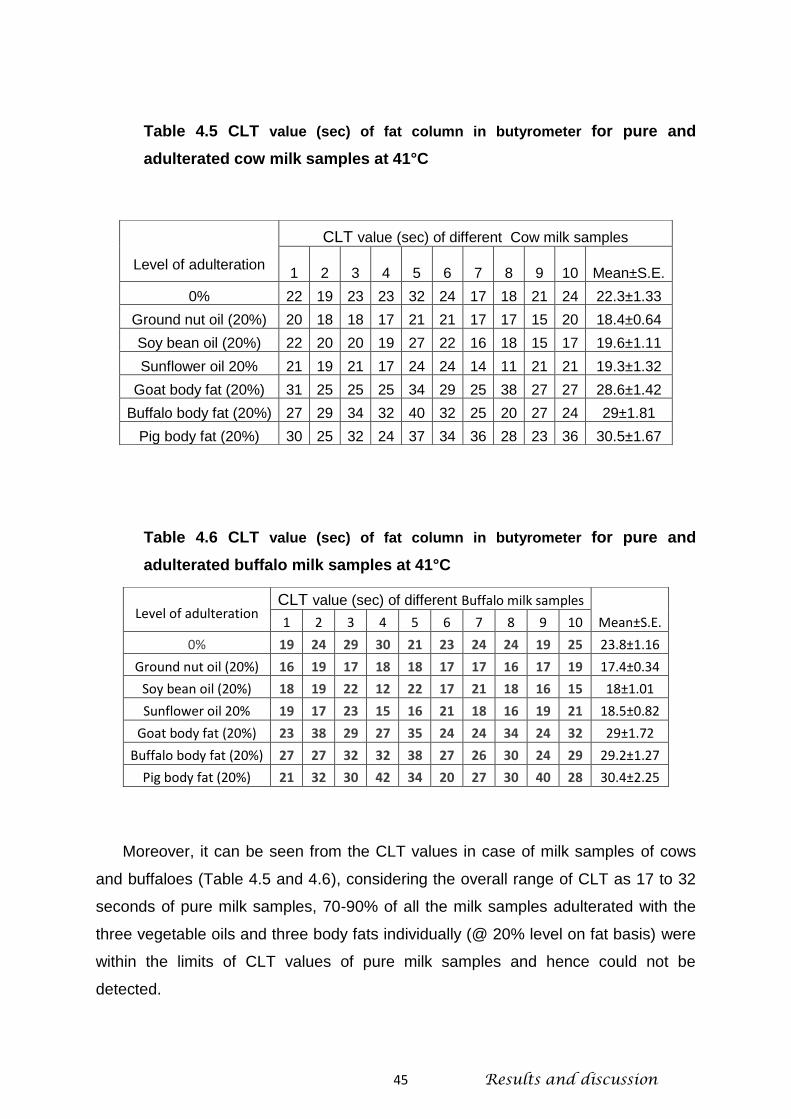
45 Results and discussion
Table 4.5 CLT value (sec) of fat column in butyrometer for pure and
adulterated cow milk samples at 41°C
Table 4.6 CLT value (sec) of fat column in butyrometer for pure and
adulterated buffalo milk samples at 41°C
Moreover, it can be seen from the CLT values in case of milk samples of cows
and buffaloes (Table 4.5 and 4.6), considering the overall range of CLT as 17 to 32
seconds of pure milk samples, 70-90% of all the milk samples adulterated with the
three vegetable oils and three body fats individually (@ 20% level on fat basis) were
within the limits of CLT values of pure milk samples and hence could not be
detected.
Level of adulteration
CLT value (sec) of different Cow milk samples
1 2 3 4 5 6 7 8 9 10 Mean±S.E.
0% 22 19 23 23 32 24 17 18 21 24 22.3±1.33
Ground nut oil (20%) 20 18 18 17 21 21 17 17 15 20 18.4±0.64
Soy bean oil (20%) 22 20 20 19 27 22 16 18 15 17 19.6±1.11
Sunflower oil 20% 21 19 21 17 24 24 14 11 21 21 19.3±1.32
Goat body fat (20%) 31 25 25 25 34 29 25 38 27 27 28.6±1.42
Buffalo body fat (20%) 27 29 34 32 40 32 25 20 27 24 29±1.81
Pig body fat (20%) 30 25 32 24 37 34 36 28 23 36 30.5±1.67
Level of adulteration CLT value (sec) of different Buffalo milk samples
Mean±S.E. 1 2 3 4 5 6 7 8 9 10
0% 19 24 29 30 21 23 24 24 19 25 23.8±1.16
Ground nut oil (20%) 16 19 17 18 18 17 17 16 17 19 17.4±0.34
Soy bean oil (20%) 18 19 22 12 22 17 21 18 16 15 18±1.01
Sunflower oil 20% 19 17 23 15 16 21 18 16 19 21 18.5±0.82
Goat body fat (20%) 23 38 29 27 35 24 24 34 24 32 29±1.72
Buffalo body fat (20%) 27 27 32 32 38 27 26 30 24 29 29.2±1.27
Pig body fat (20%) 21 32 30 42 34 20 27 30 40 28 30.4±2.25

46 Results and discussion
Therefore, it can be concluded from the above part of the study that the large
percentage of adulterated milk samples were failed to be detected by the CLT test
performed in a Gerber butyrometer, and hence this test cannot be recommended to
be used as a platform test for screening the milk for milk fat purity.
4.3 Butyro-refractometer (BR) readings of fat isolated from pure cow and
buffalo milks by heat clarification method and Gerber butyrometer method.
The results obtained on the Butyro-refractometer (BR) readings at 40°C of fat
isolated from pure cow and buffalo milks by heat clarification method and Gerber
butyrometer method are given in Table 4.7 and 4.8. It can be seen from these Tables
that the BR readings obtained by Gerber butyrometer method were lower as
compared to those obtained by heat clarification method. The BR readings in case of
Gerber butyrometer method are supressed probably due to the inherent hydrolytic
effect of Gerber sulphuric acid on the fat.
Table 4.7 shows that based on 60 cow milk samples, the BR reading of cow
milk fat isolated by heat clarification method ranged from 41.4 to 42.8 with an
average of 42.11±0.06. While the BR reading of cow milk fat isolated by Gerber
butyrometer method from the same 60 cow milk samples ranged from 38.1 to 39.8
with an average of 38.85±0.06.
Table 4.7 Butyro-refractometer (BR) readings of fat isolated from cow milk by
heat clarification method and Gerber butyrometer method.
Sample No.
BR Reading at 40°C
Heat Clarification Method
Gerber Butyrometer Method
1 41.8 38.6 2 41.9 38.9 3 42.2 38.4
4 42.8 39.4 5 41.8 38.5 6 41.9 39.3 7 42.2 38.7 8 42.7 39
9 41.9 38.2 10 42.2 39 11 41.9 38.9

47 Results and discussion
12 41.4 38.8
13 42.6 39.6 14 41.6 38.4 15 41.5 38.6
16 42.4 38.4
17 41.8 38.4
18 41.5 38.7
19 41.6 38.6 20 42.8 39.6 21 42.2 39.1 22 42.7 39.6
23 42.4 39 24 42.5 39 25 41.4 38.2
26 42.3 38.6
27 42.6 39
28 41.7 38.1 29 41.9 39.5 30 42.8 39.6
31 42.6 39.8 32 42.2 39
33 41.6 38.4
34 41.8 38.4 35 41.4 38.3
36 42.8 39 37 42.7 39.2 38 41.8 38.4
39 41.6 38.4
40 42.7 39.8 41 42.8 39.2
42 41.6 38.2
43 41.8 38.9 44 42 38.6 45 41.8 38.8
46 41.7 38.5 47 42.2 39
48 42.6 39.6
49 41.6 38.3 50 41.9 38.9 51 42.8 39.7 52 42.6 39 53 42.6 39.2
54 41.9 39 55 42.8 39
56 41.6 38.2 57 41.8 38.6 58 42 39
59 41.6 38.4 60 42.6 38.8
Mean±SE 42.11±0.06 38.85±0.06

48 Results and discussion
It can be seen from Table 4.8 that based on the 60 buffalo milk samples, the BR
reading of buffalo milk fat isolated by heat clarification method ranged from 40.00 to
42.4 with an average of 40.72±0.07. While the BR reading of buffalo milk fat isolated
by Gerber butyrometer method from the same 60 buffalo milk samples ranged from
36.4 to 39.2 with an average of 37.64±0.08.
Table 4.8 Butyro-refractometer (BR) readings of fat isolated from buffalo milk
by heat clarification method and Gerber butyrometer method.
Sample No.
BR Reading at 40°C Heat Clarification
Method Gerber Butyrometer
Method
1 40.6 38
2 40.3 37.8 3 41 37.5
4 40.1 37.4
5 40.4 38 6 41.3 37.8
7 40.2 37 8 42.1 39.2
9 40.2 36.8 10 40.8 38 11 42 39.1
12 40.5 37
13 40.8 37.6 14 40.4 37.2
15 40 37.2 16 40.3 38 17 40.6 38
18 41 37.8
19 40.4 37 20 41 38
21 40.7 37.8 22 40.1 37 23 42.2 39.1
24 40.2 37.1 25 40 36.5
26 40.4 37.2 27 40.4 37.4 28 40.2 37 29 41.8 38.8 30 40.3 36.4 31 40.8 37.4 32 40.3 37 33 40.2 37

49 Results and discussion
34 41.1 37.8
35 41.8 38.4 36 40.7 37.4 37 40.3 38
38 40.4 37 39 40 37
40 41 38
41 40.8 38 42 40.3 37.2 43 41.4 37.9 44 40.8 37.6
45 40.2 37.6 46 41.2 38.2 47 41 37.6
48 40.4 36.4
49 40.2 37.2
50 40.6 38 51 41.2 37.9 52 40.3 37
53 40.4 37.2 54 40.6 38
55 40.8 38
56 41 38 57 40.6 38.4
58 42.4 39.1 59 41.1 37.6 60 41.2 37.6
Mean±SE 40.72±0.07 37.64±0.08
When the data obtained on the BR readings of fat obtained from cow and buffalo
milks was combined together, it was observed that based on 120 milk samples (60
cow milk samples and 60 buffalo milk samples) the BR reading of fat isolated by heat
clarification method ranged from 40.0 to 42.8 (Tables 4.7& 4.8) with an average of
41.42 ± 0.08 (Table 4.9). Whereas, the BR reading of fat isolated by Gerber
butyrometer method ranged from 36.4 to 39.8 (Tables 4.7& 4.8) with an average of
(Table 4.9) 38.25 ± 0.07.
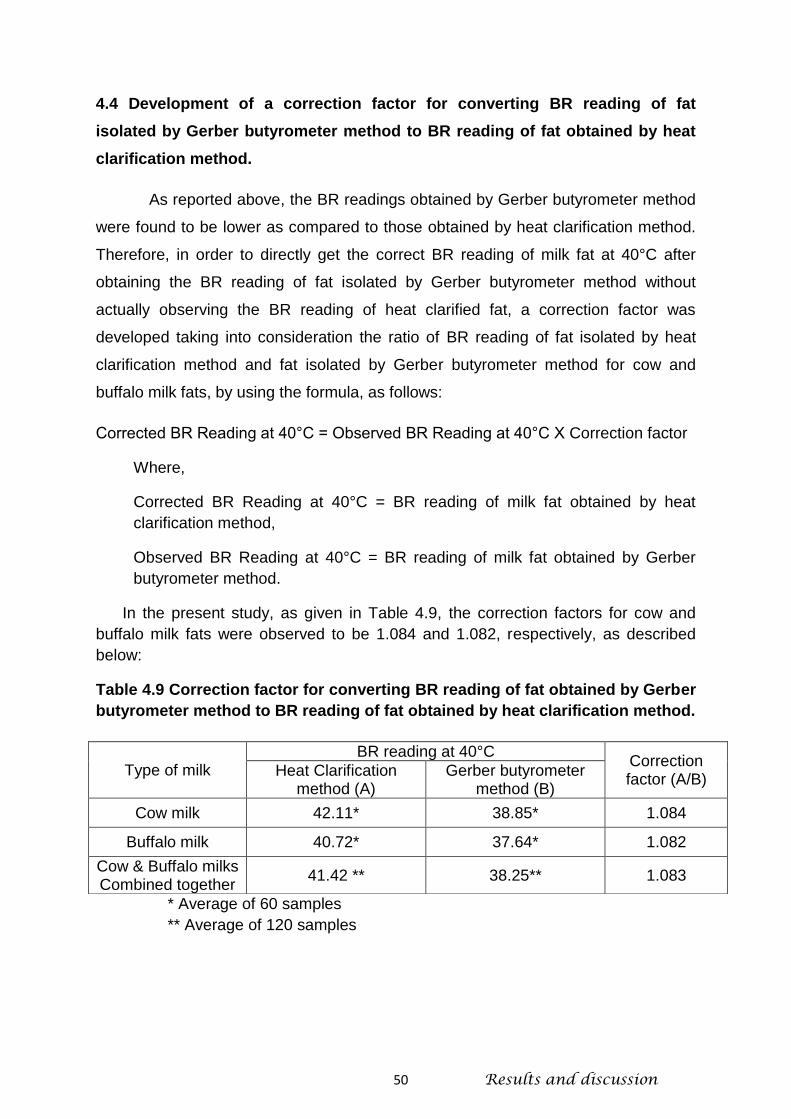
50 Results and discussion
4.4 Development of a correction factor for converting BR reading of fat
isolated by Gerber butyrometer method to BR reading of fat obtained by heat
clarification method.
As reported above, the BR readings obtained by Gerber butyrometer method
were found to be lower as compared to those obtained by heat clarification method.
Therefore, in order to directly get the correct BR reading of milk fat at 40°C after
obtaining the BR reading of fat isolated by Gerber butyrometer method without
actually observing the BR reading of heat clarified fat, a correction factor was
developed taking into consideration the ratio of BR reading of fat isolated by heat
clarification method and fat isolated by Gerber butyrometer method for cow and
buffalo milk fats, by using the formula, as follows:
Corrected BR Reading at 40°C = Observed BR Reading at 40°C Χ Correction factor
Where,
Corrected BR Reading at 40°C = BR reading of milk fat obtained by heat
clarification method,
Observed BR Reading at 40°C = BR reading of milk fat obtained by Gerber
butyrometer method.
In the present study, as given in Table 4.9, the correction factors for cow and
buffalo milk fats were observed to be 1.084 and 1.082, respectively, as described
below:
Table 4.9 Correction factor for converting BR reading of fat obtained by Gerber
butyrometer method to BR reading of fat obtained by heat clarification method.
* Average of 60 samples
** Average of 120 samples
Type of milk BR reading at 40°C
Correction factor (A/B)
Heat Clarification method (A)
Gerber butyrometer method (B)
Cow milk 42.11* 38.85* 1.084
Buffalo milk 40.72* 37.64* 1.082
Cow & Buffalo milks Combined together
41.42 ** 38.25** 1.083

51 Results and discussion
Cow milk fat
Corrected BR Reading at 40°C (42.11) = Observed BR Reading at 40°C (38.85) Χ
Correction factor (1.084)
Buffalo milk fat
Corrected BR Reading at 40°C (40.72) = Observed BR Reading at 40°C (37.62) Χ
Correction factor (1.082)
Since in the market, generally the supply of liquid milk is comprised of mixture of
cow and buffalo milks, therefore it was felt appropriate to work out a correction factor
which can be applied to individual cow or buffalo milk or mixture thereof for
converting the observed Gerber butyrometer fat BR Reading to that of heat clarified
fat. Therefore, the formula based on total of 120 Cow & Buffalo milk samples
Combined together is given below:
Cow & Buffalo milks Combined together: Corrected BR Reading at 40°C (41.42) = Observed BR Reading at 40°C (38.25) Χ
Correction factor (1.083)
In an earlier study, Arora et al (1996) and Lal et al (1998) have also developed a
similar correction factor of 1.08 for converting the observed BR Reading at 40°C to
actual BR Reading at 40°C. However, Boghra and Borkhatriya (2004) have reported
a correction factor of 1.0909 and reported that such a deviation in correction factor in
their study might be attributed to variations in nature and types of fatty acids in milk
specific to region, breed, and species of the animals as well as the feeding practices
followed. The results obtained in present investigation are in general agreement with
the findings of above workers.
In the present study, the BR reading of the milk fat, whether obtained by heat
clarification method or by Gerber butyrometer method, was observed to be higher in
case of cow milk than buffalo milk. This difference may be attributed to the species
characteristics as the milk samples were collected from cows and buffaloes
maintained at the institute under identical conditions of feeding and management.
Similar differences between the BR readings of the milk fats of the two species have
also been reported by earlier workers (Bector and Narayanan, 1974; Lal and
Narayanan, 1984; Ashvinkumar, 2010 ; Kumar et al, 2011 )
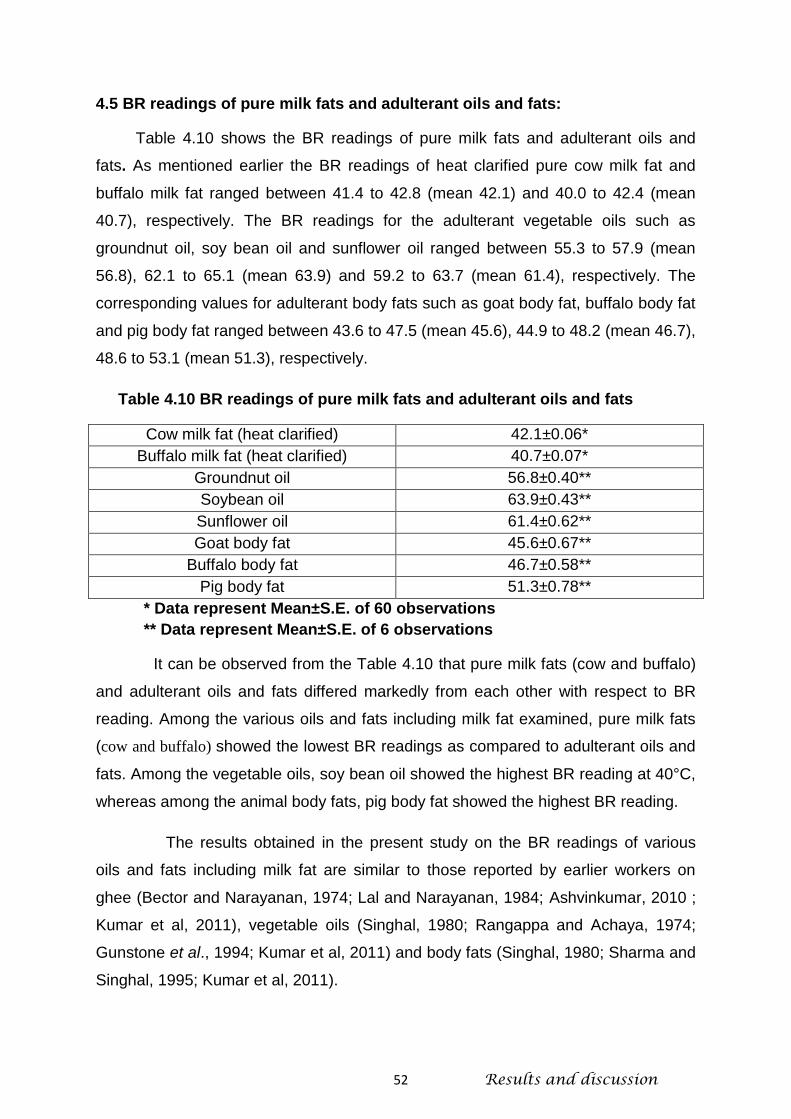
52 Results and discussion
4.5 BR readings of pure milk fats and adulterant oils and fats:
Table 4.10 shows the BR readings of pure milk fats and adulterant oils and
fats. As mentioned earlier the BR readings of heat clarified pure cow milk fat and
buffalo milk fat ranged between 41.4 to 42.8 (mean 42.1) and 40.0 to 42.4 (mean
40.7), respectively. The BR readings for the adulterant vegetable oils such as
groundnut oil, soy bean oil and sunflower oil ranged between 55.3 to 57.9 (mean
56.8), 62.1 to 65.1 (mean 63.9) and 59.2 to 63.7 (mean 61.4), respectively. The
corresponding values for adulterant body fats such as goat body fat, buffalo body fat
and pig body fat ranged between 43.6 to 47.5 (mean 45.6), 44.9 to 48.2 (mean 46.7),
48.6 to 53.1 (mean 51.3), respectively.
Table 4.10 BR readings of pure milk fats and adulterant oils and fats
Cow milk fat (heat clarified) 42.1±0.06*
Buffalo milk fat (heat clarified) 40.7±0.07*
Groundnut oil 56.8±0.40**
Soybean oil 63.9±0.43**
Sunflower oil 61.4±0.62**
Goat body fat 45.6±0.67**
Buffalo body fat 46.7±0.58**
Pig body fat 51.3±0.78**
* Data represent Mean±S.E. of 60 observations
** Data represent Mean±S.E. of 6 observations
It can be observed from the Table 4.10 that pure milk fats (cow and buffalo)
and adulterant oils and fats differed markedly from each other with respect to BR
reading. Among the various oils and fats including milk fat examined, pure milk fats
(cow and buffalo) showed the lowest BR readings as compared to adulterant oils and
fats. Among the vegetable oils, soy bean oil showed the highest BR reading at 40°C,
whereas among the animal body fats, pig body fat showed the highest BR reading.
The results obtained in the present study on the BR readings of various
oils and fats including milk fat are similar to those reported by earlier workers on
ghee (Bector and Narayanan, 1974; Lal and Narayanan, 1984; Ashvinkumar, 2010 ;
Kumar et al, 2011), vegetable oils (Singhal, 1980; Rangappa and Achaya, 1974;
Gunstone et al., 1994; Kumar et al, 2011) and body fats (Singhal, 1980; Sharma and
Singhal, 1995; Kumar et al, 2011).

53 Results and discussion
4.6 BR Reading of Gerber butyrometer fat and heat clarified fat obtained from
pure cow milk and cow milk adulterated with vegetable oils and animal body
fats.
Tables 4.11 and 4.12 show the BR readings at 40°C of Gerber butyrometer fat
and heat clarified fat isolated from pure cow milk and cow milk adulterated with three
vegetable oils (groundnut oil, soybean oil and sunflower oil) and three animal body
fats (Goat body fat, buffalo body fat and pig body fat) at 5, 10, 15 and 20 per cent
levels on the basis of fat content.
It can be seen from Table 4.11 that the BR readings of fat obtained by Gerber
butyrometer method in case of groundnut oil added to cow milk at 0, 5, 10 , 15, and
20 per cent levels (on fat basis) was observed to be 38.8, 39.44, 40.22, 40.84 and
41.79, respectively. After applying a general correction factor of 1.083 (a correction
factor based on the observations of BR readings of cow and buffalo milk fats
obtained by Gerber butyrometer method and heat clarification method, as described
earlier in section 4.4), the corresponding corrected BR readings of these samples
were found to be 42.02, 42.71, 43.56, 44.23 and 45.26, respectively. Whereas, the
BR readings of these samples obtained by heat clarification method were found to
be 42.14, 42.81, 43.75, 44.24, 45.36, respectively. This indicated that BR readings of
the milk fat samples were increased with increasing level of adulteration of
groundnut oil.
The BR readings of fat obtained by Gerber butyrometer method in case of soy
bean oil added to cow milk at 0, 5, 10 , 15, and 20 per cent levels (on fat basis) was
observed to be 38.8, 39.8, 40.79, 41.82 and 43.04, respectively. After applying a
general correction factor of 1.083, the corresponding corrected BR readings of these
samples were found to be 42.02, 43.10, 44.17, 45.29 and 46.61, respectively.
Whereas, the BR readings of these samples obtained by heat clarification method
were found to be 41.91, 43.32, 44.53, 45.4, 46.8, respectively (Table 4.4). Here also,
it was observed that higher the level of adulteration of milk fat with soy bean oil,
higher were the BR readings.
The BR readings of fat obtained by Gerber butyrometer method in case of
sunflower oil added to cow milk on the basis of fat at 0, 5, 10 , 15, and 20 per cent

54 Results and discussion
Table 4.11 BR Reading of Gerber butyrometer fat and heat clarified fat obtained from pure cow milk and cow milk adulterated with
vegetable oils.
Level Of Adulteration
BR Reading at 40°C
Groundnut oil Soybean oil Sunflower oil
Gerber Butyrometer
method (A)
Corrected value
( AΧ1.083)
Heat Clarification
method
Gerber Butyrometer
method (A)
Corrected value
( AΧ1.083)
Heat Clarification
method
Gerber Butyrometer
method (A)
Corrected value
( AΧ1.083)
Heat Clarification
method
0% 38.8±0.13 42.02±0.13 42.14±0.12 38.8±0.14 42.02±0.16 41.91±0.16 38.97±0.17 42.20±0.18 42.25±0.15
5% 39.44±0.15 42.71±0.12 42.81±0.13 39.8±0.12 43.10±0.14 43.32±0.17 39.68±0.16 42.97±0.18 43.10±0.21
10% 40.22±0.16 43.56±0.18 43.75±0.07 40.79.±0.08 44.17±0.10 44.53±0.17 40.35±0.19 43.70±0.21 43.83±0.17
15% 40.84±0.20 44.23±0.23 44.24±0.18 41.82±0.15 45.29±0.17 45.4±0.18 41.20±0.09 44.62±0.10 44.76±0.11
20% 41.79±0.11 45.26±0.12 45.36±0.14 43.04±0.06 46.61±0.08 46.8±0.20 41.91±0.15 45.39±0.17 45.6±0.21
The data represents Mean ± S.E. of 10 observations
55 Results and discussion
levels was observed to be 38.97, 39.68, 40.35, 41.20 and 41.91, respectively. After
applying a general correction factor of 1.083, the corresponding corrected BR
readings of these samples were found to be 42.20, 42.97, 43.70, 44.62 and 45.39,
respectively. Whereas, the BR readings of these samples obtained by heat
clarification method were found to be 42.25, 43.10, 43.83, 44.76 and 45.6,
respectively (Table 4.11). As noted earlier for groundnut oil and soy bean oil, the
same pattern of increase in BR reading with increased level of adulteration was
observed in case of sunflower oil also.
Table 4.12 shows the BR readings at 40°C of Gerber butyrometer fat and heat
clarified fat isolated from pure cow milk and cow milk adulterated with three animal
body fats (Goat body fat, buffalo body fat and pig body fat) at 5, 10, 15 and 20 per
cent levels.
It can be seen from Table 4.12 that the BR readings of fat obtained by Gerber
butyrometer method in case of goat body fat added to cow milk at 0, 5, 10 , 15, and
20 per cent levels (on the basis of fat content) was observed to be 38.87, 38.89,
38.96, 39.38 and 39.91, respectively. After applying a general correction factor of
1.083, the corresponding corrected BR readings of these samples were found to be
42.10, 42.11, 42.20, 42.65 and 43.22, respectively. Whereas, the BR readings of
these samples obtained by heat clarification method were found to be 42.12, 42.24,
42.32, 42.78, 43.42, respectively. This indicated that BR readings of the milk fat
samples were only slightly increased with increasing level of adulteration goat body
fat.
The BR readings of fat obtained by Gerber butyrometer method in case of buffalo
body fat added to cow milk at 0, 5, 10 , 15, and 20 per cent levels was observed to
be 38.8, 38.82, 39.23, 39.31 and 40.26, respectively. After applying a general
correction factor of 1.083, the corresponding corrected BR readings of these
samples were found to be 42.02, 42.04, 42.48, 42.57 and 43.60, respectively.
Whereas, the BR readings of these samples obtained by heat clarification method
were found to be 42.00, 42.16, 42.54, 42.78, 43.73, respectively (Table 4.12). Here
also, it was observed that BR readings of the milk fat samples were only slightly
increased with increasing level of adulteration buffalo body fat.

56 Results and discussion
Table 4.12 BR Reading of butyrometer fat and heat clarified fat obtained from pure cow milk and cow milk adulterated with animal
body fats.
The data represents Mean ± S.E. of 10 observations
Level Of Adulteration
BR Reading at 40°C
Goat body fat Buffalo body fat Pig body fat
Gerber Butyrometer
method (A)
Corrected value
( AΧ1.083)
Heat Clarification
method
Gerber Butyrometer
method (A)
Corrected value
( AΧ1.083)
Heat Clarification
method
Gerber Butyrometer
method (A)
Corrected value
( AΧ1.083)
Heat Clarification
method
0% 38.87±0.18 42.10±0.20 42.12±0.17 38.8±0.13 42.02±0.14 42.0±0.13 38.89±0.14 42.12±0.15 42.23±0.16
5% 38.89±0.12 42.11±o.13 42.24±0.11 38.82±0.17 42.04±0.19 42.16±0.16 39.18±0.07 42.44±0.08 42.51±0.18
10% 38.96±0.13 42.20±0.14 42.32±0.05 39.23±0.10 42.48±0.12 42.54±0.15 39.31±0.09 42.57±0.11 42.94±0.19
15% 39.38±0.11 42.65±0.13 42.78±0.11 39.31±0.10 42.57±0.12 42.78±0.20 40.06±-0.11 43.31±0.13 43.51±0.18
20% 39.91±0.10 43.22±012 43.42±0.10 40.26±0.12 43.60±0.14 43.73±0.17 40.61±0.09 43.98±0.11 44.1±0.14

57 Results and discussion
The BR readings of fat obtained by Gerber butyrometer method in case of pig
body fat added to cow milk at 0, 5, 10 , 15, and 20 per cent levels was observed to
be 38.89, 39.18, 39.31, 40.06 and 40.61, respectively. After applying a general
correction factor of 1.083, the corresponding corrected BR readings of these
samples were found to be 42.12, 42.44, 42.57, 43.31 and 43.98, respectively.
Whereas, the BR readings of these samples obtained by heat clarification method
were found to be 42.23, 42.51, 42.94, 43.51, 44.1, respectively (Table 4.12). As
noted earlier for goat body fat and buffalo body fat, the same pattern of only a small
increase in BR reading with increased level of adulteration was observed in case of
pig body fat also.
4.7 BR Reading of Gerber butyrometer fat and heat clarified fat obtained from
pure buffalo milk and buffalo milk adulterated with vegetable oils and animal
body fats.
Table 4.13 shows the BR readings at 40°C of Gerber butyrometer fat and heat
clarified fat isolated from pure buffalo milk and buffalo milk adulterated with three
vegetable oils (groundnut oil, soybean oil and sunflower oil) and three animal body
fats (Goat body fat, buffalo body fat and pig body fat) at 5, 10, 15 and 20 per cent
levels on the basis of fat content.
It can be seen from Table 4.13 that the BR readings of fat obtained by Gerber
butyrometer method in case of buffalo milk added with groundnut oil at 0, 5, 10 , 15,
and 20 per cent levels was observed to be 37.75, 37.92, 39.07, 39.52 and 40.6,
respectively. After applying a general correction factor of 1.083 (a correction factor
based on the observations of BR readings of cow and buffalo milk fats obtained by
Gerber butyrometer method and heat clarification method, as described earlier in
section 4.4), the corresponding corrected BR readings of these samples were found
to be 40.88, 41.06, 42.31, 42.80 and 43.97, respectively. Whereas, the BR readings
of these samples obtained by heat clarification method were found to be 40.7, 41.10,
42.38, 43.04, 44.1, respectively. This indicated that BR readings of the milk fat
samples were increased with increasing level of adulteration of groundnut oil.
Table 4.13 shows the BR readings of fat obtained by Gerber butyrometer method in
case of buffalo milk added with soy bean oil at 0, 5, 10 , 15, and 20 per cent levels
was observed to be 37.69, 38.52, 39.84, 40.36 and 41.21, respectively. After
applying a general correction factor of 1.083, the corresponding corrected BR

58 Results and discussion
Table 4.13 BR Reading of butyrometer fat and heat clarified fat obtained from pure buffalo milk and buffalo milk adulterated with
vegetable oils
The data represents Mean ± S.E. of 10 observations
Level Of Adulteration
BR Reading at 40°C
Groundnut Oil Soybean Oil Sunflower Oil
Gerber Butyrometer
method (A)
Corrected value
( AΧ1.083)
Heat Clarification
method
Gerber Butyrometer
method (A)
Corrected value
( AΧ1.083)
Heat Clarification
method
Gerber Butyrometer
method (A)
Corrected value
( AΧ1.083)
Heat Clarification
method
0% 37.75±0.20 40.88±0.17 40.7±0.20 37.69±0.20 40.82±0.16 40.7±0.17 37.43±0.29 40.56±0.24 40.63 ±0.24
5% 37.92±0.17 41.06±0.13 41.10±0.11 38.52±0.13 41.72±0.18 41.78±0.12 37.92±0.18 41.06±0.11 41.13±0.22
10% 39.07±0.11 42.31±0.09 42.38±0.10 39.84±0.11 43.14±0.21 43.19±0.21 38.7±0.24 41.91±0.21 42.14±0.21
15% 39.52±0.17 42.80±0.21 43.04±0.09 40.36±0.24 43.71±0.08 43.93±0.18 39.61±0.22 42.90±0.18 42.94±0.26
20% 40.6±0.31 43.97±0.10 44.1±0.06 41.21±0.18 44.63±0.28 44.94±0.16 40.88±0.26 44.27±0.13 44.86±0.33

59 Results and discussion
readings of these samples were found to be 40.82, 41.76, 43.14, 43.71 and 44.63,
respectively. Whereas, the BR readings of these samples obtained by heat
clarification method were found to be 40.7, 41.78, 43.19, 43.93, 44.94, respectively.
Here also, it was observed that higher the level of adulteration of milk fat with soy
bean oil, higher were the BR readings.
From Table 4.13, it can be seen that the BR readings of fat obtained by
Gerber butyrometer method in case of buffalo milk added with sunflower oil at 0, 5,
10 , 15, and 20 per cent levels was observed to be 37.43, 37.92, 38.7, 39.61 and
40.88, respectively. After applying a general correction factor of 1.083, the
corresponding corrected BR readings of these samples were found to be 40.56,
41.06, 41.91, 42.90 and 44.27, respectively. Whereas, the BR readings of these
samples obtained by heat clarification method were found to be 40.63, 41.13, 42.14,
42.94, 44.86, respectively. As noted earlier for groundnut oil and soy bean oil, the
same pattern of increase in BR reading with increased level of adulteration was
observed in case of sunflower oil also.
Table 4.14 shows the BR readings at 40 C of Gerber butyrometer fat and
heat clarified fat isolated from pure buffalo milk and buffalo milk adulterated with
three animal body fats (Goat body fat, buffalo body fat and pig body fat) at 5, 10, 15
and 20 per cent levels.
The BR readings of fat obtained by Gerber butyrometer method in case of buffalo
milk added with goat body fat at 0, 5, 10 , 15, and 20 per cent levels was observed to
be 37.5, 37.61, 38.08, 38.39 and 38.64, respectively. After applying a general
correction factor of 1.083, the corresponding corrected BR readings of these
samples were found to be 40.61, 40.73, 41.24, 41.57 and 41.85, respectively.
Whereas, the BR readings of these samples obtained by heat clarification method
were found to be 40.66, 40.82, 41.25, 41.59, 41.96, respectively (Table 4.14). This
indicated that BR readings of the milk fat samples were only slightly increased with
increasing level of adulteration goat body fat.
As shown in Table 4.14, the BR readings of fat obtained by Gerber
butyrometer method in case of buffalo milk added with buffalo body fat at 0, 5, 10 ,
15, and 20 per cent levels was observed to be 37.57, 37.58, 37.82, 38.19 and 38.7,
respectively. After applying a general correction factor of 1.083, the corresponding

60 Results and discussion
Table 4.14 BR Reading of butyrometer fat and heat clarified fat obtained from pure buffalo milk and buffalo milk adulterated with
animal body fats.
The data represents Mean ± S.E. of 10 observations
Level Of Adulteration
BR Reading at 40°C
Goat Body Fat Buffalo Body Fat Pig Body Fat
Gerber Butyrometer
method (A)
Corrected value
( AΧ1.083)
Heat Clarification
method
Gerber Butyrometer
method (A)
Corrected value
( AΧ1.083)
Heat Clarification
method
Gerber Butyrometer
method (A)
Corrected value
( AΧ1.083)
Heat Clarification
method
0% 37.5±0.17 40.61±0.10 40.66±0.17 37.57±0.17 40.69±0.31 40.69±0.14 37.88±0.18 41.02±0.32 40.96±0.19
5% 37.61±0.08 40.73±0.16 40.82±0.15 37.58±0.12 40.70±0.20 40.74±0.15 37.92±0.20 41.07±0.07 41.12±0.21
10% 38.08±0.07 41.24±0.21 41.25±0.15 37.82±0.09 40.95±0.16 40.98±0.16 38.15±0.19 41.31±0.23 41.42±0.18
15% 38.39±0.10 41.57±0.17 41.59±0.15 38.19±0.09 41.35±0.29 41.47±0.16 38.59±0.17 41.80±0.16 41.83±0.18
20% 38.64±0.06 41.85±0.09 41.96±0.10 38.7±0.13 41.91±0.09 42.06±0.19 39.26±0.19 42.52±0.11 42.95±0.21
61 Results and discussion
corrected BR readings of these samples were found to be 40.69, 40.70, 40.95,
41.35 and 41.91, respectively. Whereas, the BR readings of these samples
obtained by heat clarification method were found to be 40.69, 40.74, 40.98,
41.47, 42.06, respectively. Here also, it was observed that BR readings of the
milk fat samples were only slightly increased with increasing level of adulteration
buffalo body fat.
The BR readings of fat obtained by Gerber butyrometer method in case of
buffalo milk pig body fat at 0, 5, 10 , 15, and 20 per cent levels was observed to
be 37.88, 37.92, 38.15, 38.59 and 39.26, respectively. After applying a general
correction factor of 1.083, the corresponding corrected BR readings of these
samples were found to be 41.02, 41.07, 41.31 41.80 and 42.52, respectively.
Whereas, the BR readings of these samples obtained by heat clarification
method were found to be 40.96, 41.12, 41.42, 41.83, 42.95, respectively (Table
4.14). As noted earlier for goat body fat and buffalo body fat, the same pattern of
only a small increase in BR reading with increased level of adulteration was
observed in case of pig body fat also.
As the study was planned to detect adulteration of fat in milk using specially
designed dual purpose Gerber butyrometer, therefore, the corrected BR readings
using Gerber butyrometer method were used in the present investigation for
detecting adulteration of fat in milk with foreign fats and oils. However, the results
thus obtained were compared with those obtained by using heat clarification
method. Hence, keeping in view the general range of BR reading of milk fat as
40.0 to 43.0, it was revealed from the results obtained in the present study on the
corrected BR readings using Gerber butyrometer method (Tables 4.11 to 4.14)
that adulteration of cow milk with vegetable oils was detectable at all the
adulteration levels studied, except groundnut oil and sunflower oil at 5% level of
adulteration (on fat basis). Almost similar results were obtained by heat
clarification method except in case of sunflower oil for which 5% adulteration (on
fat basis) was not detectable by Gerber butyrometer method (corrected
BR=42.97) but was detectable by heat clarification method (BR=43.10).
However, adulteration of cow milk with animal body fats was not detectable below
20 % level of adulteration (on fat basis), except pig body fat which was detectable
62 Results and discussion
even at 15% level. These observations were also supported by the results
obtained on the BR readings of corresponding heat clarified fat.
On the other hand, adulteration of buffalo milk with vegetable oils was not
detectable below 20 % level of adulteration (on fat basis) except soy bean oil
which was detectable even at 10% level. Almost similar results were obtained by
heat clarification method except in case of groundnut oil for which 15%
adulteration (on fat basis) was not detectable by Gerber butyrometer method
(corrected BR=42.8) but was detectable by heat clarification method (BR=43.04).
Similarly, adulteration of buffalo milk with animal body fats was not detectable at
all the levels studied. These results were also supported by BR readings of
corresponding heat clarified fat.
Very few studies have been carried out in the past on the detection of
adulteration of foreign fats added directly in milk using BR readings of fat isolated
by Gerber butyrometer method. Arora et al. (1996), in their study on the detection
of mustard oil added to milk using specially designed dual purpose Gerber
butyrometer, reported that adulteration at the level of 10 percent (on fat basis)
can be detected. Similarly, Boghra and Borkhatriya (2004), while studying the
detection of vegetable oils in milk and milk fat by a rapid method using Gerber
butyrometer, reported that adulteration of mixed milk or buffalo milk having 2
percent fat with 1 percent cottonseed oil (amounting to 50 percent adulteration on
fat basis) can be detected without suspicion. However, in the present study using
Gerber butyrometer method, adulteration of cow milk with vegetable oils was
detectable at all the adulteration levels studied, except groundnut oil and
sunflower oil at 5% level of adulteration (on fat basis). Whereas in case of buffalo
milk, adulteration with vegetable oils was not detectable below 20 % level of
adulteration (on fat basis) except soy bean oil which was detectable even at 10%
level. In the present study, using BR reading, it was possible to detect 5% soy
bean oil in case of cow milk and 10% soy bean oil in case of buffalo milk as
against other vegetable oils where higher than these levels were detectable.
Such differences could be ascribed to higher BR reading of soy bean oil (63.9) as
compared to lower BR reading of groundnut oil (56.8) and sunflower oil (61.4). As
such there are no reports available in the literature on the detection of animal
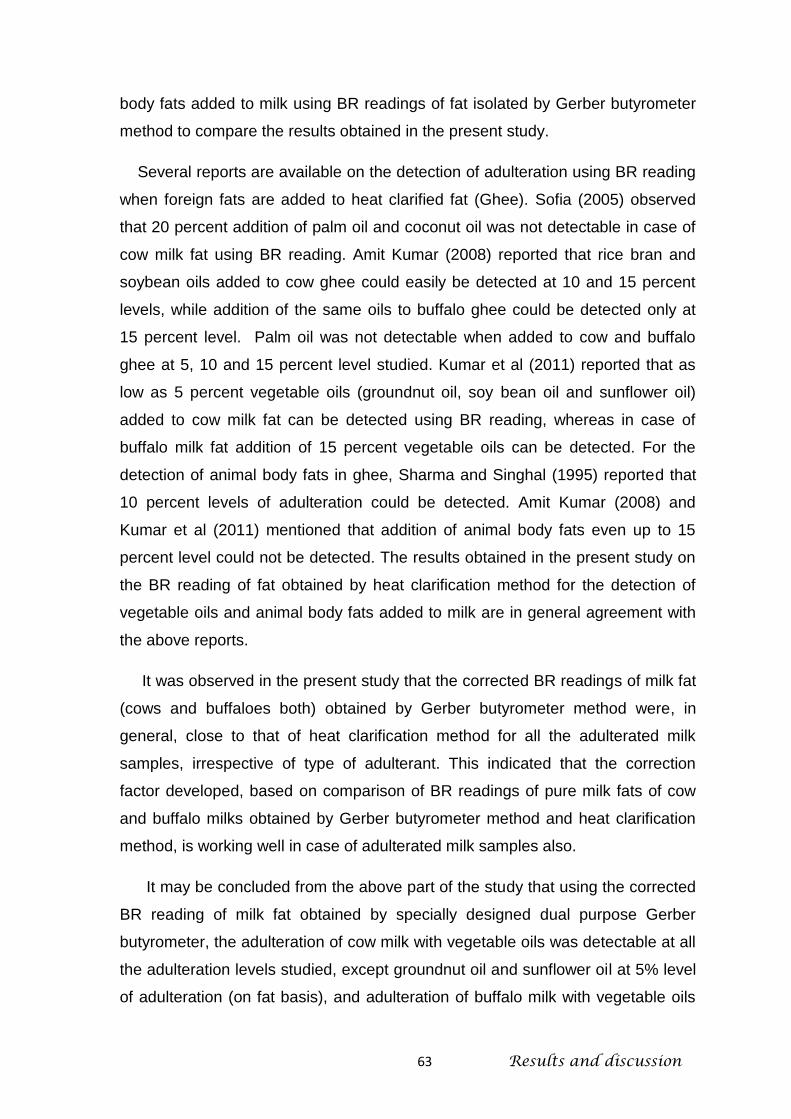
63 Results and discussion
body fats added to milk using BR readings of fat isolated by Gerber butyrometer
method to compare the results obtained in the present study.
Several reports are available on the detection of adulteration using BR reading
when foreign fats are added to heat clarified fat (Ghee). Sofia (2005) observed
that 20 percent addition of palm oil and coconut oil was not detectable in case of
cow milk fat using BR reading. Amit Kumar (2008) reported that rice bran and
soybean oils added to cow ghee could easily be detected at 10 and 15 percent
levels, while addition of the same oils to buffalo ghee could be detected only at
15 percent level. Palm oil was not detectable when added to cow and buffalo
ghee at 5, 10 and 15 percent level studied. Kumar et al (2011) reported that as
low as 5 percent vegetable oils (groundnut oil, soy bean oil and sunflower oil)
added to cow milk fat can be detected using BR reading, whereas in case of
buffalo milk fat addition of 15 percent vegetable oils can be detected. For the
detection of animal body fats in ghee, Sharma and Singhal (1995) reported that
10 percent levels of adulteration could be detected. Amit Kumar (2008) and
Kumar et al (2011) mentioned that addition of animal body fats even up to 15
percent level could not be detected. The results obtained in the present study on
the BR reading of fat obtained by heat clarification method for the detection of
vegetable oils and animal body fats added to milk are in general agreement with
the above reports.
It was observed in the present study that the corrected BR readings of milk fat
(cows and buffaloes both) obtained by Gerber butyrometer method were, in
general, close to that of heat clarification method for all the adulterated milk
samples, irrespective of type of adulterant. This indicated that the correction
factor developed, based on comparison of BR readings of pure milk fats of cow
and buffalo milks obtained by Gerber butyrometer method and heat clarification
method, is working well in case of adulterated milk samples also.
It may be concluded from the above part of the study that using the corrected
BR reading of milk fat obtained by specially designed dual purpose Gerber
butyrometer, the adulteration of cow milk with vegetable oils was detectable at all
the adulteration levels studied, except groundnut oil and sunflower oil at 5% level
of adulteration (on fat basis), and adulteration of buffalo milk with vegetable oils
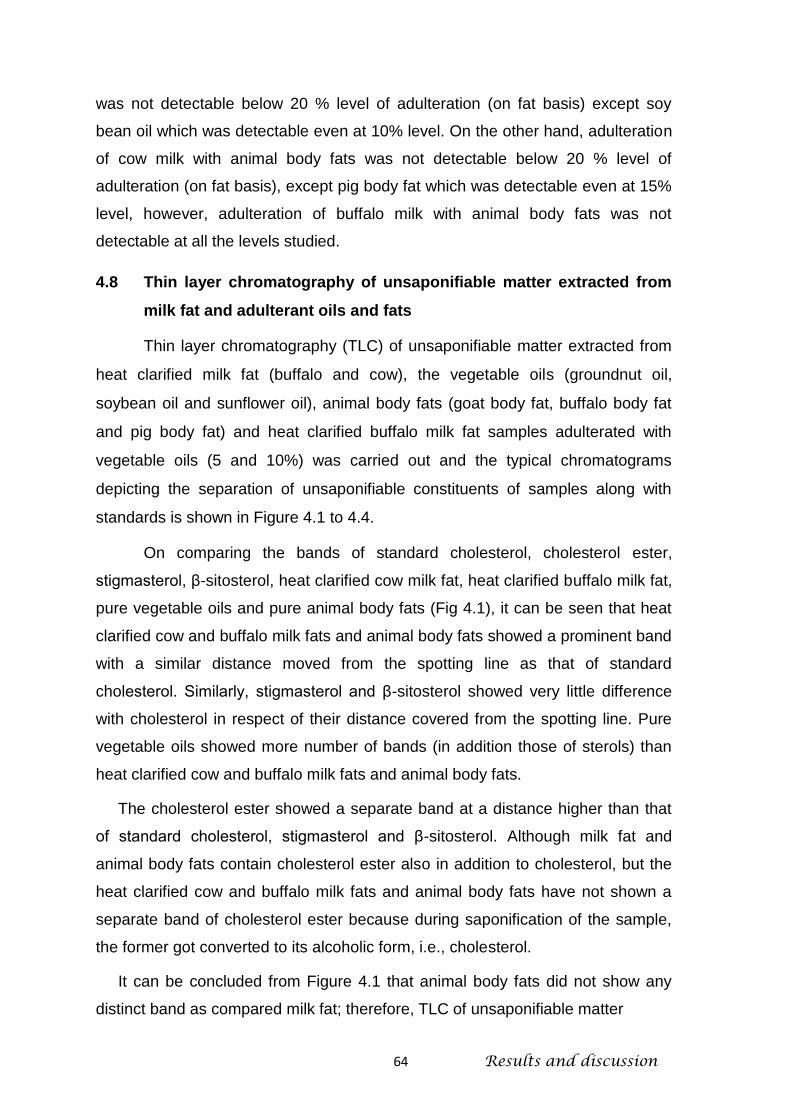
64 Results and discussion
was not detectable below 20 % level of adulteration (on fat basis) except soy
bean oil which was detectable even at 10% level. On the other hand, adulteration
of cow milk with animal body fats was not detectable below 20 % level of
adulteration (on fat basis), except pig body fat which was detectable even at 15%
level, however, adulteration of buffalo milk with animal body fats was not
detectable at all the levels studied.
4.8 Thin layer chromatography of unsaponifiable matter extracted from
milk fat and adulterant oils and fats
Thin layer chromatography (TLC) of unsaponifiable matter extracted from
heat clarified milk fat (buffalo and cow), the vegetable oils (groundnut oil,
soybean oil and sunflower oil), animal body fats (goat body fat, buffalo body fat
and pig body fat) and heat clarified buffalo milk fat samples adulterated with
vegetable oils (5 and 10%) was carried out and the typical chromatograms
depicting the separation of unsaponifiable constituents of samples along with
standards is shown in Figure 4.1 to 4.4.
On comparing the bands of standard cholesterol, cholesterol ester,
stigmasterol, β-sitosterol, heat clarified cow milk fat, heat clarified buffalo milk fat,
pure vegetable oils and pure animal body fats (Fig 4.1), it can be seen that heat
clarified cow and buffalo milk fats and animal body fats showed a prominent band
with a similar distance moved from the spotting line as that of standard
cholesterol. Similarly, stigmasterol and β-sitosterol showed very little difference
with cholesterol in respect of their distance covered from the spotting line. Pure
vegetable oils showed more number of bands (in addition those of sterols) than
heat clarified cow and buffalo milk fats and animal body fats.
The cholesterol ester showed a separate band at a distance higher than that
of standard cholesterol, stigmasterol and β-sitosterol. Although milk fat and
animal body fats contain cholesterol ester also in addition to cholesterol, but the
heat clarified cow and buffalo milk fats and animal body fats have not shown a
separate band of cholesterol ester because during saponification of the sample,
the former got converted to its alcoholic form, i.e., cholesterol.
It can be concluded from Figure 4.1 that animal body fats did not show any
distinct band as compared milk fat; therefore, TLC of unsaponifiable matter

65 Results and discussion
Fig. 4.1 TLC of unsaponifiable matter of pure milk fat and adulterants along with
standards.
cannot used to differentiate these two types of fats. Whereas, in case of
vegetable oils, in addition to sterols some additional bands were observed. Based
on these observations further experiments on TLC were confined to pure milk fat
samples and milk fat samples adulterated with vegetable oils. Moreover, in order
to understand the type of additional bands some more standards such as
tocopherols and fat soluble vitamins were also applied on TLC.
Fig. 4.2 depicts the bands of cholesterol, cholesterol ester, β-sitosterol,
vitamins A and D, tocopherols (mixture of ɑ, Ƴ, and δ), carotene, pure buffalo
milk fat, vegetable oils. It can be seen from the Figure 4.2 that there are some
bands in vegetable oils with same Rf values as that of tocopherols but there are
some additional bands which are very prominent in case vegetable oils but not
that prominent in case of buffalo milk fat and are also not matching with the
bands of any reference standards. Therefore, only those additional bands whose
Rf value matches with tocopherols can be used for the detection of vegetable oils
added to milk fat, as these bands are almost invisible in case of pure buffalo milk
fat. Kilcast and Subramaniam (2000) reported that milk fat (10–46 mg/kg)
1 2 3 4 5 6 7 8 9 10 11 12
1- Cholesterol 2- Cholesterol acetate 3- Stigmasterol 4- β-sitosterol 5- Pure cow milk fat 6- Pure buffalo milk fat
7- Soybean oil 8- Sunflower oil 9- Groundnut oil 10- Goat body fat 11- Buffalo body fat 12- Pig body fat

66 Results and discussion
contains very less content of total tocopherols as compared to vegetable oils
such as soy bean oil (666-1259 mg/kg), groundnut oil (238-489 mg/kg) and
Fig. 4.2 TLC of unsaponifiable matter of pure milk fat and vegetable oils along with
standards.
sunflower oil (482-926 mg/kg). Schwartz et al (2008) have reported that butteroil
contains only traces of various fractions of tocopherols and tocotrienols as
compared to vegetable oils like sunflower oil.
Fig 4.3 and 4.4 depicts the bands of cholesterol, cholesterol ester, β-sitosterol,
vitamins A and D, tocopherols (mixture of ɑ, Ƴ, and δ), carotene, pure buffalo
milk fat, vegetable oils added to milk @ 5 and 10% (on fat basis). On the basis of
additional bands matching with the tocopherols, it may be concluded that as low
as 5% adulteration of milk (on fat basis) with soy bean oil and 10% adulteration of
milk (on fat basis) with groundnut oil and sunflower oil could be detected easily
using TLC of unsaponifiable matter. These adulteration levels were, however, not
detectable by corrected BR reading because the values of BR reading for pure
buffalo milk fat are on the lower side of the general range of 40.0 to 43.0.
A B C D E F G H I J K
A- Cholesterol B- Cholesterol acetate
C- β-sitosterol D- Vit-A
E- Vit-D
F- Tocopherol G- β-carotene
H- Pure buffalo milk fat
I- Soybean oil J- Groundnut oil K- Sunflower oil
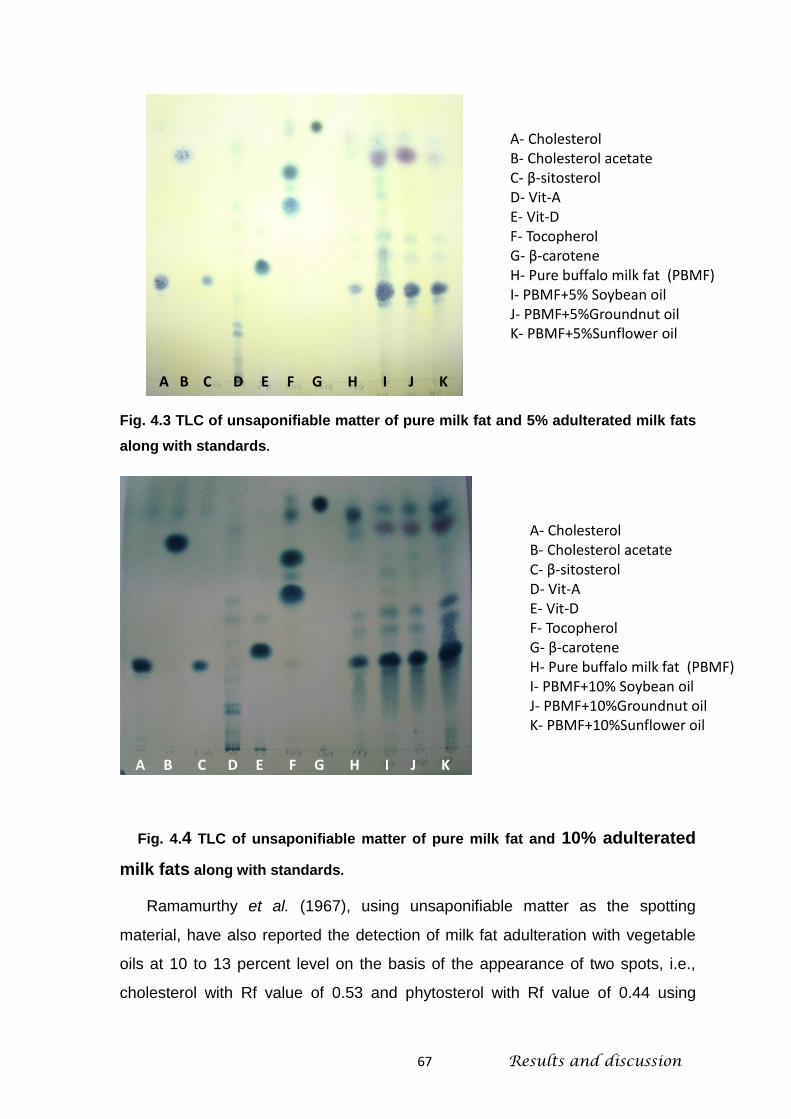
67 Results and discussion
Fig. 4.3 TLC of unsaponifiable matter of pure milk fat and 5% adulterated milk fats
along with standards.
Fig. 4.4 TLC of unsaponifiable matter of pure milk fat and 10% adulterated
milk fats along with standards.
Ramamurthy et al. (1967), using unsaponifiable matter as the spotting
material, have also reported the detection of milk fat adulteration with vegetable
oils at 10 to 13 percent level on the basis of the appearance of two spots, i.e.,
cholesterol with Rf value of 0.53 and phytosterol with Rf value of 0.44 using
A B C D E F G H I J K
A B C D E F G H I J K
A- Cholesterol B- Cholesterol acetate
C- β-sitosterol D- Vit-A
E- Vit-D
F- Tocopherol G- β-carotene
H- Pure buffalo milk fat (PBMF)
I- PBMF+5% Soybean oil J- PBMF+5%Groundnut oil K- PBMF+5%Sunflower oil
A- Cholesterol B- Cholesterol acetate
C- β-sitosterol D- Vit-A
E- Vit-D
F- Tocopherol G- β-carotene
H- Pure buffalo milk fat (PBMF)
I- PBMF+10% Soybean oil J- PBMF+10%Groundnut oil K- PBMF+10%Sunflower oil
A B C D E F G H I J K

68 Results and discussion
reverse phase TLC involving the solvent system consisting of methanol : acetic
acid : water (20 : 5 : 1, v/v) as a developer.
Sebestian and Rao (1974) using the whole fat instead of unsaponifiable
matter, and Kumar et al (2005) under similar experimental conditions of
developing the chromatograms as followed in the present investigation, have also
reported the detection of as low as 5 percent vegetable oils on the basis of
appearance of additional number of bands in case of ghee adulterated with
vegetable oils.
4.9 Effect of addition of formalin to milk on BR reading of milk fat obtained
by isolation from Gerber butyrometer and by heat clarification method.
In order to study the effect of addition of formalin (the only preservative legally
permitted to be added to milk samples meant for chemical analysis) on BR
reading of milk fat obtained by isolation form Gerber butyrometer and by heat
clarification method, the cow and buffalo milk samples (pure and adulterated at
20% level on fat basis) were added with formalin at 0.4% level and the BR
readings of the fat isolated by Gerber butyrometer and by heat clarification
method were recorded and the results obtained are presented in Table 4.15 and
4.16. During the isolation of fat by Gerber butyrometer method it was observed
that although there was blackening in the contents of the Gerber butyrometer but
after centrifugation the fat column was clear and transparent and there was no
problem in the recording of BR readings. It can be seen from the Table 4.15 and
4.16 that there was not much change in the BR reading of the fat whether
obtained by Gerber butyrometer method or heat clarification method for the pure
as well as adulterated milk samples after the addition of formalin both in case of
cow and buffalo milks.
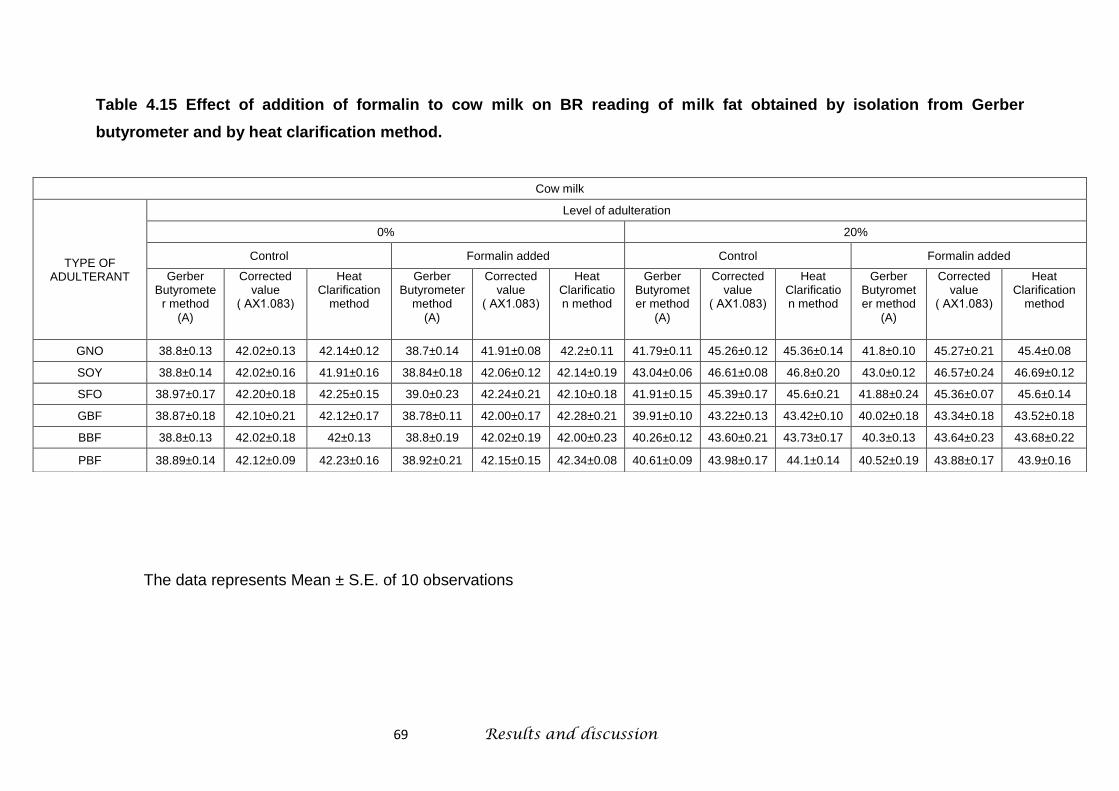
69 Results and discussion
Table 4.15 Effect of addition of formalin to cow milk on BR reading of milk fat obtained by isolation from Gerber
butyrometer and by heat clarification method.
The data represents Mean ± S.E. of 10 observations
Cow milk
TYPE OF ADULTERANT
Level of adulteration
0% 20%
Control Formalin added Control Formalin added
Gerber Butyromete
r method (A)
Corrected value
( AΧ1.083)
Heat Clarification
method
Gerber Butyrometer
method (A)
Corrected value
( AΧ1.083)
Heat Clarification method
Gerber Butyrometer method
(A)
Corrected value
( AΧ1.083)
Heat Clarification method
Gerber Butyrometer method
(A)
Corrected value
( AΧ1.083)
Heat Clarification
method
GNO 38.8±0.13 42.02±0.13 42.14±0.12 38.7±0.14 41.91±0.08 42.2±0.11 41.79±0.11 45.26±0.12 45.36±0.14 41.8±0.10 45.27±0.21 45.4±0.08
SOY 38.8±0.14 42.02±0.16 41.91±0.16 38.84±0.18 42.06±0.12 42.14±0.19 43.04±0.06 46.61±0.08 46.8±0.20 43.0±0.12 46.57±0.24 46.69±0.12
SFO 38.97±0.17 42.20±0.18 42.25±0.15 39.0±0.23 42.24±0.21 42.10±0.18 41.91±0.15 45.39±0.17 45.6±0.21 41.88±0.24 45.36±0.07 45.6±0.14
GBF 38.87±0.18 42.10±0.21 42.12±0.17 38.78±0.11 42.00±0.17 42.28±0.21 39.91±0.10 43.22±0.13 43.42±0.10 40.02±0.18 43.34±0.18 43.52±0.18
BBF 38.8±0.13 42.02±0.18 42±0.13 38.8±0.19 42.02±0.19 42.00±0.23 40.26±0.12 43.60±0.21 43.73±0.17 40.3±0.13 43.64±0.23 43.68±0.22
PBF 38.89±0.14 42.12±0.09 42.23±0.16 38.92±0.21 42.15±0.15 42.34±0.08 40.61±0.09 43.98±0.17 44.1±0.14 40.52±0.19 43.88±0.17 43.9±0.16
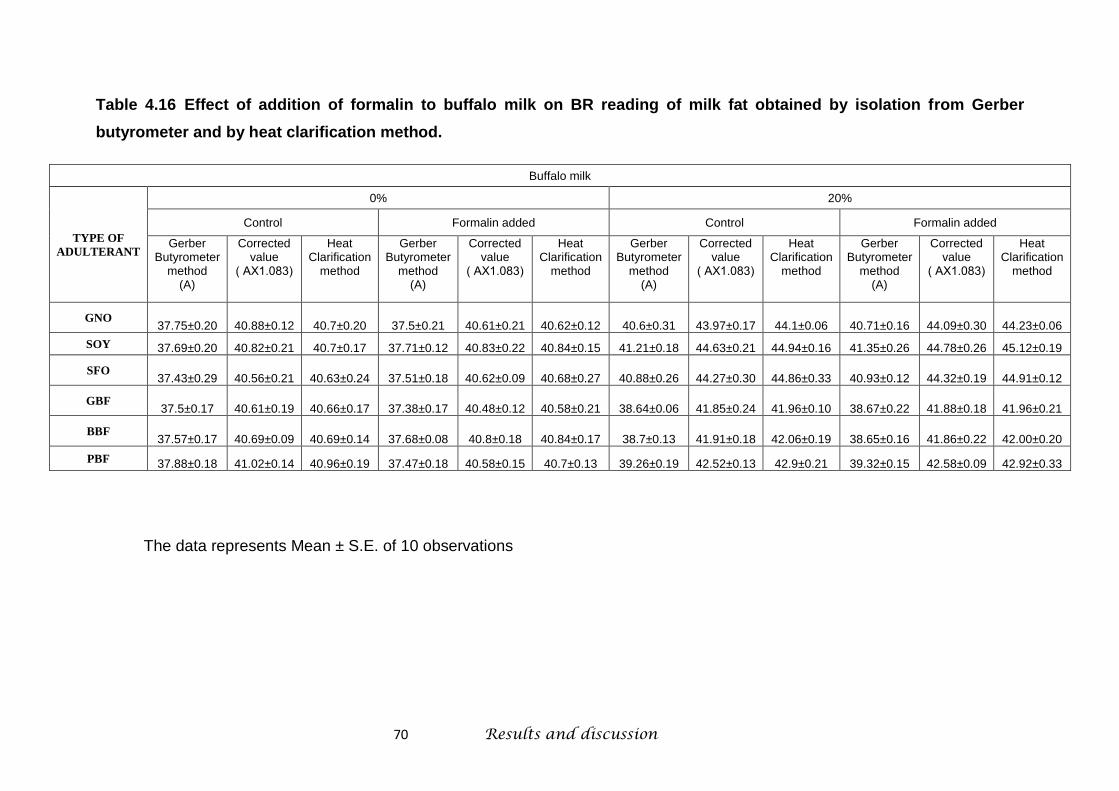
70 Results and discussion
Table 4.16 Effect of addition of formalin to buffalo milk on BR reading of milk fat obtained by isolation from Gerber
butyrometer and by heat clarification method.
The data represents Mean ± S.E. of 10 observations
Buffalo milk
TYPE OF
ADULTERANT
0% 20%
Control Formalin added Control Formalin added
Gerber Butyrometer
method (A)
Corrected value
( AΧ1.083)
Heat Clarification
method
Gerber Butyrometer
method (A)
Corrected value
( AΧ1.083)
Heat Clarification
method
Gerber Butyrometer
method (A)
Corrected value
( AΧ1.083)
Heat Clarification
method
Gerber Butyrometer
method (A)
Corrected value
( AΧ1.083)
Heat Clarification
method
GNO 37.75±0.20 40.88±0.12 40.7±0.20 37.5±0.21 40.61±0.21 40.62±0.12 40.6±0.31 43.97±0.17 44.1±0.06 40.71±0.16 44.09±0.30 44.23±0.06
SOY 37.69±0.20 40.82±0.21 40.7±0.17 37.71±0.12 40.83±0.22 40.84±0.15 41.21±0.18 44.63±0.21 44.94±0.16 41.35±0.26 44.78±0.26 45.12±0.19
SFO 37.43±0.29 40.56±0.21 40.63±0.24 37.51±0.18 40.62±0.09 40.68±0.27 40.88±0.26 44.27±0.30 44.86±0.33 40.93±0.12 44.32±0.19 44.91±0.12
GBF 37.5±0.17 40.61±0.19 40.66±0.17 37.38±0.17 40.48±0.12 40.58±0.21 38.64±0.06 41.85±0.24 41.96±0.10 38.67±0.22 41.88±0.18 41.96±0.21
BBF 37.57±0.17 40.69±0.09 40.69±0.14 37.68±0.08 40.8±0.18 40.84±0.17 38.7±0.13 41.91±0.18 42.06±0.19 38.65±0.16 41.86±0.22 42.00±0.20
PBF 37.88±0.18 41.02±0.14 40.96±0.19 37.47±0.18 40.58±0.15 40.7±0.13 39.26±0.19 42.52±0.13 42.9±0.21 39.32±0.15 42.58±0.09 42.92±0.33
71 Results and discussion
4.10 Effect of storage (at 37°C) of formalin preserved milk samples on BR
reading of milk fat obtained by isolation from Gerber butyrometer and by heat
clarification method.
Cow and buffalo milk samples, in triplicates, were added with formalin @ 0.4%
and stored at 37°C in glass stoppered bottles for the period of three months and the
results obtained on the effect of storage of formalin preserved milk samples on BR
reading of milk fat obtained by isolation using Gerber butyrometer method and heat
clarification method are presented in Tables 4.17 and 4.18. Control samples got
spoiled spontaneously after 12 hours of storage. As reported above here also it was
observed that during the isolation of fat by Gerber butyrometer method, although
there was blackening in the contents of the Gerber butyrometer but after
centrifugation the fat column was clear and transparent and there was no problem in
the recording of BR readings. Moreover, there was no change in the BR reading of
milk fat immediately after the addition of formalin, both in case of fat isolated by
Gerber butyrometer method and by heat clarification method in cows as well as
buffalo milk samples as observed in previous section 4.8. After one month of storage
also, in general, no change was observed in the BR reading of milk fat, both in case
of fat isolated by Gerber butyrometer method and by heat clarification method in
cows as well as buffalo milk samples. However, after two months of storage, it was
observed that there was a problem of charring and blackening of fat column in the
Gerber butyrometer method even after centrifugation. Therefore, the BR readings
were not recorded for these samples. On the other hand, there was no problem in
recording of BR readings of fats in case of heat clarification method during the period
of three months storage. However, no change in the BR readings of fats isolated by
heat clarification method was noticed both in case of cow and buffalo milk samples
during the entire storage period. Therefore, for formalin preserved milk samples
application of Gerber butyrometer method for recording the BR reading of isolated fat
cannot be recommended.

72 Results and discussion
Table 4.17 Effect of storage (at 37°C) of formalin preserved cow milk samples
on BR reading of milk fat obtained by isolation from Gerber butyrometer and
by heat clarification method
Sample 1 Sample 2
Sample 3 Mean±S.E.
Control
Gerber butyrometer method (A)
38.3 39.1 38.6 38.67±0.23
Corrected value (A Χ 1.083)
41.48 42.34 41.80 41.87±0.25
Heat clarification method
41.6 42.4 42 42±0.23
Formalin Added
0 day
Gerber butyrometer method (A)
38.2 39 38.6 38.6±0.23
Corrected value (A Χ 1.083)
41.37 42.24 41.80 41.8±0.25
Heat clarification method
41.4 42.4 42 41.93±0.29
1 month
Gerber butyrometer method (A)
38 39 38.2 38.4±0.30
Corrected value (A Χ 1.083)
41.15 42.24 41.37 41.59±0.33
Heat clarification method
41.2 42.4 42 41.87±0.35
2 month
Gerber butyrometer method (A)
---- ---- ----
Corrected value (A Χ 1.083)
---- ---- ----
Heat clarification method
41 42.4 42 41.8±0.42
3 month
Gerber butyrometer method (A)
---- ---- ----
Corrected value (A Χ 1.083)
---- ---- ----
Heat clarification method
41 42.4 42 41.8±0.42
---- indicates that the samples could not be analysed.
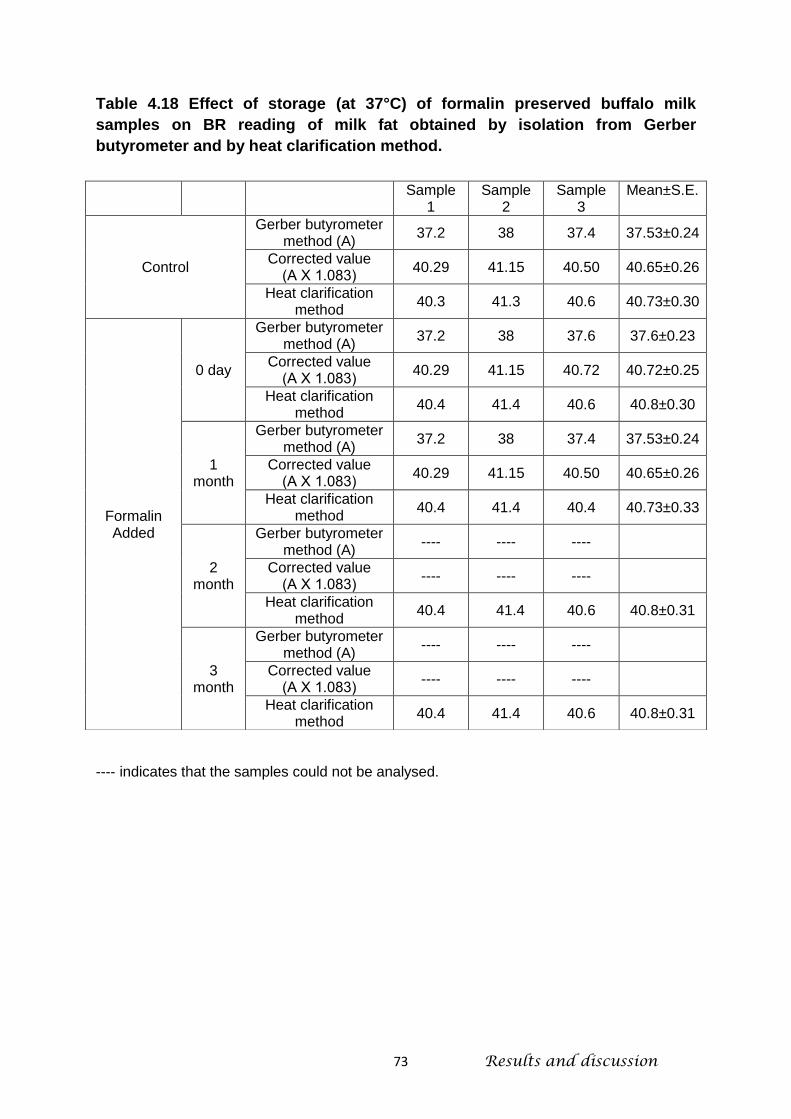
73 Results and discussion
Table 4.18 Effect of storage (at 37°C) of formalin preserved buffalo milk
samples on BR reading of milk fat obtained by isolation from Gerber
butyrometer and by heat clarification method.
---- indicates that the samples could not be analysed.
Sample 1
Sample 2
Sample 3
Mean±S.E.
Control
Gerber butyrometer method (A)
37.2 38 37.4 37.53±0.24
Corrected value (A Χ 1.083)
40.29 41.15 40.50 40.65±0.26
Heat clarification method
40.3 41.3 40.6 40.73±0.30
Formalin Added
0 day
Gerber butyrometer method (A)
37.2 38 37.6 37.6±0.23
Corrected value (A Χ 1.083)
40.29 41.15 40.72 40.72±0.25
Heat clarification method
40.4 41.4 40.6 40.8±0.30
1 month
Gerber butyrometer method (A)
37.2 38 37.4 37.53±0.24
Corrected value (A Χ 1.083)
40.29 41.15 40.50 40.65±0.26
Heat clarification method
40.4 41.4 40.4 40.73±0.33
2 month
Gerber butyrometer method (A)
---- ---- ----
Corrected value (A Χ 1.083)
---- ---- ----
Heat clarification method
40.4 41.4 40.6 40.8±0.31
3 month
Gerber butyrometer method (A)
---- ---- ----
Corrected value (A Χ 1.083)
---- ---- ----
Heat clarification method
40.4 41.4 40.6 40.8±0.31

CHAPTER - 5
───────────────────────────────
Summary and Conclusions ───────────────────────────────
74 Summary and conclusion
5. SUMMARY AND CONCLUSION
An investigation on the detection of adulteration of fat in milk using specially
designed dual purpose Gerber butyrometer was carried out. For this, pooled cow
and buffalo milk samples were collected from the Institute’s Cattle Yard.
Adulterant oils and fats such as vegetable oils (groundnut, soybean, sunflower)
and animal body fats (goat, buffalo and pig) were procured from the local market.
Adulterated milk samples were prepared by adding the preheated adulterant oils
and fats individually to preheated milk (60-65°C) at 5, 10, 15 and 20 percent
levels on the basis of fat content in milk, followed by mixing.
For checking the adulteration of milk with foreign fats, four tests such as
Apparent Solidification Time (AST) test, Complete Liquefaction Time (CLT) test,
Butyro–refractometer (BR) reading at 40°C and thin layer chromatography of
unsaponifiable matter were planned to be undertaken. Initially, the attempts were
made to standardize the conditions for AST test which is hitherto developed for
checking the ghee adulteration. While standardizing the AST test to be applied on
Gerber butyrometer fat column, it was observed that there were problems of very
large variations in the AST values among the samples as well as among the
butyrometers for the same sample. Therefore, this part of the study on AST test
was not continued further for its application with an aim of detecting the
adulteration of milk with foreign oils and fats. After having encountered a problem
of variations among the samples as well as among the butyrometers for the same
sample in case of AST test, only a limited study on the CLT test at 41°C was
carried out. For this, only the pure cow and buffalo milk samples along with milk
samples adulterated at highest level of adulteration (20% on fat basis) were
analyzed. Although, a visible trend of decreasing and increasing CLT values with
the addition of vegetable oils and animal body fats, respectively was observed,
but as noticed in case of AST test here also large variations among the samples
were observed. Moreover, it was observed that 70-90% of all the milk samples
adulterated with the three vegetable oils and three body fats individually (@ 20%
level on fat basis) were within the limits of CLT values of pure cow and buffalo
milks and failed to be detected. Therefore, it was concluded that this test cannot

75 Summary and conclusion
be recommended to be used as a platform test for screening the milk for milk fat
purity.
For application of BR reading test in this study, pooled cow and buffalo milk
samples brought from the cattle yard of the institute were divided into two
portions. One portion was subjected to fat test using dual purpose Gerber
butyrometers and a small portion of fat column was drawn out with the aid of
pasture pipette for checking its BR reading. The remainder portion of milk
samples were subjected to cream separation and the cream thus obtained was
converted into clarified fat using heat clarification method. These heat clarified
fats were then analyzed for BR reading. The results on the BR readings obtained
by Gerber butyrometer method were found to be lower than those obtained by
heat clarification method. Therefore, in order to directly get the correct BR
reading using Gerber butyrometer method, a correction factor of 1.083 was
developed. Based on these results, the following formula is recommended for
converting BR reading obtained by Gerber butyrometer method to correct BR
reading.
Corrected BR Reading at 40°C = Observed BR Reading at 40°C Χ 1.083
Adulterated milk samples were also divided into two portions and analysed for
BR reading using Gerber butyrometer method and heat clarification method as
described above for pure milk samples. Using Gerber butyrometer method, the
corrected BR readings obtained by above formula were considered for detecting
adulteration of fat in milk with foreign fats and oils. Hence, keeping in view the
general range of BR reading of milk fat as 40.0 to 43.0, it was revealed that
adulteration of cow milk with vegetable oils was detectable at all the adulteration
levels studied, except groundnut oil and sunflower oil at 5% level of adulteration
(on fat basis). Almost similar results were obtained by heat clarification method
except in case of sunflower oil for which 5% adulteration (on fat basis) was not
detectable by Gerber butyrometer method (corrected BR=42.97) but was
detectable by heat clarification method (BR=43.10). However, adulteration of
cow milk with animal body fats was not detectable below 20 % level of
adulteration (on fat basis), except pig body fat which was detectable even at 15%
level. These observations were also supported by the results obtained on the BR
readings of corresponding heat clarified fat.
76 Summary and conclusion
On the other hand, adulteration of buffalo milk with vegetable oils was not
detectable below 20 % level of adulteration (on fat basis) except soy bean oil
which was detectable even at 10% level. Almost similar results were obtained by
heat clarification method except in case of groundnut oil for which 15%
adulteration (on fat basis) was not detectable by Gerber butyrometer method
(corrected BR=42.8) but was detectable by heat clarification method (BR=43.04).
Similarly, adulteration of buffalo milk with animal body fats was not detectable at
all the levels studied. These results were also supported by BR readings of
corresponding heat clarified fat.
Thin layer chromatography (TLC) of unsaponifiable matter extracted from heat
clarified fat obtained from pure buffalo milk and buffalo milk adulterated with
vegetable oils (5 and 10%) was carried out. This study revealed that on the basis
of additional bands matching with the tocopherols, as low as 5% adulteration of
milk (on fat basis) with soy bean oil and 10% adulteration of milk (on fat basis)
with groundnut oil and sunflower oil could be detected easily using TLC of
unsaponifiable matter. These adulteration levels were, however, not detectable
by corrected BR reading because the values of BR reading for pure buffalo milk
fat are on the lower side of the general range of 40.0 to 43.0.
The study on the effect of addition of formalin on BR reading of milk fat
obtained by isolation form Gerber butyrometer and by heat clarification method
from cow and buffalo milk samples (pure and adulterated at 20% level on fat
basis) was also carried out. This study revealed that there was not much change
in the BR reading of the fat whether obtained by Gerber butyrometer method or
heat clarification method for the pure as well as adulterated milk samples. When
the formalin preserved milk samples were stored for three months, it was
observed that there was no change in the BR reading of heat clarified fats.
However, in case of Gerber butyrometer method, upto one month of storage no
change in the BR reading was observed, but after two months of storage,
difficulty in the fat isolation was encountered. Therefore, for formalin preserved
milk samples application of Gerber butyrometer method for recording the BR
reading of isolated fat cannot be recommended.

Bibliography

i
BIBLIOGRAPHY
Achaya, K.T. and Banerjee, B.N. (1946). The fatty acid and glyceride structures of
Indian buffalo milk and depot fats, and some characteristics of Eastern animal
fats. Biochem. J. 40:661-669.
AGMARK. (1981). Ghee Grading and Marketing Rules, 1938 (as amended).
Government of India, Ministry of Food and Agriculture, , Department of
Agriculture, New Delhi.
Akoh, C.C. and Min, D.B. (1998). Food lipids. Chemistry, Nutrition and
Biotechnology. Marcel Dekker, Inc.
Aktas, N. & Kaya, M. (2001). Detection of beef body fat and margarine in butter fat
by differential scanning calorimetry. Journal of Thermal Analysis and
Calorimetry. 66: 795-801.
Ali, M. and Tremazi, S.A. (1966). A study on the effect of adulteration on butterfat
constants. Pakistan J. Sci. 18:124-129.
Amelotti, G., Breanze, M. and Lodigiano, P. (1983). Application and limits of
differential scanning calorimetry to the detection of beefsuet in butter. Rivista
Italiana delle Sostanze Grasse, 60(9):557. [Cited: Dairy Sci. Abstr. (1984), 46
(4):2480].
Amit Kumar. (2008). Detection of Adulterants in ghee. Ph.D. Thesis submitted to
National Dairy Research Institute (Deemed University), Karnal, India.
Antila, V., Luoto, K. and Antila, M. (1965). Detection of adulteration of milk fat by
means of DSC. Meijeritied Ackakausk, 25: 37. [Cited: Dairy Sci. Abstr. (1966).
28:356].
Arora, K.L., Lal, D., Seth, R. and Ram, J. (1996). Platform test for Detection of
Refined Mustard Oil Adulteration in Milk. Indian J. Dairy Sci. 49(10): 721-723.
Arora, S. and Rai, T. (1997). Milk fat fractions- properties and applications- A
Review. J. Dairying, Foods & Home Sci. 16(3):143-155.
Arumughan, C. and Narayanan, K.M. (1979). Grain formation in ghee (butterfat) as
related to structure of triglycerides. J. Food Sci. & Tech. 16:242-247.
Arun kumar. (2003). Comparative studies on physico-chemical properties of
various oils and fats with a view to detect adulteration in ghee. Ph.D. Thesis
ii
submitted to National Dairy Research Institute (Deemed University), Karnal,
India.
Ashvinkumar S. Hariyani. (2010). A study on physico-chemical Qualities of Market
Ghee. M.Tech. Thesis submitted to National Dairy Research Institute (Deemed
University), Karnal, India.
Bailey, A.V., Harris, J.H. and Skau, E.L. (1966). Cyclopropenoid fatty acid content
and fatty acid composition of crude oils from twenty-five varieties of
cottonseed. J. Amer. Oil Chemists Soc. 43:107-110.
Banfi, S., Bergna, M., Povolo, M. and Contarini, G. (1999). Programmable
temperature vaporizer (PTV) applied to the TG analysis of milk fat. J. High
Resolution Chromatography. 22:93-96.
Bartlett, J.C. and Chapman, D.G. (1961). Detection of hydrogenated fats in
butterfat by measurement of cis-trans conjugated unsaturation. J. Agric. Food
Chem., 9:50-53 [Cited: Dairy Sci. Abstr. (1961). 23:1505].
Bector,B.S. and Narayanan, K.M.1974. Effect of thermal oxidation on the physico-
chemical constants of ghee. Indian J. Dairy Sci., 27 : 90-93.
Bector, B.S. and Sharma, V. (2002). Physico chemical characteristics of ghee adulterated with palm oil and its detection. NDRI Annual report. pp. 44-45.
Bhalerao, V.R. and Kummerow, F.A. (1954). A method for the detection of foreign
fats in dairy products. J. Dairy Sci. 37:156-161.
Bhide, P.T. and Kane, J.G. (1952). Critical temperatures of dissolution of ghee
and hydrogenated oils (vanaspati). Indian J. Dairy Sci. 5(4):183-187.
BIS (1960), IS : 1479 (Reaffirmed 2003), METHODS OF TEST FOR DAIRY
INDUSTRY PART I RAPID EXAMINATION OF MILK, Bureau of Indian
Standards, Manak Bhavan, New Delhi.
BIS. (1981). Handbook of Food Analysis, SP-18, Part XI-Dairy Products. Bureau of
Indian Standards, Manak Bhavan, New Delhi.
Boghra, V.R. and Borkhatriya, V.N. (2004). Detection of Vegetable Oils in Milk and
Milk Fat by a Rapid Method. J. Food Sci. Technol. 41(4): 461-464.
Boghra, V.R., Singh, S. and Sharma, R.S. (1981). Present status of the tests used
for the detection of adulterants in ghee. Dairy Guide. 81:21-31.
Boniforti, Z. (1962). Gas chromatographic study of the fatty acids of butter made in
Italy and other countries; application to adulteration of commercial butter. Ann.
Falsif. Expert. Chim., Paris. 55:255-263.
iii
Chen, M. H. and Bergman, C.J. (2005). A rapid procedure for analyzing rice bran
tocopherol, tocotrienol and gamma oryzanol contents. J. Food Composition
and Analysis. 18: 139-151.
Collomb, M., Spahni, M. and Bubler, T. (1998). Analysis of triglycerides 11:
Validation of multilinear regression method for the determination of foreign fats
in milk fat. Mitteeilungen Aus Dem Gebiete Der Leben Smitte luntersuchhung
and Hygiene. 89: 75-83 [Cited: Dairy Sci. Abstr. (1999). 61:2845].
Coni, E., Pasquale, M.Di., Coppolelli, P., Bocca, A. and Di Pasquale, M. (1994).
Detection of animal fats in butter by differential scanning calorimetry: A pilot
study. J. Amer. Oil Chemists Soc. 71(8):807-810.
De, Sukumar. (2005). Outlines of Dairy Technology. Oxford University Press, New
Delhi.
Deffense, E. (1993). Milk Fat Fractionation Today: A Review. J. Am. Oil Chem.
Soc. 70:1193-1201.
Delforno, G. (1964). Detection of foreign fats in butter using the crismer test. Latte, 38(11): 921-924.
Den Herder, P.C. (1955). Detection of adulteration of butter with foreign fats by
examination of the sterols. Neth. Milk Dairy J. 9:261-274.
Dimick, P.S., Reddy, S.Y. and Ziegler, G.R. (1996). Chemical and thermal
characteristics of milk-fat fractions isolated by a melt crystallization. J. Am. Oil.
Chem. Soc. 73:1647-1652.
Farag, R.S., Abo-Raya, S.H., Ahmed, F.A., Hewedi, F.M. and Khalifa, H.H. (1983).
Fractional crystallization and gas chromatographic analysis of fatty acids as a
means of detecting butterfat adulteration. J. Amer. Oil Chemists Soc.
60(9):1665-1669.
Felman, H.A. and Lepper, H.A. (1950). The critical temperature of dissolution as a
rapid test to distinguish oleo margarine from butter. Agric. Chem. 33:492-499.
Fox, P.F. (1995). Advanced Dairy Chemistry. 2. Lipids. 2nd Edn. Chapman & Hall.,
London, New York and Madras.
Fox, P.F. and McSweeney, P.L.H. (1998). Dairy Chemistry and Biochemistry.
Blackie Academic and Professional, London.
Francesco, F. De. and Avancini, D. (1961). The adulteration of butter with trans-
esterified fats. Latte. 35:809-817.
iv
German, J.B. and Dillard, C.J. (1998). Fractionated milk fat: Composition,
structure, and functional properties. Food Technol. 52:33-38.
Gunstone, F.D. (1969). Topics in lipid chemistry. Logos Press, London, Vol. 1, pp.
28.
Gunstone, F.D., Harwood, J.L. and Padley, F.B. (1994). The lipid handbook. 2nd
Edn., Chapman & Hall, London.
Gutierrez, R., Vega, S., Diaz, G., Sanchez, J., Coronado, M., Ramirez, A., Perez,
J., Gonzalez, B., Schettino (2009). Detection of non-milk fat in milk fat by gas
chromatography and linear discriminant analysis. J. of Dairy Sci. 92 (5): 1846-
1855.
Guyot, A.L. (1978). Detection of animal body fats in milk fat by triglyceride gas
liquid chromatography. 20th Int. Dairy Congr., Vol. E, p. 400.
Homberg, E. and Bielefeld, B. (1979). Detection of vegetable fats in butterfat by
gas chromatographic analysis of sterols. Zeitschrift fur Lebensmittel-
Untersuchung und Forschung. 16:464 [Cited: Dairy Sci. Abstr. (1980).
40:3092].
http://www.nddb.org/statistics/milkproduction.html, 2012
International Dairy Federation (1965). Detection of vegetable fat in milk fat by
phytosteryl acetate test. FIL-IDF, 32.
Iqbal, S., Bhanger, M. I. and Anwar, F. (2005). Antioxidant properties and
components of some commercially available varieties of rice bran in Pakistan.
Food Chemistry. 93:265-272.
Jha, J.S. (1981). Spectrophotometric studies of Cheuri (Madhuca butyracea) fat
and ghee mixtures. J. Amer. Oil. Chem. Soc. 58: 843-845.
Kalsi, P.S. (1984). Dilatometeric study of solid/liquid fractions of milk fat from
different species. M.Sc. Thesis, Submitted to National Dairy Research Institute
(Deemed University), Karnal, India.
Kane, J.G. and Ranadive, G.M. (1951). Aniline point of some fats. J. Sci. &
Industrial Res., 10B: 62.
Kansal, V.K. (2010). Reaffirming Health Benefits of Desi ghee. Indian Dairyman.
62(11): 60-63.
Karim, S.Z. (1953). Adulteration of dairy products with vegetable and animal fats.
Int. Dairy Congress. 1:648.

v
Keeney, M.K.C., Bachman, H.H., Tikriti, A.S. and King, L. (1971). Rapid vitamin E
method for detecting the adulteration of dairy products with non-coconut
vegetable oils. J. Dairy Sci. 54:1702-1703.
Kilcast, D. and Subramaniam, P. (2000). The stability and shelf-life of food.
Woodhead publishing limited, Cambridge, England, pp-302
Kirk, R.S. and Sawyer, R. (1999). Pearson's composition and analysis of foods.
Addison-Wesley Longman Ltd, England.
Koca, N., Kocaoglu-Vurma, N.A., Harper, W.J. and Rodriguez-Saona, L.E. (2010).
Application of temperature-controlled attenuated total reflectance-mid-infrared
(ATR-MIR) spectroscopy for rapid estimation of butter adulteration. Food
Chemistry. 121: 778-782.
Konevets, V.I., Roganoua, Z.A. and Smolyanski, A.L. (1987). Use of infra-red
spectroscopy for analysing fats of different origin. Izvestiya Vyrshikh O
Chebnykh Zavadenii Pischevaya Tekhnologiya. 1: 64-67 [Cited: Dairy Sci.
Abstr. (1988). 50:1973].
Kuksis, A. and McCarthy, M.J. (1964). Triglyceride gas chromatography as a
means of detecting butterfat adulteration. J. Amer. Oil Chemists Soc.
41:17-19.
Kumar, A., Kumar, A., Lal, D., Seth, R. and Sharma, V. (2010). Validation of ultra-
violet and visible spectroscopy methods for detection of milk fat adulteration. J.
Dairying Food & H.S. 29 (1): 8-14.
Kumar, A., Lal, D., Seth, R and Sharma, R. (2002). Recent Trends in Detection of
Adulteration in Milk Fat- A Review. Indian Journal of Dairy Science. 55(6): 319-
330.
Kumar, A., Lal, D., Seth, R. and Sharma, V. (2005a). Detection of Groundnut Oil
and Vanaspati in Ghee by Thin Layer Chromatography. Indian J. Dairy Sci.
58(4):250-252.
Kumar, A., Lal, D., Seth, R. and Sharma, V. (2005b). Turbidity test for detection of
liquid paraffin in ghee. Indian J. Dairy Sci. 58(4):298.
Kumar, A., Lal, D., Seth, R. and Sharma, V. (2007). Dilatometric detection of body
fats, vegetable oils and hydrogenated fat (vanaspati) added to milk fat. Inter. J.
Dairy Sci. 60 (4): 244-247.
Kumar, A., Lal, D., Seth, R. and Sharma, V. (2009a). Apparent solidification time
test for detection of foreign oils and fats adulterated in clarified milk fat, as
affected by season and storage. Int. J. Dairy Tech. 62:33-38.

vi
Kumar, A., Lal, D., Kumar, A., Seth, R. and Sharma, V. (2011). Detection of
adulteration in milk fat using Butyro-refractometer (BR) reading before and
after fractionation. Indian. J. Dairy Sci., 64(4):290-297.
Kumar, A., Lal, D., Sharma, V. and Seth, R. (2009b). A Simple Colorimetric Test
for Detection of Rice Bran Oil in Ghee. Indian J. Dairy Sci. 62(1):71-73.
Kumar, A., Lal, D., Seth, R. and Sharma, V. (2010). Detection of milk fat
adulteration with admixture of foreign oils and fats using a fractionating
technique and the apparent solidification time test. Int. J. Dairy Tech.
63(3):457-462.
Kumar, A., Sharma, V., and Lal, D. (2008). Development of thin layer
chromatography based method for the detection of rice bran oil as an
adulterant in ghee. Indian. J. Dairy Sci., 61(2):113-115
Lal ,D. and Narayanan,K.M.1984. Effect of lactation number on fatty acid and
physico-chemical constants of milki fat . Asian J. Dairy Res., 2(4):191-195
Lal, D., Seth, R., Arora, K.L. and Ram, J. (1998). Detection of vegetable oils in
milk. Indian Dairyman. 50(7):17-18.
Lal, D., Seth, R., Sharma, R. and Kumar, A. (2005). Approaches for detection of
Adulteration in Milk Fat- An overview. Indian Dairyman. 57(10): 31-43.
Lambelet, P. and Ganguli, N.C. (1983). Detection of pig and buffalo body fat in cow
and buffalo ghee by differential scanning calorimetry. J. Am. Oil Chemists Soc.
60(5): 1005.
Lambelet, P., Singhal, O.P. and Ganguli, N.C. (1980). Detection of goat body fat in
ghee by differential thermal analysis. J. Am. Oil Chemists Soc. 57(4):364.
Lipp, M. (1995). Review of methods for the analysis of triglycerides in milk fat:
application for studies of milk quality and adulteration. Food Chemistry. 54:
213-221.
Luf, W., Stock, A. and Brandl, E. (1987). Detection of foreign fat in milk by
triglyceride analysis: Detection of adulteration by triglyceride combination.
Osterreichische Milchwirschaft, 112:29-35 [Cited: Dairy Sci. Abstr. (1988),
50:1958].
Mariani, C., Venturini, S., Fedeli, E. and Contarini, G. (1994). Detection of refined
animal and vegetable fats in adulteration of pure milk fat. J. Am. Oil Chem.
Soc. 71:1381-1384.

vii
Marjanovic, N., Jankouits, I., Turkulov, J., Karlouic, D., Caric, M., Milanovic, S. and
Zagorak, M. (1984). Determination of the triglyceride composition of milk fat
by gas chromatography. Mijekarstuo, 34:67-75 [Cited: Dairy Sci. Abstr.
47:474].
Murthy, G.K. (1955). Reichert-Meissl value: Its importance and limitation in the
detection of foreign fats in butterfat. J. Dairy Sci. 38:317-318.
Naviglio, D. and Raja, C. (2003). Quality control of butter by means of capillary
column RTX 65-TG, Industrie Alimentary., 42: 742-756 [Cited: Dairy Sci. Abstr.
(2004). 66:298].
Norton, R.A. (1995). Quantitation of steryl ferulate and p-coumarate esters from
corn and rice. Lipids. 30:269-274.
Panda, D. and Bindal, M.P. (1997). Detection of adulteration in milk fat with animal
body fats and vegetable oils using GLC based on a marker fatty acid. Indian J.
of Dairy Sci. 50:129–135.
Panda, D. and Bindal, M.P. (1998a). Detection of adulteration in milkfat with animal
body fats and vegetable oils using opacity test. J. of Dairying, Foods & Home
Sci. 17:31–36.
Panda, D. and Bindal, M.P. (1998b). Detection of adulteration in ghee with animal
body fats and vegetable oils using crystallization test. Indian Dairyman.
50(9):13-16.
Pandey, S. N. and Suri, L. K. (1982). Cyclopropenoid fatty acid content and iodine
value of crude oils from Indian cottonseed. J. Amer. Oil Chemists Soc. 59:99.
Paradkar, M. M., Singhal, R.S. and Kulkarni P.R. (2001). An approach to the
detection of synthetic milk in dairy milk: 3. detection of vegetable oil and
sodium bicarbonate. International J. Dairy Technol. 54:34-35.
Parodi, P.W. (1969). Detection of a synthetic milk fat. Aust. J. Dairy Technol.
24(4):190.
Parodi, P.W. (1973). Detection of synthetic and adulterated butterfat: GLC
triglyceride analysis. Aust. J. Dairy Technol. 28:38-42.
Patel, A.A. and Frede, E. (1991). Studies on thermal properties of cow and buffalo
milk fats. Lebensm.-Wiss.u.-Technol. 24:323-327.
PFA. (2010). Prevention of Food Adulteration Act, 1954 and rules, 1955 (as
amended). Eastern Book Company, 1267, Kashmere Gate, Delhi.
viii
Pinto, C.M., Contreras, O., Carrasco R.E., Brito, C.C., Molinae, L.H. and Leon,
Y.S. (2002). Determination of authenticity of pure milk fat. Linear discriminant
analysis of triacylglycerides. Agro sur. 30(1):59-67 [Cited: Dairy Sci. Abstr.
(2002) 64:6578].
Povolo, M., Bonfitto, E., Contarini, G., Toppino, M. and Daghetta, A. (1999). Study
on the performance of three different capillary gas chromatographic analysis in
the evaluation of milk fat purity. J. High Resolution Chromatography.
22(2):97-102.
Precht, D. (1990). Quantification of animal body fats and vegetable fats in milk by
triglyceride analysis. 22nd Int. Dairy Congr. 1:234.
Precht, D. (1992a). Detection of foreign fat in milk fat. 1. Quantitative detection of
triacyl-glycerol formulae. Zeitschrift fur Lebensmittel-Untersuchung und-
Forschung. 194: 1-8
Precht, D. (1992b). Detection of foreign fat in milk fat. II. Quantitative detection of
triacyl-glycerol formulae. Chemistry and Material Science. Zeitschrift fur
Lebensmittel-Untersuchung und-Forschung. 194 (2): 107-114.
Raj, D. and Singhal, O. P. (1987). Effect of formalin on Gerber fat test. J. Food Sci.
Technol. 24(4):183-184.
Ramachandra, B.V. and Dastur, N.N. (1959). Application of paper chromatography
to differentiate ghee from other fats. 1. Behaviour of unsaponifiable matter on
chromatograms. Indian J. Dairy Sci. 12(3/4):139.
Ramamurthy, M.K., Narayanan, K.M., Bhalerao, V.R. and Dastur, N.N. (1967). A
TLC method for detection of adulteration of milk fat with vegetable fats. Indian
J. Dairy Sci. 20:11.
Rangappa, K.S. and Achaya, K.T. (1974). Indian Dairy Products. Asia Publishing
House, Mysore.
Renterghem, Van, R. (1997). The triglyceride composition of Belgian butter in view
of EU controls on milk fat purity, Milchwissenschaft. 52:79-82.
Roos, J.B. and Tuinstra, L.G.M.Th. (1969). The detection of foreign fats in milk fat.
2. Differential thermal analysis of Dutch butterfat. Neth. Milk Dairy J. 23(1):37.
Sato, T., Kawano, S. and Iwamoto, M. (1990). Detection of foreign fat adulteration
of milk fat by near infra-red spectroscopic method. J. Dairy Sci. 73:3408-3413.

ix
Schwartz, H., Ollilainen, V., Piironen, V and Lampi, A.M. (2008). Tocopherol,
tocotrienol and plant sterol contents of vegetable oils and industrial fats. J.
Food compo. and Analysis. 21:152-161.
Sebastian, J. and Rao, M.B. (1974). Detection of the presence of vegetable oils
and fats in ghee (butterfat). Milchwissenschaft. 29(9):533-534.
Sharma, R. and Singhal, O.P. (1995). Physico-chemical constants of milk fat
prepared from milk adulterated with foreign fat. Indian J. of Dairy Sci. & Biosci.
6:51–53.
Sharma, R. and Singhal, O.P. (1996). Fatty acid composition, Bomer value and
opacity profile of ghee prepared from milk adulterated with foreign fats. Indian
J. Dairy Sci. 49(1):62-67.
Sharma, S.K. (1989). Studies on unsaponifiable matter of milk fat (clarified
butterfat) and animal body fats with a view to detect adulteration, PhD Thesis.
Submitted to National Dairy Research Institute (Deemed University), Karnal,
India.
Sharma, V., Lal, D. and Sharma, R. (2007). Color Based Platform Test for the
Detection of Vegetable Oils/ Fats in Ghee. Indian J. Dairy Sci. 60(1): 16-18.
Shenstone, F.S. and Vickery, J.R. (1959). Substances in plants of the order
Malvales causing pink whites in stored eggs. Poult. Sci. 38:1055-1070.
Singh, R. (2011). Dairy and Products Annual. Global Agricultural Information
Network Report Number: IN1112. Approved by: Thom Wright.
Singhal, O.P. (1980). Adulterants and methods for detection. Indian Dairyman.
32:771-774.
Singhal, O.P. (1973). Studies on ghee (clarified butterfat) and animal body fats with
a view to detect adulteration. Ph.D. Thesis. Submitted to Panjab University,
Chandigarh.
Singhal, O.P. (1987). Detection of adulteration in butterfat. NDRI Annual Report,
pp. 64-65.
Singhal, R.S., Kulkarni, P.R. and Dinanath, V. (1997). Edible oils and Fats. In
Handbook of indices of food quality and authenticity. Woodhead Publishing
Ltd. pp. 301-357.
Sofia, P.Z. 2005. Assessment of methods for detection of palm oil and/ or coconut
oil in ghee. M.Sc. Thesis submitted to National Dairy Research Institute
(Deemed University), Karnal, India.
x
Sofia, P.Z., Parmar, S.C., Bhavadasan, M.K. and Nath, B.S. (2010). Detection of
adulteration of ghee with coconut oil and palm oil. Indian J. Dairy Sci. 63(4):
278-282.
Toppino, P.M., Contarini, G., Trauersi, A.L., Amelotti, G. and Gargario, A. (1980).
Gas chromatographic parameters of genuine butter. Rivista Italiana delle
Sostanze Grasse. 59(12):592.
Ulberth, F. (1994). Detection of milk fat adulteration by linear discriminant analysis
of fatty acids. J. Assoc. Off. Agric. Chem. 77(5):1326-1334.
Velu, T. (1971). The detection of adulteration of butterfat. Madras Agric. J.
58:901-902.
Venkatachalam, A. and Sundaram, S. (1957). Detection of mineral oil in milk fat.
Curr. Sci., 26:157.
Webb, B.H., Johnson, A.H. and Alford, J.A. (1987). Fundamentals of Dairy
Chemistry. CBS Publishers & Distributors, Delhi.
Winton, A.L. and Winton, K.B. (1999). Techniques of food analysis. Allied Scientific Publishers, Bikaner.
Wolff, J.P. (1960). Gas chromatography in the control of butter purity. Ann. Falsif.
Expert. Chim. 53: 318-325.


![Sheep Milk, Sheep Cheese · Use milk higher in casein and fat Increase casein retention Increase fat retention How to improve cheese yield? [RF (%fat in milk) + RC (% casein in milk)]](https://img.pdfslide.net/doc/110x75/5ec5e9bced3a6867603dc67a/sheep-milk-sheep-cheese-use-milk-higher-in-casein-and-fat-increase-casein-retention.jpg)