Embed Size (px)
Citation preview
Vol.:(0123456789)1 3
https://doi.org/10.1007/s13353-021-00654-z
PLANT GENETICS • REVIEW
Detection of candidate gene networks involved in resistance to Sclerotinia sclerotiorum in soybean
Yu Zhang1 · Yuexing Wang2 · Wanying Zhou1 · Shimao Zheng1 · Runzhou Ye3
Received: 2 January 2021 / Revised: 30 June 2021 / Accepted: 17 July 2021 © The Author(s) 2021
AbstractQuantitative trait locus (QTL) mapping often yields associations with dissimilar loci/genes as a consequence of diverse fac-tors. One trait for which very limited agreement between mapping studies has been observed is resistance to white mold in soybean. To explore whether different approaches applied to a single data set could lead to more consistent results, haplotype-trait association and epistasis interaction effects were explored as a complement to a more conventional marker-trait analysis. At least 10 genomic regions were significantly associated with Sclerotinia sclerotiorum resistance in soybean, which have not been previously reported. At a significance level of α = 0.05, haplotype-trait association showed that the most prominent signal originated from a haplotype with 4-SNP (single nucleotide polymorphism) on chromosome 17, and single SNP-trait analysis located a nucleotide polymorphism at position rs34387780 on chromosome 3. All of the peak-SNPs (p-value < 0.05) of each chromosome also appeared in their respective haplotypes. Samples with extreme phenotypes were singled-out for association studies, 25–30% from each end of the phenotypic spectrum appeared in the present investigation to be the most appropriate sample size. Some key genes were identified by epistasis interaction analysis. By combining information on the nearest positional genes indicated that most loci have not been previously reported. Gene ontology (GO) and Kyoto Encyclopedia of Genes and Genomes (KEGG) enrichment analyses suggest potential candidate genes underlying callose deposition in the cell wall and mitogen-activated protein kinase (MAPK) signaling pathway-plant, as well as plant-pathogen interaction pathway, were activated. Integration of multi-method genome-wide association study (GWAS) revealed novel genomic regions and promising candidate genes in novel regions, which include Glyma.01g048500, Glyma.03g129100, Glyma.17g072200, and the Dishevelled (Dvl) family of proteins on chromosomes 1, 3, 17, and 20, respectively.
Keywords Sclerotinia sclerotiorum · SNP · Haplotype · Epistasis · Post-GWAS
Background
White mold (WM) in soybean is a global soybean disease that emerged in the mid-80 s and spread across countries such as the USA, Canada, Argentina, Turkey, Japan, and India (Hoffnan et al. 1998; Ploper 1999). Particularly in North American and Canadian cropping areas, WM has become one of the major factors affecting soybean produc-tion. The disease is caused by infection with Sclerotinia sclerotiorum (Lib.) de Bary. In 1986, the incidence of this pathogen in Canadian legume production reached 25% (Tu 1986). In recent years, WM has continued to spread, causing an increased harm and serious threats to soybean yield (Koenning and Wrather 2010; Peltier et al. 2012). Taken together, the selecting resistant soybean cultivars is the most economical and effective way to control the dis-ease. Although no soybean line that is completely resistant
Communicated by: Izabela Pawłowicz
* Yu Zhang [email protected]
Yuexing Wang [email protected]
Wanying Zhou [email protected]
Shimao Zheng [email protected]
Runzhou Ye [email protected]
1 School of Biological Sciences and Engineering, Shaanxi University of Technology, Hanzhong 72300, Shaanxi, China
2 College of Agronomy, Xinjiang Agricultural University, Urumqi 830052, China
3 Faculté de Médecine Et Des Sciences de La Santé, Université de Sherbrooke, Sherbrooke, QC J1H 5N4, Canada
/ Published online: 11 September 2021
Journal of Applied Genetics (2022) 63:1–14
1 3
to Sclerotinia has been identified to date, some are known to exhibit partial resistance, a property shown to be a quantita-tively inherited trait conferred by multiple genes (Kim et al. 1999; Li et al. 2010; Song et al. 2017). However, the fact that quantitative traits are highly sensitive to environmental factors impedes the accurate selection of target traits under field conditions, thus making it difficult to identify resist-ant germplasm resources. Therefore, the use of molecular markers to selectively develop disease-resistant cultivars is essential.
Since the first localization of QTL for Sclerotinia resist-ance of soybean by Kim and Diers within the progeny of a biparental cross in 2000 (Kim and Diers 2000), many addi-tional studies have attempted to map loci conferring Scle-rotinia resistance (Arahana et al. 2001; Li et al. 2010; Guo et al. 2008; Hanet al. 2008; Vuong et al. 2008; Huynh et al. 2010). In the last decade, with the development of next-gen-eration sequencing technologies, genome-wide association studies (GWAS) using SNPs have become the most widely used approach to map traits of interest. Subsequent to the progress made by GWAS in human disease research, this approach has been used in the detection of candidate genes for disease resistance.
Currently, the use of molecular markers for selectively cultivating Sclerotinia-resistant soybean has not yet been implemented in practice. Treating the leaves, roots, and stems with oxalic acid and subsequently evaluating the degree of wilting and the level of soluble pigment still represent the main method for selecting soybean cultivars with Sclerotinia resistance (Li et al. 2016). In 2010, Li et al. (2011) used SSR markers to discover QTL conferring solu-ble pigment (SP) content variations that are related to WM resistance and identified linkage groups D1a + q (Gm01), B1 (Gm11), and A2 (Gm08). In a more recent GWAS for WM resistance-associated SP content, 25,179 SNPs from 330 soybean genotypes allowed the detection of a prominent signal on chromosome 13, followed by signals on Gm06, Gm10, and Gm11; 4 candidate genes related to WM disease response and the biosynthetic pathways of anthocyanin were located in the vicinity (< 60 kb) of significant SNPs (Zhao et al. 2015). In 2014, Bastien et al. (2014) used 7864 SNPs of 130 Canadian soybean genotypes by TASSEL3.0 soft-ware to elucidate QTL (in order of significance) on Gm15, Gm01, Gm20, and Gm19. In 2015, Iquira et al. (2015) used 8297 SNPs from 101 samples and located QTL (in order of significance) on Gm03, Gm08, and Gm20. Because of differences in soybean type, sample size, phenotype meas-urement method, marker type and density, and analytical algorithm method, QTL for WM resistance show large vari-ations across studies.
One weakness of working with individual markers/SNPs is that these are not inherited independently; rather, these have a propensity to be inherited in clusters of physically
close loci, thus resulting in linkage disequilibrium (LD). Markers that are in high LD within a particular set of mate-rials form haplotypes. The diversity of haplotypes in a genomic region is not limited to the two alleles typically seen for a single SNP locus. As a consequence, haplotypes may more accurately capture the underlying allelic diversity at loci controlling a trait of interest. When used in associa-tion tests, haplotypes may therefore better capture the asso-ciation to the studied trait (Song et al. 2017).
At the same time, most complex traits are determined by the interactions between multiple genes. This is especially true for the phenotypes controlling disease susceptibility, for which associations based on single loci are usually not suf-ficient to explain or simulate complex traits. Although these alleles are associated with the disease, most of them merely have small effects when considered individually. Gene–gene interactions are often considered to be the cause of the unex-plained genetic variations in complex phenotypes, and these interactions are sometimes overlooked in GWAS (Kanishka et al. 2011).
In addition, a challenge in characterizing a complex dis-ease such as WM is the accurate assessment of the degree of resistance. One possible way to facilitate the identification of reliable QTL is to divide the population into two groups expressing extreme phenotypes and discarding those with intermediate phenotypes (Anderson et al., 2010). The use of extreme samples taken from 10 to 35% on either side of the phenotypic distribution curve has previously been reported to be effective for the purpose of identifying associated QTL (Zhang et al. 2011).
To further investigate the QTL conferring partial resist-ance to WM in soybean, In this study, we employ 20,691 SNPs to reanalysis a previously published dataset that used 7864 SNPs analysis (Bastien et al. 2014), and performed haplotype-trait association analyses, as well as epistatic interaction analysis using both the full genotype set (n = 126) and only extreme phenotypes (n = 76), which comparing sin-gle SNP-trait association tests only by Bastien et al. The detected QTL were compared with the results of other stud-ies, and candidate genes were identified by GO enrichment and KEGG pathway enrichment analyses.
Materials and methods
Soybean lines
A panel of 126 soybean lines originate from the article “ genome wide association mapping of sclerotinia sclerotio-rum resistance in soybean with a genotyping-by-sequenc-ing approach” (Bastien et al. 2014), in which representa-tive of the diversity present in a private breeding program
2 Journal of Applied Genetics (2022) 63:1–14
1 3
(Semences Prograin Inc.) in Eastern Canada (see list in Sup-plementary Table S1).
Phenotype data
Phenotype data (the stem lesion length) were provided by Bastien(Bastien et al. 2012).
Genotype data
Single-end sequencing was performed on three lanes of an Illumina HiSeq2000 (at the McGill University-Génome Québec Innovation Center in Montreal, QC, Canada). Data quality control is essential to GWAS. In the present inves-tigation, the r2 value for linkage disequilibrium, the LOD, and the confidence interval were set to 0.8, 3, and 95%, respectively. HWE (Hardy–Weinberg equilibrium) was not considered. A total of 20,691 SNPs passed the MAF (minor allele frequency) lower limit of 5%; for association, α = 0.05 was used as the cut-off significance, which corresponded to a non-adjusted p-value of 2.42 × 10⁻⁶ (0.05/20,691). The 126 samples provided a total of 2,607,066 loci, among which 213,559 (8.192%) were heterozygous.
Population structure
STRU CTU RE 2.3.4 (http:// taylo r0. biolo gy. ucla. edu/ struc tureH arves teroy base. org/ tools. php) for population structure analysis with the MCMC algorithm and NJ algorithm was used to perform clustering analysis, and phylogenetic recon-struction was conducted using MEGA5.05 (http:// www. megas oftwa re. net/). SPSS was used for principal component analysis (https:// www. ibm. com/ analy tics/ us/ en/ techn ology/ spss/). The Bayesian clustering algorithm implemented in STRU CTU RE 2.3.4 was used to simulate population genetic structure. According to the Q value distribution of each pop-ulation, it is considered that the sample has a single blood relationship when the Q value of a sample in a population is greater than or equal to 0.6, and it is considered that the sample has mixed sources when Q value is less than 0.6. To obtain an estimate of the most probable number of popula-tion (K), K values from 1 to 10 were simulated with 20 itera-tions for each K, using 10,000 burn-in periods followed by 10,000 Markov Chain Monte Carlo iterations. Delta K was plotted against K values and the best number of clusters was determined following the method proposed by Evanno et al. (2005), and population structure diagram was obtained by the Structure Harvester platform (Earl and Vonholdt 2012).
Association analysis
For complete phenotype set, single SNP-trait association tests, with additive effects only and additive effects plus
dominant effects of GLM (general linear model) or MLM (mixed linear model) model, were run in TASSEL v.5.0 (http:// www. maize genet ics. net/ tassel) in max(T) permuta-tion mode using a permutation test with 10,0000 times, and for haplotype analysis using PLINKv1.07 (http:// www. softp edia. com/ get/ Scien ce- CAD/ PLINK. shtml), the command line “–blocks” was used to assign SNPs to their respective haplotypes. Then, analysis for haplotype-trait association was performed, and haplotype-trait association analysis only for additive effects.
The frequency distribution of the genotypic segregation in the two groups (high-value group and low-value group, namely extreme phenotypes that were distributed at both ends of 126 phenotypic spectrum, it can be seen as reduced data set, we treat it as a quality character, assuming a disease phenotype as 1 = unaffected, 2 = affected, 0 = miss) will thus deviate from the Mendelian law. Using a chi-square test to assess this deviation for either or both groups, it was then possible to infer whether the marker is linked to the QTL. In the analysis with extreme phenotypes as implemented in HAPLOVIEW4.2 (http:// www. broad insti tute. org/ haplo view), because sample size was reduced without a decrease in the number of markers used, an increase in the number of false positives resulted from higher inflation; p-values were thus adjusted through a 10,000-time permutation test approach. With the 95% CI of D’ value bound between 0.70 and 0.98 for adjacent SNPs to infer haplotype blocks, then carry out haplotype-phenotype association tests of extreme phenotype set.
SNP × SNP epistatic interaction analysis
PLINK v1.07 has different modes for specifying which SNPs are tested. To increase the power of epistasis detection, three analytical methods were used: (1) all SNP-by-all SNP two-locus epistasis test between all of the 205,284,045 SNP pairs; (2) SNP-by-SNP epistasis test between only significant SNPs pre-filtered by genome-wide association analyses; and (3) SNP-by-all epistasis test between significant SNPs and all SNPs. CYTOSCAPE v3.7.1 was used to visualize the interaction network.
Results
LD decay and haplotype construction
To compare the results of QTL mapping analyses conducted either using individual SNP markers or haplotypes, we first needed to assemble a catalogue of haplotypes for our asso-ciation panel comprising 126 soybean lines. Genotyping-by-sequencing was used to obtain SNP data for this panel of soybean lines and these were then used to construct
3Journal of Applied Genetics (2022) 63:1–14
1 3
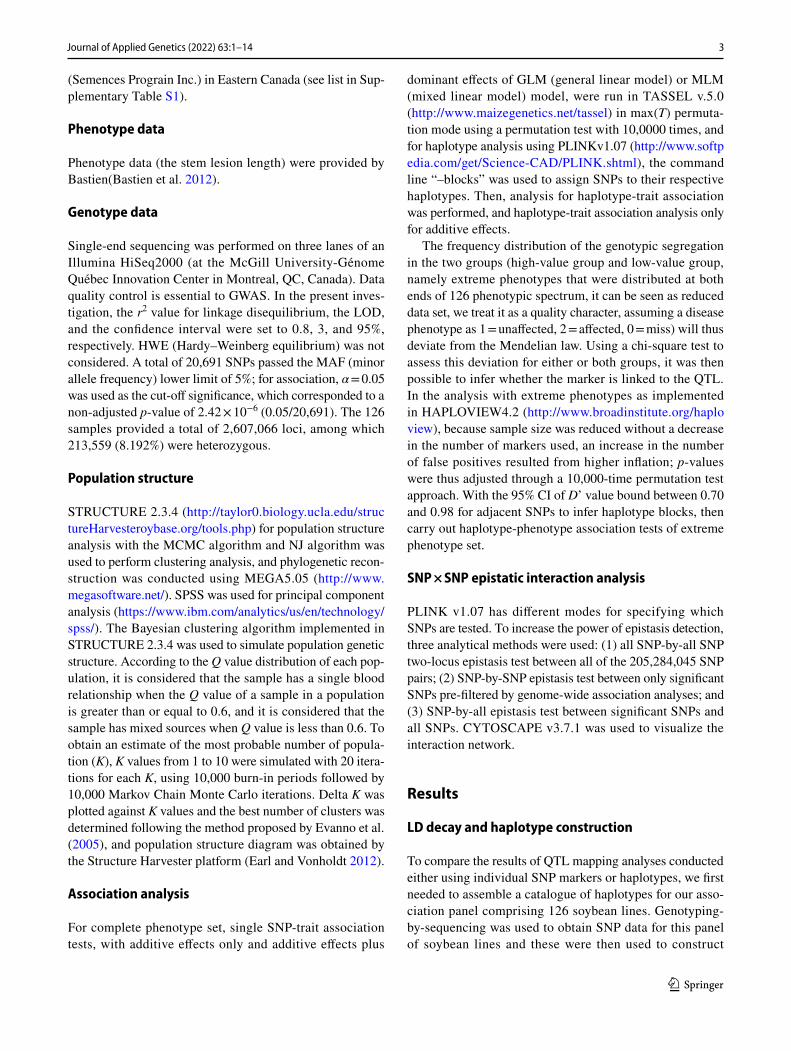
haplotypes based on the observed LD. At r2 > 0.2, 84,255 pairs of SNPs were found to be in LD. Among the 84,255 marker pairs in LD, an average r2 of 0.73 was observed; 46,322 pairs (55.0%) had r2 ≥0.8, and 7841 pairs (9.3%) showed an r2 value of 1. The distribution of LD along each chromosome was uneven. The average physical distance between pairs of loci decreased as their LD increased. Pairs with r2 < 0.8 were 154.1 kb apart, pairs with r2 ≥ 0.8 were 139.7 kb apart, and pairs with r2 = 1 were separated by 99.6 kb. The 20 chromosomes yielded a total of 2,858 predicted haplotypes (Fig. 1), with chromosome 18 possess-ing the most haplotypes (229) and chromosome 11 possess-ing the least (57). The largest haplotype was composed of 36 SNPs, whereas the smallest haplotype comprised only 2 SNPs, and a haplotype consists of 5 SNPs on average. The average length of the haplotype is 64.4 kb; the longest
haplotype spanned 200.0 kb, whereas the shortest encom-passed only 2 bp. The distribution of SNPs along each chro-mosome was uneven, where chromosome 18 contained the largest number of markers (1596), whereas chromosome 11 included the fewest (488).
Population structure analysis
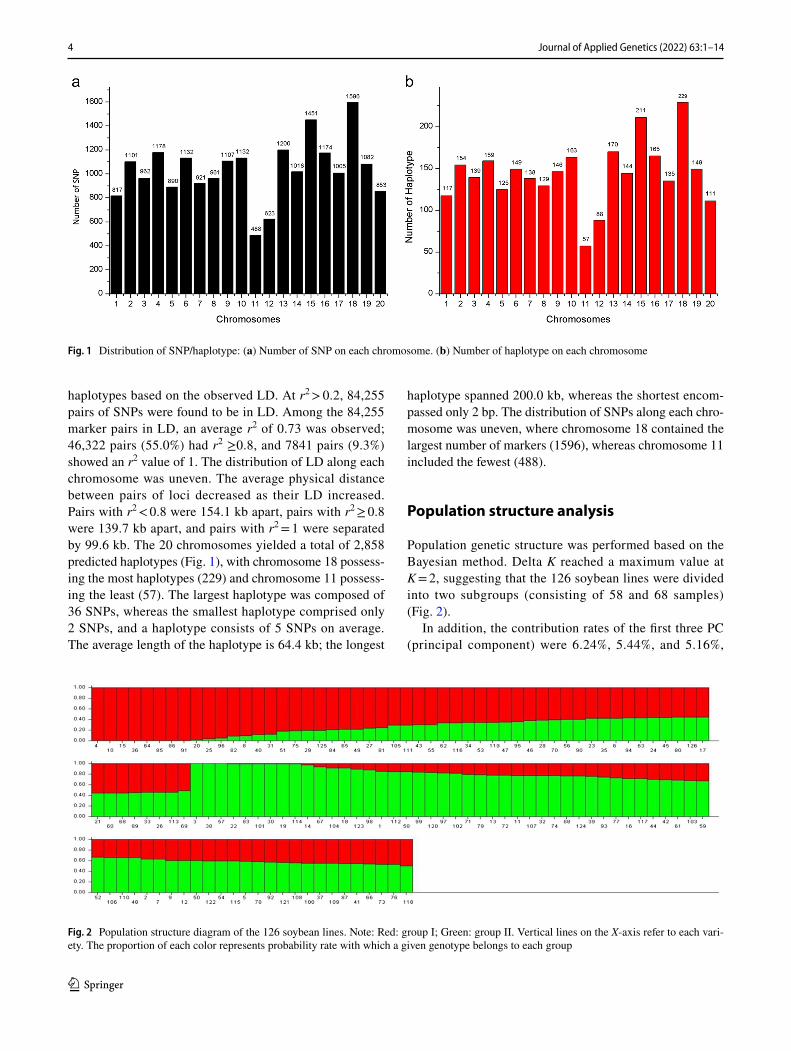
Population genetic structure was performed based on the Bayesian method. Delta K reached a maximum value at K = 2, suggesting that the 126 soybean lines were divided into two subgroups (consisting of 58 and 68 samples) (Fig. 2).
In addition, the contribution rates of the first three PC (principal component) were 6.24%, 5.44%, and 5.16%,
Fig. 1 Distribution of SNP/haplotype: (a) Number of SNP on each chromosome. (b) Number of haplotype on each chromosome
Fig. 2 Population structure diagram of the 126 soybean lines. Note: Red: group I; Green: group II. Vertical lines on the X-axis refer to each vari-ety. The proportion of each color represents probability rate with which a given genotype belongs to each group
4 Journal of Applied Genetics (2022) 63:1–14
1 3
respectively, and the 126 lines cannot be clearly grouped by PC method, while the 126 soybean genotypes into two groups using NJ (neighbor joining). However, the genetic distance between these two groups was not significant, indicating that the samples have a low level of genetic stratification.
Genome‑wide association study approaches
The results showed that the resistance to Sclerotinia infec-tion among the 126 soybean lines was significantly different, in which varied from 28.6 to 192.4 mm, with the traits of continuous distribution and quantitative inheritance.
Complete phenotype set association analysis
Single SNP‑trait association analysis
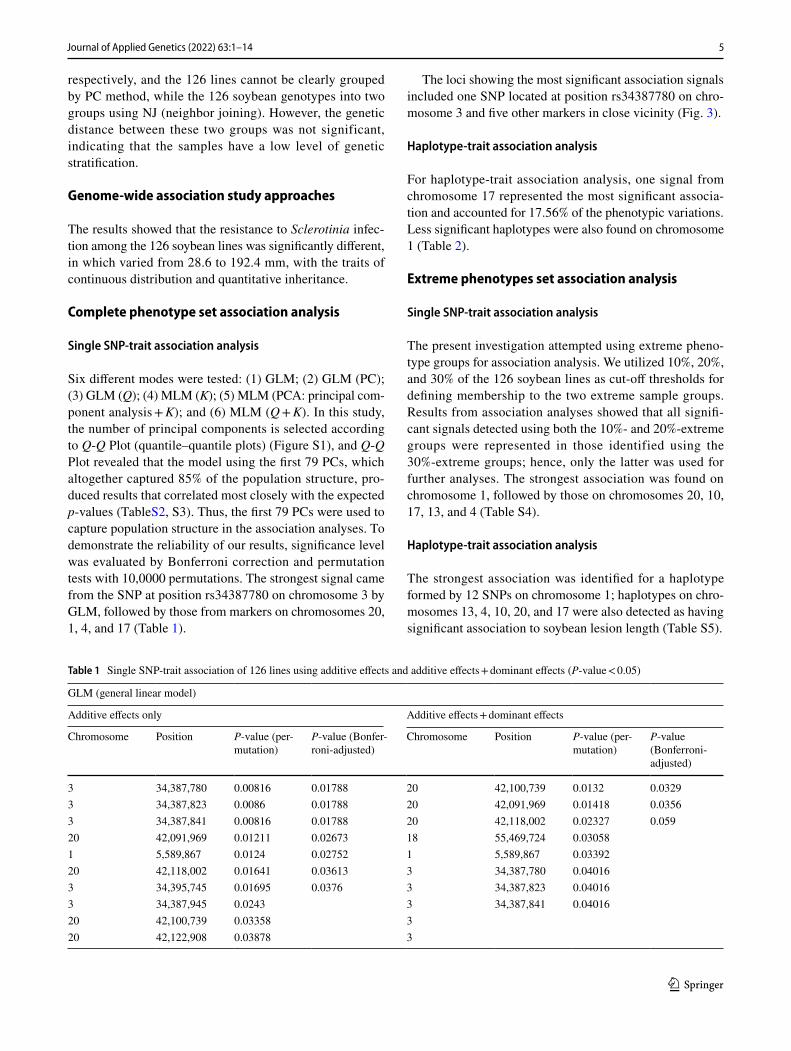
Six different modes were tested: (1) GLM; (2) GLM (PC); (3) GLM (Q); (4) MLM (K); (5) MLM (PCA: principal com-ponent analysis + K); and (6) MLM (Q + K). In this study, the number of principal components is selected according to Q-Q Plot (quantile–quantile plots) (Figure S1), and Q-Q Plot revealed that the model using the first 79 PCs, which altogether captured 85% of the population structure, pro-duced results that correlated most closely with the expected p-values (TableS2, S3). Thus, the first 79 PCs were used to capture population structure in the association analyses. To demonstrate the reliability of our results, significance level was evaluated by Bonferroni correction and permutation tests with 10,0000 permutations. The strongest signal came from the SNP at position rs34387780 on chromosome 3 by GLM, followed by those from markers on chromosomes 20, 1, 4, and 17 (Table 1).
The loci showing the most significant association signals included one SNP located at position rs34387780 on chro-mosome 3 and five other markers in close vicinity (Fig. 3).
Haplotype‑trait association analysis
For haplotype-trait association analysis, one signal from chromosome 17 represented the most significant associa-tion and accounted for 17.56% of the phenotypic variations. Less significant haplotypes were also found on chromosome 1 (Table 2).
Extreme phenotypes set association analysis
Single SNP‑trait association analysis
The present investigation attempted using extreme pheno-type groups for association analysis. We utilized 10%, 20%, and 30% of the 126 soybean lines as cut-off thresholds for defining membership to the two extreme sample groups. Results from association analyses showed that all signifi-cant signals detected using both the 10%- and 20%-extreme groups were represented in those identified using the 30%-extreme groups; hence, only the latter was used for further analyses. The strongest association was found on chromosome 1, followed by those on chromosomes 20, 10, 17, 13, and 4 (Table S4).
Haplotype‑trait association analysis
The strongest association was identified for a haplotype formed by 12 SNPs on chromosome 1; haplotypes on chro-mosomes 13, 4, 10, 20, and 17 were also detected as having significant association to soybean lesion length (Table S5).
Table 1 Single SNP-trait association of 126 lines using additive effects and additive effects + dominant effects (P-value < 0.05)
GLM (general linear model)
Additive effects only Additive effects + dominant effects
Chromosome Position P-value (per-mutation)
P-value (Bonfer-roni-adjusted)
Chromosome Position P-value (per-mutation)
P-value (Bonferroni-adjusted)
3 34,387,780 0.00816 0.01788 20 42,100,739 0.0132 0.03293 34,387,823 0.0086 0.01788 20 42,091,969 0.01418 0.03563 34,387,841 0.00816 0.01788 20 42,118,002 0.02327 0.05920 42,091,969 0.01211 0.02673 18 55,469,724 0.030581 5,589,867 0.0124 0.02752 1 5,589,867 0.0339220 42,118,002 0.01641 0.03613 3 34,387,780 0.040163 34,395,745 0.01695 0.0376 3 34,387,823 0.040163 34,387,945 0.0243 3 34,387,841 0.0401620 42,100,739 0.03358 320 42,122,908 0.03878 3
5Journal of Applied Genetics (2022) 63:1–14
1 3
The analyses using extreme phenotype groups (both sin-gle SNP-trait and haplotype-trait) revealed that the peak-SNPs in the single SNP-trait analysis also appeared in their respective haplotypes. Because the method using extreme groups suffered from a diminished number of soybean genotypes, the analysis using haplotypes had proven to be advantageous by reducing the degree of freedom; hence, the adjusted p-value threshold for the haplotype-based analy-sis was lowered to α = 0.01 for subsequent candidate gene selection.
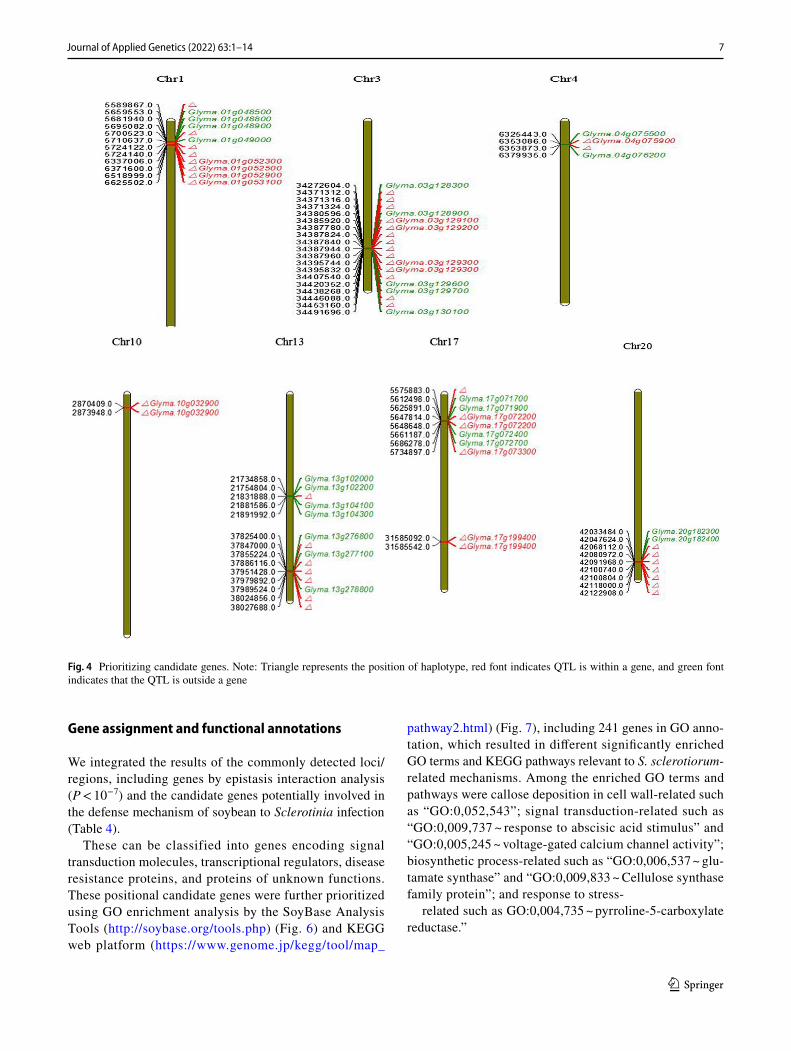
The results of QTL mapping for S. sclerotiorum resist-ance in soybean using the abovementioned methods are shown in Fig. 4.
SNP × SNP epistatic interaction analysis
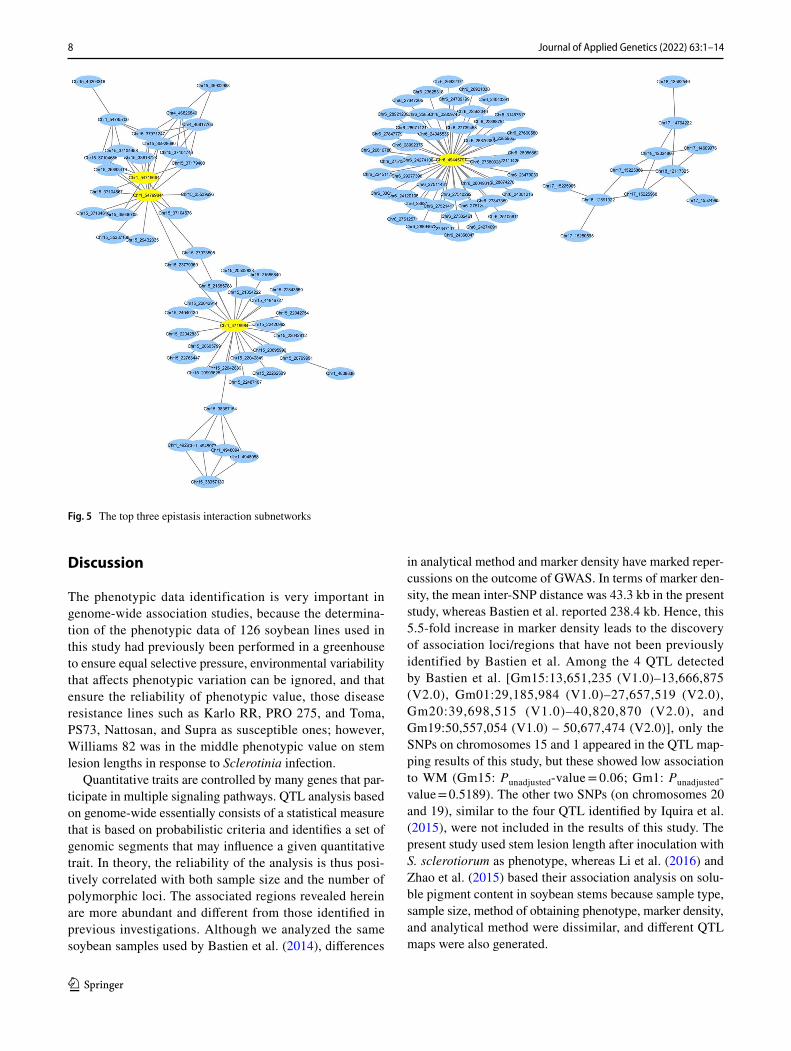
With methods (2) and (3), the use of different p-value thresh-olds for declaring significant association and for defining significant SNP groups yielded different results. With a single-SNP cut-off p-value of 1 × 10⁻⁴, neither method (2) nor method (3) produced significant epistatic interac-tions. Thus, we used the ALL × ALL epistasis mode by PLINK v1.07 and performed a total of 205,284,045 valid SNP × SNP tests. A total of 220 SNPs were involved in the
interaction network (cutoff p-value < 0.07) (Table S5), with 112 SNPs in the first three subnetworks. Multiple inter-actions were found between Gm01 and Gm15 and within Gm06 (Fig. 5). In the first sub-network, there were 9, 17, and 24 proteins interacting with SNP Chr1-rs54719664, Chr1-rs54799844, and Chr1-rs4719984 based on shortest path search, respectively, of which high-node genes in the network may regulate other genes or be regulated by other genes. Among these, Chr1-rs54719664 is closely linked to the Glma.01g216800 and Glma.01g216900 gene, which were annotated as cytochrome P450, family 87, subfamily A, and polypeptide 2. Chr1-rs54799844, a SNP locus within the Glma.01g217900 gene, was annotated as transcription initia-tion factor TFIIE, beta subunit. Chr1-rs4719984 is closely linked to Glma.01g043300 and Glma.01g043400 genes, which were annotated as WRKY DNA-binding protein 72 and cystathionine beta-synthase (CBS) protein, respectively.
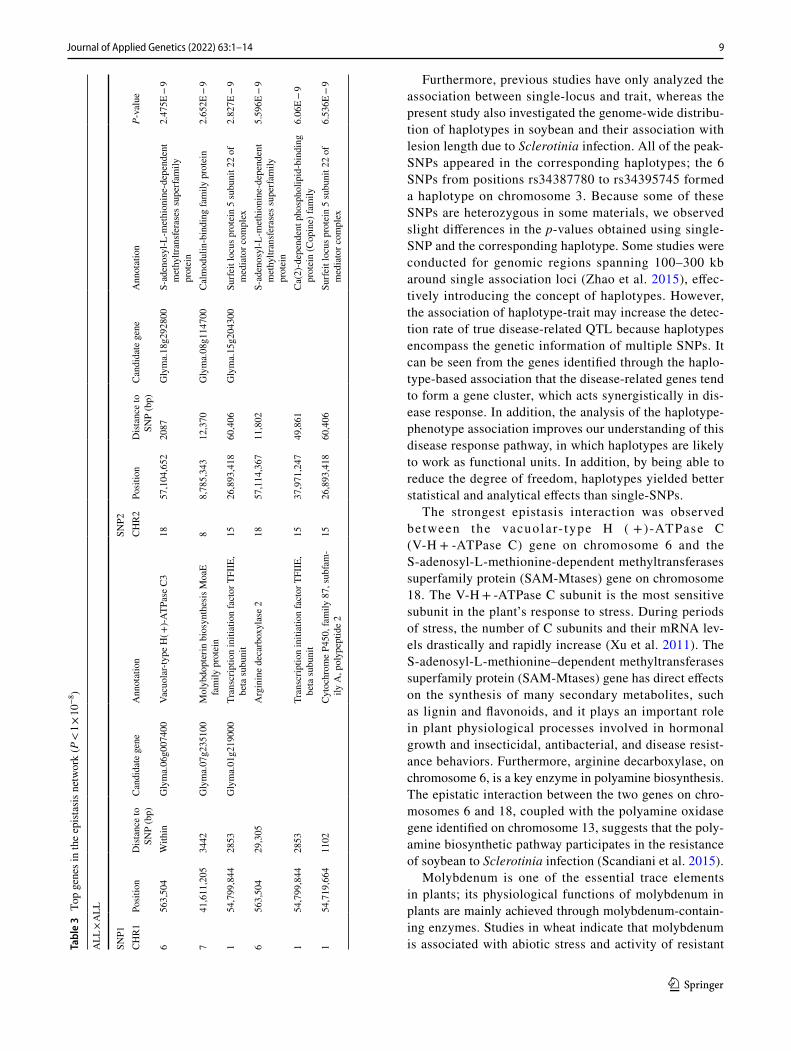
For further analysis, the asymptotic p-values produced by the all SNP-by-all SNP interaction analysis that were smaller than 1 × 10⁻⁸ were considered (Table 3).
Fig. 3 Manhattan plot of the association between single SNP-Trait. Note: P-values for the association of each single nucleotide polymor-phism with phenotype are shown on the y-axis. The SNPs are plot-
ted on the x-axis according to their chromosomal location. Blue line: α = 0.05; red line: α = 0.01 (additive effects only)
Table 2 Haplotype-trait analysis of 126 lines (p-value < 0.05)
Chromosome Position of haplotype Haplotype (1 = A, 2 = C, 3 = G, 4 = T)
R2 P-value (Bonferroni-adjusted)
17 5,575,883|5,647,814|5,648,648|5,734,897 3114 0.1756 0.0211 5,589,867|5,700,523|5,724,122|5,724,140 1223 0.1648 0.049
6 Journal of Applied Genetics (2022) 63:1–14
1 3
Gene assignment and functional annotations
We integrated the results of the commonly detected loci/regions, including genes by epistasis interaction analysis (P < 10−7) and the candidate genes potentially involved in the defense mechanism of soybean to Sclerotinia infection (Table 4).
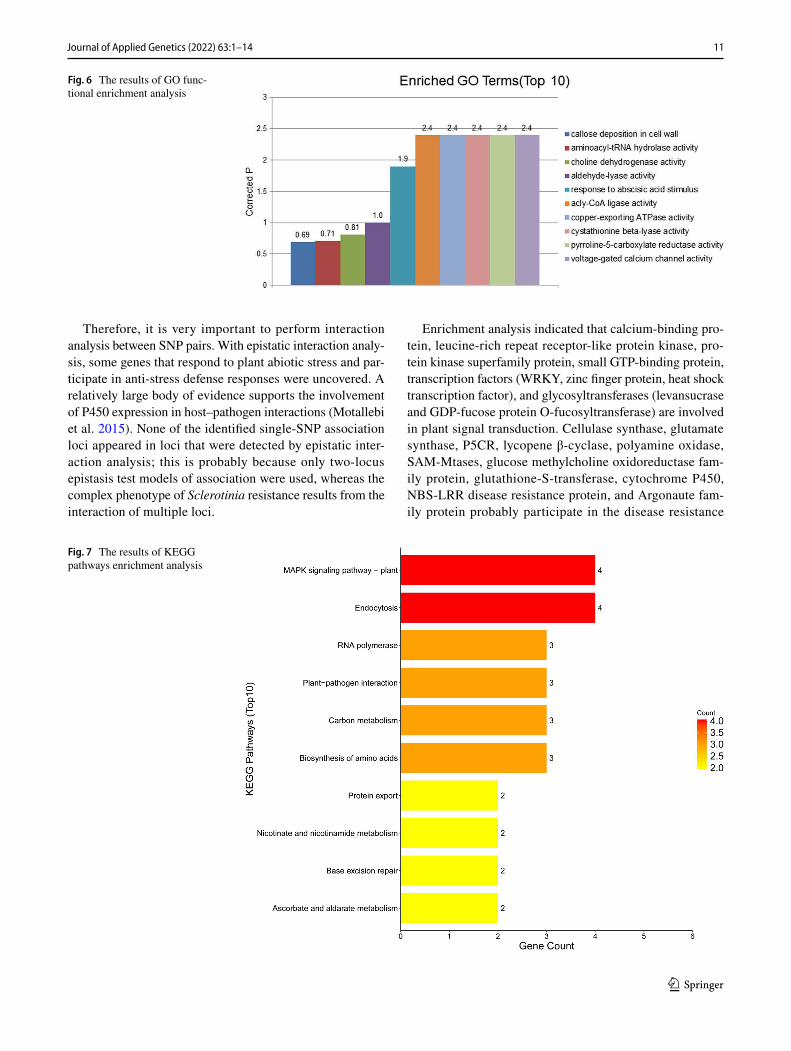
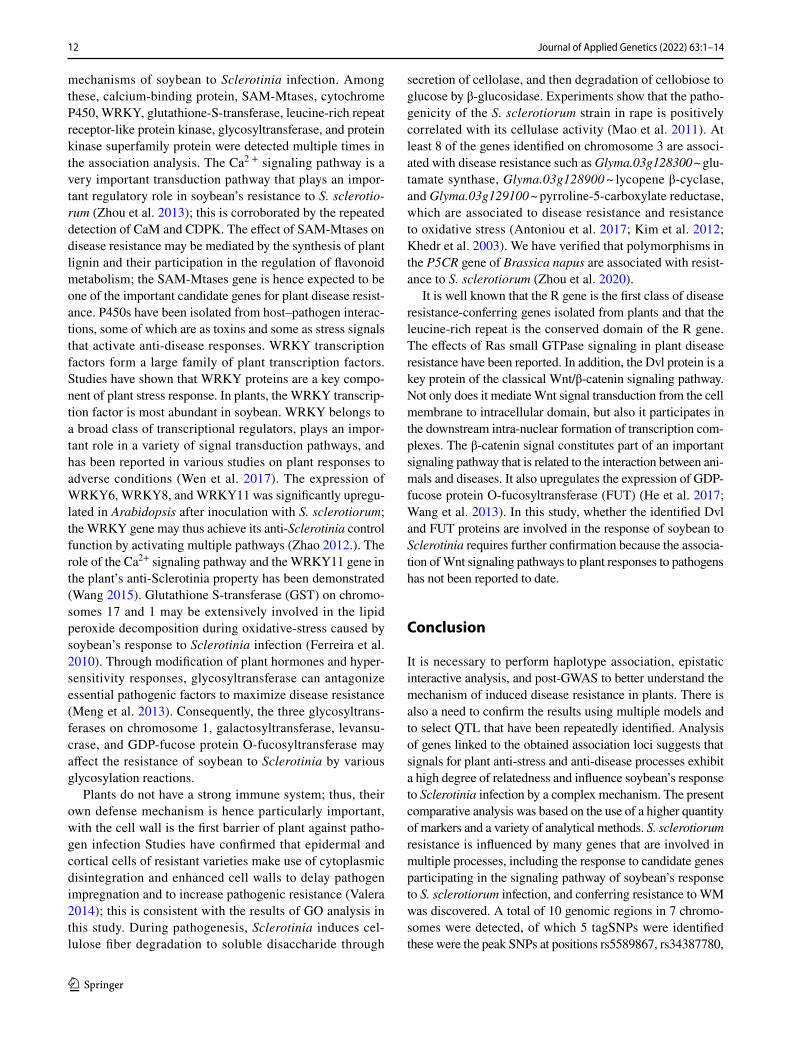
These can be classified into genes encoding signal transduction molecules, transcriptional regulators, disease resistance proteins, and proteins of unknown functions. These positional candidate genes were further prioritized using GO enrichment analysis by the SoyBase Analysis Tools (http:// soyba se. org/ tools. php) (Fig. 6) and KEGG web platform (https:// www. genome. jp/ kegg/ tool/ map_
pathw ay2. html) (Fig. 7), including 241 genes in GO anno-tation, which resulted in different significantly enriched GO terms and KEGG pathways relevant to S. sclerotiorum-related mechanisms. Among the enriched GO terms and pathways were callose deposition in cell wall-related such as “GO:0,052,543”; signal transduction-related such as “GO:0,009,737 ~ response to abscisic acid stimulus” and “GO:0,005,245 ~ voltage-gated calcium channel activity”; biosynthetic process-related such as “GO:0,006,537 ~ glu-tamate synthase” and “GO:0,009,833 ~ Cellulose synthase family protein”; and response to stress-
related such as GO:0,004,735 ~ pyrroline-5-carboxylate reductase.”
Fig. 4 Prioritizing candidate genes. Note: Triangle represents the position of haplotype, red font indicates QTL is within a gene, and green font indicates that the QTL is outside a gene
7Journal of Applied Genetics (2022) 63:1–14
1 3
Discussion
The phenotypic data identification is very important in genome-wide association studies, because the determina-tion of the phenotypic data of 126 soybean lines used in this study had previously been performed in a greenhouse to ensure equal selective pressure, environmental variability that affects phenotypic variation can be ignored, and that ensure the reliability of phenotypic value, those disease resistance lines such as Karlo RR, PRO 275, and Toma, PS73, Nattosan, and Supra as susceptible ones; however, Williams 82 was in the middle phenotypic value on stem lesion lengths in response to Sclerotinia infection.
Quantitative traits are controlled by many genes that par-ticipate in multiple signaling pathways. QTL analysis based on genome-wide essentially consists of a statistical measure that is based on probabilistic criteria and identifies a set of genomic segments that may influence a given quantitative trait. In theory, the reliability of the analysis is thus posi-tively correlated with both sample size and the number of polymorphic loci. The associated regions revealed herein are more abundant and different from those identified in previous investigations. Although we analyzed the same soybean samples used by Bastien et al. (2014), differences
in analytical method and marker density have marked reper-cussions on the outcome of GWAS. In terms of marker den-sity, the mean inter-SNP distance was 43.3 kb in the present study, whereas Bastien et al. reported 238.4 kb. Hence, this 5.5-fold increase in marker density leads to the discovery of association loci/regions that have not been previously identified by Bastien et al. Among the 4 QTL detected by Bastien et al. [Gm15:13,651,235 (V1.0)–13,666,875 (V2.0), Gm01:29,185,984 (V1.0)–27,657,519 (V2.0), Gm20:39,698,515 (V1.0)–40,820,870 (V2.0), and Gm19:50,557,054 (V1.0) – 50,677,474 (V2.0)], only the SNPs on chromosomes 15 and 1 appeared in the QTL map-ping results of this study, but these showed low association to WM (Gm15: Punadjusted-value = 0.06; Gm1: Punadjusted-value = 0.5189). The other two SNPs (on chromosomes 20 and 19), similar to the four QTL identified by Iquira et al. (2015), were not included in the results of this study. The present study used stem lesion length after inoculation with S. sclerotiorum as phenotype, whereas Li et al. (2016) and Zhao et al. (2015) based their association analysis on solu-ble pigment content in soybean stems because sample type, sample size, method of obtaining phenotype, marker density, and analytical method were dissimilar, and different QTL maps were also generated.
Fig. 5 The top three epistasis interaction subnetworks
8 Journal of Applied Genetics (2022) 63:1–14
1 3
Furthermore, previous studies have only analyzed the association between single-locus and trait, whereas the present study also investigated the genome-wide distribu-tion of haplotypes in soybean and their association with lesion length due to Sclerotinia infection. All of the peak-SNPs appeared in the corresponding haplotypes; the 6 SNPs from positions rs34387780 to rs34395745 formed a haplotype on chromosome 3. Because some of these SNPs are heterozygous in some materials, we observed slight differences in the p-values obtained using single-SNP and the corresponding haplotype. Some studies were conducted for genomic regions spanning 100–300 kb around single association loci (Zhao et al. 2015), effec-tively introducing the concept of haplotypes. However, the association of haplotype-trait may increase the detec-tion rate of true disease-related QTL because haplotypes encompass the genetic information of multiple SNPs. It can be seen from the genes identified through the haplo-type-based association that the disease-related genes tend to form a gene cluster, which acts synergistically in dis-ease response. In addition, the analysis of the haplotype-phenotype association improves our understanding of this disease response pathway, in which haplotypes are likely to work as functional units. In addition, by being able to reduce the degree of freedom, haplotypes yielded better statistical and analytical effects than single-SNPs.
The strongest epistasis interaction was observed between the vacuolar- type H ( +)-ATPase C (V-H + -ATPase C) gene on chromosome 6 and the S-adenosyl-L-methionine-dependent methyltransferases superfamily protein (SAM-Mtases) gene on chromosome 18. The V-H + -ATPase C subunit is the most sensitive subunit in the plant’s response to stress. During periods of stress, the number of C subunits and their mRNA lev-els drastically and rapidly increase (Xu et al. 2011). The S-adenosyl-L-methionine–dependent methyltransferases superfamily protein (SAM-Mtases) gene has direct effects on the synthesis of many secondary metabolites, such as lignin and flavonoids, and it plays an important role in plant physiological processes involved in hormonal growth and insecticidal, antibacterial, and disease resist-ance behaviors. Furthermore, arginine decarboxylase, on chromosome 6, is a key enzyme in polyamine biosynthesis. The epistatic interaction between the two genes on chro-mosomes 6 and 18, coupled with the polyamine oxidase gene identified on chromosome 13, suggests that the poly-amine biosynthetic pathway participates in the resistance of soybean to Sclerotinia infection (Scandiani et al. 2015).
Molybdenum is one of the essential trace elements in plants; its physiological functions of molybdenum in plants are mainly achieved through molybdenum-contain-ing enzymes. Studies in wheat indicate that molybdenum is associated with abiotic stress and activity of resistant Ta
ble
3 T
op g
enes
in th
e ep
istas
is n
etw
ork
(P <
1 ×
10−
8 )
ALL
× A
LL
SNP1
SNP2
CH
R1
Posi
tion
Dist
ance
to
SNP
(bp)
Can
dida
te g
ene
Ann
otat
ion
CH
R2
Posi
tion
Dist
ance
to
SNP
(bp)
Can
dida
te g
ene
Ann
otat
ion
P-va
lue
656
3,50
4W
ithin
Gly
ma.
06g0
0740
0Va
cuol
ar-ty
pe H
( +)-A
TPas
e C
318
57,1
04,6
5220
87G
lym
a.18
g292
800
S-ad
enos
yl-L
-met
hion
ine-
depe
nden
t m
ethy
ltran
sfer
ases
supe
rfam
ily
prot
ein
2.47
5E −
9
741
,611
,205
3442
Gly
ma.
07g2
3510
0M
olyb
dopt
erin
bio
synt
hesi
s Moa
E fa
mily
pro
tein
88,
785,
343
12,3
70G
lym
a.08
g114
700
Cal
mod
ulin
-bin
ding
fam
ily p
rote
in2.
652E
− 9
154
,799
,844
2853
Gly
ma.
01g2
1900
0Tr
ansc
riptio
n in
itiat
ion
fact
or T
FIIE
, be
ta su
buni
t15
26,8
93,4
1860
,406
Gly
ma.
15g2
0430
0Su
rfeit
locu
s pro
tein
5 su
buni
t 22
of
med
iato
r com
plex
2.82
7E −
9
656
3,50
429
,305
Arg
inin
e de
carb
oxyl
ase
218
57,1
14,3
6711
,802
S-ad
enos
yl-L
-met
hion
ine-
depe
nden
t m
ethy
ltran
sfer
ases
supe
rfam
ily
prot
ein
5.59
6E −
9
154
,799
,844
2853
Tran
scrip
tion
initi
atio
n fa
ctor
TFI
IE,
beta
subu
nit
1537
,971
,247
49,8
61C
a(2)
-dep
ende
nt p
hosp
holip
id-b
indi
ng
prot
ein
(Cop
ine)
fam
ily6.
06E
− 9
154
,719
,664
1102
Cyt
ochr
ome
P450
, fam
ily 8
7, su
bfam
-ily
A, p
olyp
eptid
e 2
1526
,893
,418
60,4
06Su
rfeit
locu
s pro
tein
5 su
buni
t 22
of
med
iato
r com
plex
6.53
6E −
9
9Journal of Applied Genetics (2022) 63:1–14
1 3
enzymes (Al-Issawia et al. 2016). The interaction analysis on chromosomes 7 and 8 suggests that molybdenum cofactors, which can be combined with many molybdenum enzymes that induce physiological and anti-stress functions, play a role in the infection of soybean by Sclerotinia through Ca2+-signal transduction.
Cytochrome P450 is involved in plant responses to abi-otic and biological stressors (Jarsch and Ott 2011; An et al. 2017). Remorin is a family of N-terminal proline-rich mem-brane proteins; in particular, the proline content of group 1b remorin protein in dicotyledonous plants is twice that of group 1a remorin in other organisms (Raffaele et al. 2007). Additionally, the identification of pyrroline-5-carboxylate
reductase (P5CR), the enzyme that catalyzes the final step of proline synthesis through single-SNP association analysis, is also corroborated by the fact that remorin is a proline-rich protein. The interaction between plant remorin protein and bacteria has already been investigated (Lefebvre et al. 2010; Tóth et al. 2012). Using maize as a model, Jamann et al. (2016) were the first to confirm that an interaction exists between remorin and fungus. Previous studies have shown that members of the copine family may play a role in Ca2 + signaling; thus, given the interaction detected between the genes on chromosomes 1 and 15, these genes may be impli-cated in the response of soybean to Sclerotinia infection.
Table 4 Prioritizing candidate genes(P < 1 × 10⁻⁷)
Chr Position of haplotype Candidate gene Annotation
3 34,371,310/34371316/34371324/34385919/34387780/34387823/34387841/34387945/34387962/34395745/34395833/34407540/34446090/34453159
1.Glyma.03g1283002.Glyma.03g1289003.Glyma.03g1291004.Glyma.03g1292005.Glyma.03g1293006.Glyma.03g1296007.Glyma.03g1297008.Glyma.03g130100
1. Glutamate synthase2. Lycopene cyclase/lycopene β-cyclase3. Pyrroline-5- carboxylate (P5C) reductase4. Cytochrome P450, family 86, subfamily A, poly-
peptide 15. S-adenosyl-L-methionine-dependent methyltrans-
ferases superfamily protein6. Glutaredoxin family protein7. Cystathionine beta-lyase (CBL)8. Calcium-dependent phosphotriesterase superfamily
protein17 (01)17 (02)
5,575,883/5647814/5648648/573489731,585,092–31,585,542
1. Glyma.17g0717002. Glyma.17g0719003. Glyma.17g0722004. Glyma.17g0724005. Glyma.17g0727006. Glyma.17g0733007. Glyma.17g199400
1. Leucine-rich receptor-like protein kinase family protein
2. Calcium-binding EF-hand family protein3. Cellulose synthase family protein4. Heat shock protein 70B5. Nucleic acid binding6. Signal recognition particle receptor alpha subunit
family protein7. Glutathione S-transferase THETA 2
20 42,068,110/42080972/42091969/42100739/42100805/42118002/42122908
1. Glyma.20g1823002. Glyma.20g182400
1. DVL family protein2. Ras-related small GTP-binding family protein
1 (01)1 (02)
5,589,867/5700523/5724122/57241406,337,006–6,625,502
1. Glyma.01g0485002. Glyma.01g048800/
Glyma.01g0489003. Glyma.01g0490004. Glyma.01g0523005. Glyma.01g0525006. Glyma.01g0529007. Glyma.01g053100
1. Galactosyltransferase12. Glucose-methanol-choline (GMC) oxidoreductase
family protein3. Glutathione S-transferase THETA 34. Levansucrase5. GDP-fucose protein O-fucosyltransferase6. Early-responsive to dehydration stress protein7. Argonaute family protein
4 6,353,086/6353873 1. Glyma.04g0755002. Glyma.04g0759003. Glyma.04g076200
1. Plant calmodulin-binding protein-related2. Peptidyl-tRNA hydrolase II (PTH2) family protein3. WRKY DNA-binding protein 11
13 (01)13 (02)
21,831,88937,847,000/37886116|37,951,427|37,979,893|38,024,
854|38,027,686
1. Glyma.13g1020002. Glyma.13g1022003. Glyma.13g1041004. Glyma.13g1043005. Glyma.13g2768006. Glyma.13g2771007. Glyma.13g278800
1. WRKY DNA-binding protein 112. Protein kinase superfamily protein3. Polyamine oxidase 54. Protein kinase superfamily protein5. Protein kinase superfamily protein6. Cytochrome P450, family 72, subfamily A, poly-
peptide 157. Leucine-rich repeat (LRR) family protein
10 2,870,409–2,873,948 Glyma.10g032900 WRKY DNA-binding protein 21
10 Journal of Applied Genetics (2022) 63:1–14
1 3
Therefore, it is very important to perform interaction analysis between SNP pairs. With epistatic interaction analy-sis, some genes that respond to plant abiotic stress and par-ticipate in anti-stress defense responses were uncovered. A relatively large body of evidence supports the involvement of P450 expression in host–pathogen interactions (Motallebi et al. 2015). None of the identified single-SNP association loci appeared in loci that were detected by epistatic inter-action analysis; this is probably because only two-locus epistasis test models of association were used, whereas the complex phenotype of Sclerotinia resistance results from the interaction of multiple loci.
Enrichment analysis indicated that calcium-binding pro-tein, leucine-rich repeat receptor-like protein kinase, pro-tein kinase superfamily protein, small GTP-binding protein, transcription factors (WRKY, zinc finger protein, heat shock transcription factor), and glycosyltransferases (levansucrase and GDP-fucose protein O-fucosyltransferase) are involved in plant signal transduction. Cellulase synthase, glutamate synthase, P5CR, lycopene β-cyclase, polyamine oxidase, SAM-Mtases, glucose methylcholine oxidoreductase fam-ily protein, glutathione-S-transferase, cytochrome P450, NBS-LRR disease resistance protein, and Argonaute fam-ily protein probably participate in the disease resistance
Fig. 6 The results of GO func-tional enrichment analysis
Fig. 7 The results of KEGG pathways enrichment analysis
11Journal of Applied Genetics (2022) 63:1–14
1 3
mechanisms of soybean to Sclerotinia infection. Among these, calcium-binding protein, SAM-Mtases, cytochrome P450, WRKY, glutathione-S-transferase, leucine-rich repeat receptor-like protein kinase, glycosyltransferase, and protein kinase superfamily protein were detected multiple times in the association analysis. The Ca2 + signaling pathway is a very important transduction pathway that plays an impor-tant regulatory role in soybean’s resistance to S. sclerotio-rum (Zhou et al. 2013); this is corroborated by the repeated detection of CaM and CDPK. The effect of SAM-Mtases on disease resistance may be mediated by the synthesis of plant lignin and their participation in the regulation of flavonoid metabolism; the SAM-Mtases gene is hence expected to be one of the important candidate genes for plant disease resist-ance. P450s have been isolated from host–pathogen interac-tions, some of which are as toxins and some as stress signals that activate anti-disease responses. WRKY transcription factors form a large family of plant transcription factors. Studies have shown that WRKY proteins are a key compo-nent of plant stress response. In plants, the WRKY transcrip-tion factor is most abundant in soybean. WRKY belongs to a broad class of transcriptional regulators, plays an impor-tant role in a variety of signal transduction pathways, and has been reported in various studies on plant responses to adverse conditions (Wen et al. 2017). The expression of WRKY6, WRKY8, and WRKY11 was significantly upregu-lated in Arabidopsis after inoculation with S. sclerotiorum; the WRKY gene may thus achieve its anti-Sclerotinia control function by activating multiple pathways (Zhao 2012.). The role of the Ca2+ signaling pathway and the WRKY11 gene in the plant’s anti-Sclerotinia property has been demonstrated (Wang 2015). Glutathione S-transferase (GST) on chromo-somes 17 and 1 may be extensively involved in the lipid peroxide decomposition during oxidative-stress caused by soybean’s response to Sclerotinia infection (Ferreira et al. 2010). Through modification of plant hormones and hyper-sensitivity responses, glycosyltransferase can antagonize essential pathogenic factors to maximize disease resistance (Meng et al. 2013). Consequently, the three glycosyltrans-ferases on chromosome 1, galactosyltransferase, levansu-crase, and GDP-fucose protein O-fucosyltransferase may affect the resistance of soybean to Sclerotinia by various glycosylation reactions.
Plants do not have a strong immune system; thus, their own defense mechanism is hence particularly important, with the cell wall is the first barrier of plant against patho-gen infection Studies have confirmed that epidermal and cortical cells of resistant varieties make use of cytoplasmic disintegration and enhanced cell walls to delay pathogen impregnation and to increase pathogenic resistance (Valera 2014); this is consistent with the results of GO analysis in this study. During pathogenesis, Sclerotinia induces cel-lulose fiber degradation to soluble disaccharide through
secretion of cellolase, and then degradation of cellobiose to glucose by β-glucosidase. Experiments show that the patho-genicity of the S. sclerotiorum strain in rape is positively correlated with its cellulase activity (Mao et al. 2011). At least 8 of the genes identified on chromosome 3 are associ-ated with disease resistance such as Glyma.03g128300 ~ glu-tamate synthase, Glyma.03g128900 ~ lycopene β-cyclase, and Glyma.03g129100 ~ pyrroline-5-carboxylate reductase, which are associated to disease resistance and resistance to oxidative stress (Antoniou et al. 2017; Kim et al. 2012; Khedr et al. 2003). We have verified that polymorphisms in the P5CR gene of Brassica napus are associated with resist-ance to S. sclerotiorum (Zhou et al. 2020).
It is well known that the R gene is the first class of disease resistance-conferring genes isolated from plants and that the leucine-rich repeat is the conserved domain of the R gene. The effects of Ras small GTPase signaling in plant disease resistance have been reported. In addition, the Dvl protein is a key protein of the classical Wnt/β-catenin signaling pathway. Not only does it mediate Wnt signal transduction from the cell membrane to intracellular domain, but also it participates in the downstream intra-nuclear formation of transcription com-plexes. The β-catenin signal constitutes part of an important signaling pathway that is related to the interaction between ani-mals and diseases. It also upregulates the expression of GDP-fucose protein O-fucosyltransferase (FUT) (He et al. 2017; Wang et al. 2013). In this study, whether the identified Dvl and FUT proteins are involved in the response of soybean to Sclerotinia requires further confirmation because the associa-tion of Wnt signaling pathways to plant responses to pathogens has not been reported to date.
Conclusion
It is necessary to perform haplotype association, epistatic interactive analysis, and post-GWAS to better understand the mechanism of induced disease resistance in plants. There is also a need to confirm the results using multiple models and to select QTL that have been repeatedly identified. Analysis of genes linked to the obtained association loci suggests that signals for plant anti-stress and anti-disease processes exhibit a high degree of relatedness and influence soybean’s response to Sclerotinia infection by a complex mechanism. The present comparative analysis was based on the use of a higher quantity of markers and a variety of analytical methods. S. sclerotiorum resistance is influenced by many genes that are involved in multiple processes, including the response to candidate genes participating in the signaling pathway of soybean’s response to S. sclerotiorum infection, and conferring resistance to WM was discovered. A total of 10 genomic regions in 7 chromo-somes were detected, of which 5 tagSNPs were identified these were the peak SNPs at positions rs5589867, rs34387780,
12 Journal of Applied Genetics (2022) 63:1–14
1 3
rs5734897, rs42091969, and rs37847000 on chromosomes 1, 3, 17, 20, and 13, respectively. Because the resistance of soy-bean to Sclerotinia belongs to quantitative trait inheritance, and thus meta-analysis may be appropriate to provide a deeper and more integrated knowledge of QTL and soybean signal transduction during WM infection.
Supplementary Information The online version contains supplemen-tary material available at https:// doi. org/ 10. 1007/ s13353- 021- 00654-z.
Acknowledgements The authors would like to thank François Belzile, Maxime Bastien, and Martine Jean. We thank dataset of the SoyBase (https:// soyba se. org/) and thank LetPub (www. letpub. com) for its lin-guistic assistance during the preparation of this manuscript.
Author contribution Yu Zhang performed the association analysis and wrote the manuscript. Yuexing Wang and Wanying Zhou participated in the development of the GBS genotyping protocol in soybean. Wany-ing Zhou, Shimao Zheng, and Runzhou Ye analyzed some of the data and performed read sequence analysis, SNP calling, and imputation to generate the SNP dataset. Runzhou Ye revised the manuscript.
Funding This work was funded by the Sci-technological Project of Shaanxi Province (2019NY-041) and the Department of Education Project of Shaanxi Province (18JK0170).
Data availability The datasets used and/or analyzed during the current study are available from the corresponding author.
Declarations
Ethics approval and consent to participate Not applicable.
Consent for publication Not applicable.
Competing interests The authors declare no competing interests.
Open Access This article is licensed under a Creative Commons Attri-bution 4.0 International License, which permits use, sharing, adapta-tion, distribution and reproduction in any medium or format, as long as you give appropriate credit to the original author(s) and the source, provide a link to the Creative Commons licence, and indicate if changes were made. The images or other third party material in this article are included in the article's Creative Commons licence, unless indicated otherwise in a credit line to the material. If material is not included in the article's Creative Commons licence and your intended use is not permitted by statutory regulation or exceeds the permitted use, you will need to obtain permission directly from the copyright holder. To view a copy of this licence, visit http:// creat iveco mmons. org/ licen ses/ by/4. 0/.
References
Al-Issawia M, Rihanb HZ, Al-Shmganic H, Fullerd MP (2016) Molyb-denum application enhances antioxidant enzyme activity and COR15a protein expression under cold stress in wheat. Journal of Plant Interactions 11:5–10
An JP, Li R, Qu FJ, You CX, Wang XF, Hao YJ (2017) Ectopic expres-sion of an apple cytochrome P450 gene MdCYPM1 negatively
regulates plant photomorphogenesis and stress response in Arabi-dopsis. Biochem Biophys Res Commun 483:1–9
Anderson CA, Pettersson FH, Clarke GM, Cardon LR, Morris AP, Zondervan KT (2010) Data quality control in genetic case-control association studies. Nat Protoc 5:1564–1573
Antoniou C, Chatzimichail G, Xenofontos R et al (2017) Melatonin systemically ameliorates drought stress-induced damage in Med-icago sativa plants by modulating nitro-oxidative homeostasis and proline metabolism. J Pineal Res 62:27
Arahana VS, Graef GL, Specht JE, Eskridge SJR, KM, (2001) Iden-tification of QTLs for resistance to Sclerotinia sclerotiorum in soybean. Crop Sci 41:180–188
Bastien M, Sonah H, Belzile F (2014) Genome wide association map-ping of Sclerotinia sclerotiorum resistance in soybean with a genotyping-bysequencing approach. The Plant Genome 7:1–13
Bastien M, Huynh TT, Giroux G et al (2012) A reproducible assay for measuring partial resistance to Sclerotinia sclerotiorum in soy-bean. Can J Plant Sci 92:279–288
Earl DA, Vonholdt BM (2012) STRU CTU RE HARVESTER: a website and program for visualizing STRU CTU RE output and implement-ing the Evanno method. Conserv Genet Resour 4:359–361
Evanno G, Regnaut S, Goudet J (2005) Detecting the number of clus-ters of individuals using the software STRU CTU RE: a simulation study. Mol Ecol 14:2611–2620
Ferreira LC, Cataneo AC, Remaeh LMR et al (2010) Nitric oxide reduces oxidative stress generated by lactofen in soybean plants. Pestic Biochem Physiol 97:47–54
Guo XM, Wang DC, Gordon SG, Helliwell E, Smith T, Berry SA (2008) Genetic mapping of QTLs underlying partial resistance to Sclerotinia sclerotiorum in soybean PI 391589A and PI 391589B. Crop Sci 48:1129–1139
Han F, Katt M, Schuh W, Webb DM (2008) QTL controlling Sclero-tinia stem rot resistance in soybean. US Patent 7250:552
He X, Zhang W, Yan C et al (2017) Chemical biology reveals CARF as a positive regulator of canonical Wnt signaling by promoting TCF/β-catenin transcriptional activity. Cell Discov 3:17003
Hoffnan DD, Hartman GL, Mueller DS (1998) Yield and seed quality of soybean cultivars infected with Sclerotinia sclertiorum. Plant Dis 82:826–829
Huynh TT, Bastien M, Iquira E, Turcotte P, Belzile F (2010) Identifi-cation of QTLs associated with partial resistance to white mold in soybean using field-based inoculation. Crop Sci 50:969–979
Iquira E, Humira S, François B (2015) Association mapping of QTLs for Sclerotinia stem rot resistance in a collection of soybean plant introductions using a genotyping by sequencing (GBS) approach. BMC Plant Biol 15:5
Jamann T, Luo X, Morales L, Kolkman J, Chung C, Nelson R (2016) A remorin gene is implicated in quantitative disease resistance in maize. Theor Appl Genet 129:591–602
Jarsch IK, Ott T (2011) Perspectives on remorin proteins, membrane rafts, and their role during plant–microbe interactions. Mol Plant Microbe Interact 24:7–12
Kanishka B, McCarthy MI, Morris AP (2011) Rapid testing of gene-gene interactions in genome-wide association studies of binary and quantitative phenotypes. Genet Epidemiol 35:800–808
Khedr AHA, Abbas MA, Wahid AAA, Quick WP, Abogadallah GM (2003) Proline induces the expression of salt-stress-responsive proteins and may improve the adaptation of Pancratium mariti-mum L. to salt-stress. J Exp Bot 54:2553–2562
Kim HS, Diers SCH, BW, (1999) Evaluation of soybean cultivars for resistance to Sclerotinia stem rot in field environments. Crop Sci 39:64–68
Kim HS, Diers BW (2000) Inheritance of partial resistance to Sclero-tinia stem rot in soybean. Crop Sci 40:55–61
Kim SH, Ahn YO, Ahn MJ, Lee HS, Kwak SS (2012) Down-regu-lation of β-carotene hydroxylase increases β-carotene and total
13Journal of Applied Genetics (2022) 63:1–14
1 3
carotenoids enhancing salt stress tolerance in transgenic cultured cells of sweet potato. Phytochemistry 74:69–78
Koenning SR, Wrather JA (2010) Suppression of soybean yield poten-tial in the continental United States by plant diseases from 2006 to 2009. Plant Health Progress 11(1)
Lefebvre B, Timmers T, Mbengue M, Moreau S, Hervé C (2010) A remorin protein interacts with symbiotic receptors and regulates bacterial infection. Proc Natl Acad Sci 107:2343–2348
Li D, Sun M, Han Y, Teng W, Li W (2010) Identification of QTL underlying soluble pigment content in soybean stems related to resistance to soybean white mold (Sclerotinia sclerotiorum). Euphytica 172:49–57
Li YH, Smulders MJM, Chang RZ, Qiu LJ (2011) Genetic diversity and association mapping in a collection of selected Chinese soy-bean accessions based on SSR marker analysis. Conserv Genet 12:1145–1157
Li Z, Wang S, Meng F, Liu J, Yi Z, Zhang H et al (2016) Soluble pig-ment level in stems determining partly-resistance to white mold in soybean. Soybean Science 35:481–488
Mao W, Hou YM, Liu ZW (2011) Analysis of several enzymes activity induced by Sclerotinia sclerotiorum and oxalic acid in rapeseed. Journal of Dalian Polytechnic University 30:39–42
Meng Q, Yin H, Hu J, Du Y (2013) Research progress of plant glyco-syltransferase in plant resistance on disease. Letters in Biotechnol-ogy 24:290–293
Motallebi P, Niknam V, Ebrahimzadeh H et al (2015) Methyl jasmonate strengthens wheat plants against root and crown rot pathogen Fusarium culmorum infection. J Plant Growth Regul 34:624–636
Peltier AJ, Bradley CA, Chilvers MI, Malvick DK, Mueller DS, Wise KA et al (2012) Yield loss and control of Sclerotinia stem rot of soybean. Journal of Integrated Pest Management 3:1–7
Ploper LD (1999) Management of economically important diseases on soybean in Argentina. In: Proceedings of the World Soybean Research Conference VI, Chicago, Illinois, USA, pp 269–280
Raffaele S, Mongrand S, Gamas P, Niebe lA, Ott T, (2007) Genome-wide annotation of remorins, a plant-specific protein family: evo-lutionary and functional perspectives. Plant Physiol 145:593–600
Scandiani MM, Luque AG, Razori MV et al (2015) Metabolic pro-files of soybean roots during early stages of Fusarium tucumaniae infection. J Exp Bot 66:391–402
Song W, Zhao X, LX Xu et al (2017) Identification of QTL and consist-ency QTL with resistance to Sclerotinia sclerotiorum in soybean. Chinese Journal of Oil Crop Sciences 39(6):763–770
Tóth K, Stratil TF, Madsen EB et al (2012) Functional domain analysis of the remorin protein LjSYMREM1 in Lotus japonicus. PLoS One 7:e30817
Tu JC (1986) Integrated disease control of white mould (Sclerotinia sclerotiorum) in navy bean (Phaseolus vulgaris). International Symposium on Crop Protection 39:731–740
Valera RE (2014) Physiological, anatomical and molecular characteriza-tion of partial resistance against Sclerotinia sclerotiorum in soybean. The University of Guelph, Guelph, Ontario, Canada, pp 1–171
Vuong TD, Diers BW, Hartman GL (2008) Identification of QTL for resistance to Sclerotinia stem rot in soybean plant introduction 194639. Crop Sci 48:2209–2214
Wang JP (2015) Molecular mechanisms underlying effect of mycelial age on pathogenicity of Sclerotinia sclerotiorum and plant resist-ance to this fungus. Dissertation, Zhejiang University
Wang S, Yin J, Chen D et al (2013) Small-molecule modulation of Wnt signaling via modulating the Axin-LRP5/6 interaction. Nat Chem Biol 9:579–585
Wen F, Wu X, Liao L, Liu X, Li P (2017) Research advances on physi-ological function of WRKY transcription factor in plant stress resistance. Guihaia 37:69–79
Xu C, Zheng L, Gao C, Wang C, Liu G, Jiang J et al (2011) Ovexpres-sion of a vacuolar H+-ATPase c subunit gene mediates physi-ological changes leading to enhanced salt tolerance in transgenic tobacco. Plant Mol Biol Report 29:424–430
Zhang Q, Yao GX, Hu GL, Tang B, Chen C, Li ZC (2011) Identifica-tion of QTLs for grain traits in rice using extreme materials in grain size. Acta Agron Sin 37:784–792
Zhao L (2012) Functional Analysis of Arabidopsis WRKY and AG01 genes in regulation of resistanceto Sclerotinia sclerotiorum. Dis-sertation, Zhejiang University
Zhao X, Han Y, Li Y, Liu D, Sun M, Zhao Y (2015) Loci and candidate gene identification for resistance to Sclerotinia sclerotiorum in soybean (Glycine max L. Merr.) via association and linkage maps. Plant J 82:245–255
Zhou J, Sun A, Xing D (2013) Modulation of cellular redox status by thiamine-activated NADPH oxidase confers Arabidopsis resist-ance to Sclerotinia sclerotiorum. J Exp Bot 64:3261–3272
Zhou WY, Zhang XJ, Sun XM, Ma Z, Zhang Y (2020) Study of clone and polymorphism of P5CR in B. napus. Genomics and Applied Biology 39:5678–5683
Publisher's note Springer Nature remains neutral with regard to jurisdictional claims in published maps and institutional affiliations.
14 Journal of Applied Genetics (2022) 63:1–14


![Candidate gene based association mapping in Fusarium ...Candidate gene based association mapping ... effectors, which disassemble the host defense response [6, 7]. From the point of](https://img.pdfslide.net/doc/110x75/614a622d12c9616cbc696146/candidate-gene-based-association-mapping-in-fusarium-candidate-gene-based-association.jpg)