Embed Size (px)
Citation preview
Abstract—Inverter fed drive has become to one of the most
important components of modern industrial facilities and propulsion systems. Growing demands on efficiency lead to higher wear of the drive systems and the risk of breakdowns. Unexpected outages of the drive system lead to high economic and/or safety losses. Detecting faults in an early stage helps increase the reliability and reduce the risk of breakdown. Beside short-circuit faults, open-circuit faults count to the most frequent reasons for the breakdown of the winding system. Starting with a crack or cross section deformation of the stator winding conductors the open-circuit fault induces an increased resistance in the corresponding phase. Detecting such small resistance changes provides the possibility to react timely on the developing fault. In this paper a method is presented to detect incipient open-circuit faults in the stator windings of an inverter fed drive. The method gets along with the hardware already present in modern drives, no additional sensors are required. By Applying voltage steps to the machine terminals and measuring the resulting current the phasor resistance can be estimated. By spatially combining the phase measurements of the resistance a phasor of the resistance symmetry can be introduced. With this phasor a high sensitive fault indicator is generated able to detect fault severity and position. Measurements on a laboratory test stand for different fault configurations prove the applicability and accuracy of the proposed method.
Index Terms— fault detection, inverter fed drive, stator resistance, induction machine
I. INTRODUCTION
s investigated in [1] and [2], three main fault conditions leading to machine breakdown exist – bearing, stator and
rotor related faults. The main reasons for stator winding faults are thermal, electrical, mechanical and environmental stress. Together with winding short circuit faults, open-circuit faults are the most frequent stator winding defects [3]. Due to these statements continuous monitoring of the machine windings is necessary to ensure a detection of a fault in an early stage before a severe fault or breakdown occurs. Electrical machines operated in rough areas are more prone to failure due to the higher environmental stresses. Machines exposed to high vibrations, extreme temperature cycles, high acceleration/breaking forces, debris etc. show increased wear
G. Stojčić is with the Department of Energy Systems and Electrical drives at the Vienna University of Technology, Vienna, Austria (e-mail:[email protected]).
T. M. Wolbank is with the Department of Energy Systems and Electrical drives at the Vienna University of Technology, Vienna, Austria (e-mail: [email protected]).
and failure of the winding system. As one of the consequences cracks may develop in stator winding conductors and finally leading to open-circuit winding faults or in case of thermal damaged isolation even ending up in short circuit. Due to the crack the resistance value is increased and the damaged area is possibly heated up to critical temperatures. On the other hand an increased resistance in one phase leads to voltage asymmetry in the stator winding and finally also to defects [4]-[7].
Detecting such faults already in their developing state can provide the possibility to react timely. A drive shut down or emergency operation can thus be implemented shortly after fault occurrence. This can prevent from complete destruction of the machine as only the stator winding has to be investigated and/or replaced. On the other hand the maintenance efforts can also be reduced by detecting the fault in a very early stage. Monitoring sequences can be carried out periodically during operation and the knowledge of machine state is permanently accessible without the need of reduced maintenance intervals or additional sensors and evaluation systems.
An open-circuit winding fault frequently starts with a crack in a stator wire. This crack leads to an increased stator resistance in the corresponding phase. As a consequence, the stator resistance will change with respect to the healthy case. Detecting such individual phase changes can provide information on machines winding system state to react by operation stop or fault-tolerant control schemes to reduce the further development and spreading of the fault. Online stator resistance identification methods for induction machines are usually implemented for temperature monitoring, improvement of control performance or the speed estimation [8]. Most methods [9]-[11], are developed for line fed drives. The methods proposed in [12] and [13] estimate stator resistance based on dc and zero-sequence injection for inverter-fed machines.
However, all the methods show good stator resistance estimation accuracy but are not related to fault detection. In this work a method is presented to detect incipient open-circuit winding faults based on the symmetry of stator phase resistance estimation. As mentioned an open-circuit stator winding fault usually starts with a crack or cross section deformation of a winding conductor. This leads to an increase of the resistance value in the corresponding phase. Applying a voltage step to the machine terminal will result in a current reaction depending on the machine parameters including the phase resistances. Depending on the fault position (phase) and
Detection of Defects in Stator Winding of Inverter Fed Induction Machines
Goran Stojčić and Thomas M. Wolbank, Member, IEEE
A
978-1-4673-4974-1/13/$31.00 ©2013 IEEE111
applied voltage direction the resulting current will be different. Based on this current reaction a fault indicator for changes in the stator winding resistance value is developed to get information on resistance asymmetries and possible developing faults.
II. METHODOLOGY
A. Phase Resistance Estimation
The standard way to identify the resistance of a system is given by the use of Ohm’s law. This can be applied to ohmic’ materials like resistors and wires as present in an electrical machine. The resistance value can be calculated by the knowledge of the applied voltage and the resulting current r=u/i where u represents the voltage, i the current and r the resulting resistance value.
Considering now an electrical machine fed by a voltage source inverter identification of stator winding resistance can be easily realized by applying the dc link voltage (UDC) through the inverter using pulse width modulation (PWM) to the machine’s terminals and measuring the phase current by the inverter built-in current sensors. The stator resistance is then given by the mean voltage applied to the machine terminals and the mean current.
However, it is well known that the voltage applied to the machines terminals is disturbed and usually very difficult to be accurately identified without additional inverter output voltage sensors. This inverter output voltage is composed of discrete pulses generated by the PWM. Additionally, there are different phenomena arising from switching devices inherent characteristics such as power devices voltage drop, output voltage transitions slope, turn off/on time and the inverter interlock dead time [14]-[15]. All these phenomena distort the inverter output voltage and thus also the stator resistance estimation. Hence these effects must be eliminated or at least clearly reduced to achieve accurate resistance estimation. Due to the fact that the dead time and voltage drop are defined by hardware their influence can be clearly reduced by applying a special voltage pattern when measuring the phase current and calculating the resistance value.
The method proposed is based on two measurements which are combined to reduce the mentioned disturbing influences. Stator resistance can be identified and calculated using the measured current and applied voltage values from two different inverter output voltage phasors. Two voltage phasor reference values (uS,1 and uS,2) are applied in one phase direction with different magnitudes and the current reaction (iS,1 and iS,2) is measured (1). The inverter output voltage can then be portioned into an actual part uS,act and a disturbing part uS,dist. The disturbing part is dominated by the effects mentioned above. It can be assumed that both disturbing parts are equal (uS,dist,1 ≈ uS,dist,2) and thus be eliminated by a simple subtraction (2). Finally, the resistance rS is obtained by the division of differences of the voltage and measured current values as given in (3).
2,2,
1,1,
SS
SS
iu
iu
(1)
1,,2,,
1,,1,,2,,2,,
actSactS
distSactSdistSactS
uu
uuuuu
(2)
1,2,
1,,2,,
SS
actSactSS
ii
uu
i
ur
(3)
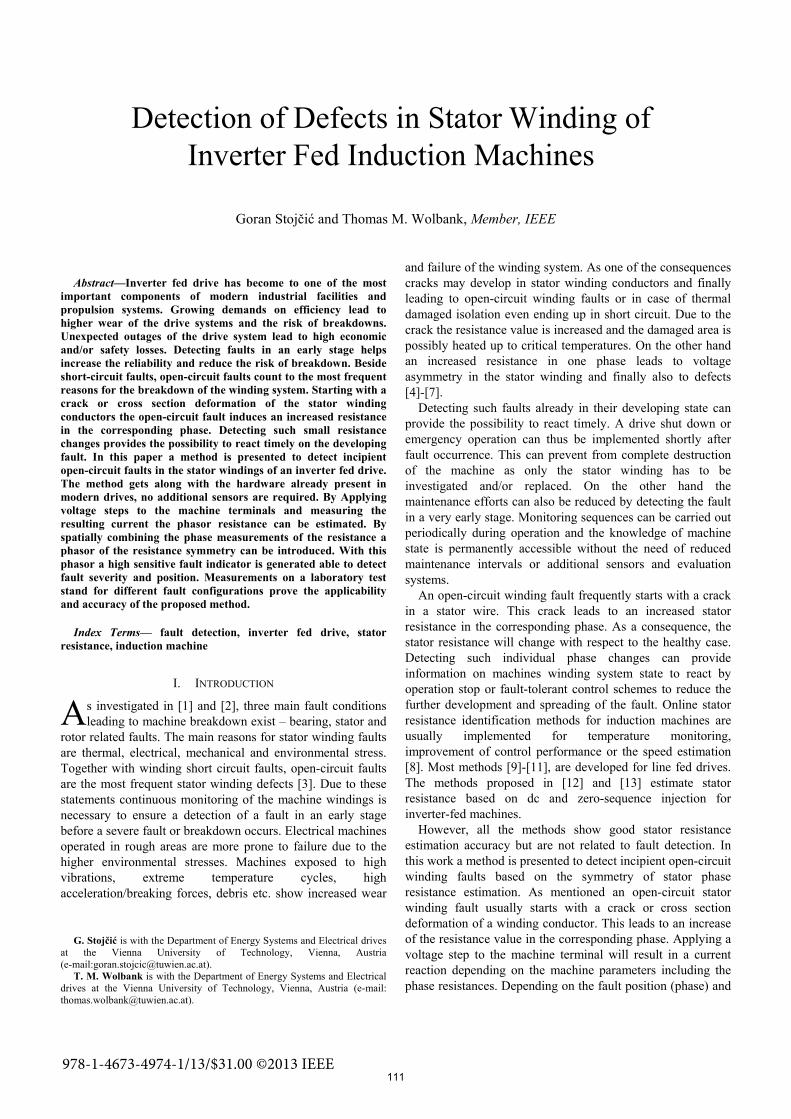
The value obtained now represents the stator winding resistance corresponding to the phase direction of the applied voltage phasor step. Not only the magnitude but also the direction of the obtained current phasors is taken into the consideration. In a healthy machine all phasor resistances are expected to be equal. Thus the current direction will be in line with the voltage phasor direction (also in line with one main phase direction). Assuming now increased resistance in one phase the obtained current phasor will not more be in line with the voltage phasor as presented Fig 1.
Fig 1: Current phasor generation for healthy and fault case (rx in phase W)
with an applied voltage phasor uS in phase direction U.
The current direction can now be used to identify the fault position. Therefore the estimated phase resistance value is combined with the current direction to a resistance phasor (4).
)( SiangSS err
(4)
The test and measurement procedure is repeated in each stator phase to identify the resistance with respect to all main phase directions (5).
112
)(,
)(,
)(,
,
,
,
WS
VS
US
iangWSW
iangVSV
iangUSU
err
err
err
(5)
III. FAULT INDICATOR GENERATION
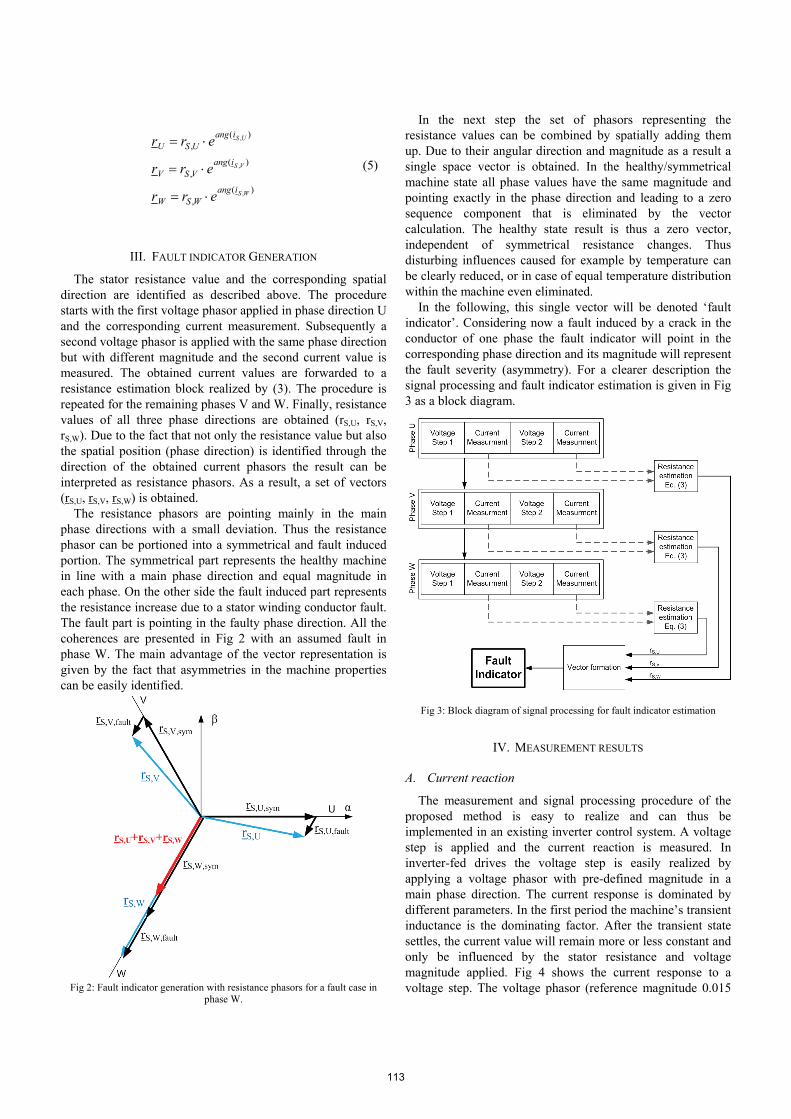
The stator resistance value and the corresponding spatial direction are identified as described above. The procedure starts with the first voltage phasor applied in phase direction U and the corresponding current measurement. Subsequently a second voltage phasor is applied with the same phase direction but with different magnitude and the second current value is measured. The obtained current values are forwarded to a resistance estimation block realized by (3). The procedure is repeated for the remaining phases V and W. Finally, resistance values of all three phase directions are obtained (rS,U, rS,V, rS,W). Due to the fact that not only the resistance value but also the spatial position (phase direction) is identified through the direction of the obtained current phasors the result can be interpreted as resistance phasors. As a result, a set of vectors (rS,U, rS,V, rS,W) is obtained.
The resistance phasors are pointing mainly in the main phase directions with a small deviation. Thus the resistance phasor can be portioned into a symmetrical and fault induced portion. The symmetrical part represents the healthy machine in line with a main phase direction and equal magnitude in each phase. On the other side the fault induced part represents the resistance increase due to a stator winding conductor fault. The fault part is pointing in the faulty phase direction. All the coherences are presented in Fig 2 with an assumed fault in phase W. The main advantage of the vector representation is given by the fact that asymmetries in the machine properties can be easily identified.
Fig 2: Fault indicator generation with resistance phasors for a fault case in
phase W.
In the next step the set of phasors representing the resistance values can be combined by spatially adding them up. Due to their angular direction and magnitude as a result a single space vector is obtained. In the healthy/symmetrical machine state all phase values have the same magnitude and pointing exactly in the phase direction and leading to a zero sequence component that is eliminated by the vector calculation. The healthy state result is thus a zero vector, independent of symmetrical resistance changes. Thus disturbing influences caused for example by temperature can be clearly reduced, or in case of equal temperature distribution within the machine even eliminated.
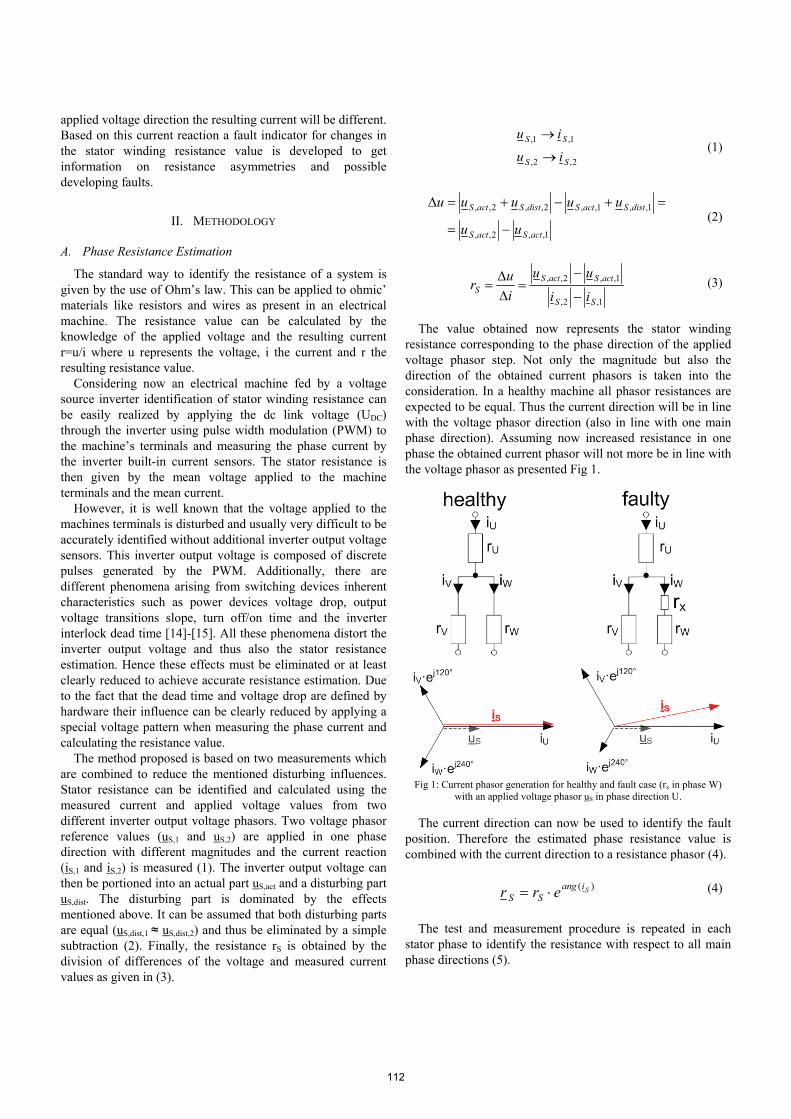
In the following, this single vector will be denoted ‘fault indicator’. Considering now a fault induced by a crack in the conductor of one phase the fault indicator will point in the corresponding phase direction and its magnitude will represent the fault severity (asymmetry). For a clearer description the signal processing and fault indicator estimation is given in Fig 3 as a block diagram.
Fig 3: Block diagram of signal processing for fault indicator estimation
IV. MEASUREMENT RESULTS
A. Current reaction
The measurement and signal processing procedure of the proposed method is easy to realize and can thus be implemented in an existing inverter control system. A voltage step is applied and the current reaction is measured. In inverter-fed drives the voltage step is easily realized by applying a voltage phasor with pre-defined magnitude in a main phase direction. The current response is dominated by different parameters. In the first period the machine’s transient inductance is the dominating factor. After the transient state settles, the current value will remain more or less constant and only be influenced by the stator resistance and voltage magnitude applied. Fig 4 shows the current response to a voltage step. The voltage phasor (reference magnitude 0.015
113
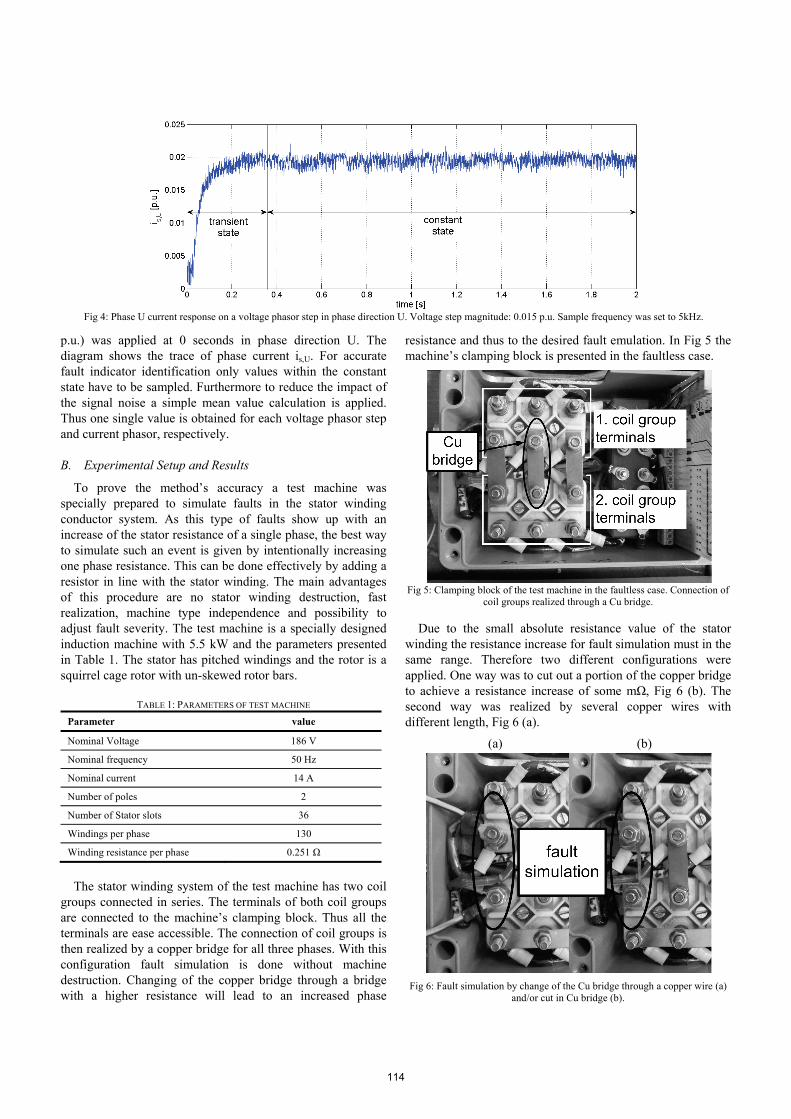
p.u.) was applied at 0 seconds in phase direction U. The diagram shows the trace of phase current is,U. For accurate fault indicator identification only values within the constant state have to be sampled. Furthermore to reduce the impact of the signal noise a simple mean value calculation is applied. Thus one single value is obtained for each voltage phasor step and current phasor, respectively.
B. Experimental Setup and Results
To prove the method’s accuracy a test machine was specially prepared to simulate faults in the stator winding conductor system. As this type of faults show up with an increase of the stator resistance of a single phase, the best way to simulate such an event is given by intentionally increasing one phase resistance. This can be done effectively by adding a resistor in line with the stator winding. The main advantages of this procedure are no stator winding destruction, fast realization, machine type independence and possibility to adjust fault severity. The test machine is a specially designed induction machine with 5.5 kW and the parameters presented in Table 1. The stator has pitched windings and the rotor is a squirrel cage rotor with un-skewed rotor bars.
TABLE 1: PARAMETERS OF TEST MACHINE
Parameter value
Nominal Voltage 186 V
Nominal frequency 50 Hz
Nominal current 14 A
Number of poles 2
Number of Stator slots 36
Windings per phase 130
Winding resistance per phase 0.251 Ω
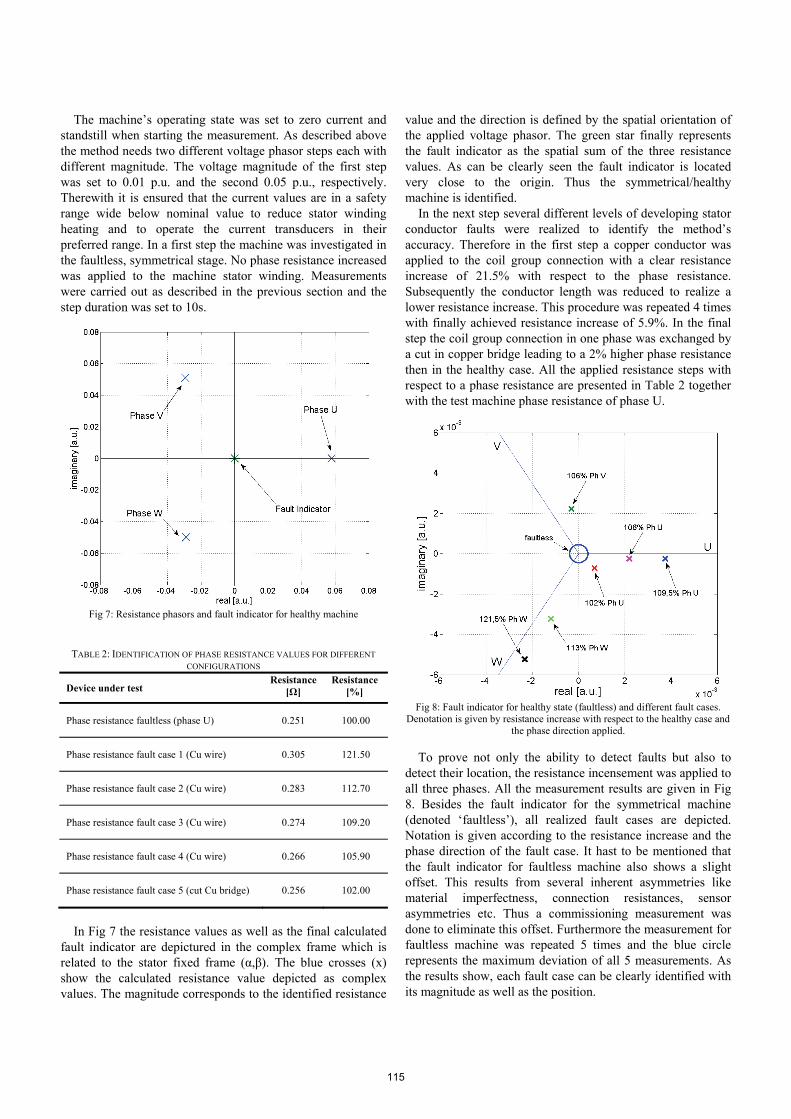
The stator winding system of the test machine has two coil
groups connected in series. The terminals of both coil groups are connected to the machine’s clamping block. Thus all the terminals are ease accessible. The connection of coil groups is then realized by a copper bridge for all three phases. With this configuration fault simulation is done without machine destruction. Changing of the copper bridge through a bridge with a higher resistance will lead to an increased phase
resistance and thus to the desired fault emulation. In Fig 5 the machine’s clamping block is presented in the faultless case.
Fig 5: Clamping block of the test machine in the faultless case. Connection of
coil groups realized through a Cu bridge.
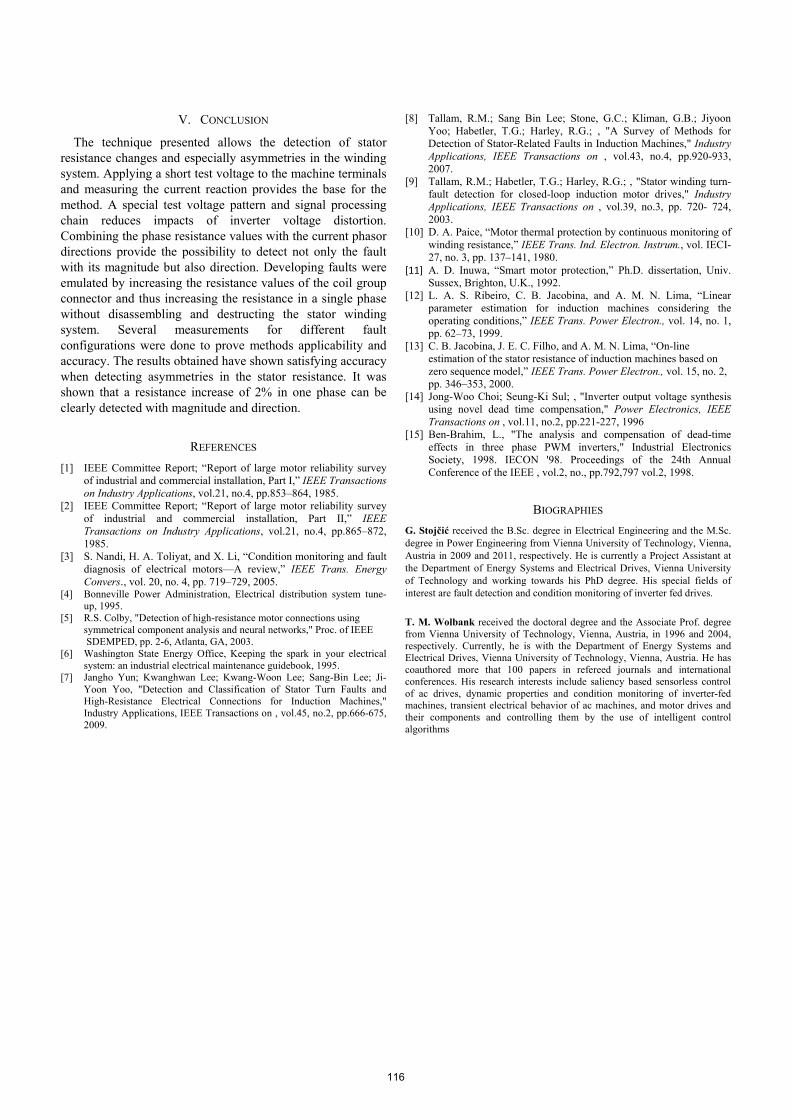
Due to the small absolute resistance value of the stator winding the resistance increase for fault simulation must in the same range. Therefore two different configurations were applied. One way was to cut out a portion of the copper bridge to achieve a resistance increase of some mΩ, Fig 6 (b). The second way was realized by several copper wires with different length, Fig 6 (a).
Fig 6: Fault simulation by change of the Cu bridge through a copper wire (a)
and/or cut in Cu bridge (b).
Fig 4: Phase U current response on a voltage phasor step in phase direction U. Voltage step magnitude: 0.015 p.u. Sample frequency was set to 5kHz.
(a) (b)
114
The machine’s operating state was set to zero current and standstill when starting the measurement. As described above the method needs two different voltage phasor steps each with different magnitude. The voltage magnitude of the first step was set to 0.01 p.u. and the second 0.05 p.u., respectively. Therewith it is ensured that the current values are in a safety range wide below nominal value to reduce stator winding heating and to operate the current transducers in their preferred range. In a first step the machine was investigated in the faultless, symmetrical stage. No phase resistance increased was applied to the machine stator winding. Measurements were carried out as described in the previous section and the step duration was set to 10s.
Fig 7: Resistance phasors and fault indicator for healthy machine
TABLE 2: IDENTIFICATION OF PHASE RESISTANCE VALUES FOR DIFFERENT
CONFIGURATIONS
Device under test Resistance
[Ω] Resistance
[%]
Phase resistance faultless (phase U) 0.251 100.00
Phase resistance fault case 1 (Cu wire) 0.305 121.50
Phase resistance fault case 2 (Cu wire) 0.283 112.70
Phase resistance fault case 3 (Cu wire) 0.274 109.20
Phase resistance fault case 4 (Cu wire) 0.266 105.90
Phase resistance fault case 5 (cut Cu bridge) 0.256 102.00
In Fig 7 the resistance values as well as the final calculated
fault indicator are depictured in the complex frame which is related to the stator fixed frame (α,β). The blue crosses (x) show the calculated resistance value depicted as complex values. The magnitude corresponds to the identified resistance
value and the direction is defined by the spatial orientation of the applied voltage phasor. The green star finally represents the fault indicator as the spatial sum of the three resistance values. As can be clearly seen the fault indicator is located very close to the origin. Thus the symmetrical/healthy machine is identified.
In the next step several different levels of developing stator conductor faults were realized to identify the method’s accuracy. Therefore in the first step a copper conductor was applied to the coil group connection with a clear resistance increase of 21.5% with respect to the phase resistance. Subsequently the conductor length was reduced to realize a lower resistance increase. This procedure was repeated 4 times with finally achieved resistance increase of 5.9%. In the final step the coil group connection in one phase was exchanged by a cut in copper bridge leading to a 2% higher phase resistance then in the healthy case. All the applied resistance steps with respect to a phase resistance are presented in Table 2 together with the test machine phase resistance of phase U.
Fig 8: Fault indicator for healthy state (faultless) and different fault cases.
Denotation is given by resistance increase with respect to the healthy case and the phase direction applied.
To prove not only the ability to detect faults but also to detect their location, the resistance incensement was applied to all three phases. All the measurement results are given in Fig 8. Besides the fault indicator for the symmetrical machine (denoted ‘faultless’), all realized fault cases are depicted. Notation is given according to the resistance increase and the phase direction of the fault case. It hast to be mentioned that the fault indicator for faultless machine also shows a slight offset. This results from several inherent asymmetries like material imperfectness, connection resistances, sensor asymmetries etc. Thus a commissioning measurement was done to eliminate this offset. Furthermore the measurement for faultless machine was repeated 5 times and the blue circle represents the maximum deviation of all 5 measurements. As the results show, each fault case can be clearly identified with its magnitude as well as the position.
115
V. CONCLUSION
The technique presented allows the detection of stator resistance changes and especially asymmetries in the winding system. Applying a short test voltage to the machine terminals and measuring the current reaction provides the base for the method. A special test voltage pattern and signal processing chain reduces impacts of inverter voltage distortion. Combining the phase resistance values with the current phasor directions provide the possibility to detect not only the fault with its magnitude but also direction. Developing faults were emulated by increasing the resistance values of the coil group connector and thus increasing the resistance in a single phase without disassembling and destructing the stator winding system. Several measurements for different fault configurations were done to prove methods applicability and accuracy. The results obtained have shown satisfying accuracy when detecting asymmetries in the stator resistance. It was shown that a resistance increase of 2% in one phase can be clearly detected with magnitude and direction.
REFERENCES
[1] IEEE Committee Report; “Report of large motor reliability survey of industrial and commercial installation, Part I,” IEEE Transactions on Industry Applications, vol.21, no.4, pp.853–864, 1985.
[2] IEEE Committee Report; “Report of large motor reliability survey of industrial and commercial installation, Part II,” IEEE Transactions on Industry Applications, vol.21, no.4, pp.865–872, 1985.
[3] S. Nandi, H. A. Toliyat, and X. Li, “Condition monitoring and fault diagnosis of electrical motors—A review,” IEEE Trans. Energy Convers., vol. 20, no. 4, pp. 719–729, 2005.
[4] Bonneville Power Administration, Electrical distribution system tune-up, 1995.
[5] R.S. Colby, "Detection of high-resistance motor connections using symmetrical component analysis and neural networks," Proc. of IEEE SDEMPED, pp. 2-6, Atlanta, GA, 2003.
[6] Washington State Energy Office, Keeping the spark in your electrical system: an industrial electrical maintenance guidebook, 1995.
[7] Jangho Yun; Kwanghwan Lee; Kwang-Woon Lee; Sang-Bin Lee; Ji-Yoon Yoo, "Detection and Classification of Stator Turn Faults and High-Resistance Electrical Connections for Induction Machines," Industry Applications, IEEE Transactions on , vol.45, no.2, pp.666-675, 2009.
[8] Tallam, R.M.; Sang Bin Lee; Stone, G.C.; Kliman, G.B.; Jiyoon Yoo; Habetler, T.G.; Harley, R.G.; , "A Survey of Methods for Detection of Stator-Related Faults in Induction Machines," Industry Applications, IEEE Transactions on , vol.43, no.4, pp.920-933, 2007.
[9] Tallam, R.M.; Habetler, T.G.; Harley, R.G.; , "Stator winding turn-fault detection for closed-loop induction motor drives," Industry Applications, IEEE Transactions on , vol.39, no.3, pp. 720- 724, 2003.
[10] D. A. Paice, “Motor thermal protection by continuous monitoring of winding resistance,” IEEE Trans. Ind. Electron. Instrum., vol. IECI-27, no. 3, pp. 137–141, 1980.
[11] A. D. Inuwa, “Smart motor protection,” Ph.D. dissertation, Univ. Sussex, Brighton, U.K., 1992.
[12] L. A. S. Ribeiro, C. B. Jacobina, and A. M. N. Lima, “Linear parameter estimation for induction machines considering the operating conditions,” IEEE Trans. Power Electron., vol. 14, no. 1, pp. 62–73, 1999.
[13] C. B. Jacobina, J. E. C. Filho, and A. M. N. Lima, “On-line estimation of the stator resistance of induction machines based on zero sequence model,” IEEE Trans. Power Electron., vol. 15, no. 2, pp. 346–353, 2000.
[14] Jong-Woo Choi; Seung-Ki Sul; , "Inverter output voltage synthesis using novel dead time compensation," Power Electronics, IEEE Transactions on , vol.11, no.2, pp.221-227, 1996
[15] Ben-Brahim, L., "The analysis and compensation of dead-time effects in three phase PWM inverters," Industrial Electronics Society, 1998. IECON '98. Proceedings of the 24th Annual Conference of the IEEE , vol.2, no., pp.792,797 vol.2, 1998.
BIOGRAPHIES
G. Stojčić received the B.Sc. degree in Electrical Engineering and the M.Sc. degree in Power Engineering from Vienna University of Technology, Vienna, Austria in 2009 and 2011, respectively. He is currently a Project Assistant at the Department of Energy Systems and Electrical Drives, Vienna University of Technology and working towards his PhD degree. His special fields of interest are fault detection and condition monitoring of inverter fed drives.
T. M. Wolbank received the doctoral degree and the Associate Prof. degree from Vienna University of Technology, Vienna, Austria, in 1996 and 2004, respectively. Currently, he is with the Department of Energy Systems and Electrical Drives, Vienna University of Technology, Vienna, Austria. He has coauthored more that 100 papers in refereed journals and international conferences. His research interests include saliency based sensorless control of ac drives, dynamic properties and condition monitoring of inverter-fed machines, transient electrical behavior of ac machines, and motor drives and their components and controlling them by the use of intelligent control algorithms
116