Embed Size (px)
Citation preview
3
Detection, Recognition and Location of Partial Discharge Sources
Using Acoustic Emission Method
Wojciech Sikorski1 and Waldemar Ziomek2 1Poznan University of Technology,
2University of Manitoba, 1Poland, 2Canada
1. Introduction
The acoustic emission (AE) is a group of phenomena involving generation of transient elastic (acoustic or vibro-acoustic) waves, resulting from liberation of intermolecular bond energy (deformation, cracking, phase transitions). This fact contributed to elaboration of the acoustic emission method, which is widely used in: (i) diagnostics of cutting tools and machine cutting process, (ii) machinery and civil structures condition assessment, (iii) fatigue and fracture materials research, (iv) detection of material defects, (v) orogenic and earthquake prediction research, (vi) rockbursts prediction in deep mines and (vii) in chemical reactions and phase transitions research. This method is also applied in electrical power engineering for detection and location of partial discharge (PD) sources in insulation system of large power transformers and GIS/GIL (Gas Insulated Substations/Gas Insulated transmission Lines).
According to the International Electrotechnical Commission IEC-60270 standard, the partial discharge is defined as localized electrical discharge that only partially bridges the insulation between conductors and which can or cannot occur adjacent to a conductor. Partial discharges are in general a consequence of local electrical stress concentrations in the insulation or on the surface of the insulation. During a partial discharge, there occurs impulse conversion of some part of electric energy (about 1-5%) to mechanical energy, which is an acoustic emission wave. The remaining part includes electric, thermal and chemical energy. The most defects of the oil/paper transformer insulation system are characterized by partial discharges. It is a phenomenon, which can, but does not have to, lead to damage of a high-voltage device in short time. Some defects can develop for years as well. The phenomenon can also have a passing character and depend on different factors. Therefore, the assessment of dynamics changes of PD intensity in time is essential and it can be realized by monitoring system perfectly (Feser, 2003; Gulski et al., 1999; Gulski & Smitt, 2007; Sikorski et al., 2007c). At present, there are a few methods, which allow to monitor the development of partial discharges, such as: DGA - Dissolved Gas in oil Analysis, UHF - Ultra High Frequency and AE - Acoustic Emission. Each method is characterized by certain advantages and disadvantages, which were summarized in Table 1. From the listed methods, the most applicable and least expensive seems to be the AE method (Sikorski & Walczak, 2010).
www.intechopen.com

Acoustic Emission 50
Possibilities Method
DGA UHF AE
Detection Yes Yes Yes
Detection sensitivity
High (~10pC, depending on time
of PD activity)
High (~1-10pC, depending on distance and location of the PD
source)
Moderate (> 300 pC, depending on
location of the PD source)
Intensity measurement
No Limited Limited
Identification No Yes Yes
Location Limited Limited Yes
Installation difficulty
Moderate (transformer must
be turned off)
Moderate (through oil valve, transformer under load /
through dielectric window, transformer must be turned off
and opened)
Low (transformer under load)
Sensors 1
(due to high costs)limited by number of oil valves
or dielectric windows open structure, typically 1-16
Table 1. The comparison of the PD monitoring methods for large power transformers
The main advantages of the AE method are: (i) tests can be taken when the transformer is on-line (during applied voltage or induced voltage tests), (ii) simple test procedure, (iii) susceptibility to external electrical disturbances is relatively low, and (iv) possibility of partial discharge recognition, location and on-line monitoring (Institute of Electrical and Electronics Engineers [IEEE], 2007; Kuffel et al., 2000; Lundgaard, 1992a, 1992b; Markalous et al., 2003).
In order to develop and optimize the acoustic emission for power transformer diagnostics, the author followed the approach outlined below:
selection of optimal AE signal processing methods and parameters for efficient PD detection and recognition,
laboratory research of PD’s parameters generated in properly prepared models of oil/paper insulating systems (imitating real PD sources in power transformers),
completion and developing of PD-patterns database based on laboratory results and selected parameters,
verification tests on real power transformers.
2. AE measurement system for partial discharge detection
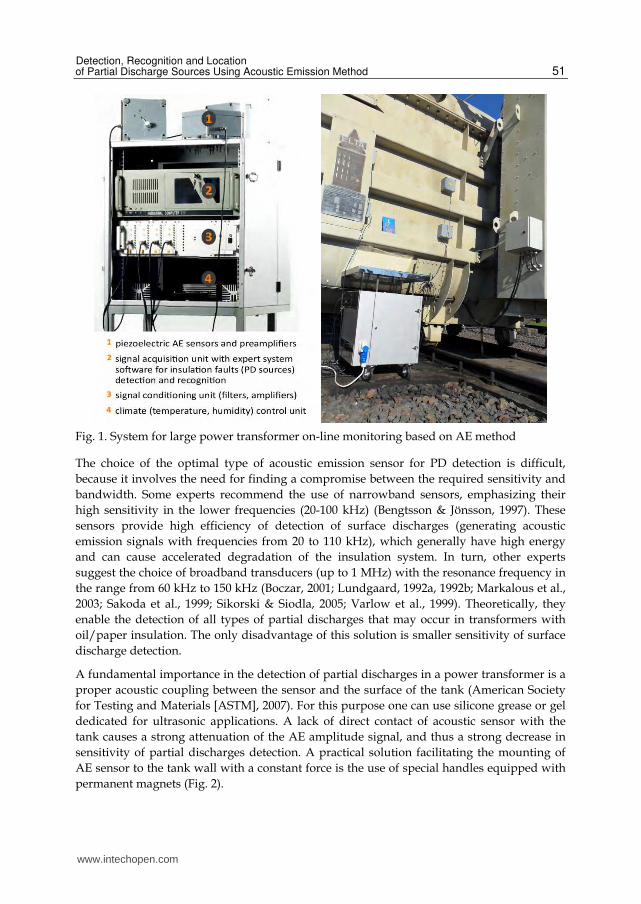
A typical measurement system for partial discharges detection based on acoustic emission method is composed of: (i) piezoelectric sensors, (ii) preamplifiers, (iii) signal conditioning unit, (iv) signal acquisition unit and (v) specialized software for digital signal processing. The most advanced systems dedicated for power transformer on-line monitoring are additionally adjusted to work in difficult weather conditions (embedded climate control unit, waterproof chassis/enclosure) and they are equipped with an expert system software for automatic PD detection and recognition. The system for power transformer online monitoring, which was in detail described in (Sikorski & Walczak, 2010), was presented in Fig 1.
www.intechopen.com
Detection, Recognition and Location of Partial Discharge Sources Using Acoustic Emission Method 51
Fig. 1. System for large power transformer on-line monitoring based on AE method
The choice of the optimal type of acoustic emission sensor for PD detection is difficult,
because it involves the need for finding a compromise between the required sensitivity and
bandwidth. Some experts recommend the use of narrowband sensors, emphasizing their
high sensitivity in the lower frequencies (20-100 kHz) (Bengtsson & Jönsson, 1997). These
sensors provide high efficiency of detection of surface discharges (generating acoustic
emission signals with frequencies from 20 to 110 kHz), which generally have high energy
and can cause accelerated degradation of the insulation system. In turn, other experts
suggest the choice of broadband transducers (up to 1 MHz) with the resonance frequency in
the range from 60 kHz to 150 kHz (Boczar, 2001; Lundgaard, 1992a, 1992b; Markalous et al.,
2003; Sakoda et al., 1999; Sikorski & Siodla, 2005; Varlow et al., 1999). Theoretically, they
enable the detection of all types of partial discharges that may occur in transformers with
oil/paper insulation. The only disadvantage of this solution is smaller sensitivity of surface
discharge detection.
A fundamental importance in the detection of partial discharges in a power transformer is a
proper acoustic coupling between the sensor and the surface of the tank (American Society
for Testing and Materials [ASTM], 2007). For this purpose one can use silicone grease or gel
dedicated for ultrasonic applications. A lack of direct contact of acoustic sensor with the
tank causes a strong attenuation of the AE amplitude signal, and thus a strong decrease in
sensitivity of partial discharges detection. A practical solution facilitating the mounting of
AE sensor to the tank wall with a constant force is the use of special handles equipped with
permanent magnets (Fig. 2).
www.intechopen.com

Acoustic Emission 52
(a) (b)
(c)
Fig. 2. General view of the AE sensor’s waterproof enclosure with permanent magnets (a); mounting of the sensor on transformer tank (b); typical AE sensors placement on transformer tank (c).
3. Possibilities and limits of acoustic emission in power transformer diagnostics
In case of large power transformers the main problem is an environmental heterogeneity between partial discharge source and AE sensor (Sikorski et al., 2007c). The acoustic field inside the tank is very complex due to wave reflection and diffraction in different materials (pressboard, copper, pressboard, paper, oil). The acoustic wave propagates in materials, from which the transformer is made, with different velocity: 1413 m/s in transformer oil, 1500 m/s in impregnated pressboard, 3570 m/s in copper and 5100 m/s in steel. The velocity of the AE wave propagation in oil strongly depends on its temperature. When the oil temperature equals 20ºC the velocity of wave propagation amounts to 1413 m/s. For
www.intechopen.com
Detection, Recognition and Location of Partial Discharge Sources Using Acoustic Emission Method 53
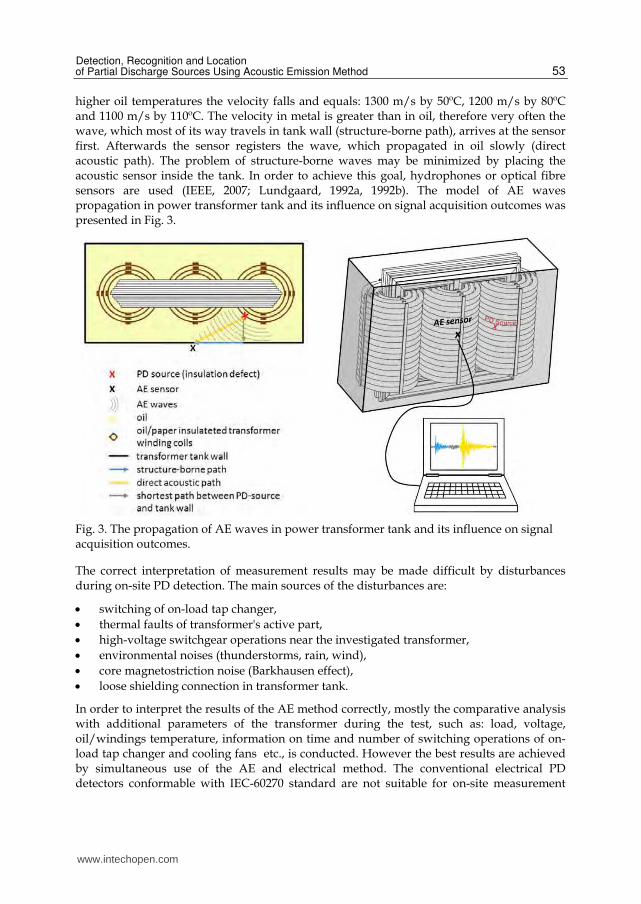
higher oil temperatures the velocity falls and equals: 1300 m/s by 50ºC, 1200 m/s by 80ºC and 1100 m/s by 110ºC. The velocity in metal is greater than in oil, therefore very often the wave, which most of its way travels in tank wall (structure-borne path), arrives at the sensor first. Afterwards the sensor registers the wave, which propagated in oil slowly (direct acoustic path). The problem of structure-borne waves may be minimized by placing the acoustic sensor inside the tank. In order to achieve this goal, hydrophones or optical fibre sensors are used (IEEE, 2007; Lundgaard, 1992a, 1992b). The model of AE waves propagation in power transformer tank and its influence on signal acquisition outcomes was presented in Fig. 3.
Fig. 3. The propagation of AE waves in power transformer tank and its influence on signal acquisition outcomes.
The correct interpretation of measurement results may be made difficult by disturbances during on-site PD detection. The main sources of the disturbances are:
switching of on-load tap changer,
thermal faults of transformer's active part,
high-voltage switchgear operations near the investigated transformer,
environmental noises (thunderstorms, rain, wind),
core magnetostriction noise (Barkhausen effect),
loose shielding connection in transformer tank.
In order to interpret the results of the AE method correctly, mostly the comparative analysis with additional parameters of the transformer during the test, such as: load, voltage, oil/windings temperature, information on time and number of switching operations of on-load tap changer and cooling fans etc., is conducted. However the best results are achieved by simultaneous use of the AE and electrical method. The conventional electrical PD detectors conformable with IEC-60270 standard are not suitable for on-site measurement
www.intechopen.com
Acoustic Emission 54
(due to corona discharges and other electrical disturbances), but it is possible to use the UHF probe inside the transformer tank installed through a drain valve or Rogowski coil (HFCT/RFCT sensors as well) installed on the transformer tank ground wire (IEEE, 2007).
4. Selected methods of AE signals processing
The first stage of the research was related to the selection of signal processing methods which would support both the detection and recognition of PDs. The parameters used for software selection included immunity to disturbances and wide- and narrow-band noises, minimum computing time, and overall efficiency (Sikorski & Siodla, 2005; Sikorski et al., 2007a).
Based on results of numerous computer simulations and a widespread literature study, high-resolution spectral analysis (HRSA) and joint time-frequency analysis (JTFA) were chosen as the optimum methods for establishing the AE-based PD-patterns (Antoniadis & Oppenheim, 1995; Holschneider, 1998; Kia et al., 2007; Lobos et al., 2000, 2001; Ma et al., 2002; Shim et al., 2000; Yang & Judd, 2003; Zhang et al., 2003).
4.1 High-resolution spectral analysis (HRSA)
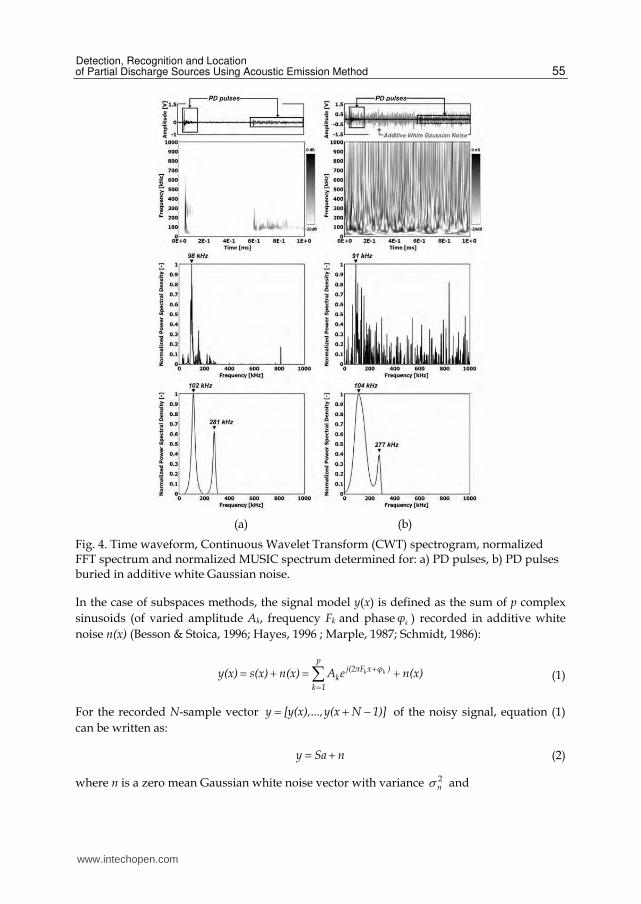
High-resolution spectral analysis methods, also known as subspace methods, generate the frequency component estimates for a signal based on eigenanalysis or eigendecomposition of the correlation matrix (Hayes, 1996; Marple, 1987). These methods exploit the noise subspace to estimate unknown frequency parameters of a random process and are very effective in the detection of sinusoids (a PD signal can be approximated as an exponentially attenuated sinusoidal oscillation) buried in noise, especially when the signal-to-noise ratios (SNR) are low. This property makes the analysis method particularly attractive for efficient detection of PD signals recorded under conditions of strong external disturbances. Due to this fact, the detection of internal discharges occurring in power transformer in which the acoustic signal is damped by pressboard barriers is also possible. It is worth mentioning that such efficient detection with the use of classic Fast Fourier Transform (FFT) is not possible. Among available subspace methods Multiple Signal Classification (MUSIC) was chosen (Schmidt, 1986). The MUSIC method very precisely identifies harmonic components (Besson & Stoica, 1996; Hayes, 1996; Lobos et al., 2000, 2001; Marple, 1987). This property is illustrated below by the results of simulation in which two waveforms were used (Fig. 4).
The first waveform analysed (Fig. 4a) was registered in an electrode system, which enabled the generation of different types of multi-source discharges. In this case PD in an internal gas void and surface discharges were generated simultaneously (at ~30 mV noise level). The second waveform analysed (Fig. 4b) has the same PD signal, but it is buried in additive white Gaussian noise. One can see that the MUSIC method, independent of the noise level, efficiently detects all the dominant harmonic components (in this case ~100 kHz and ~280 kHz). Fast Fourier Transform allows detection of PD signals only in the absence of other noise sources, because all the noise components are also visible in the spectrum. Therefore, in a case of measurements under industrial conditions (e.g. in power substation), it is advantageous to replace the classic FFT analysis with the MUSIC algorithm, or similar high-resolution spectral method. This results in enhanced PD detection sensitivity and fault recognition efficiency.
www.intechopen.com
Detection, Recognition and Location of Partial Discharge Sources Using Acoustic Emission Method 55
(a) (b)
Fig. 4. Time waveform, Continuous Wavelet Transform (CWT) spectrogram, normalized FFT spectrum and normalized MUSIC spectrum determined for: a) PD pulses, b) PD pulses buried in additive white Gaussian noise.
In the case of subspaces methods, the signal model y(x) is defined as the sum of p complex
sinusoids (of varied amplitude Ak, frequency Fk and phase kφ ) recorded in additive white
noise n(x) (Besson & Stoica, 1996; Hayes, 1996 ; Marple, 1987; Schmidt, 1986):
k k
pj(2πF x φ )
kk 1
y(x) s(x) n(x) A e n(x)
(1)
For the recorded N-sample vector y [y(x),...,y(x N 1)] of the noisy signal, equation (1)
can be written as:
y Sa n (2)
where n is a zero mean Gaussian white noise vector with variance 2n and
www.intechopen.com

Acoustic Emission 56
1 2 pS [s ,s ,...,s ] (3)
k kj2πF j2πF (N 1) Tks [1,e ,...,e ] (4)
T1 2 pa [A ,A ,...,A ] (5)
The first step of the MUSIC algorithm is the calculation of the value of the autocorrelation function
HyyR E[yy ] (6)
for the registered signal y, where the exponent H denotes the Hermitian transpose and E denotes the expectation. Next, from the calculated autocorrelation function a N×N matrix is built. Using matrix notation this operation can be expressed as:
H 2yy ss nn nR R R SPS ┫ I (7)
where Rss and Rnn are the autocorrelation matrices of the signal and noise respectively, I is a square diagonal identity matrix of dimension N×N and H 2 2 2
1 2 pP aa diag[A ,A ,...,A ] is the diagonal matrix.
In the next step of the MUSIC algorithm an eigendecomposition of the autocorrelation matrix Ryy is performed. Because the autocorrelation matrix Rss of p complex sinusoids has only p non-zero eigenvalues, one can also express the diagonal matrix of the noise in terms of the eigenvectors of Rss. Then eigendecomposition of the autocorrelation matrix Ryy can be written as:
pH 2
yy ss nn k k k nk 1
p NH 2 H
k k k n k kk 1 k 1
p N2 H 2 H
k n k k n k kk 1 k p 1
R R R λ ν ν ┫ I
λ ν ν ┫ ν ν
(λ ┫ )ν ν ┫ ν ν
(8)
where kν are the eigenvectors and kλ are the eigenvalues of the matrix Rss respectively and the expression ( kλ + 2
n┫ ) complies the eigenvalues of the matrix Ryy.
In this way the calculated eigenvectors and eigenvalues are partitioned into two subsets. The first set of eigenvectors, associated with the p largest eigenvalues, span the signal subspace and the second subset of eigenvectors span the noise subspace and have 2
n┫ as their eigenvalues. The signal subspace (signal eigenvectors) and the noise subspace (noise eigenvectors) are orthogonal, therefore all p harmonic signal vectors si (s1,s2,..,sp) are orthogonal to the noise subspace:
i
N 1j2πF xH
i k kx 0
s f ν v x e 0
k=p+1,..,N (9)
www.intechopen.com
Detection, Recognition and Location of Partial Discharge Sources Using Acoustic Emission Method 57
Then, the MUSIC spectrum is defined as:
MUSIC N H H2Hk
k p 1
1 1P f
s (f)VV s(f)s (f)ν
(10)
where j2πf j2π(N 1)f Ts(f) [1,e ,...,e ] is the complex sinusoidal vector and p 1 p 2 NV [ν ,ν ,...,ν ]
is the matrix of eigenvectors of the noise subspace.
4.2 Joint Time-Frequency Analysis (JTFA)
Joint Time-Frequency Analysis is also an effective tool for acoustic emission signal processing (Boczar & Zmarzly, 2004). The application of JTFA allows one not only to observe the changes in amplitude spectrum, but also makes possible detecting in investigated signal narrow-band noises and disturbances. A given type of PD can be described as a three dimensional image (time-frequency-amplitude). For joint time-frequency analysis of acoustic emission signals originating from partial discharges, the Continuous Wavelet Transform (CWT) was chosen.
Simplifying, the operational rule of this transform can be defined as an operation of
comparison of investigated signal y(x) to elementary components γ┬,a(x) obtained by scaling
and shifting of basic wavelet γ(x) called mother wavelet. The scaling result γ(x) of wavelet
with the scale coefficient a > 0 can be expressed as follows (Antoniadis & Oppenheim, 1995;
Holschneider, 1998):
a
1 xγ x γaa
(11)
Meanwhile the shifting operation of rescaled wavelet γa(x) and the shifting coefficient is written as follows:
┬,a a
1 x ┬γ x γ x ┬ γaa
, for a > 0 (12)
Then the operation of comparison of calculated basic components γ┬,a(x) with investigated signal y(x) can be defined as:
1 x ┬CWT ┬,a y x γ x dx y x γ dx┬,a
aa
(13)
were x ┬γ
a
is scaled with coefficient a and shifted in time by ┬, wavelet γ(x). CWT value
in (┬, a) point expresses similarity (correlation) of signal y(x) to scaled and shifted wavelet (the higher value, the greater similarity), whereas the * symbol denotes the complex conjugate.
Presentation of continuous wavelet transform as a picture of time-frequency-amplitudes called
a scalogram, and its values are calculated as a square of the module CWT(┬, a):
www.intechopen.com
Acoustic Emission 58
2SCAL ┬,a CWT ┬,a (14)
After calculating the scale coefficient a to corresponding frequency values the time-frequency-amplitude image (spectrogram) is obtained.
5. Partial discharges recorded in oil-paper insulation models
Properly planed and performed investigations conducted on models are important sources of information on electrical withstand of parts of transformer insulation, such as coil-to-coil insulation, clearance to core, space at the bushings etc. But if the conducted investigations should have a cognitive and scientific value, it is necessary to fulfil some basic postulates, such as:
the construction of models should have the same material structure, shape and
proportional geometrical dimensions as the part of the insulation that is modelled; it
should reproduce the same mechanism of initiation and development of partial discharges,
the construction of models should reproduce real distribution of electric field,
the oil in the model should have similar composition as the real one – content of water, dissolved gases and solid impurities.
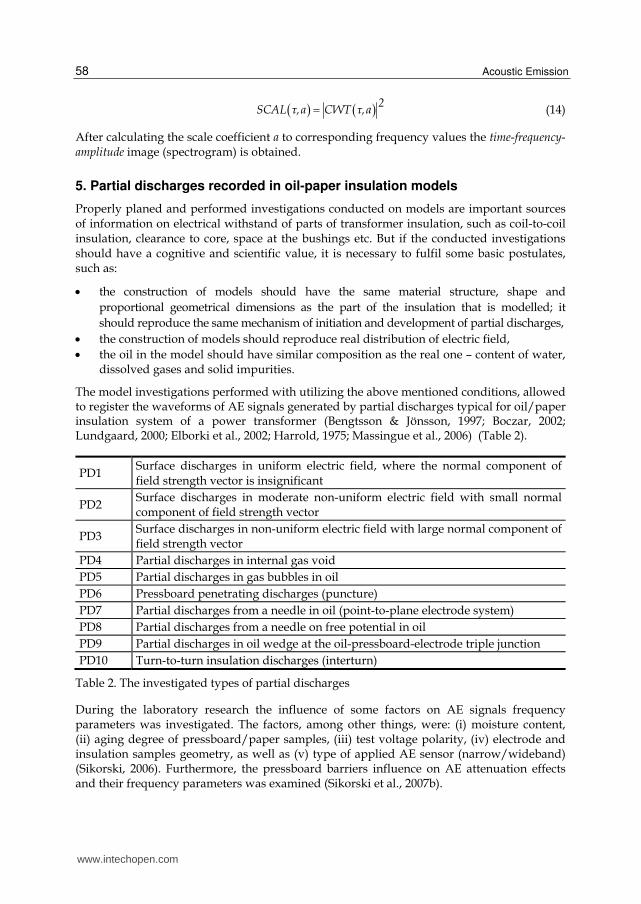
The model investigations performed with utilizing the above mentioned conditions, allowed to register the waveforms of AE signals generated by partial discharges typical for oil/paper insulation system of a power transformer (Bengtsson & Jönsson, 1997; Boczar, 2002; Lundgaard, 2000; Elborki et al., 2002; Harrold, 1975; Massingue et al., 2006) (Table 2).
PD1 Surface discharges in uniform electric field, where the normal component of field strength vector is insignificant
PD2 Surface discharges in moderate non-uniform electric field with small normal component of field strength vector
PD3 Surface discharges in non-uniform electric field with large normal component of field strength vector
PD4 Partial discharges in internal gas void
PD5 Partial discharges in gas bubbles in oil
PD6 Pressboard penetrating discharges (puncture)
PD7 Partial discharges from a needle in oil (point-to-plane electrode system)
PD8 Partial discharges from a needle on free potential in oil
PD9 Partial discharges in oil wedge at the oil-pressboard-electrode triple junction
PD10 Turn-to-turn insulation discharges (interturn)
Table 2. The investigated types of partial discharges
During the laboratory research the influence of some factors on AE signals frequency parameters was investigated. The factors, among other things, were: (i) moisture content, (ii) aging degree of pressboard/paper samples, (iii) test voltage polarity, (iv) electrode and insulation samples geometry, as well as (v) type of applied AE sensor (narrow/wideband) (Sikorski, 2006). Furthermore, the pressboard barriers influence on AE attenuation effects and their frequency parameters was examined (Sikorski et al., 2007b).
www.intechopen.com
Detection, Recognition and Location of Partial Discharge Sources Using Acoustic Emission Method 59
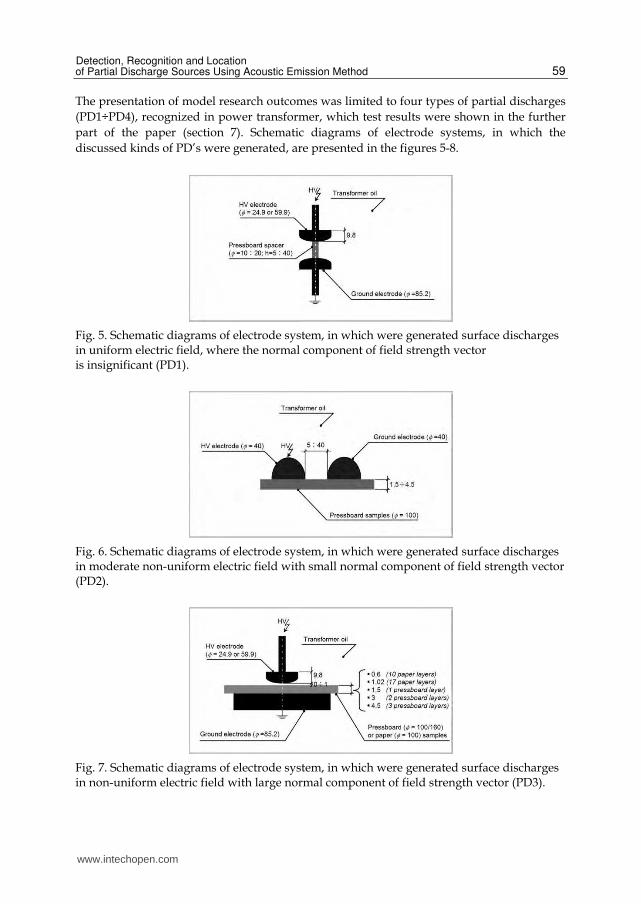
The presentation of model research outcomes was limited to four types of partial discharges
(PD1÷PD4), recognized in power transformer, which test results were shown in the further
part of the paper (section 7). Schematic diagrams of electrode systems, in which the
discussed kinds of PD’s were generated, are presented in the figures 5-8.
Fig. 5. Schematic diagrams of electrode system, in which were generated surface discharges in uniform electric field, where the normal component of field strength vector is insignificant (PD1).
Fig. 6. Schematic diagrams of electrode system, in which were generated surface discharges in moderate non-uniform electric field with small normal component of field strength vector (PD2).
Fig. 7. Schematic diagrams of electrode system, in which were generated surface discharges in non-uniform electric field with large normal component of field strength vector (PD3).
www.intechopen.com
Acoustic Emission 60
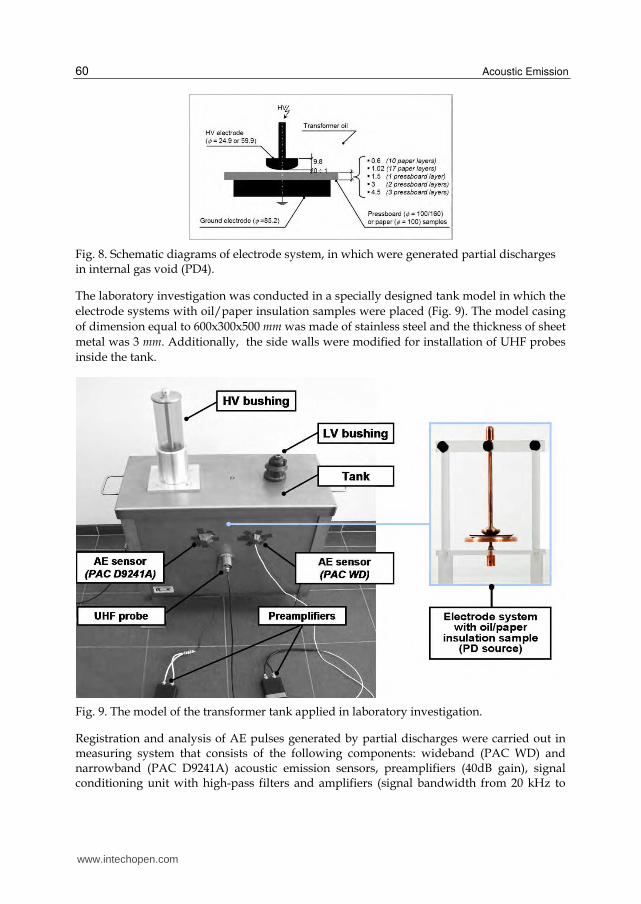
Fig. 8. Schematic diagrams of electrode system, in which were generated partial discharges in internal gas void (PD4).
The laboratory investigation was conducted in a specially designed tank model in which the
electrode systems with oil/paper insulation samples were placed (Fig. 9). The model casing
of dimension equal to 600x300x500 mm was made of stainless steel and the thickness of sheet
metal was 3 mm. Additionally, the side walls were modified for installation of UHF probes
inside the tank.
Fig. 9. The model of the transformer tank applied in laboratory investigation.
Registration and analysis of AE pulses generated by partial discharges were carried out in measuring system that consists of the following components: wideband (PAC WD) and narrowband (PAC D9241A) acoustic emission sensors, preamplifiers (40dB gain), signal conditioning unit with high-pass filters and amplifiers (signal bandwidth from 20 kHz to
www.intechopen.com
Detection, Recognition and Location of Partial Discharge Sources Using Acoustic Emission Method 61
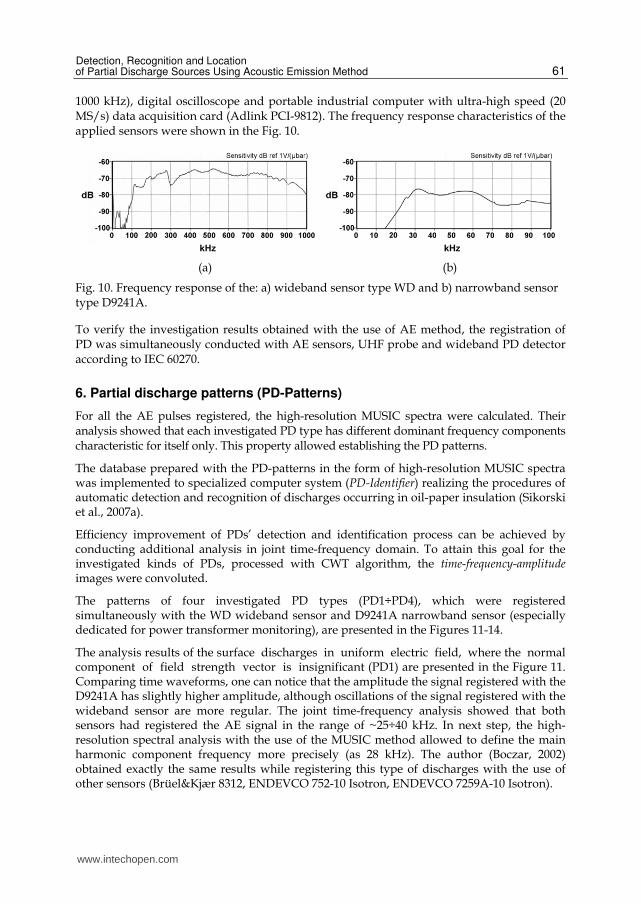
1000 kHz), digital oscilloscope and portable industrial computer with ultra-high speed (20 MS/s) data acquisition card (Adlink PCI-9812). The frequency response characteristics of the applied sensors were shown in the Fig. 10.
(a) (b)
Fig. 10. Frequency response of the: a) wideband sensor type WD and b) narrowband sensor type D9241A.
To verify the investigation results obtained with the use of AE method, the registration of PD was simultaneously conducted with AE sensors, UHF probe and wideband PD detector according to IEC 60270.
6. Partial discharge patterns (PD-Patterns)
For all the AE pulses registered, the high-resolution MUSIC spectra were calculated. Their analysis showed that each investigated PD type has different dominant frequency components characteristic for itself only. This property allowed establishing the PD patterns.
The database prepared with the PD-patterns in the form of high-resolution MUSIC spectra was implemented to specialized computer system (PD-Identifier) realizing the procedures of automatic detection and recognition of discharges occurring in oil-paper insulation (Sikorski et al., 2007a).
Efficiency improvement of PDs’ detection and identification process can be achieved by conducting additional analysis in joint time-frequency domain. To attain this goal for the investigated kinds of PDs, processed with CWT algorithm, the time-frequency-amplitude images were convoluted.
The patterns of four investigated PD types (PD1÷PD4), which were registered simultaneously with the WD wideband sensor and D9241A narrowband sensor (especially dedicated for power transformer monitoring), are presented in the Figures 11-14.
The analysis results of the surface discharges in uniform electric field, where the normal component of field strength vector is insignificant (PD1) are presented in the Figure 11. Comparing time waveforms, one can notice that the amplitude the signal registered with the D9241A has slightly higher amplitude, although oscillations of the signal registered with the wideband sensor are more regular. The joint time-frequency analysis showed that both sensors had registered the AE signal in the range of ~25÷40 kHz. In next step, the high-resolution spectral analysis with the use of the MUSIC method allowed to define the main harmonic component frequency more precisely (as 28 kHz). The author (Boczar, 2002) obtained exactly the same results while registering this type of discharges with the use of other sensors (Brüel&Kjær 8312, ENDEVCO 752-10 Isotron, ENDEVCO 7259A-10 Isotron).
www.intechopen.com

Acoustic Emission 62
(a) (b)
Fig. 11. Time waveform, continuous wavelet transform (CWT) spectrogram and normalized MUSIC spectrum prepared for acoustic emission signals generated by surface discharges in uniform electric field, where the normal component of field strength vector is insignificant (PD1), which were registered with wideband sensor type WD (a) and narrowband sensor type D9241A (b).
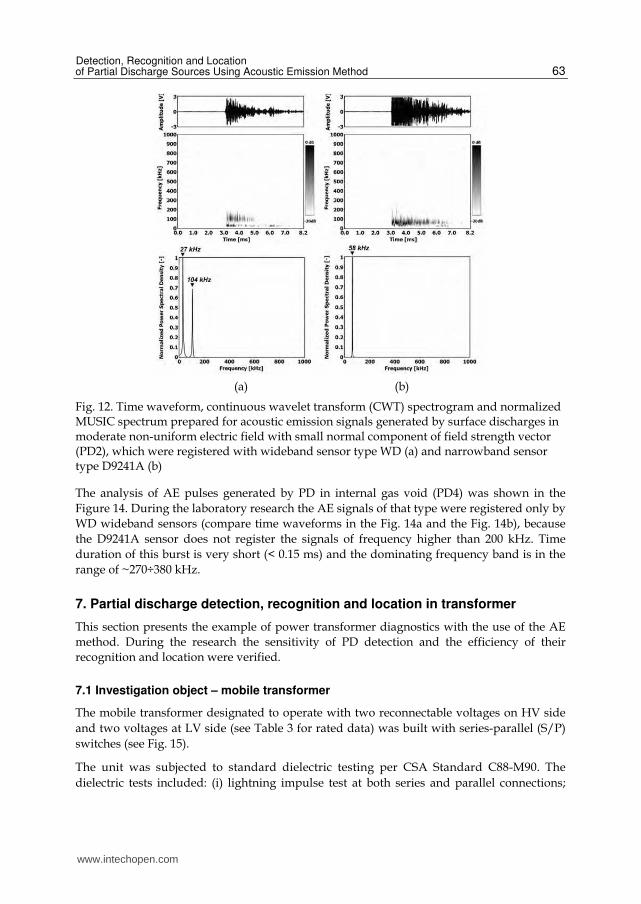
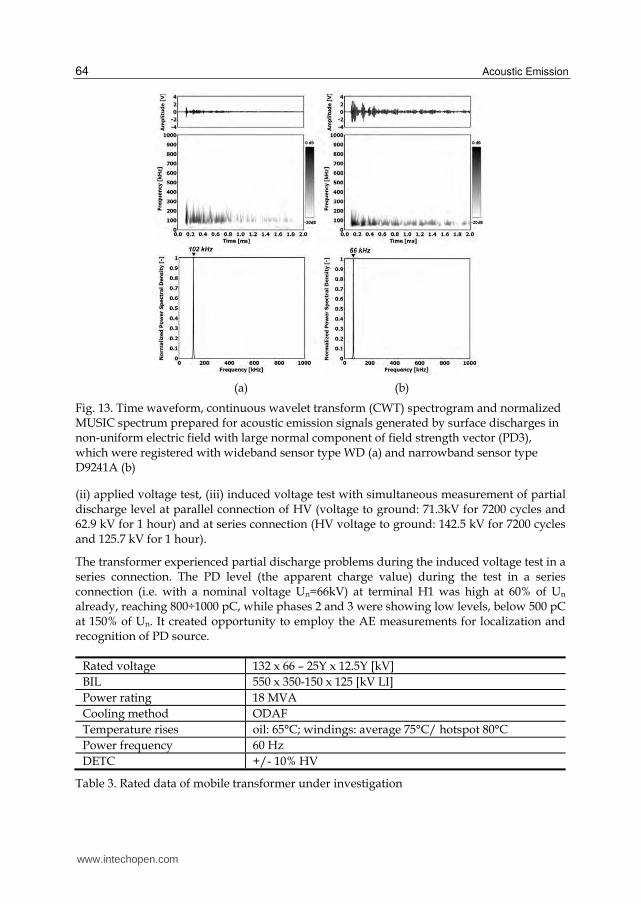
The model research proved that the narrowband sensor is more sensitive in detection of surface discharges generated in moderate non-uniform electric field with small normal component of field strength vector (PD2) or in non-uniform electric field with large normal component of field strength vector (PD3). On the CWT spectrograms one can notice that in case of the WD sensor, the presence of normal component of field strength vector results in occurrence of harmonic components in the range of ~90÷110 kHz (Fig. 12a and Fig 13a). In turn, in case of narrowband sensor the additional harmonic components are transferred in the range of ~50÷100 kHz (Fig. 12b and Fig. 13b).
This divergence in the obtained PD-patterns results from different frequency response of both sensors. As one can see on frequency response characteristics (Fig. 10), the WD wideband sensor, compared to narrowband sensor, is not capable to transfer the acoustic signal in the range of ~50÷90 kHz.
One may subsequently state that the parameters characterizing an AE sensor modify the signal and resulting CWT pattern. The measured results confirm that the PD pattern strongly depends on the type of applied acoustic sensor.
Although the narrowband sensors are typically characterized by high sensitivity, they are less universal than wideband sensors due to limited bandwidth. Wideband sensors have advantage in case of detecting certain types of PD e.g. discharges in oil (from sharp point), discharges in gas bubbles in oil and discharges in internal gas voids (voids within delaminations).
www.intechopen.com
Detection, Recognition and Location of Partial Discharge Sources Using Acoustic Emission Method 63
(a) (b)
Fig. 12. Time waveform, continuous wavelet transform (CWT) spectrogram and normalized MUSIC spectrum prepared for acoustic emission signals generated by surface discharges in moderate non-uniform electric field with small normal component of field strength vector (PD2), which were registered with wideband sensor type WD (a) and narrowband sensor type D9241A (b)
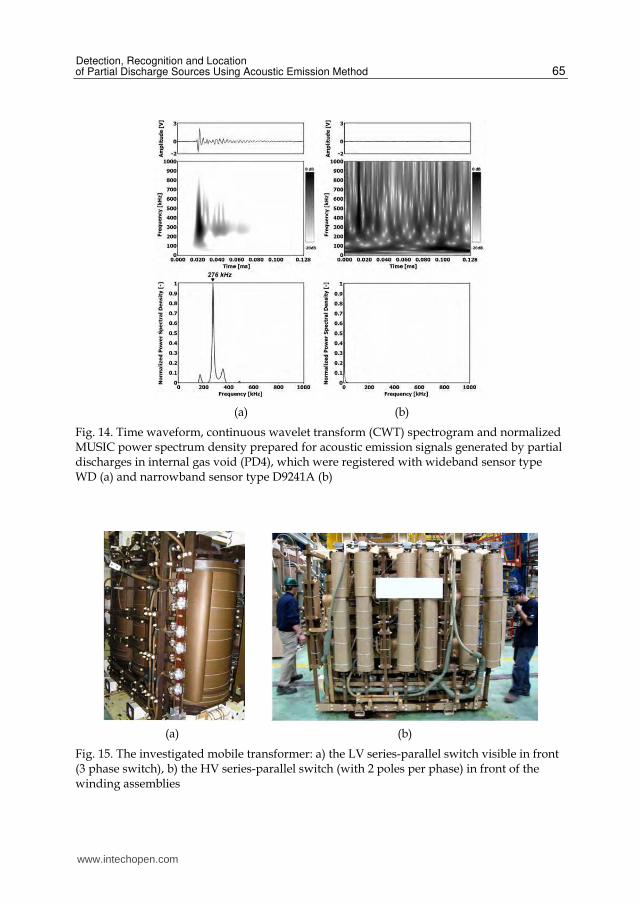
The analysis of AE pulses generated by PD in internal gas void (PD4) was shown in the
Figure 14. During the laboratory research the AE signals of that type were registered only by
WD wideband sensors (compare time waveforms in the Fig. 14a and the Fig. 14b), because
the D9241A sensor does not register the signals of frequency higher than 200 kHz. Time
duration of this burst is very short (< 0.15 ms) and the dominating frequency band is in the
range of ~270÷380 kHz.
7. Partial discharge detection, recognition and location in transformer
This section presents the example of power transformer diagnostics with the use of the AE
method. During the research the sensitivity of PD detection and the efficiency of their
recognition and location were verified.
7.1 Investigation object – mobile transformer
The mobile transformer designated to operate with two reconnectable voltages on HV side
and two voltages at LV side (see Table 3 for rated data) was built with series-parallel (S/P)
switches (see Fig. 15).
The unit was subjected to standard dielectric testing per CSA Standard C88-M90. The
dielectric tests included: (i) lightning impulse test at both series and parallel connections;
www.intechopen.com
Acoustic Emission 64
(a) (b)
Fig. 13. Time waveform, continuous wavelet transform (CWT) spectrogram and normalized MUSIC spectrum prepared for acoustic emission signals generated by surface discharges in non-uniform electric field with large normal component of field strength vector (PD3), which were registered with wideband sensor type WD (a) and narrowband sensor type D9241A (b)
(ii) applied voltage test, (iii) induced voltage test with simultaneous measurement of partial discharge level at parallel connection of HV (voltage to ground: 71.3kV for 7200 cycles and 62.9 kV for 1 hour) and at series connection (HV voltage to ground: 142.5 kV for 7200 cycles and 125.7 kV for 1 hour).
The transformer experienced partial discharge problems during the induced voltage test in a series connection. The PD level (the apparent charge value) during the test in a series connection (i.e. with a nominal voltage Un=66kV) at terminal H1 was high at 60% of Un already, reaching 800÷1000 pC, while phases 2 and 3 were showing low levels, below 500 pC at 150% of Un. It created opportunity to employ the AE measurements for localization and recognition of PD source.
Rated voltage 132 x 66 – 25Y x 12.5Y [kV]
BIL 550 x 350-150 x 125 [kV LI]
Power rating 18 MVA
Cooling method ODAF
Temperature rises oil: 65°C; windings: average 75°C/ hotspot 80°C
Power frequency 60 Hz
DETC +/- 10% HV
Table 3. Rated data of mobile transformer under investigation
www.intechopen.com
Detection, Recognition and Location of Partial Discharge Sources Using Acoustic Emission Method 65
(a) (b)
Fig. 14. Time waveform, continuous wavelet transform (CWT) spectrogram and normalized MUSIC power spectrum density prepared for acoustic emission signals generated by partial discharges in internal gas void (PD4), which were registered with wideband sensor type WD (a) and narrowband sensor type D9241A (b)
(a) (b)
Fig. 15. The investigated mobile transformer: a) the LV series-parallel switch visible in front (3 phase switch), b) the HV series-parallel switch (with 2 poles per phase) in front of the winding assemblies
www.intechopen.com

Acoustic Emission 66
7.2 Partial discharge detection and location – conventional electrical method
The investigation tests were performed with 4 combinations of HV and LV connections:
(i) HV in series, LV in parallel, (ii) HV in series, LV in series, (iii) HV in parallel, LV in series,
(iv) HV in parallel, LV in parallel. Every time when HV side was in series connection, the
PD level was elevated on the terminal H1.
The electric PD pattern (see Fig. 16) with maximum value of PD pulses appearing close to
maximum of the voltage waveshape where implying the location of a PD source close to the
HV 1 line, HV 1 terminal, or metal parts of HV 1 circuit, physically in proximity of a two-
pole series-parallel switch on phase HV 1 (see Fig. 17).
Fig. 16. The results of the PD detection with the use of conventional electric method and typical electric PD pattern registered at terminal H1 (Qmax=961 pC).
Fig. 17. Approximate location of PD source at the S/P switch on phase HV 1 (red rectangle).
www.intechopen.com

Detection, Recognition and Location of Partial Discharge Sources Using Acoustic Emission Method 67
7.3 Partial discharge detection, recognition and location – acoustic emission method
The location of partial discharges with the use of acoustic emission method may be conducted by: (i) measurement of AE pulses amplitude in different distances from PD source (auscultatory method), or (ii) AE pulses arrival timings at sensors fixed in various places of the transformer tank (triangulation method) (Markalous et al., 2008).
The auscultatory method applied in this investigation is the easiest way to locate the PD sources (IEEE, 2007). Despite the fact that its accuracy is lower than that of triangulation method’s, it may be very efficient and useful in cases, when (i) the measurement time is limited by the time of voltage tests, (ii) during the voltage test the phase with PD source has been detected with the use of wideband electrical method, (iii) acoustic measurement is conducted with one-channel-setup, (iv) the detail construction of the investigated transformer is known, (v) the investigated transformer is relatively small.
To avoid the measurement errors and increase the PD amplitude measurement accuracy, the measurement channel calibration was conducted each time after fixing the sensor on the tank wall.
Among the 8 points forming the measurement grid, the highest AE pulse amplitudes due to internal PDs in a transformer were registered in point #5 and #3 (Fig. 18b).
(a) (b)
Fig. 18. The results of PD sources location with the use of auscultatory method: acoustic map (a) and AE waveforms registered in selected places of power transformer tank (b)
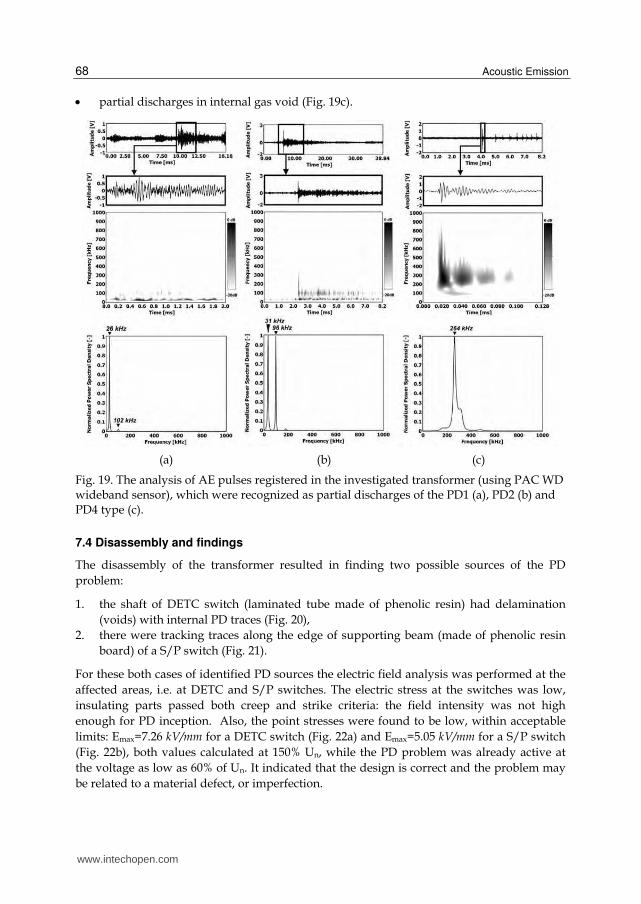
Three different types of AE signals were registered in the investigated mobile transformer (Fig. 19). The comparative analysis with PD-patterns obtained in model research (Fig. 11-14) suggested that following types of discharges could have occurred in a transformer:
surface discharges in uniform electric field, where the normal component of field strength vector is insignificant (Fig. 19a),
surface discharges in moderate non-uniform electric field with small normal component of field strength vector (Fig. 19b),
www.intechopen.com
Acoustic Emission 68
partial discharges in internal gas void (Fig. 19c).
(a) (b) (c)
Fig. 19. The analysis of AE pulses registered in the investigated transformer (using PAC WD wideband sensor), which were recognized as partial discharges of the PD1 (a), PD2 (b) and PD4 type (c).
7.4 Disassembly and findings
The disassembly of the transformer resulted in finding two possible sources of the PD
problem:
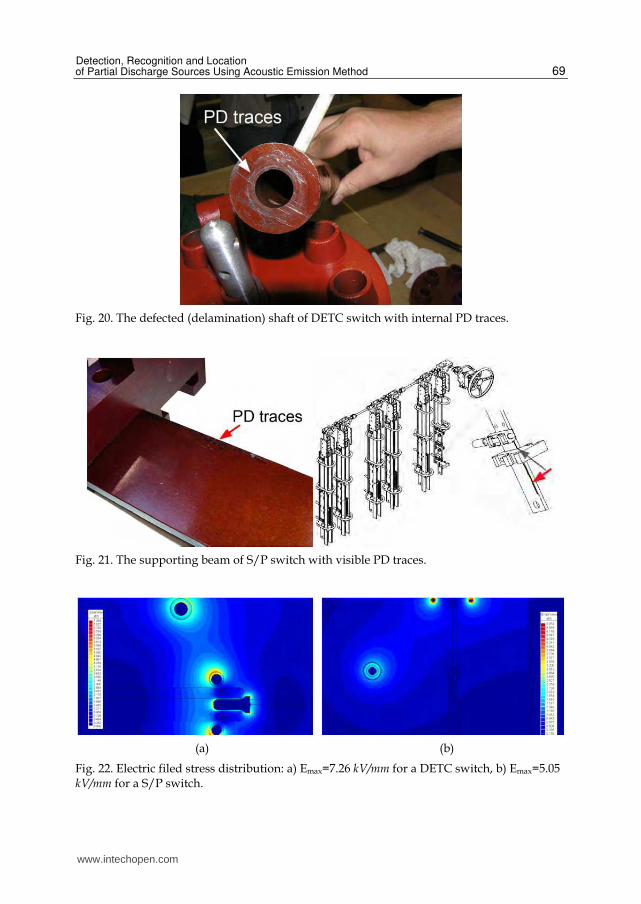
1. the shaft of DETC switch (laminated tube made of phenolic resin) had delamination
(voids) with internal PD traces (Fig. 20),
2. there were tracking traces along the edge of supporting beam (made of phenolic resin
board) of a S/P switch (Fig. 21).
For these both cases of identified PD sources the electric field analysis was performed at the
affected areas, i.e. at DETC and S/P switches. The electric stress at the switches was low,
insulating parts passed both creep and strike criteria: the field intensity was not high
enough for PD inception. Also, the point stresses were found to be low, within acceptable
limits: Emax=7.26 kV/mm for a DETC switch (Fig. 22a) and Emax=5.05 kV/mm for a S/P switch
(Fig. 22b), both values calculated at 150% Un, while the PD problem was already active at
the voltage as low as 60% of Un. It indicated that the design is correct and the problem may
be related to a material defect, or imperfection.
www.intechopen.com
Detection, Recognition and Location of Partial Discharge Sources Using Acoustic Emission Method 69
Fig. 20. The defected (delamination) shaft of DETC switch with internal PD traces.
Fig. 21. The supporting beam of S/P switch with visible PD traces.
(a) (b)
Fig. 22. Electric filed stress distribution: a) Emax=7.26 kV/mm for a DETC switch, b) Emax=5.05 kV/mm for a S/P switch.
www.intechopen.com

Acoustic Emission 70
Therefore, the S/P switch was disassembled and the tracking traces were found on its pressboard support. The pressboard support was subjected to X-rays and a metallic contaminant was found, buried at the edge of the board where PD tracking was originating from (Fig. 23).
Fig. 23. The location of embedded metal particle under the surface of pressboard beam of S/P switch (the PD tracking originated from this area).
Based on recorded test results and physical evidence, the following scenario for the PD
problem was determined:
1. in a series connection a high electric stress was developed at the S/P switch – between the pressboard support and the tank;
2. this electric stress led to initiation of PD at the edge of metallic contaminant embedded in the board;
3. next, the surface discharge developed along the edge of pressboard beam; 4. the progressing surface discharges resulted in degradation of dielectric properties of
mineral oil, giving rise to PD in adjacent insulating elements of S/P switch as well as DETC switch.
8. Conclusions
The example of efficient detection and recognition of partial discharge sources using acoustic emission method with advanced signal processing was presented in the chapter.
High-resolution Multiple Signal Classification (MUSIC) method, chosen for the frequency analysis, effectively detects in registered AE signal (also buried in noise) frequency components corresponding to partial discharges. In turn, joint time-frequency analysis using Continuous Wavelet Transform (CWT) allows to detect multi-source discharges of different types, as well as narrowband noises.
On the basis of selected digital signal processing methods and complex model research, the database with PD-Patterns was prepared. An important conclusion of this model research is
www.intechopen.com
Detection, Recognition and Location of Partial Discharge Sources Using Acoustic Emission Method 71
that each of the investigated insulation defects (PD sources) generates repeatable and characteristic (unique) acoustic emission signals. Moreover, it was shown that the shape of PD-Patterns strongly depends on the type of the applied sensor.
The increase of PD detection and recognition efficiency can be achieved by simultaneous application of narrow- (20÷100 kHz) and wideband (20÷500 kHz) sensors. Due to that, a high sensitivity of measurement with a possibility of detecting all PD types is combined.
The measurements performed in the power transformer factory showed that PD-patterns acquired during a laboratory research can be successfully employed in detection and recognition of discharges occurring in real power transformers.
9. References
Antoniadis, A. & Oppenheim, G. (1995). Wavelets and Statistics, Springer-Verlag, ISBN
9780387945644, New York, USA
ASTM E650-97 (2007). Standard Guide for Mounting Piezoelectric Acoustic Emission Sensors,
American Society for Testing and Materials, 2007
Bengtsson, T. & Jönsson, B. (1997). Transformer PD diagnosis using acoustic emission
technique, 10th International Symposium on High Voltage Engineering, Montreal,
Canada, 25-29 August 1997
Besson, O. & Stoica, P. (1996). Analysis of MUSIC and ESPRIT Frequency Estimates for
Sinusoidal Signals with Lowpass Envelopes, IEEE Transactions in Signal Processing,
Vol.44, No.9, pp. 2359-2364, ISSN 1053-587X
Boczar, T. (2001). Identification of a specific type of PD from acoustic emission frequency
spectra, IEEE Transactions on Dielectrics and Electrical Insulation, Vol.8, No.4, pp. 598-
606, ISSN 1070-9878
Boczar, T. (2002). Acoustic emission of multisource surface partial discharges generated in
insulating oil, 6th Symposium on High Voltage Engineering IW-2002, pp. 14-17,
Poznan, Poland, May 2002
Boczar, T. & Zmarzly, D. (2004). Application of wavelet analysis to acoustic emission pulses
generated by partial discharges, IEEE Transactions on Dielectrics and Electrical
Insulation, Vol.11, No.3, pp. 433-449, ISSN 1070-9878 Elborki, M.A.; Crossley, P.A.; Wang, Z.D.; Darwin, A. & Edwards, G. (2002). Detection and
Characterization of Partial Discharges in Transformer Defect Models, IEEE Power
Engineering Society Summer Meeting, pp. 405-410, July 2002
Feser, K. (2003). Developments and challenges in high voltage engineering, 13th International
Symposium on High Voltage Engineering, p. 3, ISBN 978-9077017791, Delft,
Netherlands, August 2003
Gulski, E.; Smith, J.J.; Brooks, R. & Turner, M. (1999). Experiences with Digital Analysis of
Discharges in High Voltage Components, IEEE Electrical Insulation Magazine,
Vol.15, No.3, (May/June 1992), pp. 15-24, ISSN 0883-7554
Gulski, E. & Smitt, J.J. (2007). Condition Assessment of Transmission Network
Infrastructures (April 2007), Power Tech, 2007 IEEE Lausanne, pp. 2189–2194,
Lausanne, Switzerland, July 2007
www.intechopen.com
Acoustic Emission 72
Harrold, R.T. (1975). Ultrasonic spectrum signatures of under-oil corona sources, IEEE
Transactions on Electrical Insulation, Vol.10, No.4, pp. 109-112, ISSN 0018-9367
Hayes, M.H. (1996). Statistical Digital Signal Processing and Modeling, John Wiley & Sons Inc.,
ISBN 978-0-471-59431-4, San Francisco, USA
Holschneider, M. (1998). Wavelets: an analysis tool, Clarendon Press, ISBN 0-19-850521-3,
Oxford, UK
IEEE Guide for the Detection and Location of Acoustic Emissions from Partial Discharges in
Oil-Immersed Power Transformers and Reactors, C57.127-2007, Institute of
Electrical and Electronics Engineers, August 2007
Kia, S.H.; Hena, H. & Capolino, G.A. (2007). High-Resolution Frequency Estimation
Method for Three-Phase Induction Machine Fault Detection, IEEE Transactions
on Industrial Electronics, Vol.54, No.4, (August 2007), pp. 2305-2314, ISSN 0278-
0046
Kuffel, E.; Zaengl, W.S. & Kuffel, J. (2000). High Voltage Engineering Fundamentals (Second
edition), Butterworth-Heineman Publication, ISBN 978-0-7506-3634-6, Oxford, UK
Lobos, T.; Kozin, T. & Leonowicz, Z. (2000). High Resolution Spectrum Estimation
Methods for Signal Analysis in Power Electronics and Systems, 2000 IEEE
International Symposium on Circuits and Systems, pp. 553-556, Geneva, Switzerland,
May 2000
Lobos, T.; Leonowicz, Z. & Rezmer, J. (2003). Advanced Spectrum Estimation Methods for
Signal Analysis in Power Electronics, IEEE Transactions on Industrial Electronics,
Vol.50, No.3, pp. 514-519, June 2003, ISSN 0278-0046
Lundgaard, L.E. (1992a). Partial Discharge – Part XIII: Acoustic Partial Discharge Detection –
Fundamental Considerations, IEEE Electrical Insulation Magazine, Vol.8, No.4,
(July/August 1992), pp. 25-31, ISSN 0883-7554
Lundgaard, L.E. (1992b). Partial Discharge – Part XIII: Acoustic Partial Discharge Detection
– Fundamental Considerations, IEEE Electrical Insulation Magazine, Vol.8, No.5,
(September/October 1992), pp. 34-43, ISSN 0883-7554
Lundgaard, L.E. (2000). Partial discharges in transformer insulation, CIGRE Task Force
15.01.04, Paper 15-302, Paris, France, 2000
Ma, X.; Zhou, C. & Kemp, I.J. (2002). Interpretation of wavelet analysis and its application in
partial discharge detection, IEEE Transactions on Dielectrics and Electrical Insulation,
Vol.9, No.3, (June 2002), pp. 446-457, ISSN 1070-9878
Markalous, S. ; Grossmann, E. & Feser, K. (2003). Online Acoustic PD-Measurements of
Oil/Paper-Insulated Transformers – Methods and Results, 13th International
Symposium on High Voltage Engineering, p. 324, ISBN 978-9077017791, Delft,
Netherlands, August 2003
Markalous, S.; Tenbohlen, S. & Feser, K. (2008). Detection and location of partial discharges
in power transformers using acoustic and electromagnetic signals, IEEE
Transactions on Dielectrics and Electrical Insulation, Vol.15, No.6, pp. 1576–1583, ISSN
1070-9878
Marple, S.L. (1987). Digital Spectral Analysis with Applications, Prentice Hall Inc., ISBN 0-132-
14149-3, New Jersey, USA
www.intechopen.com
Detection, Recognition and Location of Partial Discharge Sources Using Acoustic Emission Method 73
Massingue, F.; Meijer, S.; Agoris, D.; Smit, J.J. & Lopez-Roldan, J. (2006). Partial Discharge
Pattern Analysis of Modeled Insulation Defects in Transformer Insulation,
Conference Record of the 2006 IEEE International Symposium on Electrical Insulation,
(June 2006), pp. 542-545, ISSN 1089-084X Sakoda, T.; Arita, T.; Nieda, H. & Ando K. (1999). Analysis of Acoustic Emissions Caused by
the Partial Discharge in the Insulation Oil, Proceedings of 13th International
Conference on Dielectric Liquids (ICDL ’99), ISBN 0-7803-4759-5, Nara, Japan, July 20-
25, 1999
Schmidt, R.O. (1986). Multiple Emitter Location and Signal Parameter Estimation, IEEE
Trans. Antennas Propagation, Vol.34, No.3, pp. 276-280, ISSN: 0018-926X
Shim, I.; Soraghan, J.J. & Siew, W.H. (2000). Digital signal processing applied to the
detection of partial discharge: an overview, IEEE Electrical Insulation Magazine,
Vol.16, No.3, (May/June 2000), pp. 6-12, ISSN 0883-7554
Sikorski, W. & Siodla, K. (2005). Identification of partial discharge sources in high voltage
insulating systems using acoustic emission method, 14th International Symposium on
High Voltage Engineering, Beijing, China, 2005
Sikorski, W. (2006). Defects recognition in chosen insulation systems based on acoustic
emission signal analysis, Ph.D. dissertation, Institute of Electric Power Engineering,
Poznan University of Technology, Poznan, Poland, May 2006
Sikorski, W.; Staniek, P. & Siodla, K. (2006). The influence of pressboard barriers on signal
suppression of acoustic emission generated by partial discharges, 13th
International Workshop on High Voltage Engineering, p. 7, Kleinwalsertal, Austria,
September 2006
Sikorski, W. ; Siodla, K. & Staniek, P. (2007a). Identification of partial discharge sources in
high voltage insulating systems using acoustic emission method, 15th International
Symposium on High Voltage Engineering, Ljubljana, Slovenia, 2007
Sikorski, W.; Staniek, P. & Siodla K. (2007b). The influence of pressboard barriers on acoustic
emission signal generated by partial discharges in a power transformer, Poznan
University of Technology Academic Journals. Electrical Engineering, No. 56, 2007, ISSN
1897-0737
Sikorski, W.; Staniek, P. & Walczak K. (2007c). Joint UHF/AE Method of Partial
Discharges Detection and Identification, International Conference on Advances
in Processing, Testing and Application of Dielectric Materials APTADM’2007,
Wroclaw, 2007
Sikorski, W. & Walczak, K. (2010). Online Condition Monitoring and Expert System for
Power Transformers, ARWtr2010 - International Advanced Research Workshop On
Transformers, Santiago de Compostela, Spain, 3-6 October, 2010
Varlow, B.R.; Auckland, D.W.; Smith, C.D. & Zhao J. (1999). Acoustic emission analysis of
high voltage insulation, IEE Proceedings in Science, Measurement and Technology,
Vol.146, No.5, pp. 260-263, ISSN 1350-2344
Yang, L. & Judd, M.D. (2003). Recognizing multiple partial discharge sources in power
transformers by wavelet analysis of UHF signals, IEE Proceedings - Science,
Measurement and Technology, Vol.150, No.3, pp. 119-127, May 2003
www.intechopen.com

Acoustic Emission 74
Zhang, X.; Zhang, L.; Yue, B. & Xie, H. (2003). Investigation on Aging of Stator Bar
Insulation based on JTFA of PD Pulse Waveforms, Proceedings of the 7th International
Conference on Properties and Applications of Dielectric Materials, pp. 270-273, Nagoya,
Japan, June 2003
www.intechopen.com
Acoustic EmissionEdited by Dr. Wojciech Sikorski
ISBN 978-953-51-0056-0Hard cover, 398 pagesPublisher InTechPublished online 02, March, 2012Published in print edition March, 2012
InTech EuropeUniversity Campus STeP Ri Slavka Krautzeka 83/A 51000 Rijeka, Croatia Phone: +385 (51) 770 447 Fax: +385 (51) 686 166www.intechopen.com
InTech ChinaUnit 405, Office Block, Hotel Equatorial Shanghai No.65, Yan An Road (West), Shanghai, 200040, China
Phone: +86-21-62489820 Fax: +86-21-62489821
Acoustic emission (AE) is one of the most important non-destructive testing (NDT) methods for materials,constructions and machines. Acoustic emission is defined as the transient elastic energy that is spontaneouslyreleased when materials undergo deformation, fracture, or both. This interdisciplinary book consists of 17chapters, which widely discuss the most important applications of AE method as machinery and civil structurescondition assessment, fatigue and fracture materials research, detection of material defects and deformations,diagnostics of cutting tools and machine cutting process, monitoring of stress and ageing in materials,research, chemical reactions and phase transitions research, and earthquake prediction.
How to referenceIn order to correctly reference this scholarly work, feel free to copy and paste the following:
Wojciech Sikorski and Waldemar Ziomek (2012). Detection, Recognition and Location of Partial DischargeSources Using Acoustic Emission Method, Acoustic Emission, Dr. Wojciech Sikorski (Ed.), ISBN: 978-953-51-0056-0, InTech, Available from: http://www.intechopen.com/books/acoustic-emission/detection-recognition-and-location-of-partial-discharge-sources-using-acoustic-emission-method

© 2012 The Author(s). Licensee IntechOpen. This is an open access articledistributed under the terms of the Creative Commons Attribution 3.0License, which permits unrestricted use, distribution, and reproduction inany medium, provided the original work is properly cited.


![New Tools for Diagnostic Measurements on Rotating Machines · 2019. 5. 10. · [2] and the partial discharges according IEEE 1434 [3] respectively IEC 60270 [4] and IEC 60034-27 [5]](https://img.pdfslide.net/doc/110x75/610eaf70e44f7403e0146cae/new-tools-for-diagnostic-measurements-on-rotating-machines-2019-5-10-2-and.jpg)