Embed Size (px)
Citation preview

Hindawi Publishing CorporationJournal of Biomedicine and BiotechnologyVolume 2012, Article ID 492730, 10 pagesdoi:10.1155/2012/492730
Research Article
Detection of Target ssDNA Using a Microfabricated HallMagnetometer with Correlated Optical Readout
Steven M. Hira,1 Khaled Aledealat,2 Kan-Sheng Chen,2 Mark Field,3 Gerard J. Sullivan,3
P. Bryant Chase,4, 5 Peng Xiong,2, 5 Stephan von Molnar,2, 5 and Geoffrey F. Strouse1, 5
1 Department of Chemistry and Biochemistry, The Florida State University, Tallahassee, FL 32306-4390, USA2 Physics Department, The Florida State University, Tallahassee, Fl 32306-4350, USA3 Teledyne Scientific Company LLC, Thousand Oaks, CA 90360, USA4 Department of Biological Science, The Florida State University, Tallahassee, FL 32306, USA5 Integrative NanoScience Institute, The Florida State University, Tallahassee, FL 32306, USA
Correspondence should be addressed to Geoffrey F. Strouse, [email protected]
Received 8 July 2011; Accepted 20 August 2011
Academic Editor: Alf Mansson
Copyright © 2012 Steven M. Hira et al. This is an open access article distributed under the Creative Commons Attribution License,which permits unrestricted use, distribution, and reproduction in any medium, provided the original work is properly cited.
Sensing biological agents at the genomic level, while enhancing the response time for biodetection over commonly used, optics-based techniques such as nucleic acid microarrays or enzyme-linked immunosorbent assays (ELISAs), is an important criterionfor new biosensors. Here, we describe the successful detection of a 35-base, single-strand nucleic acid target by Hall-basedmagnetic transduction as a mimic for pathogenic DNA target detection. The detection platform has low background, large signalamplification following target binding and can discriminate a single, 350 nm superparamagnetic bead labeled with DNA. Detectionof the target sequence was demonstrated at 364 pM (<2 target DNA strands per bead) target DNA in the presence of 36 µMnontarget (noncomplementary) DNA (<10 ppm target DNA) using optical microscopy detection on a GaAs Hall mimic. The useof Hall magnetometers as magnetic transduction biosensors holds promise for multiplexing applications that can greatly improvepoint-of-care (POC) diagnostics and subsequent medical care.
1. Introduction
The ability to detect and discriminate specific nucleic acidsequences within a biological mixture has implications forgenome sequencing and single-nucleotide polymorphism(SNP) detection, biowarfare target detection, and the devel-opment of an efficient point-of-care (POC) device for path-ogen identification [1–6]. Through the integration of biologywith nanotechnology, a detection platform utilizing mag-netic transduction can capitalize on the high biological speci-ficity of DNA base pairing, the scalability of nanotechnology,the selectivity of self-assembled monolayer technology, andthe sensitivity of magnetic transduction [7, 8]. Coupling theextreme sensitivity of Hall-based magnetic detection, whichoperates over a wide magnetic field and temperature range,with the versatility and specificity of DNA base pairing canallow the realization of a new biological detection strategythat will improve POC diagnostics and subsequent medicaltreatment.
In this paper the detection of a 35-base pair DNAtarget sequence is demonstrated at the single-bead level ona Hall magnetometer biosensor. The biosensor is able toidentify a single-bead bound to target DNA (35 bases) andis amenable to the discrimination of DNA at the 364 pMconcentration in a background of 36 µM noncomplementaryDNA (<10 ppm). The detection strategy utilizes three-strandDNA annealing to colocalize a superparamagnetic (SPM)bead labeled probe strand, a label-free target strand, and areceptor strand at the surface of the Hall device. Localizationof the SPM bead on the surface of the Hall cross’ active areathrough annealing of all three DNA strands induces a voltagechange in the Hall junction due to a change in the localmagnetic field. This study demonstrates the effective useof an optical/magnetic bead detection platform to measureDNA at the picomolar (pM) level in the presence of µMextraneous DNA. At the concentrations of DNA used in themimic, the device platform can be optimized for clinical
2 Journal of Biomedicine and Biotechnology
translation. Development of single-nucleotide mismatch andreal-world pathogen samples are underway, but are beyondthe scope of the current study.
Many biosensors [9–24] still suffer from limitations instability, portability, sensitivity, and selectivity. TraditionalELISA based sensor platforms are sensitive at the pM leveland require 1-2 days for detection of a protein target. GMRsensors, which are recent additions to the biosensor field, candetect at the pM or femtomolar (fM) levels if magneticallyassisted [25]. Optics-based sensors, whether colorimetric orusing FRET assays, allow detection at the attomolar (aM)to nanomolar (nM) level. A novel approach utilized insome optics-based biosensors is the use of three-strand DNAannealing to produce an optical response that is directlyproportional to the annealing event. The use of three-strand ssDNA annealing strategies has been investigated forbiological target detection for the last 15 years and hasbeen shown to increase overall sensitivity. Mirkin et al.first used the controlled assembly and aggregation of DNAlabeled Au nanoparticles in solution as a colorimetric sensor[26]. Years later Taton et al. [14] utilized the tethering ofDNA-coated Au nanoparticles to DNA-coated surfaces usingan unlabeled target sequence for Ag-amplified colorimetricdetection with single-nucleotide mismatch sensitivity. Thetechnology has evolved further and been shown to detect∼6 × 10⁶ copies of genomic DNA using Ag-amplifiedscanometric detection on a commercial platform [27, 28]. Inaddition to the assembly of Au nanoparticles, the assembly ofAg nanoparticles onto smooth metal films using three-strandDNA assembly has been demonstrated for surface-enhancedRaman spectroscopic detection of DNA sequences [29].Optical methods focused on fluorescence blotting assayshave reached aM sensitivities [23], while methods employingenergy transfer detection of the three-strand assembly allownM pathogen DNA detection [20]. Despite these applicationsof multisequence DNA assembly in the literature, the use ofthree-strand assemblies for magnetic detection has only beensuggested and remains underutilized [30].
Sensing technologies based on magnetic transduction,whether Hall magnetometry or giant magnetoresistive(GMR), circumvent many of the limitations of classical sen-sor designs since they exhibit low sensitivity to the surround-ing biological matrix of samples, can be mass produced,and, if configured properly, can offer dynamic detectionin a microfabricated scalable platform [31, 32]. Magnetictransduction-based sensing technologies cover a wide rangeof methods including GMR sensors through the use of spinvalves [25, 33–37] or bead array counters (BARCs) [38, 39]and Hall-based sensors [40–45]. Already, examples of GMRdevices have demonstrated detection of matrix-insensitiveprotein assays at the fM level using a magnetic transduction-based device [37] and aM level by adding additionalmagnetic beads to amplify the signal [46]. The use of Hallmagnetometry for DNA biosensing could represent the nextgeneration for magnetic transduction-based devices, since aHall junction is a 4-point probe device (current, voltage),scalable down to the nanoscale, can be mass produced usingstandard lithographic and fabrication methods, displays alinear response through a wide range of magnetic fields [47]
with minimal influence of temperature [48] (which varies tooptimize DNA annealing), and can operate at high frequencyallowing for phase-sensitive detection of the transient fieldsassociated with SPM nanoscale beads. Hall biosensors maythus offer a useful alternative to exclusively fluorescence-based microarray technologies.
2. Materials and Methods
2.1. Substrate Fabrication and Passivation. The 1 µm2 Halljunction is fabricated into the surface of an epitaxially grownheterostructure consisting of a GaAs substrate containing anInAs quantum well core, and SiO2 (60 nm) was sputteredonto the device followed by a layer of Ti (5 nm) anddeposition of 3 µm gold pads (20 nm thick) directly overthe protected Hall junction. Registry of the gold pad wasaccomplished by photolithography using alignment markersin the photomask. Mimic microarrays (3 µm diameter circlesand 2 µm × 4 µm rectangular gold patterns) were fabricatedonto the 〈100〉 face of a single-crystal GaAs wafer. Thesubstrates were cleaned prior to use for 1 min at low powerin oxygen plasma (Harrick Plasma PDC-001). The substrateswere rinsed with absolute ethanol for 1 min and driedunder a constant stream of nitrogen gas, and the SiO2 sur-face was passivated by 2-[methoxy(polyethyleneoxy)propyl]-trimethoxysilane (Gelest) [49].
2.2. DNA Immobilization and Hybridization. Synthetic DNAoligonucleotides were commercially synthesized (MidlandCertified Reagent Company). The two-strand DNA systemconsisted of a 5′ disulfide modified complementary receptorsequence 5′-/RSSR/-GAC TAC TCT ATC GGC AGC TAAGAT TGT CAC AGT CG-3′, a 5′ disulfide modified noncom-plementary receptor sequence 5′-/RSSR/-CGA CTG TGACAA TCT TAG CTG CCG ATA GAG TAG TC-3′, and a5′ modified biotinylated probe sequence with an internalfluorescein dT 5′-/BIOTIN/-CGA C-/iFLUORdT/-G TGACAA TCT TAG CTG CCG ATA GAG TAG TC-3′. The three-strand DNA system consisted of a probe sequence 5′-TCATTC ACA CAC -/iFLUORdT/-CG/3BIOTIN/-3′ labeled withan internal fluorescein dT and biotin, receptor sequence 5′-/RSSR/GTC TTG TCT CCT GTC AGC TA-3′ with a disulfidemodifier, a 35-base unmodified target sequence 5′-CGAGTG TGT GAA TGA TAG CTG ACA GGA GAC AAG AC-3′, and a 35-base unmodified nontarget control sequence 5′-GTC TAA GAG TGT CCT GGC TAT GAT CCG TGA GTATG-3′. The lyophilized DNA was buffer-exchanged using anNAP-V size exclusion column (GE Healthcare) equilibratedwith 20 mM sodium phosphate buffer, 50 mM NaCl pH 7.0.
The receptor DNA (disulfide not previously reduced)was incubated on top of the device in the form of a50 µL droplet at a DNA concentration of 9 µM for 6 hrs inan enclosed incubation chamber. The incubation chamberalso contains a supersaturated NaCl solution to maintainconstant humidity within the enclosed chamber. The devicewas immersed in 5 mL of 18.2 MΩ-cm nanopure H2O(Barnstead) containing 0.1% Tween-20 (v/v), twice in 5 mLof 18.2 MΩ-cm nanopure H2O to rinse and remove unbound

Journal of Biomedicine and Biotechnology 3
DNA, and dried under a constant stream of nitrogen gas.The reporter DNA was bioconjugated to the SPM nanobead(350 nm mean size, Bangs Laboratories) through a biotin-streptavidin linkage at 30◦C for 1 hr. The DNA-nanobeadconjugate was purified away from free DNA using magneticseparation and washing the sample 5 times with 20 mMsodium phosphate buffer, 300 mM NaCl, pH 7.0. The three-strand DNA strategy included a preconjugation step of thetarget DNA to the probe DNA-SPM conjugate at 80◦C andwas allowed to slowly cool to room temperature over 1 hr.Unbound nucleic acid was removed by magnetic separation.The hybridization assay was carried out by incubating a25 µL droplet of target biotinylated DNA (7 µM) boundto streptavidin-coated SPM beads for 2 hrs in an enclosedincubation chamber containing a super saturated NaClsolution. The device was washed once in 5 mL of 20 mMsodium phosphate buffer with 300 mM NaCl at pH 7.0containing 0.1% Tween-20 (v/v), twice in 5 mL of 20 mMsodium phosphate buffer with 300 mM NaCl at pH 7.0,stored in 20 mM phosphate buffer with 300 mM NaCl at pH7.0, and protected from ambient light.
2.3. Microscopy. Fluorescence microscopy was carried out onan inverted Nikon TE2000-E2 Eclipse microscope (NikonInstruments Inc.) equipped with a Nikon CFI Plan Apoc-hromat 40x objective (NA 0.95, 0.14 mm WD). Wide-field imaging of the substrates utilized an EXFO E-Citeillumination source and a FITC filter (Chroma, ex: 480/30,DCLP: 505, em: 535/40). Images were acquired on a Pho-tometrics Coolsnap HQ2 CCD camera. Bright-field overlaysutilized differential interference contrast (DIC) to observethe differences in the index of refraction of the samples.The data were analyzed using Nikon NIS Elements software.Scanning electron microscopy (SEM) was carried out on aFEI Nova 400 Nano SEM and utilizing a through-the-lens(TLD) detector. The SEM images were acquired using a 32-scan average.
2.4. Hall Measurement. The detection of preimmobilizedSPM beads was achieved by employing an ac phase-sensitivetechnique as previously reported [45]. The Hall device wasbiased with a dc current I = 50µA, and the beads weremagnetized with an ac magnetic field; lock-in detection ofthe ac Hall voltage occurred at the magnetic field frequency.The application of an additional dc magnetic field reducedthe SPM bead susceptibility and thus the ac magnetic fieldgenerated by the beads. This produced a drop in the ac Hallvoltage signal indicating the presence of the beads.
3. Results and Discussion
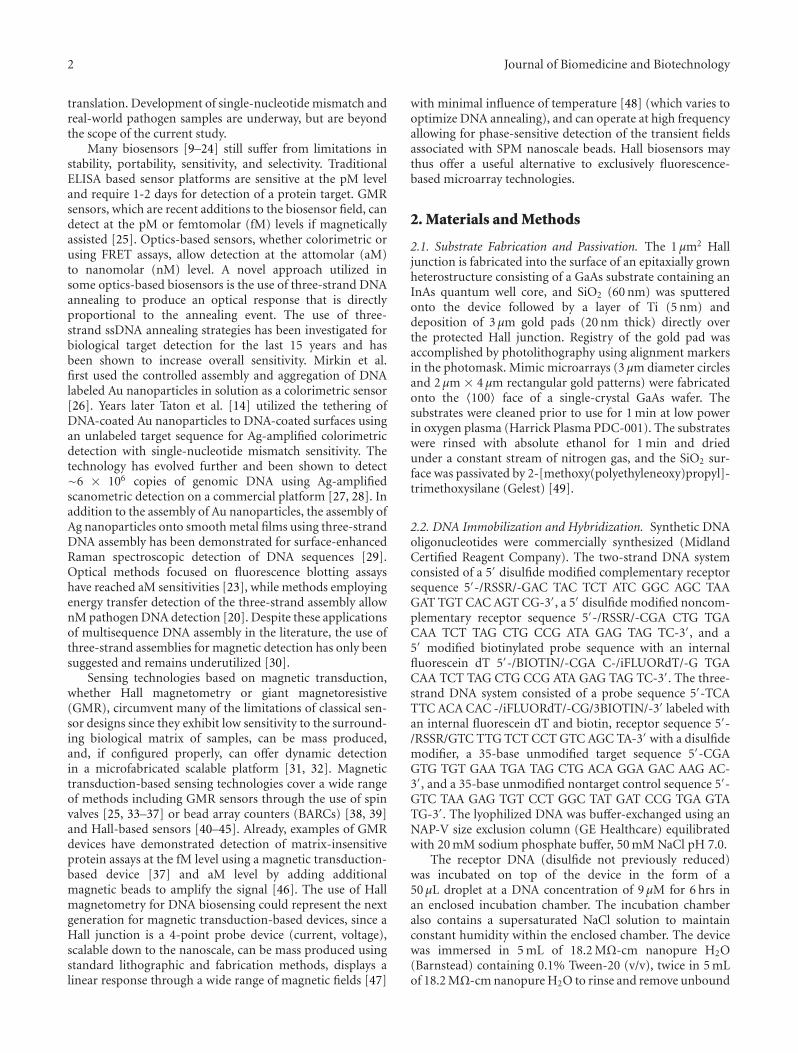
3.1. Design. A schematic of the Hall magnetometer-basedbiosensor and detection strategy used for detection of asingle-stranded DNA (ssDNA) target sequence by three-strand annealing over the surface of a 1 µm2 Hall junctionis shown in Figure 1. The biosensor platform is assembledin parallel steps to limit the processing time for target
III
I
II
S S
S
SS
S
SSSSS
IV
Probe
Receptor
Target
y
z
x
Figure 1: Generalized schematic for the detection of label-freetarget DNA using Hall magnetometry. The label-free target DNA(black) is detected by immobilization at the Hall device via comple-mentary base pairing with receptor DNA (blue) preassembled onthe Hall device surface to additional complementary probe DNA(red) with an internal fluorescent marker preconjugated to thesurface of a magnetic nanobead resulting in a detectable Hall signal.Nanobead is not drawn to scale.
detection. This parallels work by others to detect three-strand annealing using different sensor modalities, SERS [29]and colorimetry-(gold plasmon shift) based technologies,by simultaneously annealing the target, sensor, and probesequences [14, 26–28]. Our platform is composed of six1 µm2 Hall junctions (Figure 2(a)) etched into an epitaxiallygrown, vertically integrated InAs quantum well heterostruc-ture isolated from the surrounding environment by a 60 nmoverlayer of silicon dioxide, as previously described [42, 44].The six available Hall junctions are divided into a set of threebioactive sensors (i, ii, and iii) and three nonactive controls(ic, iic, and iiic). The bioactive sensors are generated viapatterning 3 µm gold bonding pads evaporated onto the SiO2
layer only over the bioactive junctions (i, ii, iii). The bondingpads provide a site for self-assembly of the receptor single-strand DNA onto the surface of the Hall junction sensorwithout modifying the properties of the InAs quantum wellheterostructures. The nonactive controls do not have thegold bonding pad. To minimize biofouling of the deviceby the biological constituents in the sample via nonspecificinteractions, the exposed SiO2 surface is selectively modifiedby a polyethylene-glycol-conjugated silane moiety [49]. Thebioactive junctions are modified by self-assembly of the

4 Journal of Biomedicine and Biotechnology
(a)
(i)
(ic)
(ii)
(iic)
(iii)
(iiic)
(iii)
(b)
5
(i)
(ii)
(iii)
(iiic)
4
3
2
1
0
0 50 100 150
Time (s)
Vol
tage
(µV
)
(c)
Vol
tage
(µV
)
0.4
0.2
0
0 0.5 1 1.5y-distance (µm)
(d)
Figure 2: (a) Optical microscopy characterization (wide-field fluorescence and DIC overlay) of three-strand DNA assembly is shown by thepresence of green fluorescence indicating the presence of probe DNA. (b) SEM was used to evaluate the location and to quantify the numberof nanobeads contributing to the Hall response for (iii), where the grey box designates the location of the underlying Hall junction. (c) Hallresponses for three active junctions (i, ii, iii) and a single control junction (iiic) are plotted as Hall voltage offset versus time; the presenceof nanobeads over the active Hall junctions results in a drop in Hall voltage when a dc magnetic field is applied. (d) The theoretical devicesignal stemming from a single 344 nm SPM bead is shown to the right as a function of position over the Hall junction further illustrating thelocal sensitivity of Hall magnetometry. Scale bars = 2 µm in (a) and (b).
receptor ssDNA (blue in Figure 1) onto the gold pads byexposure of a solution of the receptor to the Hall junctionplatform (Figure 1(I)) and subsequent washing to removeunbound DNA. The fluorescein-labeled probe ssDNAsequence (red in Figure 1) is preappended to the SPM beadplatform via streptavidin-biotin conjugation (Figure 1-(II)).
Prior to the detection of the target DNA sequence (blackin Figure 1), the probe strand and the target strand wereprehybridized (Figure 1-(III)). The detection of the targetDNA was then accomplished by annealing the SPM bead-probe-target complex with the receptor sequence (blue)preassembled at the surface of the Hall device platformat room temperature (Figure 1-(IV)). The assembly of thethree-strand sequence requires 3 hrs, which is equivalent tostandard FRET, plasmonic, GMR and SERS-based detectionscenarios, but far faster than optical chip techniques thatcan require 16–24 hrs to achieve hybridization. Although thesimultaneous addition of all three ssDNA components isexperimentally feasible, stepwise assembly allowed the addedbenefit that the observed signal is not artificially enhancedby nonspecific, non-DNA bound SPM beads. All unbound
nucleic acid species and nucleic acid-labeled SPM beads areremoved by magnetic separation prior to final three-strandDNA assembly and washed prior to Hall detection. Thestrategy allows a specific binding event at the electricallyisolated gold pad to induce a direct voltage response inthe device without altering the device properties directly, aswould be observed in SPR-based devices. The sequential,parallel assembly strategy (Figure 1(I)–(IV)) allows conve-nient concentration amplification for the target ssDNA fromextraneous DNA fragments.
3.2. Detection. In Figure 2 the detection of the 35-basetarget on the dual optical/Hall device senor is shown for a25 µL droplet containing 7 µM DNA. The specificity of theassembly of the three-strand DNA complex onto the goldpad (grey circle) over the Hall junction is clearly observedin the wide-field fluorescence overlaid with differentialinterference contrast (DIC) micrograph (Figure 2(a)). Theobserved green photoluminescence in Figure 2(a) arises fromthe fluorescein label on the probe strand and requires thethree-strand annealing process to occur in order for the

Journal of Biomedicine and Biotechnology 5
probe to be optically detectable. The lack of nonspecificbinding of the probe to regions outside of the gold padregion confirms the specificity of the three-strand assemblyprotocol. The specificity of the assembly on the gold padsis further con-firmed by comparing the optical micrograph(Figure 2(a)) and a scanning electron micrograph of thesame region (Figure 2(b); see Figure S1 in SupplementaryMaterial available online at doi:10.1155/2012/492730). Scan-ning election microscopy (SEM) imaging of junction (iii)indicates that ∼73 beads are present on the 3 µm (diameter)gold pad. Inspection of the DIC image of junction (iii)(Figure 2(a)) reveals the registry between the underlying Halljunction in the SEM image (Figure 2(b), grey box), and thegold pad on the surface of the Hall magnetometer results inonly ∼12 na-nobeads being positioned directly or partiallyover the active area of the Hall junction.
For detection of DNA annealing, the presence of the SPMbead is measured as a change in voltage by the use of both acand dc magnetic fields. The use of both ac and dc fields allowsfor a binding event signal to be cleanly isolated by usinglock-in detection. In the absence of the external dc field, nosignal is detectable in the Hall junction. The ac magneticfield of 3.76 mT at 93 Hz is used to induce magnetization ofthe SPM nanobeads. The 70.6 mT dc magnetic field (NdFeB)is applied perpendicular to the Hall junction to shift themagnetization of the nanobeads to lower susceptibility asgiven by the expression ΔVH ∝ ΔM, where ΔM is the changein the ac magnetization before and after the dc field wasapplied. The Hall sensor was operated in constant currentmode with an applied dc current of 50 µA.
The voltage responses to binding of the target sequencewith the preappended probe and 350 nm magnetic beadsto receptor strands on the three active junctions (i, ii, iii),plus one control junction without any beads (iiic) are shownin Figure 2(c). The voltage response for all junctions andcontrols are shown in Figure S1. The voltage across thecontrol junction (iiic) is 0± 0.03 µV. The successful assemblyof ssDNA over the active Hall junctions results in a sharpdrop in the measured Hall voltage for all three active sensorelements when a dc field was applied. The Hall voltagemeasurements are 0.79 µV (signal/noise (S/N) 40), 0.55 µV(S/N 28), and 0.78 µV (S/N 39), for (i, ii, iii), respectively.In Figure 2, the observed step function is generated by theapplication and removal of the external dc magnetic field inthe presence of the small ac field to allow lock-in detection.The S/N was determined by averaging the change in signalwhen the dc field was applied and dividing it by the averagestandard deviation from zero measured in the absence of theapplied dc field. The standard deviation in measured signalsfor the active junctions is 0 ± 0.02 µV as shown in Figure S1.
To analyze the voltage change per binding event, thenumber of beads per Hall junction must be assessed. InFigure 2(a) and Figure S1, the SEM micrographs indicatethe presence of 41 beads on junction (i), 68 beads onjunction (ii), and 73 beads on junction (iii). In Figure 2(c),the voltage response for the three pads is similar regardlessof the number of beads bound at the center of the Halljunction (Figure 2(c)). The largest expected voltage changein the Hall magnetometer will occur for beads directly
over the Hall junction, falling rapidly for beads positioned>0.5 µm from the device center (Figure 2(d)). Directly overthe Hall junction (shaded region Figure 2(b)), junction(i) has 8 beads, junction (ii) has 11 beads, and junction(iii) has 12 beads. Calculation of the predicted voltageresponse as a function of the distance of the bead from thecenter of the Hall junction is shown in Figure 2(d). For asingle 350 nm magnetic bead approximately 272 nm fromthe Hall device, a voltage response of 0.4 µV per bead isexpected. The experimental value of ∼0.6–0.8 µV measuredin Figure 2(c) following DNA annealing of the target andprobe indicates that more than one bead but not all ofthe bound beads contribute to the measured Hall voltage.For junction (iii), the result suggests the measured voltageis likely dominated by the 12 beads directly over the Halljunction (only beads contained within the grey box inFigure 2(b)). Due to the large size dispersion and subsequentlarge magnetic content variability in the commerciallyobtained SPM beads utilized in this study, the calculationof the number of beads contributing to the measured signalcannot be obtained if more than one bead lies directlyover the underlying Hall junction. Based on the theoreticalvoltage (Figure 2(d)) and the observed voltage in responseto DNA annealing (Figure 2(c)), a single bead should bedetectable.
3.3. Single-Bead Detection. Although magnetic transductiondevices are remarkably sensitive with detection of a singlebead (<500 nm) reported for an antibody-antigen sandwich-assay-based assembly of a magnetic bead on a micron-sizedHall device [44], and the multiple-bead detection by GMRdevices [36], the report of three-stand DNA target detectionat the single-magnetic-bead level by a Hall device has notbeen reported to date. Single-bead detection was observedfor a 35-base pair DNA annealing event onto a Hall device,as shown in Figure 3. The Hall voltage response (Figure 3(b))and corresponding SEM image (Figure 3(c)) for the two-strand annealing event (Figure 3(a)) indicate a voltage of 0.34± 0.03 µV (0 ± 0.04 µV for control junction) for the twoobserved beads near the Hall junction. The two-dimensional(2D) theoretical Hall response has recently been modeledwith respect to SPM bead position over the Hall junction[50]. The theoretical response for a single bead over theHall junction in Figure 3 is shown in Figure 3(d), wherered indicates a SPM particle positioned at the center of thedevice, while blue is a SPM outside the detectable range of theHall junction. The measured voltage in Figure 3 is consistentwith the theoretical value for a single bead, and therefore itis believed that the measured Hall voltage reflects only oneof the two beads, since only one of the beads lies withinthe red zone for the theoretical plot (arrow in Figure 3(c)).Improvement of the signal-to-noise ratio can be achieved byoperating the Hall device at higher frequencies; however, it isimportant to note that the sensitivity of the device can clearlydistinguish a single-bead binding event from the noise floorby an order of magnitude at the frequency utilized in thisstudy.

6 Journal of Biomedicine and Biotechnology
y
z
x SS
SSS
(a)2
1.5
1
0.5
0
0 50 100 150
(iv)
(ivc)Vol
tage
(µV
)
Time (s)
(b)
(iv)(ivc)
(c)
1
0.8
0.6
0.4
0.2
00 0.2 0.4 0.6 0.8 1
0.396
0.352
0.302
0.252
0.202
0.152
0.102
0.052
0.002
−0.048
x-distance (µm)
z-di
stan
ce(µ
m)
Vol
tage
(µV
)
(d)
Figure 3: Sequence-specific two-strand DNA assembly and subsequent Hall detection of a single 344 nm nanobead. (a) Pictorialrepresentation of two-strand DNA assembly, where the probe DNA (red) is complementary to the receptor DNA (blue). (b) Hall responsedata for the active (iv) and control Hall junction (ivc) plotted as Hall voltage versus time, where the drop in Hall voltage corresponds to thepresence of a magnetic nanobead. (c) SEM was used to confirm that only one nanobead contributed significantly to the signal measuredin (iv); scale bar = 2 µm. (d) The theoretical Hall device cross-sectional response for a single 344 nm SPM bead as a function of positionfrom the center of the junction, where red indicates strongest change in voltage, aqua indicates weakest voltage change, and blue indicates anegative voltage readout. The noise floor for the device is outlined in black for reference.
3.4. Selectivity and Detection Limits. The limit of detectionfor DNA in a real sample will reflect the length and sequenceof target DNA (both of which influence annealing tempera-ture), and the concentration of DNA, and the concentrationof DNA present in a milieu of nontarget DNA. Sincesensitivity will be influenced by bead size and the area of thetransduction platform, the concentration limit of detectionfor target DNA was assessed using optical microscopy
analysis of the binding of the target DNA onto 2 × 4 µm goldpatterns that serve as mimics of the GaAs Hall devices.
The thermodynamic stability of the three-strand DNAapproach has been used for several sensor approaches,including optical, SERS, and colorimetric platforms. In thecurrent study the stability of the three strands was experi-mentally verified using a gel shift assay (Figure S3). In Figures4(a) and 4(b), binding of the 35-base pair three-strand DNA

Journal of Biomedicine and Biotechnology 7
2
(a)
(b)
(c)
1.6
1.2
0.8
0.4
00 100 200 300 400 500
Pixel number
Inte
nsi
ty
×104
Figure 4: Three-strand DNA assembly on a mimic array (patterned on a GaAs substrate) for (a) complementary target only and (c) 10 ppmtarget in nontarget DNA. The inlays in the lower left of (a) and (c) are an enlarged portion of (a) and (c), respectively. Scale bars = 50 µm.(b) A line scan of the wide-field fluorescence microscopy image in (a) showing fluorescein-labeled probe DNA (green) and DIC (black)intensity correlates fluorescence intensity with nanobeads located primarily over gold pads, where the black arrows signify the presence of asmall number of nonspecifically bound nanobeads.
assembly onto a mimic was assessed by the fluorescentlylabeled probe sequence conjugated to the 350 nm magneticbeads. Inspection of a line scan for the fluorescence intensityfrom the probe sequence shows good correlation with theHall mimic patterns (Figure 4(b)). The signal fluctuationsdo not indicate single-bead response as the fluoresceinintensity depends on the particle size, number of DNA probestrands, labeling efficiency, and focal plane of the microscopyimage. Little intensity is observed over the control PEGy-lated regions surrounding gold pads (identified with blackarrows). The discrimination level is >10,000 counts abovebackground for selective target DNA binding at the gold padsin buffered solution (Figure 4(a) and Figure S2).
An important measure of device performance is the abil-ity to discriminate target ssDNA in the presence of extrane-ous (noncomplementary) sequences in solution, particularlyat low levels of target DNA. The ability to discriminate targetDNA in the presence of nontarget sequences was analyzedby optical microscopy on 3 µm patterned GaAs Hall devicemimics in a buffered solution. Since the sensitivity of thedevice was demonstrated to achieve a limit of detection thatis consistent with a single bead (0.34 µV versus 0 ± 0.04 µVnoise floor), the choice of an optical mimic to only probefidelity over a Hall junction allows analysis of the limit ofdetection for the three-strand annealing process. Fluores-cently tagged nanobeads were selectively annealed at gold
pads at a concentration of 364 pM target DNA in a solutioncontaining 36 µM nontarget DNA, which corresponds to lessthan two complementary target DNA sequences per 350 nmnanobead (Figure 4(c)). The measurements equate to detec-tion at the 10 ppm level target. For comparison, a mimicarray in which the receptor strand was noncomplementary tothe target strand clearly demonstrated that nonspecific DNAbinding is not observed (Figure S2). Although we have notyet tested cellular extracts of nucleic acids, the sensitivity andselectivity of the device—detection of a single SPM bead at aHall junction, corresponding to 1-2 target DNA molecules—clearly demonstrate for the first time that this technologyholds substantial promise for biomoleculesensing.
4. Conclusion
The device strategy utilizing three-strand DNA assemblyon a Hall magnetometer provides a detection platform withhigh specificity, low limit of detection (single SPM bead,and small numbers of target DNA molecules), and very highfidelity. Sensitivity of the Hall biosensor is attributable to theproperties of the Hall junction and is dependent on the sizeof the Hall junction, the frequency of the ac field oscillation,the moment of the SPM bead, and the distance of the SPMbead from the Hall junction. In the nanotechnology device,

8 Journal of Biomedicine and Biotechnology
the use of a SPM nanobead does not hinder the specificityof Watson-Crick base pairing for the target nucleic acid asevidenced by sequence-specific DNA hybridization (Figure 2and Figure S2). At the detection frequency employed in thisstudy, the 3D plot in Figure 3(d) indicates the possibilityof detecting an SPM bead at distances approaching 0.9 µmoff the surface of the device when the SPM bead is locateddirectly over the center of the Hall junction, which mayallow much longer sequences of DNA to be detected.Higher frequency measurements will decrease the noise leveland therefore increase the sensitivity of the device to themagnetic bead position.
We have demonstrated the successful use of Hall mag-netometry to detect a 35-base target DNA at the single-magnetic-bead level that could be applied for POC diag-nostics. Reduction of the dimension of the gold pad andimproved registry, as well as bead homogeneity could be usedto further improve upon the overall device performance.Extrapolation of the device to a microarray of selectivelylabeled Hall sensors could represent a transformative biosen-sor platform. The parallel Hall device strategy could allowmultiple DNA sequences to be simultaneously detected ina biological matrix since each magnetic bead and probestrand can be bar-coded by dye photoluminescence [23] andSPM bead size since the response will be proportional to theSPM moment. Alternatively, the receptor DNA on the Halljunction can be selectively dip-penned for multisequenceanalysis [51]. By eliminating concerns associated with sampleamplification [3] such an array would allow screening fornucleic acid targets of biomedical interest such as pathogensor disease-related mutations [52–56].
Acknowledgments
Support was provided by NIH grant GM079592. Theauthors thank Kimberly A. Riddle and Thomas J. Fellersin the Florida State University’s Biological Science ImagingResource (BSIR) for extensive SEM characterization and EricJ. Lochner in the Center of Materials Research and Technol-ogy (MARTECH) at FSU for material characterization.
References
[1] D. V. Lim, J. M. Simpson, E. A. Kearns, and M. F. Kramer,“Current and developing technologies for monitoring agentsof bioterrorism and biowarfare,” Clinical MicrobiologyReviews, vol. 18, no. 4, pp. 583–607, 2005.
[2] D. Ivnitski, D. J. O’Neil, A. Gattuso, R. Schlicht, M. Calidonna,and R. Fisher, “Nucleic acid approaches for detection andidentification of biological warfare and infectious diseaseagents,” BioTechniques, vol. 35, no. 4, pp. 862–869, 2003.
[3] J. Ince and A. McNally, “Development of rapid, automateddiagnostics for infectious disease: advances and challenges,”Expert Review of Medical Devices, vol. 6, no. 6, pp. 641–651,2009.
[4] D. A. Giljohann and C. A. Mirkin, “Drivers of biodiagnosticdevelopment,” Nature, vol. 462, no. 7272, pp. 461–464, 2009.
[5] O. Lazcka, F. J. D. Campo, and F. X. Munoz, “Pathogen detec-tion: a perspective of traditional methods and biosensors,”Biosensors & Bioelectronics, vol. 22, no. 7, pp. 1205–1217, 2007.
[6] J. Wang, “Electrochemical biosensors: towards point-of-carecancer diagnostics,” Biosensors & Bioelectronics, vol. 21, no. 10,pp. 1887–1892, 2006.
[7] T. M. Herne and M. J. Tarlov, “Characterization of DNAprobes immobilized on gold surfaces,” Journal of the AmericanChemical Society, vol. 119, no. 38, pp. 8916–8920, 1997.
[8] T. Wink, S. J. Van Zuilen, A. Bult, and W. P. Van Bennekom,“Self-assembled monolayers for biosensors,” Analyst, vol. 122,no. 4, pp. R43–R50, 1997.
[9] G. Festag, A. Steinbruck, A. Wolff, A. Csaki, R. Moller, andW. Fritzsche, “Optimization of gold nanoparticle-based DNAdetection for microarrays,” Journal of Fluorescence, vol. 15, no.2, pp. 161–170, 2005.
[10] X. D. Song, J. Shi, and B. Swanson, “Flow cytometry-basedbiosensor for detection of multivalent proteins,” AnalyticalBiochemistry, vol. 284, no. 1, pp. 35–41, 2000.
[11] L. Shi, L. H. Reid, W. D. Jones et al., “The MicroArray QualityControl (MAQC) project shows inter- and intraplatformreproducibility of gene expression measurements,” NatureBiotechnology, vol. 24, no. 9, pp. 1151–1161, 2006.
[12] Y. W. C. Cao, R. Jin, and C. A. Mirkin, “Nanoparticleswith Raman spectroscopic fingerprints for DNA and RNAdetection,” Science, vol. 297, no. 5586, pp. 1536–1540, 2002.
[13] C. T. Campbell and G. Kim, “SPR microscopy and itsapplications to high-throughput analyses of biomolecularbinding events and their kinetics,” Biomaterials, vol. 28, no.15, pp. 2380–2392, 2007.
[14] T. A. Taton, C. A. Mirkin, and R. L. Letsinger, “ScanometricDNA array detection with nanoparticle probes,” Science, vol.289, no. 5485, pp. 1757–1760, 2000.
[15] B. Dubertret, M. Calame, and A. J. Libchaber, “Single-mismatch detection using gold-quenched fluorescent oligonu-cleotid,” Nature Biotechnology, vol. 19, no. 4, pp. 365–370,2001.
[16] W. R. Algar, M. Massey, and U. J. Krull, “The application ofquantum dots, gold nanoparticles and molecular switches tooptical nucleic-acid diagnostics,” TrAC Trends in AnalyticalChemistry, vol. 28, no. 3, pp. 292–306, 2009.
[17] S. Husale, H. H. J. Persson, and O. Sahin, “DNA nanomechan-ics allows direct digital detection of complementary DNA andmicroRNA targets,” Nature, vol. 462, no. 7276, pp. 1075–1078,2009.
[18] N. G. Clack, K. Salaita, and J. T. Groves, “Electrostatic readoutof DNA microarrays with charged microspheres,” NatureBiotechnology, vol. 26, no. 7, pp. 825–830, 2008.
[19] D. S. Johnson, W. Li, D. B. Gordon et al., “Systematicevaluation of variability in ChIP-chip experiments usingpredefined DNA targets,” Genome Research, vol. 18, no. 3, pp.393–403, 2008.
[20] W. R. Algar and U. J. Krull, “Toward a multiplexed solid-phase nucleic acid hybridization assay using quantum dots asdonors in fluorescence resonance energy transfer,” AnalyticalChemistry, vol. 81, no. 10, pp. 4113–4120, 2009.
[21] B. S. Gaylord, A. J. Heeger, and G. C. Bazan, “DNA detectionusing water-soluble conjugated polymers and peptide nucleicacid probes,” Proceedings of the National Academy of Sciences ofthe United States of America, vol. 99, no. 17, pp. 10954–10957,2002.
[22] J. Zhang, B. P. Ting, N. R. Jana, Z. Gao, and J. Y. Ying,“Ultrasensitive electrochemical DNA biosensors based on thedetection of a highly characteristic solid-state process,” Small,vol. 5, no. 12, pp. 1414–1417, 2009.

Journal of Biomedicine and Biotechnology 9
[23] Y. Li, Y. T. H. Cu, and D. Luo, “Multiplexed detection ofpathogen DNA with DNA-based fluorescence nanobarcodes,”Nature Biotechnology, vol. 23, no. 7, pp. 885–889, 2005.
[24] W. J. Qin, O. S. Yim, P. S. Lai, and L. Y. L. Yung, “Dimeric goldnanoparticle assembly for detection and discrimination ofsingle nucleotide mutation in Duchenne muscular dystrophy,”Biosensors & Bioelectronics, vol. 25, no. 9, pp. 2021–2025, 2010.
[25] V. C. Martins, F. A. Cardoso, J. Germano et al., “Femtomolarlimit of detection with a magnetoresistive biochip,” Biosensors& Bioelectronics, vol. 24, no. 8, pp. 2690–2695, 2009.
[26] C. A. Mirkin, R. L. Letsinger, R. C. Mucic, and J. J. Storhoff, “ADNA-based method for rationally assembling nanoparticlesinto macroscopic materials,” Nature, vol. 382, no. 6592, pp.607–609, 1996.
[27] J. J. Storhoff, S. S. Marla, P. Bao et al., “Gold nanoparticle-based detection of genomic DNA targets on microarrays usinga novel optical detection system,” Biosensors & Bioelectronics,vol. 19, no. 8, pp. 875–883, 2004.
[28] J. J. Storhoff, A. D. Lucas, V. Garimella, Y. P. Bao, and U.R. Muller, “Homogeneous detection of unamplified genomicDNA sequences based on colorimetric scatter of gold nanopar-ticle probes,” Nature Biotechnology, vol. 22, no. 7, pp. 883–887,2004.
[29] G. Braun, S. J. Lee, M. Dante, T. Q. Nguyen, M. Moskovits, andN. Reich, “Surface-enhanced raman spectroscopy for DNAdetection by nanoparticle assembly onto smooth metal films,”Journal of the American Chemical Society, vol. 129, no. 20, pp.6378–6379, 2007.
[30] S. P. Mulvaney, C. L. Cole, M. D. Kniller et al., “Rapid, femto-molar bioassays in complex matrices combining microfluidicsand magnetoelectronics,” Biosensors & Bioelectronics, vol. 23,no. 2, pp. 191–200, 2007.
[31] D. L. Arruda, W. C. Wilson, C. Nguyen et al., “Microelectricalsensors as emerging platforms for protein biomarker detectionin point-of-care diagnostics,” Expert Review of MolecularDiagnostics, vol. 9, no. 7, pp. 749–755, 2009.
[32] J. Schotter, P. B. Kamp, A. Becker, A. Puhler, G. Reiss, andH. Bruckl, “Comparison of a prototype magnetoresistivebiosensor to standard fluorescent DNA detection,” Biosensors& Bioelectronics, vol. 19, no. 10, pp. 1149–1156, 2004.
[33] J. Germano, V. C. Martins, F. A. Cardoso et al., “A portableand autonomous magnetic detection platform for biosensing,”Sensors, vol. 9, no. 6, pp. 4119–4137, 2009.
[34] D. L. Graham, H. A. Ferreira, N. Feliciano, P. P. Freitas, L.A. Clarke, and M. D. Amaral, “Magnetic field-assisted DNAhybridisation and simultaneous detection using micron-sizedspin-valve sensors and magnetic nanoparticles,” Sensors andActuators B, vol. 107, no. 2, pp. 936–944, 2005.
[35] H. A. Ferreira, D. L. Graham, N. Feliciano, L. A. Clarke, M. D.Amaral, and P. P. Freitas, “Detection of cystic fibrosis relatedDNA targets using AC field focusing of magnetic labels andspin-valve sensors,” IEEE Transactions on Magnetics, vol. 41,no. 10, pp. 4140–4142, 2005.
[36] D. A. Hall, R. S. Gaster, T. Lin et al., “GMR biosensor arrays: asystem perspective,” Biosensors & Bioelectronics, vol. 25, no. 9,pp. 2051–2057, 2010.
[37] S. J. Osterfeld, H. Yu, R. S. Gaster et al., “Multiplex proteinassays based on real-time magnetic nanotag sensing,” Proceed-ings of the National Academy of Sciences of the United States ofAmerica, vol. 105, no. 52, pp. 20637–20640, 2008.
[38] D. R. Baselt, G. U. Lee, M. Natesan, S. W. Metzger, P. E.Sheehan, and R. J. Colton, “A biosensor based on magnetore-sistance technology,” Biosensors & Bioelectronics, vol. 13, no.7-8, pp. 731–739, 1998.
[39] R. L. Edelstein, C. R. Tamanaha, P. E. Sheehan et al., “TheBARC biosensor applied to the detection of biological warfareagents,” Biosensors & Bioelectronics, vol. 14, no. 10-11, pp. 805–813, 2000.
[40] Y. Li, P. Xiong, S. Von Molnar, S. Wirth, Y. Ohno, and H. Ohno,“Hall magnetometry on a single iron nanoparticle,” AppliedPhysics Letters, vol. 80, no. 24, pp. 4644–4646, 2002.
[41] A. Sandhu, Y. Kumagai, A. Lapicki, S. Sakamoto, M. Abe,and H. Handa, “High efficiency Hall effect micro-biosensorplatform for detection of magnetically labeled biomolecules,”Biosensors & Bioelectronics, vol. 22, no. 9-10, pp. 2115–2120,2007.
[42] G. Mihajlovic, P. Xiong, S. von Molnar et al., “Detection ofsingle magnetic bead for biological applications using an InAsquantum-well micro-Hall sensor,” Applied Physics Letters, vol.87, no. 11, Article ID 112502, 3 pages, 2005.
[43] G. Mihajlovic, P. Xiong, S. von Molnar, M. Field, and G.J. Sullivan, “InAs quantum well Hall devices for room-temperature detection of single magnetic biomolecular labels,”Journal of Applied Physics, vol. 102, no. 3, Article ID 034506, 9pages, 2007.
[44] P. Manandhar, K. S. Chen, K. Aledealat et al., “The detection ofspecific biomolecular interactions with micro-Hall magneticsensors,” Nanotechnology, vol. 20, no. 35, Article ID 355501,2009.
[45] P. A. Besse, G. Boero, M. Demierre, V. Pott, and R. Popovic,“Detection of a single magnetic microbead using a miniatur-ized silicon Hall sensor,” Applied Physics Letters, vol. 80, no. 22,Article ID 4199, 3 pages, 2002.
[46] R. S. Gaster, D. A. Hall, C. H. Nielsen et al., “Matrix-insensitiveprotein assays push the limits of biosensors in medicine,”Nature Medicine, vol. 15, no. 11, pp. 1327–1332, 2009.
[47] G. Mihajlovic and S. von Molnar, in Nanoscale MagneticMaterials and Applications, J. P. Liu, E. Fullerton, O. Gutfleisch,and D. J. Sellmyer, Eds., pp. 685–710, Springer, New York, NY,USA, 2009.
[48] M. Behet, J. Bekaert, J. De Boeck, and G. Borghs, “InAs/Al0.2Ga0.8Sb quantum well Hall effect sensors,” Sensors andActuators A, vol. 81, no. 1–3, pp. 13–17, 2000.
[49] B. Kannan, R. P. Kulkarni, and A. Majumdar, “DNA-basedprogrammed assembly of gold nanoparticles on lithographicpatterns with extraordinary specificity,” Nano Letters, vol. 4,no. 8, pp. 1521–1524, 2004.
[50] K. Aledealat, G. Mihajlovic, K. Chen et al., “Dynamic micro-hall detection of superparamagnetic beads in a microfluidicchannel,” Journal of Magnetism and Magnetic Materials, vol.322, no. 24, pp. L69–L72, 2010.
[51] L. M. Demers, D. S. Ginger, S. J. Park, Z. Li, S. W. Chung, andC. A. Mirkin, “Direct patterning of modified oligonucleotideson metals and insulators by dip-pen nanolithography,” Sci-ence, vol. 296, no. 5574, pp. 1836–1838, 2002.
[52] J. Kohler, Y. Chen, B. Brenner et al., “Familial hypertrophiccardiomyopathy mutations in troponin I (K183Δ, G203S,K206Q) enhance filament sliding,” Physiological Genomics, vol.14, pp. 117–128, 2003.
[53] M. S. Parmacek and R. J. Solaro, “Biology of the troponincomplex in cardiac myocytes,” Progress in CardiovascularDiseases, vol. 47, no. 3, pp. 159–176, 2004.
[54] B. Gafurov, S. Fredricksen, A. Cai, B. Brenner, P. B. Chase,and J. M. Chalovich, “The Δ14 mutation of human cardiactroponin T enhances ATPase activity and alters the cooperativebinding of S1-ADP to regulated actin,” Biochemistry, vol. 43,no. 48, pp. 15276–15285, 2004.

10 Journal of Biomedicine and Biotechnology
[55] F. Bai, A. Weis, A. K. Takeda, P. B. Chase, and M. Kawai,“Enhanced active cross-bridges during diastole: molecularpathogenesis of tropomyosin’s HCM mutations,” BiophysicalJournal, vol. 100, no. 4, pp. 1014–1023, 2011.
[56] M. C. Mathur, P. B. Chase, and J. M. Chalovich, “Severalcardiomyopathy causing mutations on tropomyosin eitherdestabilize the active state of actomyosin or alter the bind-ing properties of tropomyosin,” Biochemical and BiophysicalResearch Communications, vol. 406, no. 1, pp. 74–78, 2011.


![Electrostatic Contribution to the Binding Stability of ...web2.physics.fsu.edu/~zhou/reprints/pr89.pdfthe binding stability [Fig. 1(b)].7,16 Ionic strength is found to exert a strong](https://img.pdfslide.net/doc/110x75/5ec4ce93c620f72ddb6d3880/electrostatic-contribution-to-the-binding-stability-of-web2-zhoureprintspr89pdf.jpg)