Embed Size (px)
Citation preview
BNL-111866-2016-IR
C-A/AP/557 February 2016
Detectors for low energy electron cooling in RHIC F.S. Carlier
Collider-Accelerator Department Brookhaven National Laboratory
Upton, NY 11973
U.S. Department of Energy Office of Science, Office of Nuclear Physics
Notice: This document has been authorized by employees of Brookhaven Science Associates, LLC under Contract No. DE-SC0012704 with the U.S. Department of Energy. The United States Government retains a non- exclusive, paid-up, irrevocable, world-wide license to publish or reproduce the published form of this document, or allow others to do so, for United States Government purposes.
Detectors for Low EnergyElectron Cooling in RHICInternship Report
F.S. Carlier
Delf
tUn
iver
sity
ofTe
chno
logy
Contents
1 Introduction 2
2 Radiative Recombination in the Electron Cooler 32.1 Stripping rates . . . . . . . . . . . . . . . . . . . . . . . . . . . . . . . . . . . . . . . . 5
3 Radiative RecombinationMonitors 83.1 Schottky Spectra . . . . . . . . . . . . . . . . . . . . . . . . . . . . . . . . . . . . . . . 8
3.2 Excitation of Au78+ using Induced Tune Shift . . . . . . . . . . . . . . . . . . . . . . . 93.2.1 Beam Transfer Function . . . . . . . . . . . . . . . . . . . . . . . . . . . . . . . 93.2.2 Excitation using AC Dipole. . . . . . . . . . . . . . . . . . . . . . . . . . . . . . 10
3.3 Lattice with large dispersion & small β-function. . . . . . . . . . . . . . . . . . . . . . 113.3.1 Lattice for BLUE Beam . . . . . . . . . . . . . . . . . . . . . . . . . . . . . . . . 123.3.2 Lattice for YELLOW Beam . . . . . . . . . . . . . . . . . . . . . . . . . . . . . . 143.3.3 Detectors for Recombined Ions in the Arcs . . . . . . . . . . . . . . . . . . . . . 14
4 Alternatives to RecombinationMonitors 204.1 Direct detection of Electron Cooling with Schottky System . . . . . . . . . . . . . . . . 204.2 Recombination of Deuteron. . . . . . . . . . . . . . . . . . . . . . . . . . . . . . . . . 20
5 Conclusions 23
A Appendix A 25
B Appendix B 27
Bibliography 31
i

Contents 1
The studies presented in this chapter were collaborative efforts. Many people contributed to theresults presented. Notable acknowledgements should go to Wolfram Fischer, Mike Blaskiewicz,
Alexei Fedotov, Peter Thieberger, Guillaume Robert-Demolaize, Michiko Minty, Christoph Montagand Angelika Drees.

1Introduction
Low energy operation of RHIC is of particular interest to study the location of a possible criticalpoint in the QCD phase diagram [1–4]. The performance of RHIC at energies equal to or lower than10 GV/nucleon is limited by nonlinearities, Intra-Beam Scattering (IBS) processes and space-chargeeffects. To successfully address the luminosity and ion store lifetime limitations imposed by IBS themethod of electron cooling has been envisaged. During electron cooling processes electrons areinjected along with the ion beam at the nominal ion bunch velocities. The velocity spread of theion beam is reduced in all planes through Coulomb interactions between the cold electron beamand the ion beam. The electron cooling system proposed for RHIC will be the first of its kind to usebunched beams for the delivery of the electron bunches, and will therefore be accompanied by thenecessary challenges. The designed electron cooler will be located in IP2. The electron bunches willbe accelerated by a linac before being injected along side the ion beams. Thirty consecutive electronbunches will be injected to overlap with a single ion bunch. They will first cool the yellow beambefore being extracted turned by 180-degrees and reinjected into the blue beam for cooling. As such,both the yellow and blue beams will be cooled by the same ion bunches. This will pose considerablechallenges to ensure proper electron beam quality to cool the second ion beam. Furthermore, noondulator will be used in the electron cooler so radiative recombination between the ions and theelectrons will occur.
Alignment of the ion and electron beams as well as the matching of the velocities between bothbunches is crucial to deliver the desired cooling efficiencies. The electron cooling force greatly de-creases for increasing relative energy deviation between both beams. However, direct measure-ments of the absolute energy of the electron beam will be challenging and are predicted to be ac-curate up to 10−3. Energy matching between the ion and electron bunches to achieve cooling istherefore not guaranteed. As such, various tuning and monitoring methods will need to be devel-opped to ensure the proper cooling conditions. Among those, monitoring of recombination ratesin the electron cooler is believed to be the most viable secondary cooling detector. Recombinationrates of ions with electrons are less sensitive to energy mismatch than cooling efficiencies, and cantherefore function as a easier to detect signal to tune the energies in the regime of large relative en-ergy deviation in which electron cooling is weak, dE
E > 0.1%. Monitoring of recombination rates inthe electron cooler will provide a good understanding of the beam overlap and energy mismatch ofthe ion and electron beams.
This study was performed as part of the Collider Accelerator Department (C-AD) at the BrookhavenNational Laboratory (BNL) on behalf of the Low Energy RHIC Electron Cooling (LEReC) project. Thereport addresses the production rates of recombined ions as well as the various methods availableto monitor recombination rates. Furthermore, it highlights the challenges left for the detection ofelectron cooling and proposes procedures for the commissioning of Low Energy RHIC operations.
2
2Radiative Recombination in the Electron
Cooler
A small portion of the fully stripped golds ions will recombine with electrons in the electron coolerthrough radiative recombination processes as given in Eq. (2.1). This will result in a population ofnon-fully stripped hydrogen-like gold ions that propagate in the accelerator [5][6][7][8]. Further re-combination to Au77+ or higher states is also possible, but occurs at such low probabilities that ithas been neglected for the purpose of this study.
Au79++e− → Au78++γ (2.1)
The recombination of gold ions with electrons is currently believed to be one of the most viablemethod to tune the energies of the ion and electron beams to approach cooling conditions whenthe velocities are mismatched. Recombination rates of fully stripped gold ions in electron buncheswill therefore be crucial to successfully adjust the electron beam energies. Estimates of recombi-nation rates are commonly calculated using the methods presented in [5]. Previous estimates forthe LEReC used the asymptotic formulae in [5] to approximate recombination rates as a functionof relative energy deviations [9][10]. This report presents a more thorough approach to estimatethe recombination rates and lifetimes as a function of the relative beam velocities of the ion andelectron bunch.
The capture cross section in the ion rest frame for an electron is given to good approximation by[5].
σ= A(hv0
E
)[ln
√hv0
E+0.1402+0.525
( E
hv0
) 13]
(2.2)
where E is the electron kinetic energy, h is the Planck constant, A = 43p
3πhe2
ε0m2e c3 = 2.11·10−22 and
hv0 = 13.6Z 2 eV is the ground state binding energy. The capture cross section may be expressed asa function of the transverse and longitudinal electron velocities by,
σ= 2Ahv0
me
1
(v2∥ + v2
⊥)
[12 ln
2hv0
me− 1
2 ln(v2∥ + v2
⊥)+γ1 +γ2
( me
2hv0
) 13
(v2∥ + v2
⊥)13
](2.3)
where me is the electron mass, v⊥ and v∥ are the particle velocities perpendicular and paralellelto the bunch velocity in the ion rest frame and γ1 = 0.1402 and γ2 = 0.525 are constants. The recom-bination rate coefficient αr is obtained by integration over the velocity distributions and the crosssection.
3
4 2. Radiative Recombination in the Electron Cooler
Parameter valueγ 4.1δpp 5 ·10−4
θ⊥ 150µr adne f f 3.22 ·1012 m−3
η 18/3833 = 0.004696
Table 2.1: Beam parameters used for calculations of recombination rates.
αr (vr el ) =∫σ(v)v fe (ve , vr el ) fi (vi , vr el )d3v (2.4)
where fe (ve , vr el ) and fi (vi , vr el ) are the Maxwellian velocity distributions of respectively theelectron- and the ion bunch. Both distributions are dependent on the relative velocities betweenthe ion and electron bunches (vr el ). The full derivations of the integrals are presented in AppendixA. The beam lifetime as a result of the recombination process in the cooling section is obtainedfrom,
τ= γ2
ne f f αrη(2.5)
where η = leC , the fraction of the accelerator length occupied by the electron cooler, and where
effective electron density is given by,
ne f f =Ne
(2π)32σ2
e,zσe,sγ
· 30 ·σe,s
σi ,s(2.6)
where σe,s and σi ,s are the longitudinal RMS bunch lengths of the electron and ion bunchesrespectively, σe,z is the transverse RMS size of the electron bunches, and where η is the fraction ofthe accelerator length occupied by the electron cooler. The relative energy in laboratory frame isthen determined using:
∆E
E= γel ec −γnomi nal
γnomi nal −1(2.7)
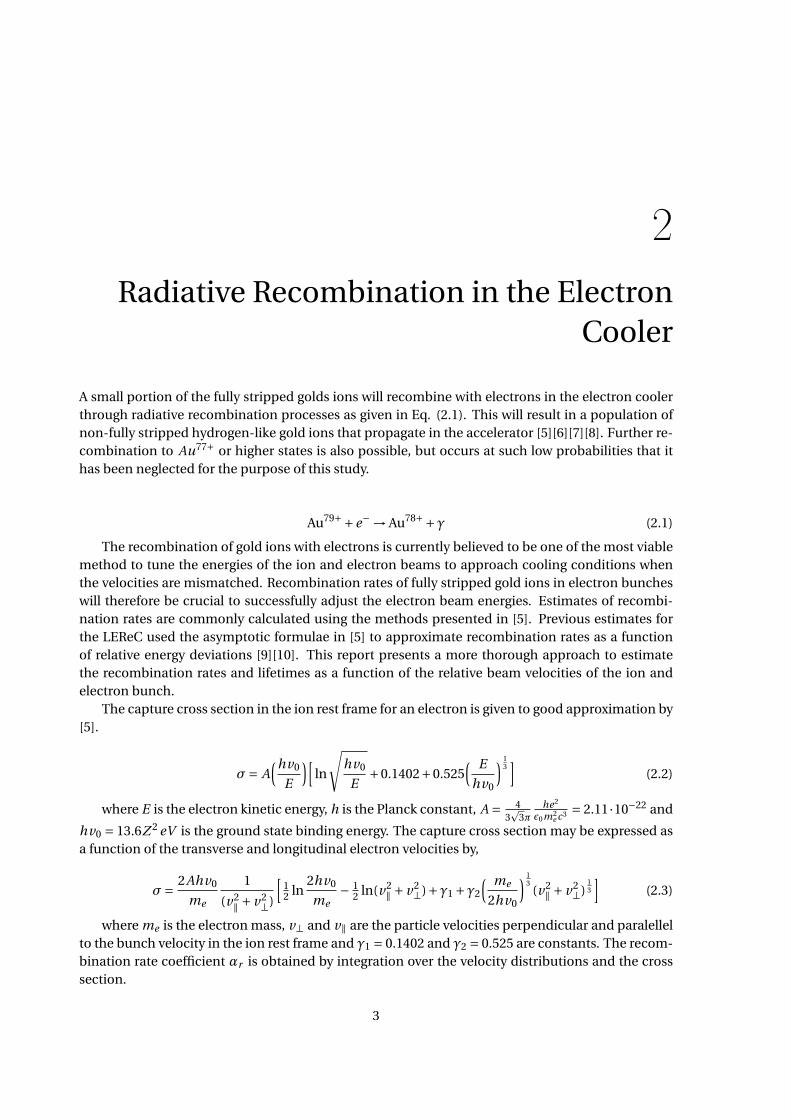
The results for the radiative recombination rate as function of relative energies between the ionand electron beams are presented in figure 2.1. The left plot shows the recombination rates at smallrelative energies where detection of the cooling with the Schottky system will be possible. Maximalrecombination, withαr = 3.1·10−14 m3s−1, occurs for matching velocities between the two bunches.The rate quickly decreases for increasing relative energies. Results of recombination rates for largerrelative energy deviations are shown in the right plot. The gradient clearly decreases for increasingenergy deviation.
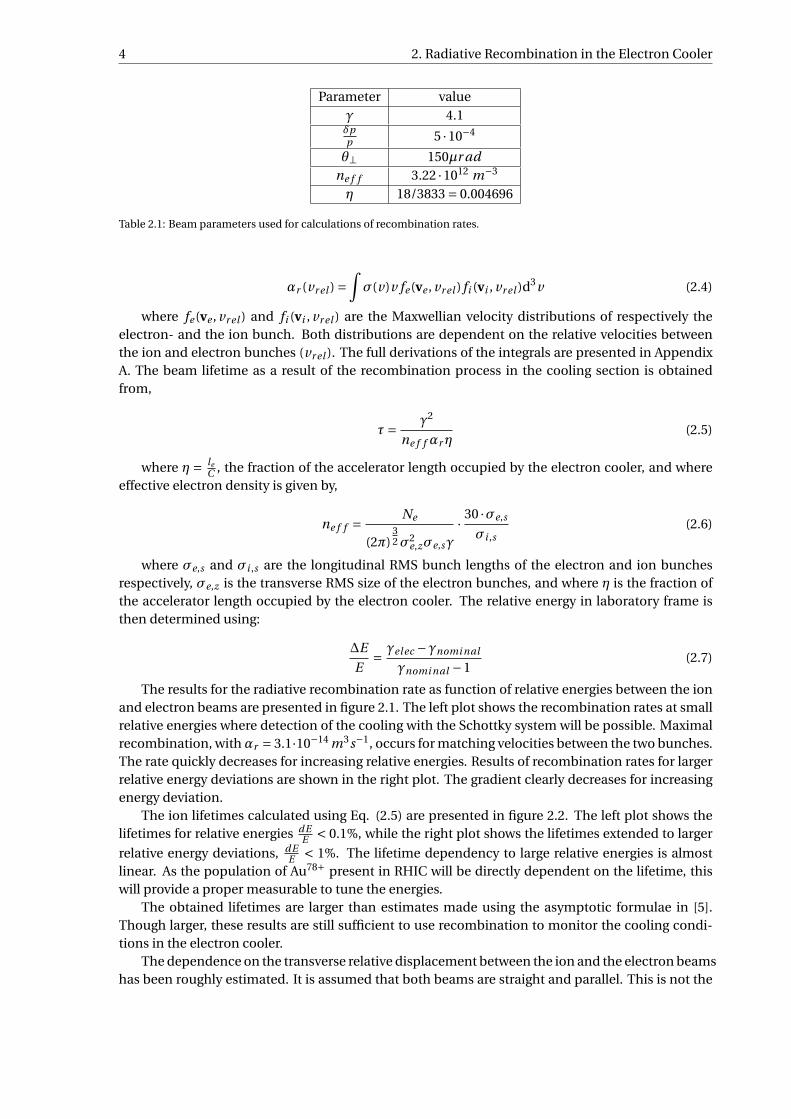
The ion lifetimes calculated using Eq. (2.5) are presented in figure 2.2. The left plot shows thelifetimes for relative energies dE
E < 0.1%, while the right plot shows the lifetimes extended to larger
relative energy deviations, dEE < 1%. The lifetime dependency to large relative energies is almost
linear. As the population of Au78+ present in RHIC will be directly dependent on the lifetime, thiswill provide a proper measurable to tune the energies.
The obtained lifetimes are larger than estimates made using the asymptotic formulae in [5].Though larger, these results are still sufficient to use recombination to monitor the cooling condi-tions in the electron cooler.
The dependence on the transverse relative displacement between the ion and the electron beamshas been roughly estimated. It is assumed that both beams are straight and parallel. This is not the
2.1. Stripping rates 5
0.0002 0.0004 0.0006 0.0008 0.0010dE/E1.5 ×10-14
2.×10-14
2.5 ×10⁻¹⁴
3.×10-14
Alpha [m^3/s]
0.002 0.004 0.006 0.008 0.010dE/E
5.×10-15
1.×10-14
1.5 ×10⁻¹⁴
2.×10-14
2.5 ×10⁻¹⁴
3.×10-14
Alpha [m^3/s]
Figure 2.1: Radiative recombination rate as as a function of relative energy between the ion and electron bunches.
0.0002 0.0004 0.0006 0.0008 0.0010dE/E
10
12
14
16
18
life time [hours]
0.000 0.002 0.004 0.006 0.008 0.010dE/E0
50
100
150
200
250life time [hours]
Figure 2.2: Lifetime of ions including the longitudinal overlap of the ion and electron beams.
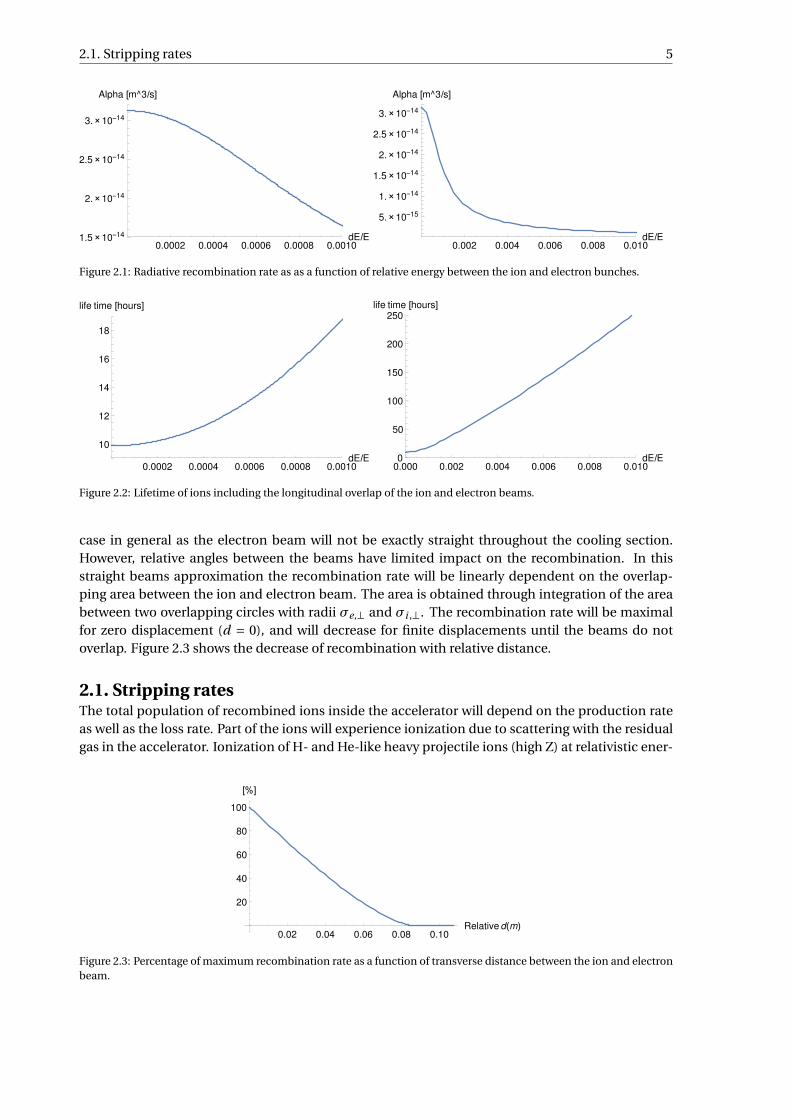
case in general as the electron beam will not be exactly straight throughout the cooling section.However, relative angles between the beams have limited impact on the recombination. In thisstraight beams approximation the recombination rate will be linearly dependent on the overlap-ping area between the ion and electron beam. The area is obtained through integration of the areabetween two overlapping circles with radii σe,⊥ and σi ,⊥. The recombination rate will be maximalfor zero displacement (d = 0), and will decrease for finite displacements until the beams do notoverlap. Figure 2.3 shows the decrease of recombination with relative distance.
2.1. Stripping ratesThe total population of recombined ions inside the accelerator will depend on the production rateas well as the loss rate. Part of the ions will experience ionization due to scattering with the residualgas in the accelerator. Ionization of H- and He-like heavy projectile ions (high Z) at relativistic ener-
0.02 0.04 0.06 0.08 0.10Relatived(m)
20
40
60
80
100
[%]
Figure 2.3: Percentage of maximum recombination rate as a function of transverse distance between the ion and electronbeam.
6 2. Radiative Recombination in the Electron Cooler
0 5 10 15 20Atomic Number
0.0000
0.0005
0.0010
0.0015
0.0020
0.0025
Strip
ping
effi
cien
cy [%
/s]
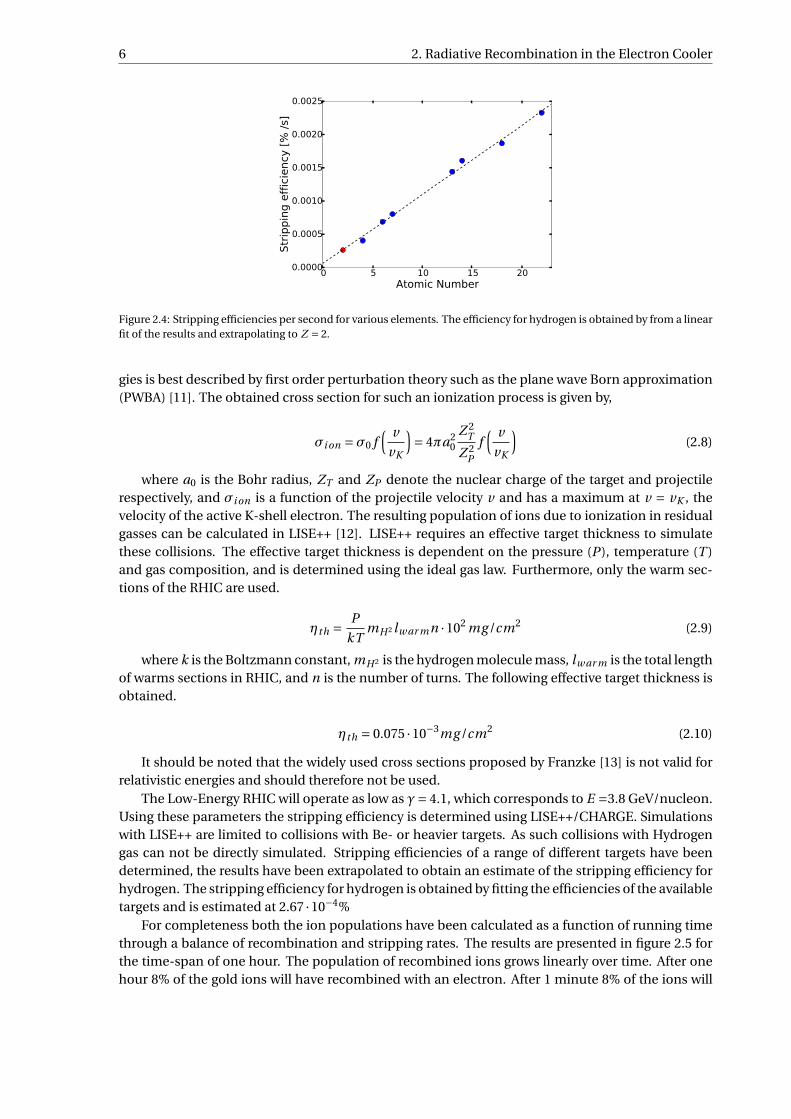
Figure 2.4: Stripping efficiencies per second for various elements. The efficiency for hydrogen is obtained by from a linearfit of the results and extrapolating to Z = 2.
gies is best described by first order perturbation theory such as the plane wave Born approximation(PWBA) [11]. The obtained cross section for such an ionization process is given by,
σi on =σ0 f( v
vK
)= 4πa2
0
Z 2T
Z 2P
f( v
vK
)(2.8)
where a0 is the Bohr radius, ZT and ZP denote the nuclear charge of the target and projectilerespectively, and σi on is a function of the projectile velocity v and has a maximum at v = vK , thevelocity of the active K-shell electron. The resulting population of ions due to ionization in residualgasses can be calculated in LISE++ [12]. LISE++ requires an effective target thickness to simulatethese collisions. The effective target thickness is dependent on the pressure (P ), temperature (T )and gas composition, and is determined using the ideal gas law. Furthermore, only the warm sec-tions of the RHIC are used.
ηth = P
kTmH 2 lw ar mn ·102 mg /cm2 (2.9)
where k is the Boltzmann constant, mH 2 is the hydrogen molecule mass, lw ar m is the total lengthof warms sections in RHIC, and n is the number of turns. The following effective target thickness isobtained.
ηth = 0.075 ·10−3mg /cm2 (2.10)
It should be noted that the widely used cross sections proposed by Franzke [13] is not valid forrelativistic energies and should therefore not be used.
The Low-Energy RHIC will operate as low as γ= 4.1, which corresponds to E =3.8 GeV/nucleon.Using these parameters the stripping efficiency is determined using LISE++/CHARGE. Simulationswith LISE++ are limited to collisions with Be- or heavier targets. As such collisions with Hydrogengas can not be directly simulated. Stripping efficiencies of a range of different targets have beendetermined, the results have been extrapolated to obtain an estimate of the stripping efficiency forhydrogen. The stripping efficiency for hydrogen is obtained by fitting the efficiencies of the availabletargets and is estimated at 2.67 ·10−4%
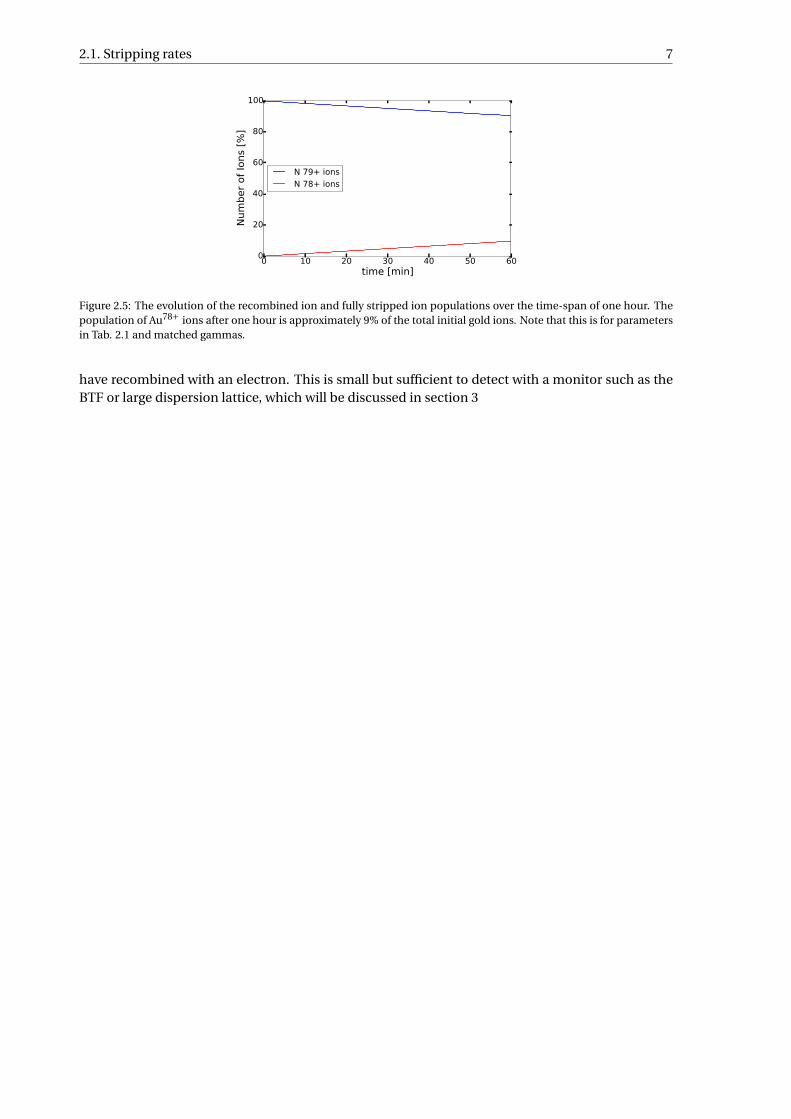
For completeness both the ion populations have been calculated as a function of running timethrough a balance of recombination and stripping rates. The results are presented in figure 2.5 forthe time-span of one hour. The population of recombined ions grows linearly over time. After onehour 8% of the gold ions will have recombined with an electron. After 1 minute 8% of the ions will
2.1. Stripping rates 7
0 10 20 30 40 50 60time [min]
0
20
40
60
80
100
Num
ber o
f Ion
s [%
]
N 79+ ionsN 78+ ions
Figure 2.5: The evolution of the recombined ion and fully stripped ion populations over the time-span of one hour. Thepopulation of Au78+ ions after one hour is approximately 9% of the total initial gold ions. Note that this is for parametersin Tab. 2.1 and matched gammas.
have recombined with an electron. This is small but sufficient to detect with a monitor such as theBTF or large dispersion lattice, which will be discussed in section 3

3Radiative Recombination Monitors
Several methods have been considered to detect the recombined ions in RHIC, each of which usesa different property of these recombined ions. First, detection with the Schottky system using thedifference in revolution frequency is considered. Later the tune shift between the two different pop-ulations is used when looking at using the BBQ or AC-dipoles. Lastly, the charge difference is usedto separate the two ion populations in large dispersive regions.
3.1. Schottky SpectraThe Schottky system may potentially be used to detect the recombined ions due to their slightlydifferent revolution frequency. Generally, the change in revolution frequency is dependent on thechange in circumference and the change in momentum.
At this point it is important to note that the ions subject to recombination will have an un-changed velocity and therefore an unchanged momentum. In the process of capturing one electron,the ion velocity does not change. Its momentum will therefore only increase due to the additionalelectron mass, which is negligible at this level. The change in revolution frequency of Au78+ is there-fore only dependent on the change in circumference due to the decreased charge. Furthermore, asthe momentum is unchanged the recombined ions will not leave the bucket. Previous assumptionsthat recombined ions would leak into the abort gap and could be kicked resonantly are thereforedismissed.
The frequency shift is determined from the momentum compaction factor αc = 1/γ2T and the
charge difference of the Au78+ ions, ∆q ′q ′ =−1/78 [14].
∆C =∮
D(s)
ρd s∆q
q(3.1)
and the momentum compaction factor is given by,
αc ≡ 1
C
d∆C
d(∆q/q)= 1
C
∮D(s)
ρd s (3.2)
∆ f
f= ∆C
C=αc
∆q
q=−2.4 ·10−5 (3.3)
The acceptance of the bucket is given by frequency spread of the unrecombined ions:
σ f =−( 1
γ2T
− 1
γ2
)δ= 2.9 ·10−5 (3.4)
8
3.2. Excitation of Au78+ using Induced Tune Shift 9
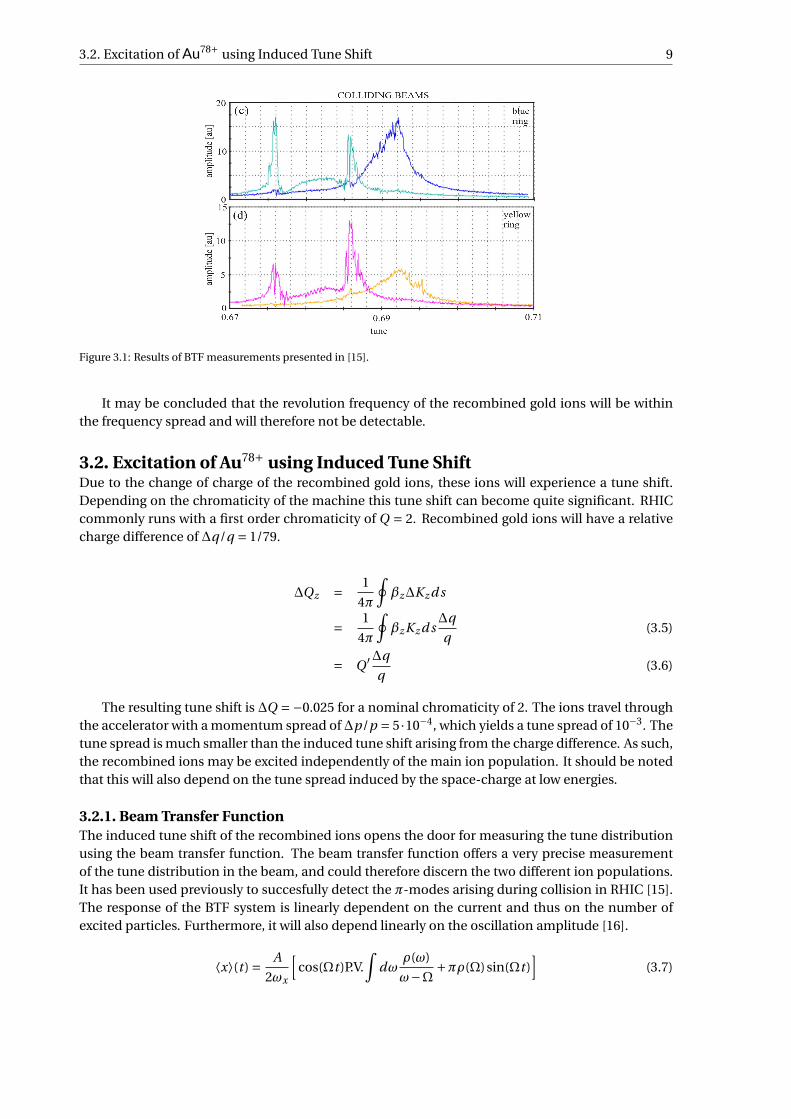
Figure 3.1: Results of BTF measurements presented in [15].
It may be concluded that the revolution frequency of the recombined gold ions will be withinthe frequency spread and will therefore not be detectable.
3.2. Excitation of Au78+ using Induced Tune ShiftDue to the change of charge of the recombined gold ions, these ions will experience a tune shift.Depending on the chromaticity of the machine this tune shift can become quite significant. RHICcommonly runs with a first order chromaticity of Q = 2. Recombined gold ions will have a relativecharge difference of ∆q/q = 1/79.
∆Qz = 1
4π
∮βz∆Kz d s
= 1
4π
∮βz Kz d s
∆q
q(3.5)
= Q ′∆q
q(3.6)
The resulting tune shift is ∆Q =−0.025 for a nominal chromaticity of 2. The ions travel throughthe accelerator with a momentum spread of∆p/p = 5·10−4, which yields a tune spread of 10−3. Thetune spread is much smaller than the induced tune shift arising from the charge difference. As such,the recombined ions may be excited independently of the main ion population. It should be notedthat this will also depend on the tune spread induced by the space-charge at low energies.
3.2.1. Beam Transfer FunctionThe induced tune shift of the recombined ions opens the door for measuring the tune distributionusing the beam transfer function. The beam transfer function offers a very precise measurementof the tune distribution in the beam, and could therefore discern the two different ion populations.It has been used previously to succesfully detect the π-modes arising during collision in RHIC [15].The response of the BTF system is linearly dependent on the current and thus on the number ofexcited particles. Furthermore, it will also depend linearly on the oscillation amplitude [16].
⟨x⟩(t ) = A
2ωx
[cos(Ωt )P.V.
∫dω
ρ(ω)
ω−Ω +πρ(Ω)sin(Ωt )]
(3.7)
10 3. Radiative Recombination Monitors
Qx (79+) Qx (78+) Amplitude
0.10 0.15 0.20 0.25 0.30Tune
0.002
0.004
0.006
0.008
0.010Amplitude
Qx (79+) Qx (78+) Amplitude
0.10 0.15 0.20 0.25 0.30Tune
0.002
0.004
0.006
0.008
0.010Amplitude
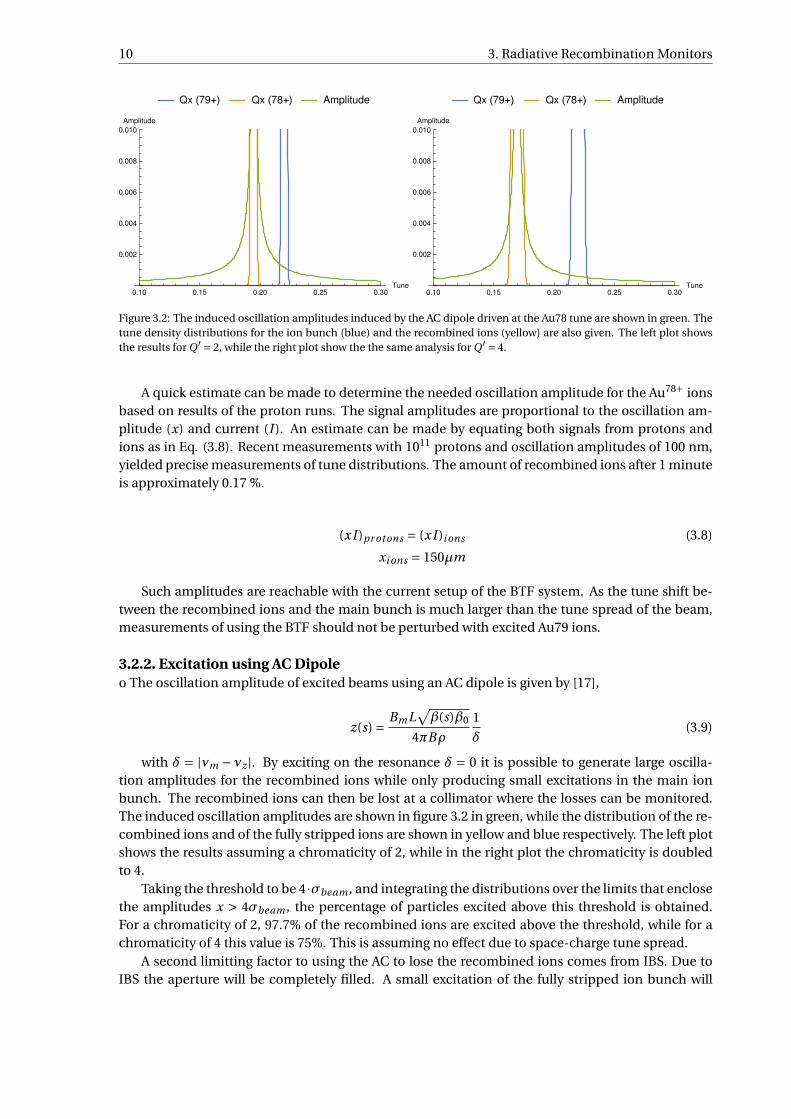
Figure 3.2: The induced oscillation amplitudes induced by the AC dipole driven at the Au78 tune are shown in green. Thetune density distributions for the ion bunch (blue) and the recombined ions (yellow) are also given. The left plot showsthe results for Q ′ = 2, while the right plot show the the same analysis for Q ′ = 4.
A quick estimate can be made to determine the needed oscillation amplitude for the Au78+ ionsbased on results of the proton runs. The signal amplitudes are proportional to the oscillation am-plitude (x) and current (I ). An estimate can be made by equating both signals from protons andions as in Eq. (3.8). Recent measurements with 1011 protons and oscillation amplitudes of 100 nm,yielded precise measurements of tune distributions. The amount of recombined ions after 1 minuteis approximately 0.17 %.
(xI )pr otons = (xI )i ons (3.8)
xi ons = 150µm
Such amplitudes are reachable with the current setup of the BTF system. As the tune shift be-tween the recombined ions and the main bunch is much larger than the tune spread of the beam,measurements of using the BTF should not be perturbed with excited Au79 ions.
3.2.2. Excitation using AC Dipoleo The oscillation amplitude of excited beams using an AC dipole is given by [17],
z(s) = BmL√β(s)β0
4πBρ
1
δ(3.9)
with δ = |νm −νz |. By exciting on the resonance δ = 0 it is possible to generate large oscilla-tion amplitudes for the recombined ions while only producing small excitations in the main ionbunch. The recombined ions can then be lost at a collimator where the losses can be monitored.The induced oscillation amplitudes are shown in figure 3.2 in green, while the distribution of the re-combined ions and of the fully stripped ions are shown in yellow and blue respectively. The left plotshows the results assuming a chromaticity of 2, while in the right plot the chromaticity is doubledto 4.
Taking the threshold to be 4·σbeam , and integrating the distributions over the limits that enclosethe amplitudes x > 4σbeam , the percentage of particles excited above this threshold is obtained.For a chromaticity of 2, 97.7% of the recombined ions are excited above the threshold, while for achromaticity of 4 this value is 75%. This is assuming no effect due to space-charge tune spread.
A second limitting factor to using the AC to lose the recombined ions comes from IBS. Due toIBS the aperture will be completely filled. A small excitation of the fully stripped ion bunch will

3.3. Lattice with large dispersion & small β-function 11
therefore causes losses at the tails of the distributions. As such, the signal obtained from the lossesof Au78+ will be contaminated by losses of Au79+. No clear estimate was made to determine thelosses of Au79+ due to the lack of knowledge on the form of the distribution at the wall edges dueto IBS. Using the AC dipole to excite the recombined ions to large amplitudes and detect them atcollimators does not provide an accurate and repeatable recombination rate monitor.
3.3. Lattice with large dispersion & small β-functionA lattice with large local dispersion is ideal to measure the produced Au78+ ions. The charge differ-ence between the two populations of ions will cause the recombined ions to have a different closedorbit in large dispersive regions. By increasing the dispersion in a specific location the two ion pop-ulations can be separated. The Au78+ beam may then be captured and monitored, which would alsodirectly function as integrator of the particle population.
Using the following beam parameters, the closed orbit separation in the nominal lattice in thearcs can be determined.
ε = 0.6µm
β = 50m
D = 1.8m∆q ′
q ′ = 79−78
78= 1
78
σp = 5 ·10−4
The beam size is determined using:
σB (s) =√εβ(s)+D(s)σp = 5.6mm (3.10)
The transverse distance between the closed orbit of recombined ions and the nominal bunch isgiven by,
∆CO = D∆q ′
q ′ = 23mm = 4.1σB (3.11)
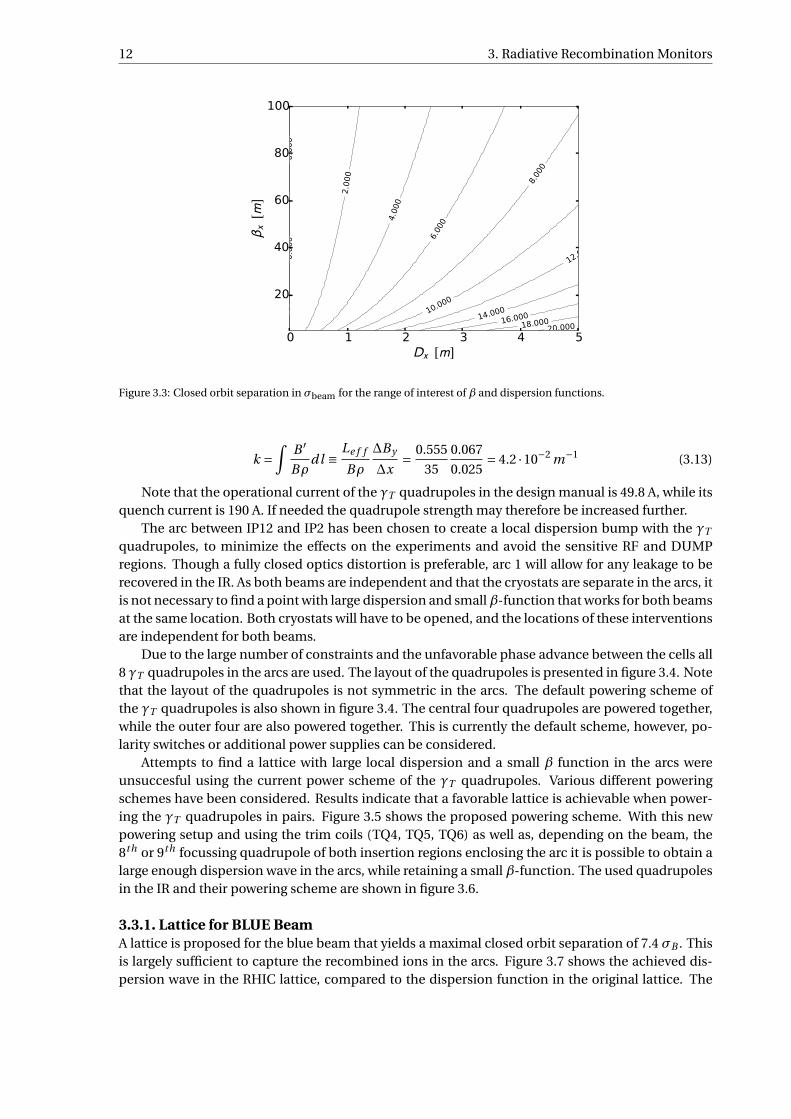
The nominal dispersion in the arcs is too small to separate the beams sufficiently. A local largedispersive section must be designed to further increase the beam separation. Figure 3.3 shows theresulting closed orbit deviation for the ranges ofβ and dispersion functions that are of interest in thearcs. An ideal lattice contains a large dispersion and small β-function at a single location to createan as large as possible closed orbit separation.
The transitional jump (γT ) quadrupoles in the arcs may be used to create a local dispersionbump. The RHIC contains eight γT quadrupoles per arc used to adjust the transition energy withdispersion deviations. Four of these quadrupoles are located near the arc centers in large disper-sive sections, while the others are located in pairs at the ends of the arcs where the dispersion issmaller. Idealy these quadrupoles are separated by 90 , however, in RHIC the current phase ad-vance between the quadrupoles is 83 . This puts considerable constraints on finding a lattice withlarge local dispersion without β- and dispersion wave leakage. The γT are of course limited in theirpowering strengths. The maximum strength of the γT quadrupoles found in RampEditor are:
k = 6.3 ·10−3 m−1 (at γ= 23) (3.12)
= 3.52 ·10−2 m−1 (scaled to γ= 4.1)
Operational strength calculated from design manual (corrector quadrupoles) [18]:
12 3. Radiative Recombination Monitors
0 1 2 3 4 5[ ]
20
40
60
80
100
[]
0.00
00.
000
2.00
0
4.00
0
6.00
0
8.000
10.000
12.000
14.00016.000
18.00020.000
Figure 3.3: Closed orbit separation in σbeam for the range of interest of β and dispersion functions.
k =∫
B ′
Bρdl ≡ Le f f
Bρ
∆By
∆x= 0.555
35
0.067
0.025= 4.2 ·10−2 m−1 (3.13)
Note that the operational current of the γT quadrupoles in the design manual is 49.8 A, while itsquench current is 190 A. If needed the quadrupole strength may therefore be increased further.
The arc between IP12 and IP2 has been chosen to create a local dispersion bump with the γT
quadrupoles, to minimize the effects on the experiments and avoid the sensitive RF and DUMPregions. Though a fully closed optics distortion is preferable, arc 1 will allow for any leakage to berecovered in the IR. As both beams are independent and that the cryostats are separate in the arcs, itis not necessary to find a point with large dispersion and smallβ-function that works for both beamsat the same location. Both cryostats will have to be opened, and the locations of these interventionsare independent for both beams.
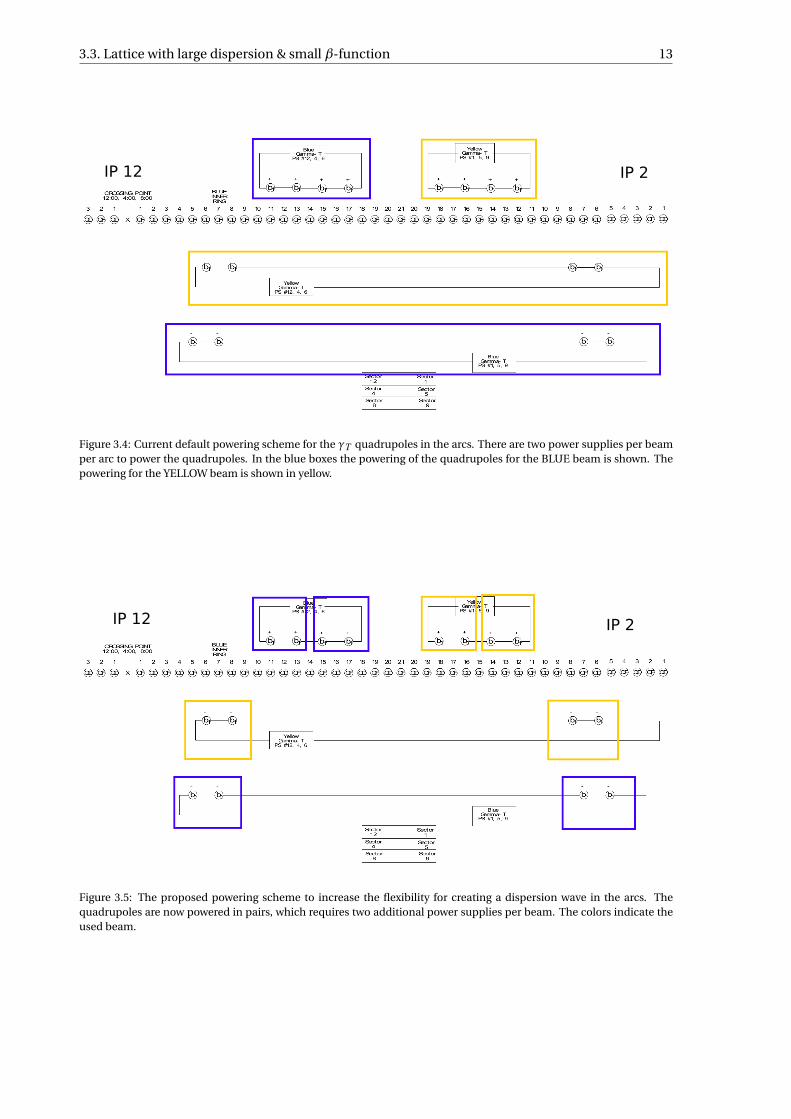
Due to the large number of constraints and the unfavorable phase advance between the cells all8 γT quadrupoles in the arcs are used. The layout of the quadrupoles is presented in figure 3.4. Notethat the layout of the quadrupoles is not symmetric in the arcs. The default powering scheme ofthe γT quadrupoles is also shown in figure 3.4. The central four quadrupoles are powered together,while the outer four are also powered together. This is currently the default scheme, however, po-larity switches or additional power supplies can be considered.
Attempts to find a lattice with large local dispersion and a small β function in the arcs wereunsuccesful using the current power scheme of the γT quadrupoles. Various different poweringschemes have been considered. Results indicate that a favorable lattice is achievable when power-ing the γT quadrupoles in pairs. Figure 3.5 shows the proposed powering scheme. With this newpowering setup and using the trim coils (TQ4, TQ5, TQ6) as well as, depending on the beam, the8th or 9th focussing quadrupole of both insertion regions enclosing the arc it is possible to obtain alarge enough dispersion wave in the arcs, while retaining a small β-function. The used quadrupolesin the IR and their powering scheme are shown in figure 3.6.
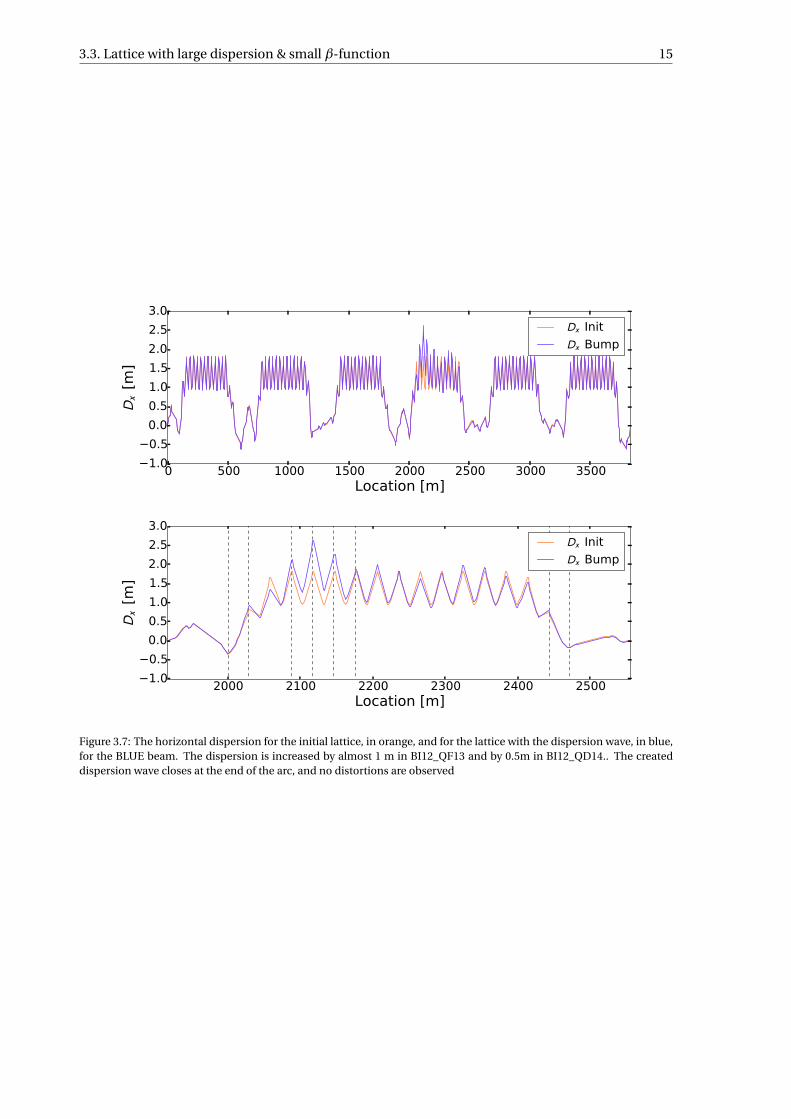
3.3.1. Lattice for BLUE BeamA lattice is proposed for the blue beam that yields a maximal closed orbit separation of 7.4 σB . Thisis largely sufficient to capture the recombined ions in the arcs. Figure 3.7 shows the achieved dis-persion wave in the RHIC lattice, compared to the dispersion function in the original lattice. The
3.3. Lattice with large dispersion & small β-function 13
-4 -4
Figure 3.4: Current default powering scheme for the γT quadrupoles in the arcs. There are two power supplies per beamper arc to power the quadrupoles. In the blue boxes the powering of the quadrupoles for the BLUE beam is shown. Thepowering for the YELLOW beam is shown in yellow.
-4 -4
Figure 3.5: The proposed powering scheme to increase the flexibility for creating a dispersion wave in the arcs. Thequadrupoles are now powered in pairs, which requires two additional power supplies per beam. The colors indicate theused beam.

14 3. Radiative Recombination Monitors
Figure 3.6: The powering scheme for the quadrupoles inside the insertion regions. The trim quadrupoles (TQ), shown inred, are used in both beams in both enclosing IR for fine tuning of the matching. The QF9 and QF8 are used for the BLUEand YELLOW beam respectively.
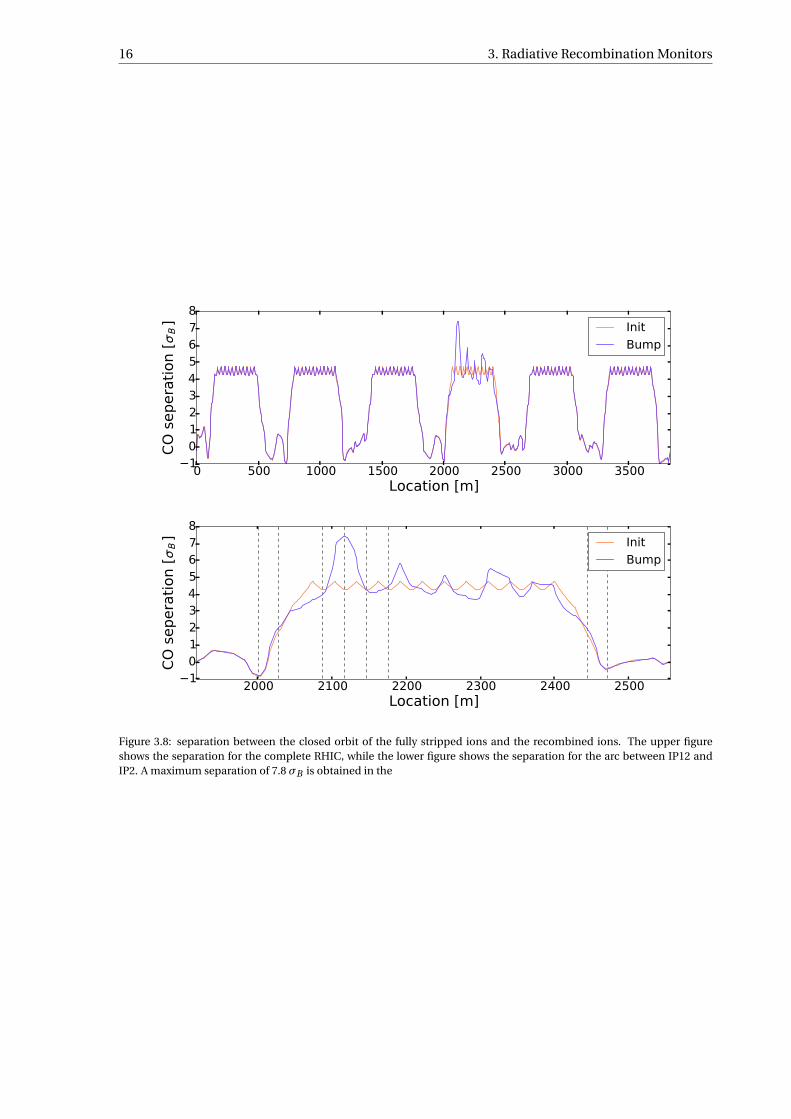
dispersion is increased by almost 1 m in BI12_QF13 and by 0.5m in BI12_QD14. Furthermore, theproduced wave closes at the end of the arc and there is no leakage throught the rest of the accelera-tor. The closed orbit separation in the arc is presented in figure 3.8. There is a clear maximum of 7.4σB near BI12_QD14.
The new lattice has an RMS βX -beat and βY -beat of 32% and 13% respectively in the affectedarc. The β-functions are presented in appendix B. All optical functions distortions close at the endof the arc and do not leak into the rest of the accelerator.
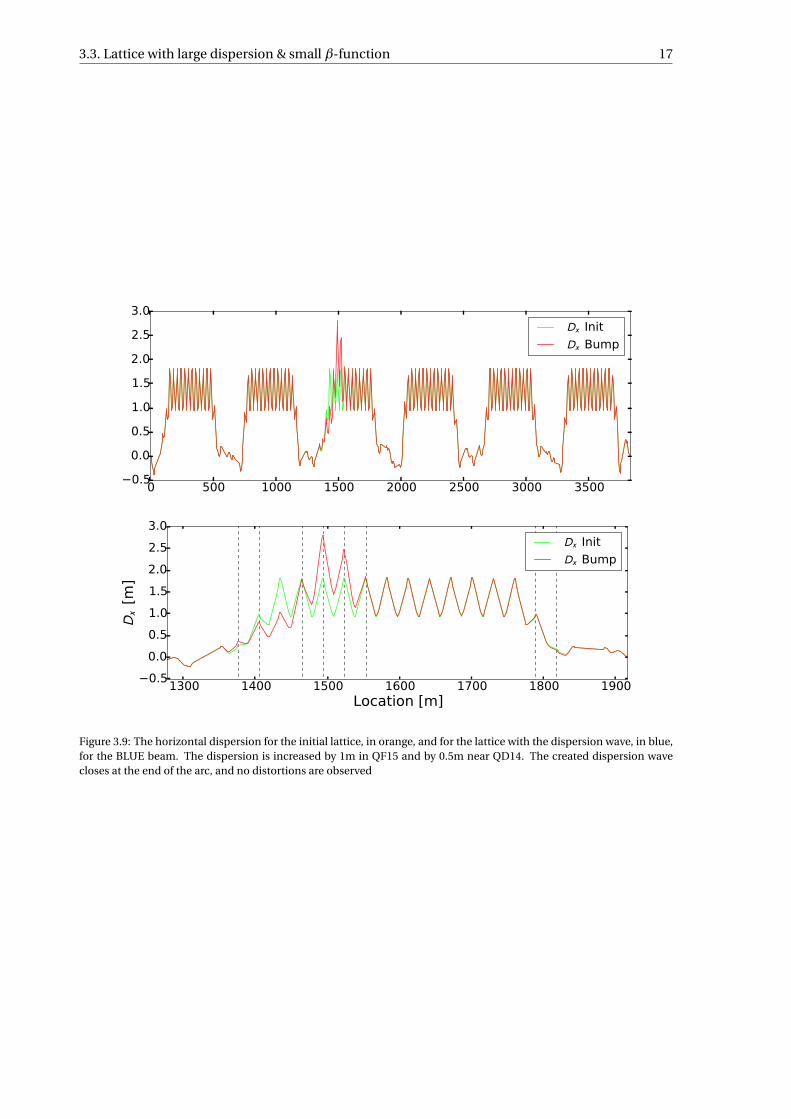
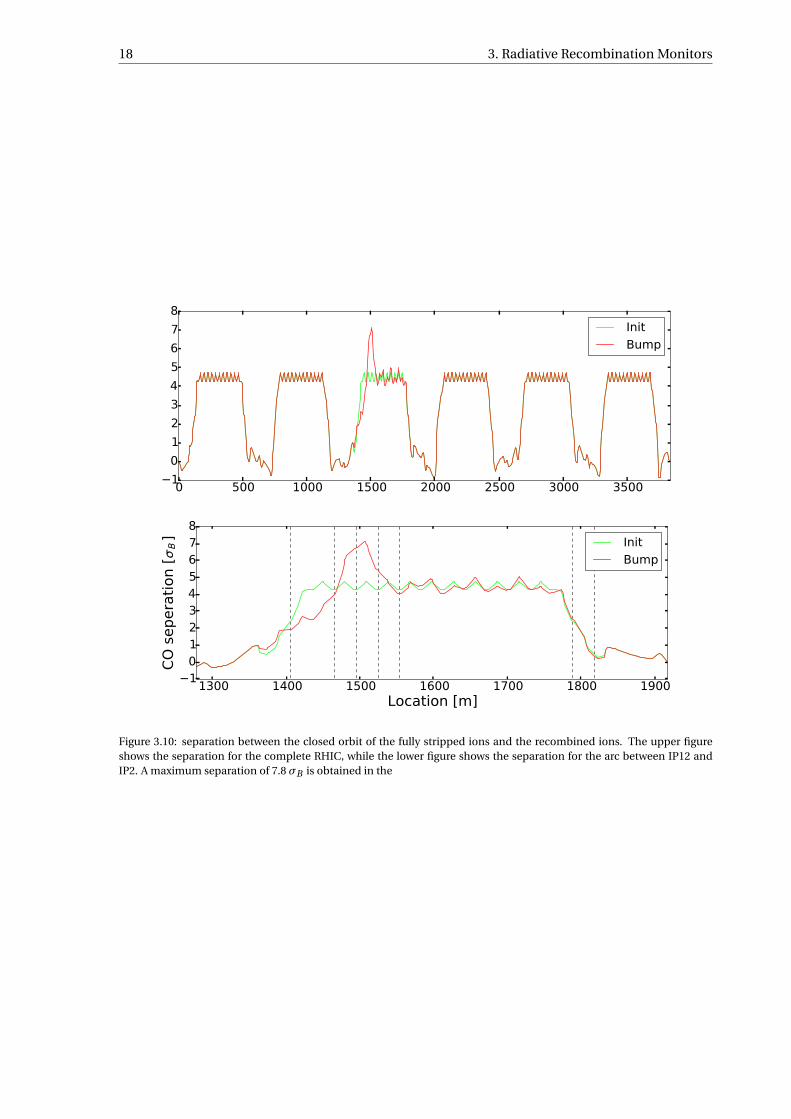
3.3.2. Lattice for YELLOW BeamA comparable lattice has been obtained for the yellow beam, where the dispersion is increased byalmost 1 m in YO1_QF14 and by 0.5m in YO1_QD15, as shown in figure 3.9. These results yielda slightly smaller maximal closed orbit separation than obtained in the BLUE beam. The beamseparation in the arcs is shown in figure 3.10. At 7σB the closed orbit separation is still large enoughfor the detection of recombined ions. As well as for the blue beam, the dispersion bump closesnicely in the yellow beam.
The RMS β-beating in the horizontal and vertical planes are both at 13%. Furthermore, thedistortions close at the end of the arc, and there is almost no leakage to the rest of the accelerator.
3.3.3. Detectors for Recombined Ions in the ArcsDetection of recombined ions in the arcs can be done with several methods that are either intrusiveor non-intrusive. Non-intrusive detection consists of driving the beam of Au78+ into the physicalwall. The ions will be lost in the wall thereby creating showers of secondary partiles that can bedetected outside the cryostat using pin diodes. This method has been succesfully used before athigh energies to detect recombined copper from bound free pair production [19]. Tests will be per-formed in the coming RHIC run to test the sensitivity at low energy Au operation. The sensitivity
3.3. Lattice with large dispersion & small β-function 15
0 500 1000 1500 2000 2500 3000 3500Location [m]
1.00.50.00.51.01.52.02.53.0
[m]
Init Bump
2000 2100 2200 2300 2400 2500Location [m]
1.00.50.00.51.01.52.02.53.0
[m]
Init Bump
Figure 3.7: The horizontal dispersion for the initial lattice, in orange, and for the lattice with the dispersion wave, in blue,for the BLUE beam. The dispersion is increased by almost 1 m in BI12_QF13 and by 0.5m in BI12_QD14.. The createddispersion wave closes at the end of the arc, and no distortions are observed
16 3. Radiative Recombination Monitors
0 500 1000 1500 2000 2500 3000 3500Location [m]
1012345678
CO s
eper
atio
n [
] InitBump
2000 2100 2200 2300 2400 2500Location [m]
1012345678
CO s
eper
atio
n [
] InitBump
Figure 3.8: separation between the closed orbit of the fully stripped ions and the recombined ions. The upper figureshows the separation for the complete RHIC, while the lower figure shows the separation for the arc between IP12 andIP2. A maximum separation of 7.8 σB is obtained in the
3.3. Lattice with large dispersion & small β-function 17
0 500 1000 1500 2000 2500 3000 35000.5
0.0
0.5
1.0
1.5
2.0
2.5
3.0 Init Bump
1300 1400 1500 1600 1700 1800 1900Location [m]
0.50.00.51.01.52.02.53.0
[m]
Init Bump
Figure 3.9: The horizontal dispersion for the initial lattice, in orange, and for the lattice with the dispersion wave, in blue,for the BLUE beam. The dispersion is increased by 1m in QF15 and by 0.5m near QD14. The created dispersion wavecloses at the end of the arc, and no distortions are observed
18 3. Radiative Recombination Monitors
0 500 1000 1500 2000 2500 3000 35001012345678
InitBump
1300 1400 1500 1600 1700 1800 1900Location [m]
1012345678
CO s
eper
atio
n [
] InitBump
Figure 3.10: separation between the closed orbit of the fully stripped ions and the recombined ions. The upper figureshows the separation for the complete RHIC, while the lower figure shows the separation for the arc between IP12 andIP2. A maximum separation of 7.8 σB is obtained in the

3.3. Lattice with large dispersion & small β-function 19
may be improved by increasing the number of pin diodes and correctly aiming them at the sourceof Au78+ losses.
Installing a collimator inside the cryostat to capture the recombined ions would localize thelosses to a single point. The created showers can then be detected outside the cryostat using pindiodes. This, however, requires breaking open the cryostat to install the collimator. Another intru-sive detection method consists of designing a roman pot detector that can insert a detector directlyinside the beam pipe. This is the most direct way to detect the recombined ions, but also the mostdemanding method. A roman pot detector would have to be designed that fits inside the arcs, wherespace is limited.

4Alternatives to Recombination Monitors
This chapter presents alternative methods to recombination monitors of Au that are also consid-ered. Though these were not the main focus of this study they have been included here to providean exhaustive overview of methods available for electron cooling monitoring and tuning.
4.1. Direct detection of Electron Cooling with Schottky SystemThe main method for electron cooling detection as presented during the DOE review on 5-6 Novem-ber 2015 is based on the Schottky spectra. Assuming an overlap between the electron and ion beamsand a relative energy matching within dE/E < 0.1% it will be possible to detect the direct electroncooling effect in the Schottky spectra. A peak will start to develop at the electron energy. Energytuning of the electron beam can then be done depending on the measured electron energy. Sucha method based on a Schottky systems has been successfully used to detect cooling effects at Fer-milab. Figure 4.1 shows the Schottky measurements performed at FermiLab to monitor electroncooling and tune the electron energy (S. Nagaitsev - FNAL).
At relative energy deviations of dE/E < 0.1% this procedure to monitor the electron cooling willbe the preferred method. This method may be expanded to allow for electron cooling detection atlarger energy deviations. By debunching the ion beams it is possible to fill the momentum apertureto approximately 1%. This will enlarge the acceptance for the electron beam energy. However, theion density will be considerably lower than before which will decrease the cooling. As suc, it will bemore challenging to detect the electron energy.
4.2. Recombination of DeuteronA second alternative procedure to measure the quality of the alignment between the electron beamand the ion beam is using alternative hadrons such as deuteron. Deuteron has a charge to massratio that is close to that of the gold ions. Recombination of deuteron yields a neutral deuteriumparticle that could be detected locally after the electron cooling. The recombination rate howeverwill be much lower due to the Z 2 dependence of the cross-section. The recombination rates fordeuteron may be calculated using the same method as for the Au79+ recombination presented inchapter 2. The results for the deuteron recombination rates as a function of relative energy deviationare presented in figure 4.2.
The recombination rate coefficient αr is approximately 104 times smaller than for the gold ions,shown in figure 2.1. However, due to the charge differences the number of particles per bunch canbe increased by almost 100. Furthermore, the detection of deuterium will be done locally. Thiscould further increase the number of particles to be detected. Deuterium will interact with themagnets, cryogenics and shielding before exitting the accelerator ring. This will most likely produce
20

4.2. Recombination of Deuteron 21
Figure 4.1: Schottky spectra showing the effect of electron cooling and the adjustment of the electron energies. (S. Na-gaitsev - FNAL)
0.0002 0.0004 0.0006 0.0008dE/E
1.2 ×10⁻¹⁸
1.4 ×10⁻¹⁸
1.6 ×10⁻¹⁸
1.8 ×10⁻¹⁸
2.×10-18
Alpha [m^3/s]
0.002 0.004 0.006 0.008dE/E
5.×10-19
1.×10-18
1.5 ×10⁻¹⁸
2.×10-18
Alpha [m^3/s]
Figure 4.2: Recombination rate coefficients for deuteron (Z = 1) and electrons. The same beam properties are assumedfor the deuteron bunch as for the gold ion bunches.

22 4. Alternatives to Recombination Monitors
showers of radiation. Such radiation may be measured using scintilators positioned outside thecryogenics. The advantage of such a detection method is that it would not be intrusive as well ascheap. However, there is still uncertainty as to what will come out of the dipoles. Studies on thistopic and MCNPX simulations are currently performed by Kin Yip.
5Conclusions
Monitoring of recombination rates will provide a secondary tuning tool to approach optimal elec-tron cooling conditions. The various available methods to monitor recombination rates in the elec-tron cooler have been studied.
Detection of the change in revolution frequency between the fully stripped ions and the recom-bined ions using the Schottky system will not be possible. The change in revolution frequency is2.4 ·10−5 and is smaller than the frequency spread of the main ion beam σ f = 2.9 ·10−5. This signalwill therefore not be discernable in the schottky spectrum.
Furthermore, the momentum of the ions does not change during the radiative recombinationprocess. This means that the recombined ions will not leave the bucket into the abort gap. As such,the particles can not be extracted through resonant kicking in the abort gap.
The recombined ions will experience a tune shift due to the charge difference. For a first orderchromaticity of 2, the induced tune shift will be ∆Q = 0.025. The tune spread due to a momentumspread of σp = 5 · 10−4 will be σp = 10−3. As such, the Au78+ ions can be excited independentlyusing either the BTF or the AC-dipole. The tune composition can be determined using the BTF,and allows for low-intrusive monitoring. For the BTF, an excitation of 150µm is needed to obtain aclear spectrum for Au beams after 1 minute of operation. Such amplitudes are achievable with thecurrent setup.
The AC dipole can be used to excite the ions to large amplitudes to lose the Au78+ . The measuredlosses, however, will also contain a contribution of Au79+. Due to space-charge tune spread andunknown beam distributions due to IBS the amount of Au79+ lost through this method could not beclearly determined. Using the AC dipole to lose the Au78+ ions is therefore not the preferred method.
A lattice was found with increased dispersion in the arc between IP12 and IP2 to create a closedorbit separation between the two ion populations. A separation of 7.4 σB and 7 σB was found forrespectively the BLUE and YELLOW beam. These separations are sufficiently large to only detectAu78+ ions. The recombined ions can be lost in the beam pipe at a specific location. The producedshowers can then be detected using aimed pin diodes located outside the cryostat. Tests will beperformed in the upcoming RHIC run to determine the feasibility of this method. Detection may beimproved by installing a collimator in the arc, or by designing a roman pot style detector to insert adetector in the beam pipe. These methods, however, require breaking open the cryostats.
Alternative methods, not based on the recombination of gold ions are currently considered. Analternative hadron, such as deuteron, may be used. The neutral deuterium created through recom-bination will leave the accelerator at the first dipole. This can function as a simple detector, however,rescalling of the calibrations will be needed to fit the gold beams.
Lastly, the cooling of the ion beam can be detecting in the Schottky spectra. This method islimitted to dE/E < 0.1% in normal operations. However, by debunching the ion beams the momen-
23

24 5. Conclusions
tum acceptance can be increased to 1% thereby increasing the range available to detect cooling.This will require a dump and reinject operation scheme.

AAppendix A
The derivation for the recombination rates concisely presented in this appendix. The capture crosssection is given by,
σ= A(hv0
E
)[ln
√hv0
E+0.1402+0.525
( E
hv0
) 13]
(A.1)
where A = 43p
3πhe2
ε0m2e c3 = 2.11 · 10−22 and hv0 = 13.6Z 2 eV . The capture cross section may be
expressed as a function of the transverse and longitudinal electron velocities by,
σ= 2Ahv0
me
1
(v2∥ + v2
⊥)
[12 ln
2hv0
me− 1
2 ln(v2∥ + v2
⊥)+γ1 +γ2
( me
2hv0
) 13
(v2∥ + v2
⊥)13
](A.2)
The recombination rate coefficient αr is obtained by integration over the velocity distributionsand the cross section.
αr (vr el ) =∫σ(v)v fe (ve , vr el ) fi (vi , vr el )d3v (A.3)
Simplifying the constants as follows:
C0 = 2Ahv0
me
C1 = 12 ln
2hv0
me+γ1
C2 = γ2
( me
2hv0
) 13
The cross section then becomes:
σ= C0
(v2∥ + v2
⊥)
[C1 − 1
2 ln(v2∥ + v2
⊥)+C2(v2∥ + v2
⊥)13
](A.4)
fe (ve , vr el ) = me
2πkTe,⊥exp
(−
me v2e,⊥
2kTe,⊥
)√ me
2πkTe,∥exp
(− me (ve,∥− vr el )2
2kTe,∥
)
fi (vi , vr el ) = mi
2πkTi ,⊥exp
(−
mi v2e,⊥
2kTi ,⊥
)√ mi
2πkTi ,∥exp
(− mi (−ve,∥+ vr el )2
2kTi ,∥
)
25
26 A. Appendix A
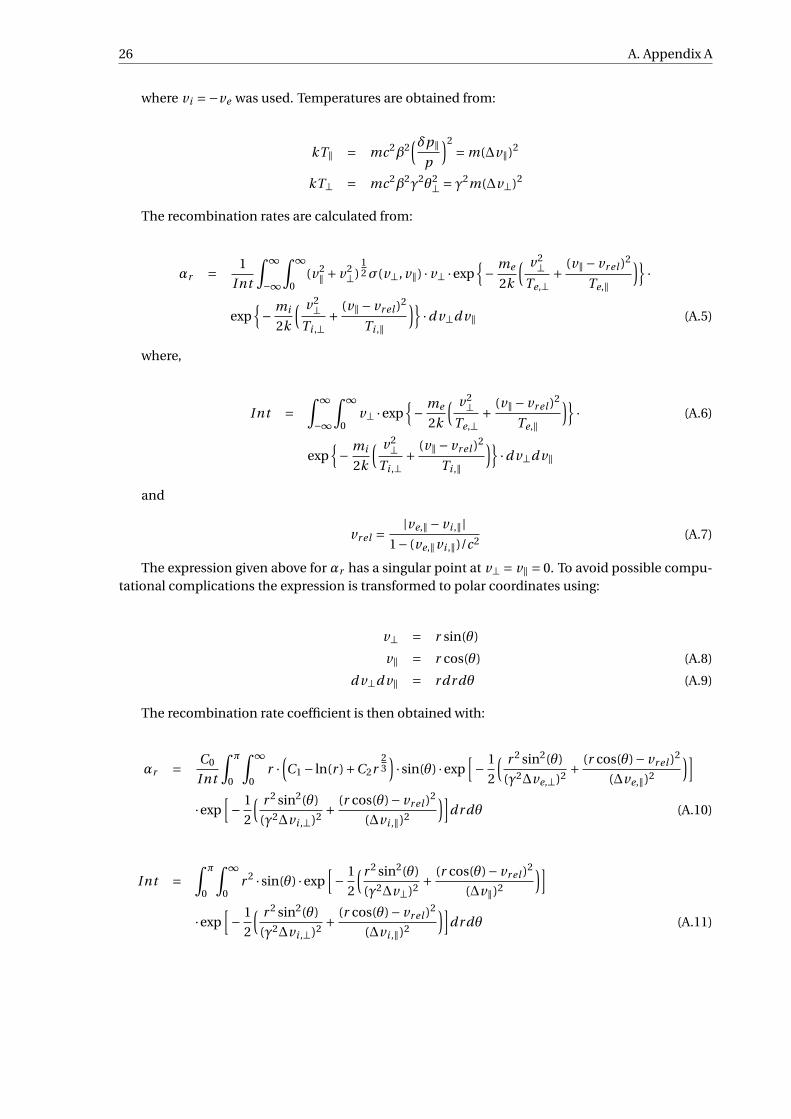
where vi =−ve was used. Temperatures are obtained from:
kT∥ = mc2β2(δp∥
p
)2= m(∆v∥)2
kT⊥ = mc2β2γ2θ2⊥ = γ2m(∆v⊥)2
The recombination rates are calculated from:
αr = 1
Int
∫ ∞
−∞
∫ ∞
0(v2
∥ + v2⊥)
12σ(v⊥, v∥) · v⊥ ·exp
− me
2k
( v2⊥
Te,⊥+ (v∥− vr el )2
Te,∥
)·
exp− mi
2k
( v2⊥
Ti ,⊥+ (v∥− vr el )2
Ti ,∥
)·d v⊥d v∥ (A.5)
where,
Int =∫ ∞
−∞
∫ ∞
0v⊥ ·exp
− me
2k
( v2⊥
Te,⊥+ (v∥− vr el )2
Te,∥
)· (A.6)
exp− mi
2k
( v2⊥
Ti ,⊥+ (v∥− vr el )2
Ti ,∥
)·d v⊥d v∥
and
vr el =|ve,∥− vi ,∥|
1− (ve,∥vi ,∥)/c2 (A.7)
The expression given above for αr has a singular point at v⊥ = v∥ = 0. To avoid possible compu-tational complications the expression is transformed to polar coordinates using:
v⊥ = r sin(θ)
v∥ = r cos(θ) (A.8)
d v⊥d v∥ = r dr dθ (A.9)
The recombination rate coefficient is then obtained with:
αr = C0
Int
∫ π
0
∫ ∞
0r ·
(C1 − ln(r )+C2r
23)· sin(θ) ·exp
[− 1
2
( r 2 sin2(θ)
(γ2∆ve,⊥)2 + (r cos(θ)− vr el )2
(∆ve,∥)2
)]·exp
[− 1
2
( r 2 sin2(θ)
(γ2∆vi ,⊥)2 + (r cos(θ)− vr el )2
(∆vi ,∥)2
)]dr dθ (A.10)
Int =∫ π
0
∫ ∞
0r 2 · sin(θ) ·exp
[− 1
2
(r 2 sin2(θ)
(γ2∆v⊥)2 + (r cos(θ)− vr el )2
(∆v∥)2
)]·exp
[− 1
2
( r 2 sin2(θ)
(γ2∆vi ,⊥)2 + (r cos(θ)− vr el )2
(∆vi ,∥)2
)]dr dθ (A.11)
BAppendix B
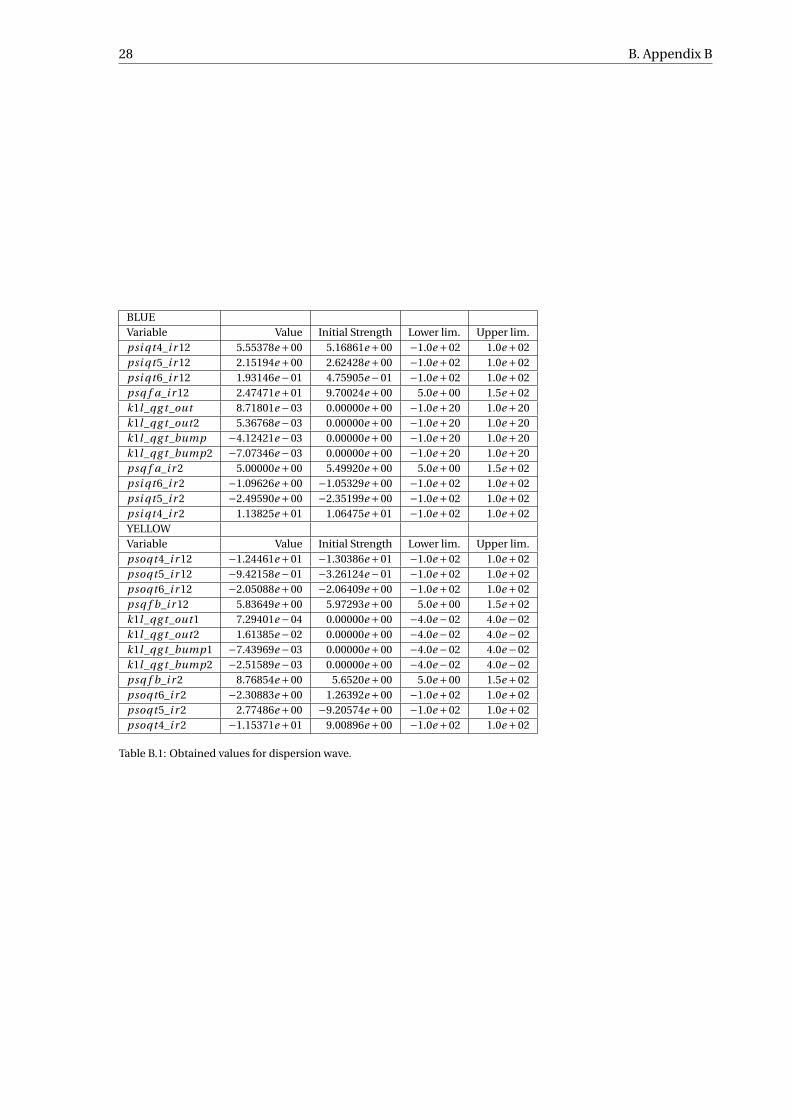
This appendix presents the obtained values from the matching of the dispersion wave and the β-functions for both beams.
27
28 B. Appendix B
BLUEVariable Value Initial Strength Lower lim. Upper lim.psi qt4_i r 12 5.55378e +00 5.16861e +00 −1.0e +02 1.0e +02psi qt5_i r 12 2.15194e +00 2.62428e +00 −1.0e +02 1.0e +02psi qt6_i r 12 1.93146e −01 4.75905e −01 −1.0e +02 1.0e +02psq f a_i r 12 2.47471e +01 9.70024e +00 5.0e +00 1.5e +02k1l_qg t_out 8.71801e −03 0.00000e +00 −1.0e +20 1.0e +20k1l_qg t_out2 5.36768e −03 0.00000e +00 −1.0e +20 1.0e +20k1l_qg t_bump −4.12421e −03 0.00000e +00 −1.0e +20 1.0e +20k1l_qg t_bump2 −7.07346e −03 0.00000e +00 −1.0e +20 1.0e +20psq f a_i r 2 5.00000e +00 5.49920e +00 5.0e +00 1.5e +02psi qt6_i r 2 −1.09626e +00 −1.05329e +00 −1.0e +02 1.0e +02psi qt5_i r 2 −2.49590e +00 −2.35199e +00 −1.0e +02 1.0e +02psi qt4_i r 2 1.13825e +01 1.06475e +01 −1.0e +02 1.0e +02YELLOWVariable Value Initial Strength Lower lim. Upper lim.psoqt4_i r 12 −1.24461e +01 −1.30386e +01 −1.0e +02 1.0e +02psoqt5_i r 12 −9.42158e −01 −3.26124e −01 −1.0e +02 1.0e +02psoqt6_i r 12 −2.05088e +00 −2.06409e +00 −1.0e +02 1.0e +02psq f b_i r 12 5.83649e +00 5.97293e +00 5.0e +00 1.5e +02k1l_qg t_out1 7.29401e −04 0.00000e +00 −4.0e −02 4.0e −02k1l_qg t_out2 1.61385e −02 0.00000e +00 −4.0e −02 4.0e −02k1l_qg t_bump1 −7.43969e −03 0.00000e +00 −4.0e −02 4.0e −02k1l_qg t_bump2 −2.51589e −03 0.00000e +00 −4.0e −02 4.0e −02psq f b_i r 2 8.76854e +00 5.6520e +00 5.0e +00 1.5e +02psoqt6_i r 2 −2.30883e +00 1.26392e +00 −1.0e +02 1.0e +02psoqt5_i r 2 2.77486e +00 −9.20574e +00 −1.0e +02 1.0e +02psoqt4_i r 2 −1.15371e +01 9.00896e +00 −1.0e +02 1.0e +02
Table B.1: Obtained values for dispersion wave.

29
0 500 1000 1500 2000 2500 3000 3500Location [m]
0
50
100
150
200
[m]
Init Bump
2000 2100 2200 2300 2400 2500Location [m]
0
50
100
150
200
[m]
Init Bump
Figure B.1: Horizontal β-functions for the BLUE beam.
0 500 1000 1500 2000 2500 3000 3500Location [m]
0
50
100
150
200
[m]
Init Bump
2000 2100 2200 2300 2400 2500Location [m]
0
50
100
150
200
[m]
Init Bump
Figure B.2: Vertical β-functions for the BLUE beam.

30 B. Appendix B
0 500 1000 1500 2000 2500 3000 35000
50
100
150
200 Init Bump
1300 1400 1500 1600 1700 1800 1900Location [m]
0
50
100
150
200
[m]
Init Bump
Figure B.3: Horizontal β-functions for the YELLOW beam.
0 500 1000 1500 2000 2500 3000 35000
50
100
150
200 Init Bump
1300 1400 1500 1600 1700 1800 1900Location [m]
0
50
100
150
200
[m]
Init Bump
Figure B.4: Vertical β-functions for the YELLOW beam.

Bibliography
[1] M. Stephanov, K. Rajagopal, and E. Shuryak, Signatures of the tricritical point in qcd, Phys. Rev.Lett. 81, 4816 (1998).
[2] Can we discover qcd critical point at RHIC? (BNL, 2006) RIKEN BNL Research Center ReportNo. BNL-75692-2006.
[3] A. Cho, Scheme for Boiling Nuclear Matter Gathers Steam at Accelerator Lab, Science 312, 190(2006).
[4] G. S. F. Stephans, critrhic: the rhic low energy program, Journal of Physics G: Nuclear and Parti-cle Physics 32, S447 (2006).
[5] M. Bell and J. S. Bell, Capture of cooling electrons by cool protons, Part. Accel. 12, 49 (1981).
[6] A. Wolf, G. Gwinner, J. Linkemann, A. A. Saghiri, M. Schmitt, D. Schwalm, M. Grieser, M. Beu-telspacher, T. Bartsch, C. Brandau, A. Hoffknecht, A. Müller, S. Schippers, O. Uwira, and D. W.Savin, Recombination in electron coolers, Nuclear Instruments and Methods in Physics Re-search A 441, 183 (2000).
[7] A. Kuznetsov, I. Meshkov, and A. Philippov, Radiative recombination of ions and nuclei in elec-tron cooling systems, Physics of Particles and Nuclei Letters 9, 346 (2012).
[8] W. Shi, S. Böhm, C. Böhme, C. Brandau, A. Hoffknecht, S. Kieslich, S. Schippers, A. Müller,C. Kozhuharov, F. Bosch, B. Franzke, P. Mokler, M. Steck, T. Stöhlker, and Z. Stachura, Recom-bination of u 92 + ions with electrons, The European Physical Journal D - Atomic, Molecular,Optical and Plasma Physics 15, 145 (2001).
[9] C. Montag, The LEReC Recombination Monitor, LEReC meeting.
[10] A. Fedotov, LEReC overview and status, (2015), RHIC Meeting.
[11] C. Scheidenberger, T. Stöhlker, W. Meyerhof, H. Geissel, P. Mokler, and B. Blank, Charge states ofrelativistic heavy ions in matter, Nuclear Instruments and Methods in Physics Research SectionB: Beam Interactions with Materials and Atoms 142, 441 (1998).
[12] Homepage LISE++, http://lise.nscl.msu.edu/lise.html, .
[13] B. Franzke, IEEE NS-28 (1981) 2116, .
[14] S. Y. Lee, Accelerator physics; 3rd ed. (World Scientific, Singapore, 2012).
[15] M. Minty, A. curcio, C. Dawson, C. Degen, Y. Luo, G. Marr, B. Martin, A. Marusic, and K. Mer-nick, High precision tune and coupling feedback and beam transfer function measurements inrhic, in Proceedings of IPAC 2010, Kyoto, Japan (2010) pp. 522–524.
[16] A. Chao, Physics of Collective Beam Instabilities in High Energy Accelerators, Wiley Series inBeam Physics and Accelerator Technology (Wiley, 1993).
31
32 Bibliography
[17] M. Bai, S. Y. Lee, J. W. Glenn, H. Huang, L. Ratner, T. Roser, M. J. Syphers, and W. van Asselt,Experimental test of coherent betatron resonance excitations, Phys. Rev. E 56, 6002 (1997).
[18] RHIC Configuration Manual (2006).
[19] R. Bruce, J. M. Jowett, S. Gilardoni, A. Drees, W. Fischer, S. Tepikian, and S. R. Klein, Observa-tions of beam losses due to bound-free pair production in a heavy-ion collider, Phys. Rev. Lett.99, 144801 (2007).