Embed Size (px)
Citation preview

Immigration Detention and Community Statistics Summary
26 April 2018

Immigration Detention and Community Statistics Summary
Page 2 of 12
Table of Contents About this report………………….................................................................................................................3 Enquiries………….......................................................................................................................................3 Acronyms………………………………………………………………………………………….…………………3 Immigration Detention And Community Statistics Summary………………………………….……………… 4 In Community under Residence Determination Population By State/Territory……………….………………5 Immigration Detention Population…………………………………………………………………….…………...6
From 1990 to 26 April 2018………………………..………………………………………………….………..6 People In Immigration Detention Facilities……………………………………………………………… ..……..7
Arrival Type………………………………………………………………………………………………………7 People In Immigration Detention…………………………………………………………………………………..7
Nationality………………………………………………………………………………………………………...8 Children In Immigration Detention…………………………………………………………………………………9 Time In Immigration Detention Facilities……………………………………………………..………………….11 Time In Community Under Residence Determination……………………………………..…………………..12

Immigration Detention and Community Statistics Summary
Page 3 of 12
About this report This report provides an overview of the number of people in immigration detention and Regional Processing Centres as at midnight on the date of the report. The report is produced on a monthly basis.
Data is sourced from several departmental processing and recording systems. Data relating to the immigration detention population is dynamic and there can be delays in transmission of information from the department's immigration detention network operations. Variations in figures between this report and previous issues can occur. Due to these issues, data from the current financial year should always be considered provisional.
Please note that due to technical issues, figures contained in this report, are as at 26 April 2018. We apologise for the inconvenience this may have caused.
Further information about immigration detention is available at:
http://www.homeaffairs.gov.au/about/immigration-detention-in-australia
Enquiries Comments or enquiries concerning this report should be sent using the department’s client service feedback form quoting the name and date of the report.
See: http://www.homeaffairs.gov.au/about/contact
Acronyms Table 1 – Acronyms used in this document
Acronym Description
APOD Alternative Place of Detention IMA Illegal Maritime Arrival IDC/F Immigration Detention Centre/Facility IRH Immigration Residential Housing ITA Immigration Transit Accommodation RPC Regional Processing Centre S501 Section 501 of the Migration ACT S501 Visa Cancellation Visa cancellations based on character or related grounds

Immigration Detention and Community Statistics Summary
Page 4 of 12
Immigration Detention And Community Statistics Summary At 26 April 2018, there were 1369 people in immigration detention facilities, including 1065 in immigration detention on the mainland and 304 in immigration detention on Christmas Island.
A further 457 people were living in the community after being approved for a residence determination and 17,980 were living in the community after grant of a Bridging Visa E.
The table below reflects figures based on records in Department of Home Affairs systems.
Table 2 – People in Immigration Detention Facilities (IDFs), Alternative Places of Detention (APODs), Regional Processing Centres (RPCs) and the Community at 26 April 2018
Place of immigration detention Men Women Children Total Change from
Previous Summary
31/03/18 Christmas Island IDC 304 0 0 304 - 26 Maribyrnong IDC 97 9 0 106 + 5 Perth IDC 21 12 0 33 - 6 Villawood IDC 434 47 0 481 - 39 Yongah Hill IDC 264 0 0 264 + 22 Mainland APODs 5 <5 5 14 + 5 Total IDCs/APODs 1,125 72 5 1,202 - 39 Adelaide ITA 16 <5 0 17 0 Brisbane ITA 53 8 0 61 - 5 Melbourne ITA 81 6 <5 89 + 24 Total in ITA 150 15 <5 167 + 19 Total in IDC/F 1,275 87 7 1,369 - 20
Total in Community under Residence Determination 137 140 180 457 + 5
Total IMA in Community on Bridging Visa E (Including people in a re-grant process)
12,712 2,277 3,038 18,027 - 298
Republic of Nauru (RPC) 207 26 22 255 - 14 Manus Province, Papua New Guinea (RPC) 0 0 0 0 0
Total IMA in RPCs 207 26 22 255 - 14
Detention Group
S501 Visa Cancellation 453 18 0 471 - 21 Illegal Maritime Arrival 336 9 <5 349 + 14 Other 486 60 <5 549 - 13 Total 1,275 87 7 1,369 - 20
Immigration Detention and Community Statistics Summary
Page 5 of 12
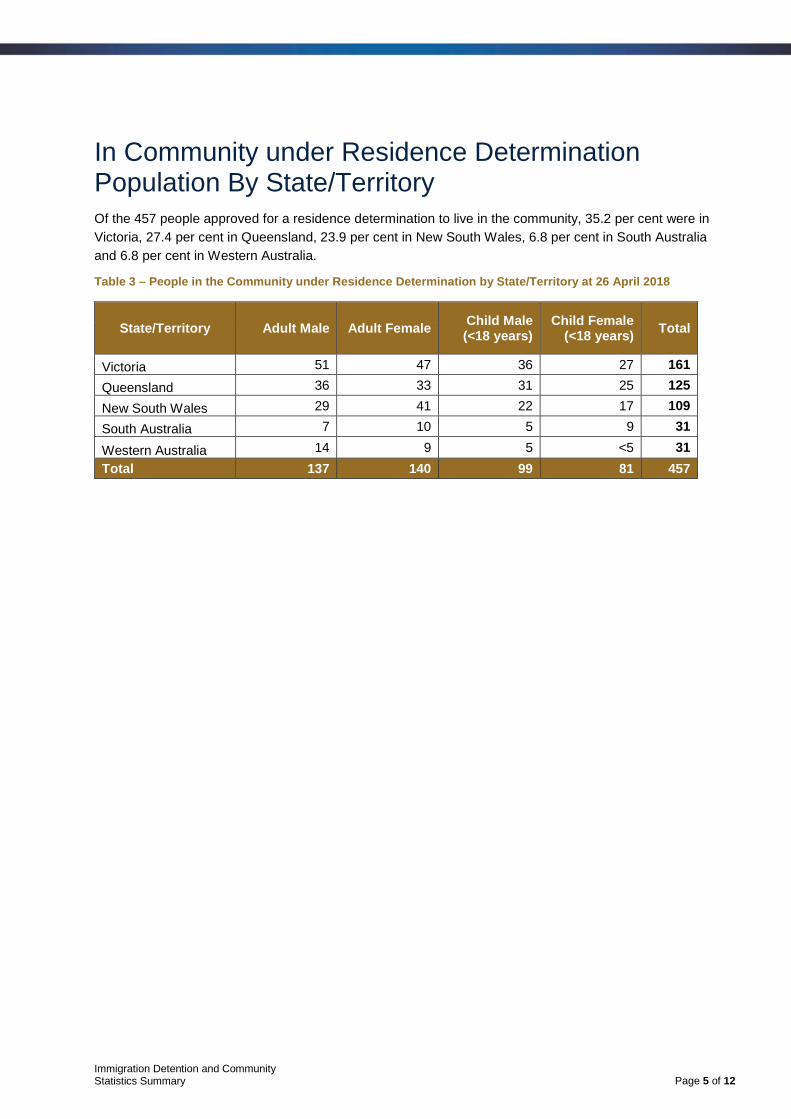
In Community under Residence Determination Population By State/Territory Of the 457 people approved for a residence determination to live in the community, 35.2 per cent were in Victoria, 27.4 per cent in Queensland, 23.9 per cent in New South Wales, 6.8 per cent in South Australia and 6.8 per cent in Western Australia.
Table 3 – People in the Community under Residence Determination by State/Territory at 26 April 2018
State/Territory Adult Male Adult Female Child Male (<18 years)
Child Female (<18 years) Total
Victoria 51 47 36 27 161 Queensland 36 33 31 25 125 New South Wales 29 41 22 17 109 South Australia 7 10 5 9 31
Western Australia 14 9 5 <5 31 Total 137 140 99 81 457

Immigration Detention and Community Statistics Summary
Page 6 of 12
Immigration Detention Population From 1990 to 26 April 2018 The overall number of people in immigration detention including in the community under residence determination has decreased by 122 to 1826 compared with 1948 at the end of April 2017. This decrease takes into account releases of detainees into the community under residence determination and detainees granted Bridging E visas (BVEs) as well as decreases through return and removal activities.
Figure 1 – Population in Immigration Detention
Figure 1 above, shows the number of people in immigration detention from 1990 to the date of this report. The trend had a consistent rise of people in immigration detention from January 2009 to January 2013, but has since had consistent decline.

Immigration Detention and Community Statistics Summary
Page 7 of 12
People In Immigration Detention Facilities Arrival Type There were 395 people who arrived unlawfully by air or boat, in held immigration detention facilities at 26 April 2018 representing 28.9 per cent of the total immigration detention population.
There were also 974 people (71.1 per cent of the total immigration population) who arrived in Australia lawfully and were subsequently taken into immigration detention for either overstaying or having their visas cancelled for breaching visa conditions.
Figure 2 – People in Held Immigration Detention Facilities by Detention Group
Figure 2 above, shows the number of people in held immigration detention facilities by detention group, including Overstayers, S501 and Other Visa Cancellations, Foreign Fishers, Illegal Maritime Arrivals, Unauthorised Air Arrivals, and if applicable – Inadequately Documented Crew Members and Others such as stowaways and ship deserters.
Table 4 – People in Held Immigration Detention Facilities by Detention Group at 26 April 2018
Place of immigration detention
S501 Visa Cancellation IMA
Other Detention
Group Total
Change from Previous Summary
31/03/18 Christmas Island IDC 155 87 62 304 - 26 Maribyrnong IDC 34 16 56 106 + 5 Perth IDC 9 5 19 33 - 6 Villawood IDC 152 106 223 481 - 39 Yongah Hill IDC 112 61 91 264 + 22 Mainland APODs 0 9 5 14 + 5 Total IDCs/APODs 462 284 456 1,202 - 39 Adelaide ITA <5 12 <5 17 0 Brisbane ITA <5 13 45 61 - 5 Melbourne ITA <5 40 46 89 + 24 Total in IRH and ITA 9 65 93 167 + 19 Total in IDC/F 471 349 549 1,369 - 20

Immigration Detention and Community Statistics Summary
Page 8 of 12
People In Immigration Detention Nationality At 26 April 2018, there were 1369 people in held immigration detention facilities. Of these 1369 people, 14 per cent were from New Zealand, 8.7 per cent were from Vietnam, 8.5 per cent were from Sri Lanka, 8 per cent were from Iran and 4.4 per cent were from China.
Table 5 – People in Held Immigration Detention Facilities by Nationality at 26 April 2018
Nationalities Adult Male Adult Female Child Male (<18 years)
Child Female (<18 years) Total
New Zealand 174 16 <5 0 191 Vietnam 103 16 0 0 119 Sri Lanka 111 <5 0 <5 116 Iran 106 <5 <5 <5 109 China 47 13 0 0 60 United Kingdom 54 <5 0 0 57 India 47 0 0 0 47 Iraq 42 <5 0 0 44 Malaysia 39 <5 <5 0 43 Sudan 41 <5 0 0 42 Other 511 29 <5 0 541 Total 1,275 87 <5 <5 1,369
At 26 April 2018, 457 were people living in the community after being approved for a residence determination. Of these 457 people, 55.1 per cent were from Iran, 11.4 per cent were Stateless, 9.2 per cent were from Sri Lanka, 3.3 per cent were from Somalia and 3.1 per cent were from Iraq.
Table 6 – People in the Community under Residence Determination by Nationality at 26 April 2018
Nationalities Adult Male Adult Female Child Male (<18 years)
Child Female (<18 years) Total
Iran 75 84 51 42 252 Stateless 17 12 10 13 52 Sri Lanka 12 10 14 6 42 Somalia <5 8 <5 <5 15 Iraq 6 5 <5 <5 14 Other 24 21 20 17 82 Total 137 140 99 81 457

Immigration Detention and Community Statistics Summary
Page 9 of 12
Children In Immigration Detention At 26 April 2018 there were seven children (aged less than 18 years) in Immigration Residential Housing, Immigration Transit Accommodation and Alternative Places of Detention.
Figure 3 – Children in Immigration Residential Housing, Immigration Transit Accommodation and Alternative Places of Detention
Figure 3 above, shows the number of children in immigration detention facilities and alternative places of detention from January 2013 to the date of this report. The continuous increase in the number of children in detention facilities from April 2013 to Aug 2013 was due to a rapid increase in illegal maritime arrivals during this period. The number of children in immigration detention facilities reduced in September 2013, as children completed mandatory processing and were transferred into the community. The number of children in detention facilities continued to decline during the late 2013 and 2014, with further reduction in January 2015.

Immigration Detention and Community Statistics Summary
Page 10 of 12
At 26 April 2018, the number of children living in the community after being approved for a residence determination increased by one to 180 from 179 in the previous report.
Figure 4 – Children in the Community under Residence Determination
Figure 4 above, shows the number of children in the community under residence determination from January 2012 to the date of this report. The number of children in the community under residence determination, has levelled off at its lowest number since the peak in November 2013, as a result of releases into the community on Bridging E visas.
Table 7 – Children in Immigration Detention and IMA Children in the Community on a Bridging E Visa at 26 April 2018
Placement Type Children Immigration Residential Housing 0 Immigration Transit Accommodation <5 Alternative Places of Detention 5 Total Children in Immigration Detention Facilities 7 Total Children in the Community under a Residence Determination 180 Total IMA Children in the Community on a Bridging E visa (including in re-grant process) 3,034

Immigration Detention and Community Statistics Summary
Page 11 of 12
Time In Immigration Detention Facilities At 26 April 2018, there were 1369 people in immigration detention facilities. Of these 1369 people, 33.5 per cent had been detained for 91 days or less and 66.3 per cent had been detained for 365 days or less.
Table 8 – Length of Time of People in Held Immigration Detention Facilities at 26 April 2018
Period Detained Total % of Total 7 days or less 18 1.3%
8 days - 31 days 188 13.7% 32 days - 91 days 252 18.4% 92 days - 182 days 216 15.8%
183 days - 365 days 234 17.1% 366 days - 547 days 127 9.3% 548 days - 730 days 70 5.1%
Greater than 730 days 264 19.3% Total 1,369 100%
At 26 April 2018, the average period of time for people held in detention facilities was 434 days.
Figure 5 – Average Number of Days of People in Held Immigration Detention Facilities only
Figure 5 above, shows the average days in held immigration detention at the end of each month from January 2013 to the date of this report. The average period of time for people held in detention facilities steadily increased from July 2013 to January 2015.

Immigration Detention and Community Statistics Summary
Page 12 of 12
Time In Community Under Residence Determination Of the 457 people in the community under residence determination, as at 26 April 2018, 5.7 per cent had been in the community for 91 days or less and 18.4 per cent had been in the community for 365 days or less.
Table 9 – Length of Time of People in Community under Residence Determination at 26 April 2018
Period Detained Total % of Total 7 days or less <5 0.4%
8 days - 31 days 11 2.4% 32 days - 91 days 13 2.8% 92 days - 182 days 21 4.6%
183 days - 365 days 37 8.1% 366 days - 547 days 46 10.1% 548 days - 730 days 28 6.1%
Greater than 730 days 299 65.4% Total 457 100%