Embed Size (px)
Citation preview

Determinant Factors of Income of Cocoa Farmers in Batuparigi
Village, Mamuju Tengah District
Arwin Sanjaya1, Nur Astaman Putra
2, Salmi Taedy
3
1Universitas Mulawarman,
2STAIN Majene,
3STKIP Pembangunan Indonesia
Email: [email protected]
ABSTRACT
Cocoa farming is a business developed by the community in Batuparigi Village, Tobadak District, Central
Mamuju Regency so that cocoa is one of the leading agricultural sectors there. However, there are several
inhibiting factors, such as; The increasing price of cocoa seedlings has made it difficult to obtain quality
seeds. In addition, the cost of fertilizers and pesticides has increased in price from year to year and has
become an obstacle for cocoa farmers. This study uses a quantitative approach with a survey method. The
sample in the study was 30 people. The data collection techniques used were observation, documentation,
and questionnaires. The data analysis technique used is multiple linear regression analysis. The results
showed that simultaneously the independent variables (land area, fertilizer costs, seed costs, pesticide
costs, and labor) had a significant and positive effect on the dependent variable (farmer income).
Partially, land area has a significant effect and is positively related, while the variable cost of fertilizer,
cost of seeds, cost of pesticides, and labor has no significant effect on farmers' income.
Keywords: Cocoa farmer income, land area, costs, labor
INTRODUCTION
As one of the countries with a large plantation area, Indonesia is a major producer of
cocoa (Theobroma cacao L.). Initially, Indonesia was the third-largest cocoa producer in the
world after Ivory Coast and Ghana (Prastowo et al., 2010). However, Indonesia's cacao
production, which has continued to decline since 2015, has caused Indonesia's position to shift
to the fifth largest position in the world, displaced by Ecuador and Nigeria in 2017. (IEI dan
UNIED, 2019). However, the cocoa trade can bring in foreign exchange and income of the
people, thereby placing cocoa as one of the important commodities in the Indonesian economy,
(Munarso, 2016).
Examining the previous years, the Ministry of Agriculture established cocoa as one of the
leading commodities in agricultural development in 2015‒2019 along with rubber, palm oil,
coconut, coffee, pepper, and other commodities, (Direktorat Jenderal Perkebunan, 2015). The
growth rate target for cocoa production at that time was set at 3.9% per year. This target setting
shows the government's desire to continue encouraging efforts to increase cocoa production.
Furthermore, the government has also established the cocoa processing industry as one of the
prioritized sectors for development according to RIPIN 2015-2035.
As one of the leading plantation commodities, cocoa plays an important role in the source
of income for Indonesian smallholder farmers. It is estimated that there are not less than 1.84
million families whose main income depends on cocoa. In addition, approximately 1 million
families rely on their income from the downstream cocoa industry. This position shows that the
Jurnal Administrare: Jurnal Pemikiran Ilmiah dan Pendidikan Administrasi Perkantoran Vol. 8, Issue 1, January-June 2021, Pages 165-178 Homepage: http://ojs.unm.ac.id/index.php/administrare/index
Copyright © 2021 Universitas Negeri Makassar. This is an open access article under the CC BY license
(http://creativecommons.org/licenses/by/4.0/)
166 Jurnal Administrare: Jurnal Pemikiran Ilmiah dan Pendidikan Administrasi Perkantoran
Volume 8, Issue 1, January-June 2021. Pages 165-178
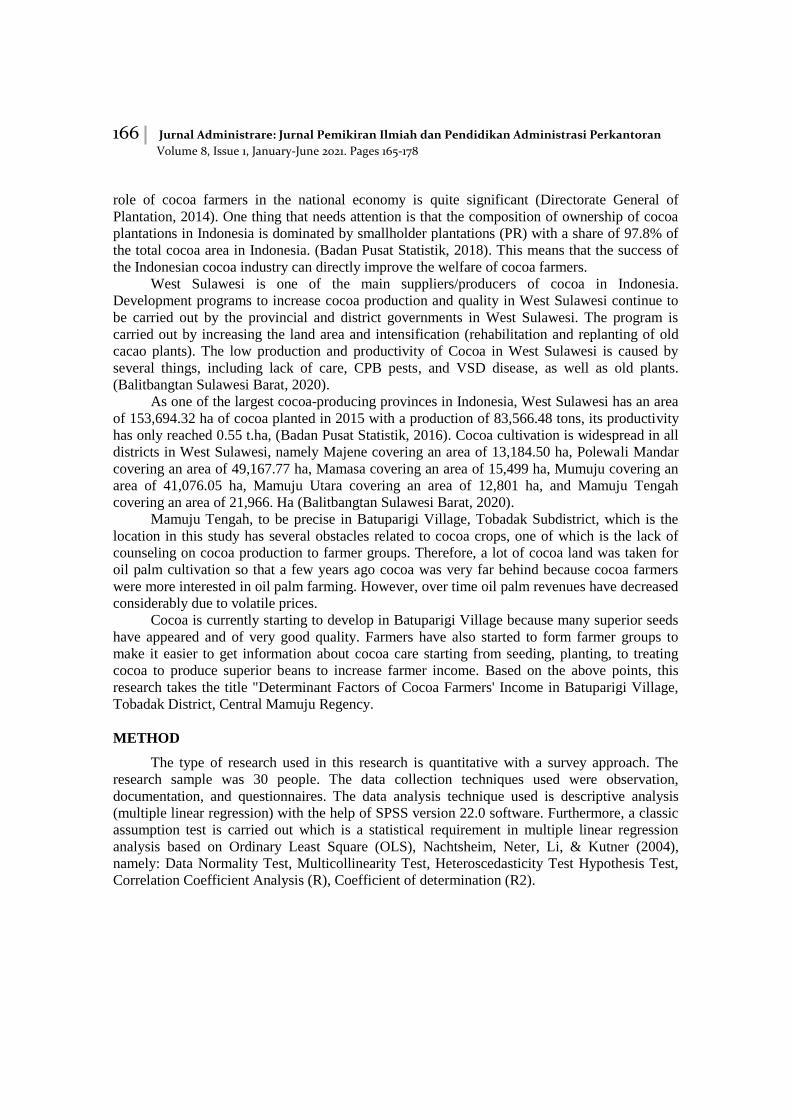
role of cocoa farmers in the national economy is quite significant (Directorate General of
Plantation, 2014). One thing that needs attention is that the composition of ownership of cocoa
plantations in Indonesia is dominated by smallholder plantations (PR) with a share of 97.8% of
the total cocoa area in Indonesia. (Badan Pusat Statistik, 2018). This means that the success of
the Indonesian cocoa industry can directly improve the welfare of cocoa farmers.
West Sulawesi is one of the main suppliers/producers of cocoa in Indonesia.
Development programs to increase cocoa production and quality in West Sulawesi continue to
be carried out by the provincial and district governments in West Sulawesi. The program is
carried out by increasing the land area and intensification (rehabilitation and replanting of old
cacao plants). The low production and productivity of Cocoa in West Sulawesi is caused by
several things, including lack of care, CPB pests, and VSD disease, as well as old plants.
(Balitbangtan Sulawesi Barat, 2020).
As one of the largest cocoa-producing provinces in Indonesia, West Sulawesi has an area
of 153,694.32 ha of cocoa planted in 2015 with a production of 83,566.48 tons, its productivity
has only reached 0.55 t.ha, (Badan Pusat Statistik, 2016). Cocoa cultivation is widespread in all
districts in West Sulawesi, namely Majene covering an area of 13,184.50 ha, Polewali Mandar
covering an area of 49,167.77 ha, Mamasa covering an area of 15,499 ha, Mumuju covering an
area of 41,076.05 ha, Mamuju Utara covering an area of 12,801 ha, and Mamuju Tengah
covering an area of 21,966. Ha (Balitbangtan Sulawesi Barat, 2020).
Mamuju Tengah, to be precise in Batuparigi Village, Tobadak Subdistrict, which is the
location in this study has several obstacles related to cocoa crops, one of which is the lack of
counseling on cocoa production to farmer groups. Therefore, a lot of cocoa land was taken for
oil palm cultivation so that a few years ago cocoa was very far behind because cocoa farmers
were more interested in oil palm farming. However, over time oil palm revenues have decreased
considerably due to volatile prices.
Cocoa is currently starting to develop in Batuparigi Village because many superior seeds
have appeared and of very good quality. Farmers have also started to form farmer groups to
make it easier to get information about cocoa care starting from seeding, planting, to treating
cocoa to produce superior beans to increase farmer income. Based on the above points, this
research takes the title "Determinant Factors of Cocoa Farmers' Income in Batuparigi Village,
Tobadak District, Central Mamuju Regency.
METHOD
The type of research used in this research is quantitative with a survey approach. The
research sample was 30 people. The data collection techniques used were observation,
documentation, and questionnaires. The data analysis technique used is descriptive analysis
(multiple linear regression) with the help of SPSS version 22.0 software. Furthermore, a classic
assumption test is carried out which is a statistical requirement in multiple linear regression
analysis based on Ordinary Least Square (OLS), Nachtsheim, Neter, Li, & Kutner (2004),
namely: Data Normality Test, Multicollinearity Test, Heteroscedasticity Test Hypothesis Test,
Correlation Coefficient Analysis (R), Coefficient of determination (R2).
Arwin Sanjaya, et al.; Determinant Factors of Income of Cocoa Farmers …| 167
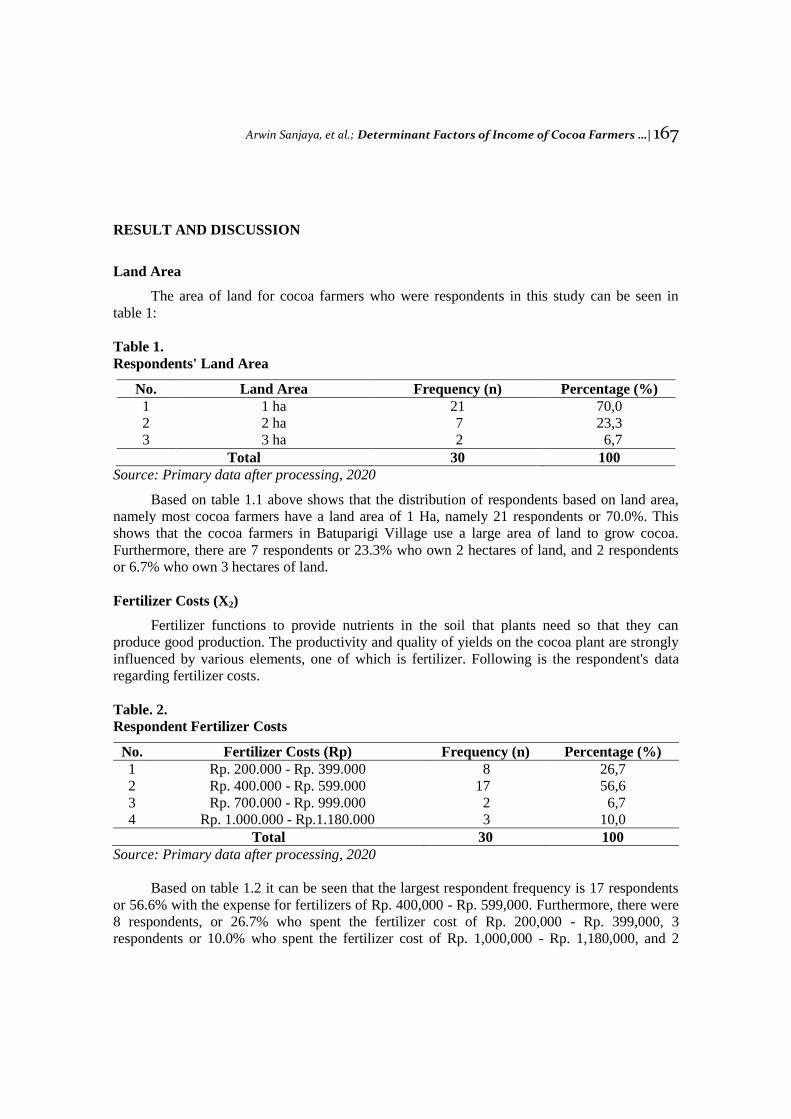
RESULT AND DISCUSSION
Land Area
The area of land for cocoa farmers who were respondents in this study can be seen in
table 1:
Table 1.
Respondents' Land Area
No. Land Area Frequency (n) Percentage (%)
1 1 ha 21 70,0
2 2 ha 7 23,3
3 3 ha 2 6,7
Total 30 100
Source: Primary data after processing, 2020
Based on table 1.1 above shows that the distribution of respondents based on land area,
namely most cocoa farmers have a land area of 1 Ha, namely 21 respondents or 70.0%. This
shows that the cocoa farmers in Batuparigi Village use a large area of land to grow cocoa.
Furthermore, there are 7 respondents or 23.3% who own 2 hectares of land, and 2 respondents
or 6.7% who own 3 hectares of land.
Fertilizer Costs (X2)
Fertilizer functions to provide nutrients in the soil that plants need so that they can
produce good production. The productivity and quality of yields on the cocoa plant are strongly
influenced by various elements, one of which is fertilizer. Following is the respondent's data
regarding fertilizer costs.
Table. 2.
Respondent Fertilizer Costs
No. Fertilizer Costs (Rp) Frequency (n) Percentage (%)
1 Rp. 200.000 - Rp. 399.000 8 26,7
2 Rp. 400.000 - Rp. 599.000 17 56,6
3 Rp. 700.000 - Rp. 999.000 2 6,7
4 Rp. 1.000.000 - Rp.1.180.000 3 10,0
Total 30 100
Source: Primary data after processing, 2020
Based on table 1.2 it can be seen that the largest respondent frequency is 17 respondents
or 56.6% with the expense for fertilizers of Rp. 400,000 - Rp. 599,000. Furthermore, there were
8 respondents, or 26.7% who spent the fertilizer cost of Rp. 200,000 - Rp. 399,000, 3
respondents or 10.0% who spent the fertilizer cost of Rp. 1,000,000 - Rp. 1,180,000, and 2
168 Jurnal Administrare: Jurnal Pemikiran Ilmiah dan Pendidikan Administrasi Perkantoran
Volume 8, Issue 1, January-June 2021. Pages 165-178
respondents or 6.7% who spent the fertilizer cost of Rp. 700,000 - Rp. 999,000. The percentage
of fertilizer costs incurred by cocoa farmers is quite a lot, due to the relatively expensive price
of fertilizer.
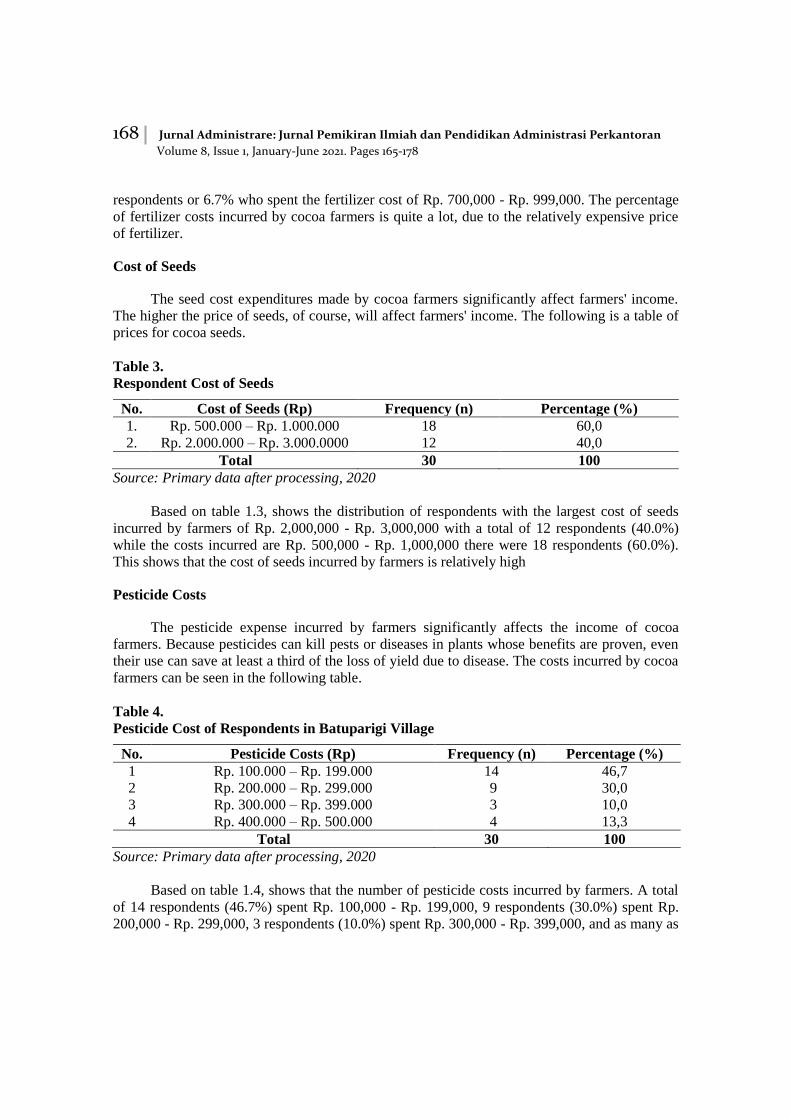
Cost of Seeds
The seed cost expenditures made by cocoa farmers significantly affect farmers' income.
The higher the price of seeds, of course, will affect farmers' income. The following is a table of
prices for cocoa seeds.
Table 3.
Respondent Cost of Seeds
No. Cost of Seeds (Rp) Frequency (n) Percentage (%)
1. Rp. 500.000 – Rp. 1.000.000 18 60,0
2. Rp. 2.000.000 – Rp. 3.000.0000 12 40,0
Total 30 100
Source: Primary data after processing, 2020
Based on table 1.3, shows the distribution of respondents with the largest cost of seeds
incurred by farmers of Rp. 2,000,000 - Rp. 3,000,000 with a total of 12 respondents (40.0%)
while the costs incurred are Rp. 500,000 - Rp. 1,000,000 there were 18 respondents (60.0%).
This shows that the cost of seeds incurred by farmers is relatively high
Pesticide Costs
The pesticide expense incurred by farmers significantly affects the income of cocoa
farmers. Because pesticides can kill pests or diseases in plants whose benefits are proven, even
their use can save at least a third of the loss of yield due to disease. The costs incurred by cocoa
farmers can be seen in the following table.
Table 4.
Pesticide Cost of Respondents in Batuparigi Village
No. Pesticide Costs (Rp) Frequency (n) Percentage (%)
1 Rp. 100.000 – Rp. 199.000 14 46,7
2 Rp. 200.000 – Rp. 299.000 9 30,0
3 Rp. 300.000 – Rp. 399.000 3 10,0
4 Rp. 400.000 – Rp. 500.000 4 13,3
Total 30 100
Source: Primary data after processing, 2020
Based on table 1.4, shows that the number of pesticide costs incurred by farmers. A total
of 14 respondents (46.7%) spent Rp. 100,000 - Rp. 199,000, 9 respondents (30.0%) spent Rp.
200,000 - Rp. 299,000, 3 respondents (10.0%) spent Rp. 300,000 - Rp. 399,000, and as many as

Arwin Sanjaya, et al.; Determinant Factors of Income of Cocoa Farmers …| 169
4 respondents (13.3%) spent Rp. 400,000 - Rp. 500,000. The expenditure on pesticides is
directly proportional to the area of land owned by each farmer.
Labor
To get an overview of the labor used by cocoa farmers in Batuparigi Village, it can be
seen in the following table.
Table 5.
The labor used by the Respondents
No. Total Labor Frequency (n) Percentage (%)
1 1 – 2 8 26,7
2 3 – 4 17 56,6
3 5 – 6 5 16,7
Total 30 100
Source: Primary data after processing, 2020
Based on table 1.5, shows that as many as 8 respondents (26.7%) used 1 to 2 workers, 17
respondents (56.6%) used 3 to 4 people, and 5 respondents (16.7%) used to labor. 5 to 6 people.
The lower the labor, the lower the costs. Labor that is employed (used) only at harvest time. In
other words, the more labor is used, the more efficient the time is used at harvesting.
Income
Income is the result received from the process of economic activity to meet daily needs. The
average income that each person has is called per capita income and is a measure of economic
progress and development. The following is the respondent's data based on the income earned
during the harvest season.
Table 6.
Respondent Income
Income Frequency (n) Percentage (%)
1. Rp. 1.000.000 – Rp. 5.000.000 22 73,3
2. Rp. 5.500.000 – Rp. 10.000.000 5 16,7
3. Rp. 15.000.000 – Rp. 20.000.000 3 10,0
Total 30 100
Source: Primary data after processing, 2020
Based on table 1.6, it can be seen that the distribution of income obtained by respondents in
Batuparigi Village is the most dominant, namely cocoa farmers with an income of Rp.
1,000,000 - Rp. 5,000,000 as many as 22 respondents (73.3%). Furthermore, 5 respondents
(16.7%) had an income of Rp. 5,500,000 - Rp. 10,000,000, and 3 respondents (10.0%) have an
income of Rp. 15,000,000 - Rp. 20,000,000. In other words, this is a tangible result of the
benefits of increased production and productivity of cocoa farmers' income in Batuparigi
Village, Tobadak District, Central Mamuju Regency.
170 Jurnal Administrare: Jurnal Pemikiran Ilmiah dan Pendidikan Administrasi Perkantoran
Volume 8, Issue 1, January-June 2021. Pages 165-178
Classic Assumption Test
The normality test aims to determine whether in the regression model confounding or
residual variables have a normal distribution. There are several ways to detect whether the
residuals are normally distributed or not, one of which is by using graph analysis. Graph
analysis is used by looking at the histogram and pp-plot on normality testing. If the residual on
the histogram forms a bell and the residual on the pp-plot follows the diagonal line, it can be
assessed that the research data is normally distributed. (Ghozali, 2016). Based on the results of normality testing using the histogram graph analysis method and
PP-Plot, it is known that the residuals on the histogram form a bell, and the residuals on the PP-
Plot follow the diagonal line, which means that the research data is normally distributed.
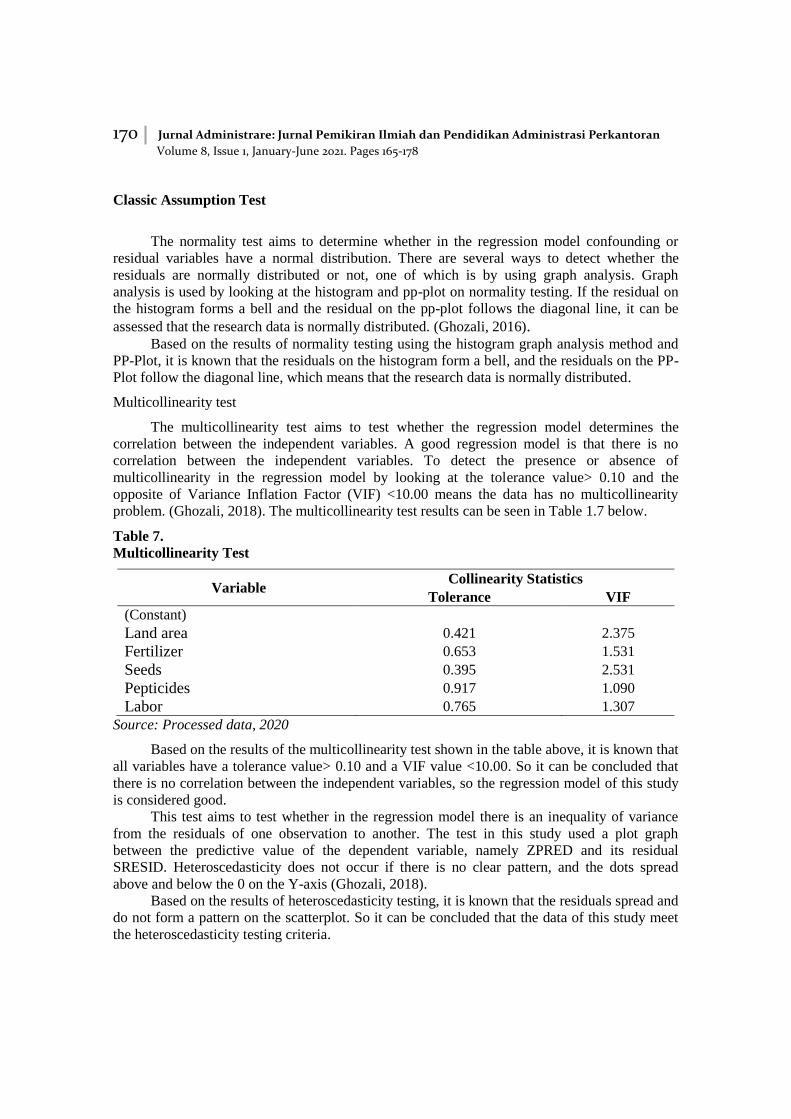
Multicollinearity test
The multicollinearity test aims to test whether the regression model determines the
correlation between the independent variables. A good regression model is that there is no
correlation between the independent variables. To detect the presence or absence of
multicollinearity in the regression model by looking at the tolerance value> 0.10 and the
opposite of Variance Inflation Factor (VIF) <10.00 means the data has no multicollinearity
problem. (Ghozali, 2018). The multicollinearity test results can be seen in Table 1.7 below.
Table 7.
Multicollinearity Test
Variable Collinearity Statistics
Tolerance VIF
(Constant)
Land area 0.421 2.375
Fertilizer 0.653 1.531
Seeds 0.395 2.531
Pepticides 0.917 1.090
Labor 0.765 1.307
Source: Processed data, 2020
Based on the results of the multicollinearity test shown in the table above, it is known that
all variables have a tolerance value> 0.10 and a VIF value <10.00. So it can be concluded that
there is no correlation between the independent variables, so the regression model of this study
is considered good.
This test aims to test whether in the regression model there is an inequality of variance
from the residuals of one observation to another. The test in this study used a plot graph
between the predictive value of the dependent variable, namely ZPRED and its residual
SRESID. Heteroscedasticity does not occur if there is no clear pattern, and the dots spread
above and below the 0 on the Y-axis (Ghozali, 2018).
Based on the results of heteroscedasticity testing, it is known that the residuals spread and
do not form a pattern on the scatterplot. So it can be concluded that the data of this study meet
the heteroscedasticity testing criteria.
Arwin Sanjaya, et al.; Determinant Factors of Income of Cocoa Farmers …| 171
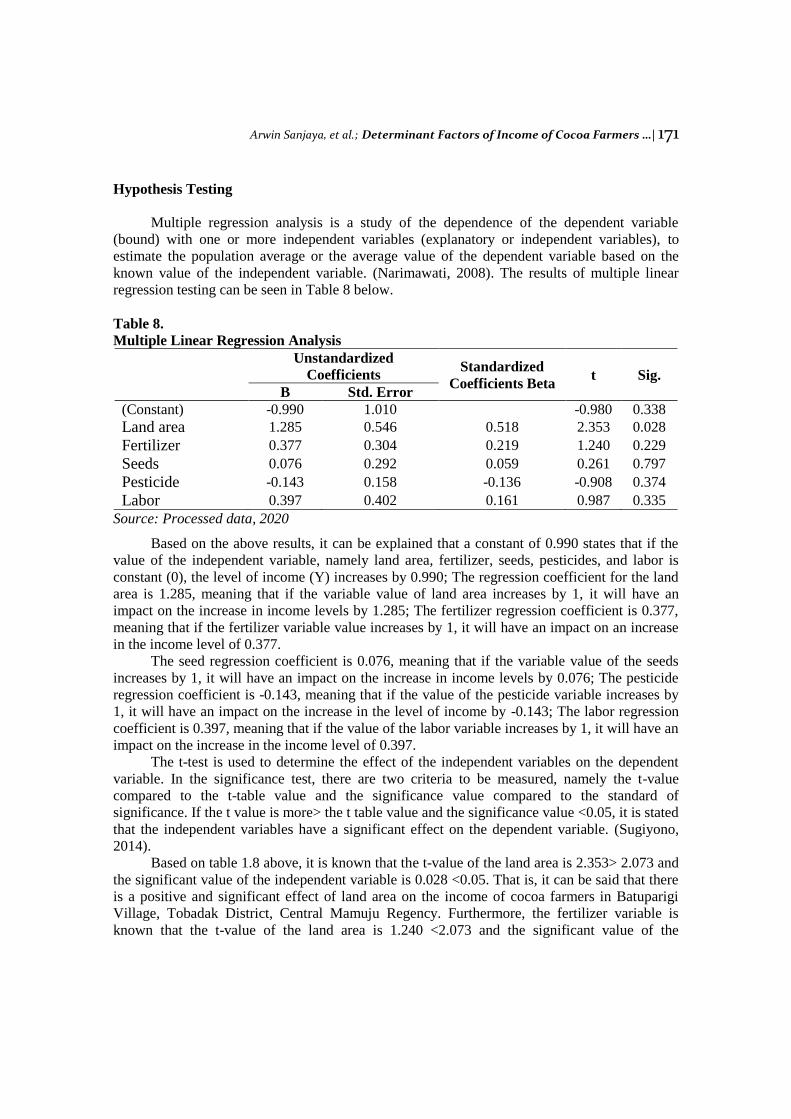
Hypothesis Testing
Multiple regression analysis is a study of the dependence of the dependent variable
(bound) with one or more independent variables (explanatory or independent variables), to
estimate the population average or the average value of the dependent variable based on the
known value of the independent variable. (Narimawati, 2008). The results of multiple linear
regression testing can be seen in Table 8 below.
Table 8.
Multiple Linear Regression Analysis
Unstandardized
Coefficients Standardized
Coefficients Beta t Sig.
B Std. Error
(Constant) -0.990 1.010
-0.980 0.338
Land area 1.285 0.546 0.518 2.353 0.028
Fertilizer 0.377 0.304 0.219 1.240 0.229
Seeds 0.076 0.292 0.059 0.261 0.797
Pesticide -0.143 0.158 -0.136 -0.908 0.374
Labor 0.397 0.402 0.161 0.987 0.335
Source: Processed data, 2020
Based on the above results, it can be explained that a constant of 0.990 states that if the
value of the independent variable, namely land area, fertilizer, seeds, pesticides, and labor is
constant (0), the level of income (Y) increases by 0.990; The regression coefficient for the land
area is 1.285, meaning that if the variable value of land area increases by 1, it will have an
impact on the increase in income levels by 1.285; The fertilizer regression coefficient is 0.377,
meaning that if the fertilizer variable value increases by 1, it will have an impact on an increase
in the income level of 0.377.
The seed regression coefficient is 0.076, meaning that if the variable value of the seeds
increases by 1, it will have an impact on the increase in income levels by 0.076; The pesticide
regression coefficient is -0.143, meaning that if the value of the pesticide variable increases by
1, it will have an impact on the increase in the level of income by -0.143; The labor regression
coefficient is 0.397, meaning that if the value of the labor variable increases by 1, it will have an
impact on the increase in the income level of 0.397.
The t-test is used to determine the effect of the independent variables on the dependent
variable. In the significance test, there are two criteria to be measured, namely the t-value
compared to the t-table value and the significance value compared to the standard of
significance. If the t value is more> the t table value and the significance value <0.05, it is stated
that the independent variables have a significant effect on the dependent variable. (Sugiyono,
2014).
Based on table 1.8 above, it is known that the t-value of the land area is 2.353> 2.073 and
the significant value of the independent variable is 0.028 <0.05. That is, it can be said that there
is a positive and significant effect of land area on the income of cocoa farmers in Batuparigi
Village, Tobadak District, Central Mamuju Regency. Furthermore, the fertilizer variable is
known that the t-value of the land area is 1.240 <2.073 and the significant value of the
172 Jurnal Administrare: Jurnal Pemikiran Ilmiah dan Pendidikan Administrasi Perkantoran
Volume 8, Issue 1, January-June 2021. Pages 165-178
independent variable is 0.229> 0.05. Thus, it can be concluded that there is no positive and
significant effect of fertilizers on the income of cocoa farmers. In the seed variable, it is known
that the t-value of the land area is 0.261 <2.073 and the significant value of the independent
variable is 0.797> 0.05. This means that there is no positive and significant effect of seeds on
the income of cocoa farmers. Meanwhile, the pesticide variable shows that the t-value of the
land area is -0.908 <2.073 and the significant value of the independent variable is 0.274> 0.05.
This means that there is no positive and significant effect of pesticides on the income of cocoa
farmers. For the labor variable, it is known that the t-value of the land area is 0.987 <2.073 and
the significant value of the independent variable is 0.335> 0.05. This means that it can be
concluded that there is no positive and significant effect of labor on the income of cocoa
farmers.
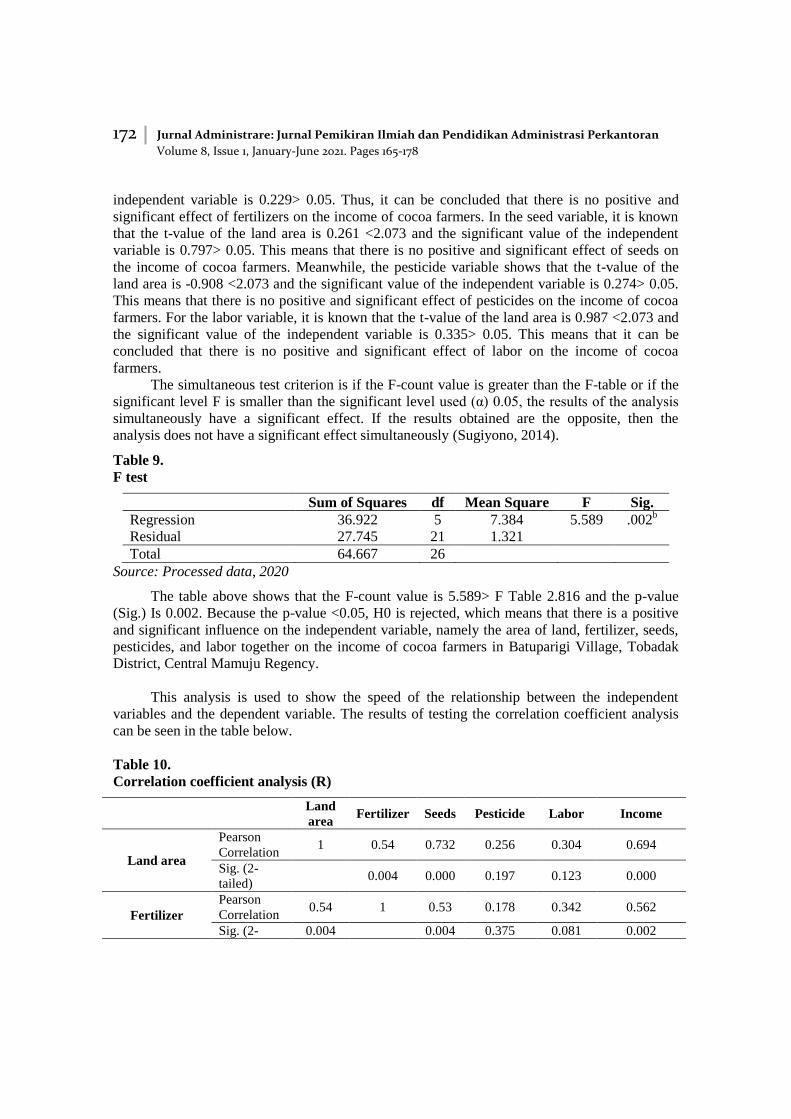
The simultaneous test criterion is if the F-count value is greater than the F-table or if the
significant level F is smaller than the significant level used (α) 0.05, the results of the analysis
simultaneously have a significant effect. If the results obtained are the opposite, then the
analysis does not have a significant effect simultaneously (Sugiyono, 2014).
Table 9.
F test
Sum of Squares df Mean Square F Sig.
Regression 36.922 5 7.384 5.589 .002b
Residual 27.745 21 1.321
Total 64.667 26
Source: Processed data, 2020
The table above shows that the F-count value is 5.589> F Table 2.816 and the p-value
(Sig.) Is 0.002. Because the p-value <0.05, H0 is rejected, which means that there is a positive
and significant influence on the independent variable, namely the area of land, fertilizer, seeds,
pesticides, and labor together on the income of cocoa farmers in Batuparigi Village, Tobadak
District, Central Mamuju Regency.
This analysis is used to show the speed of the relationship between the independent
variables and the dependent variable. The results of testing the correlation coefficient analysis
can be seen in the table below.
Table 10.
Correlation coefficient analysis (R)
Land
area Fertilizer Seeds Pesticide Labor Income
Land area
Pearson
Correlation 1 0.54 0.732 0.256 0.304 0.694
Sig. (2-
tailed) 0.004 0.000 0.197 0.123 0.000
Fertilizer
Pearson
Correlation 0.54 1 0.53 0.178 0.342 0.562
Sig. (2- 0.004
0.004 0.375 0.081 0.002

Arwin Sanjaya, et al.; Determinant Factors of Income of Cocoa Farmers …| 173
tailed)
Seeds
Pearson
Correlation 0.732 0.53 1 0.217 0.451 0.598
Sig. (2-
tailed) 0.000 0.004
0.277 0.018 0.001
Pesticide
Pearson
Correlation 0.256 0.178 0.217 1 0.201 0.082
Sig. (2-
tailed) 0.197 0.375 0.277
0.315 0.686
Labor
Pearson
Correlation 0.304 0.342 0.451 0.201 1 0.393
Sig. (2-
tailed) 0.123 0.081 0.018 0.315
0.042
Income
Pearson
Correlation 0.694 0.562 0.598 0.082 0.393 1
Sig. (2-
tailed) 0.000 0.002 0.001 0.686 0.042
Source: Processed data, 2020
Based on the table above, it is known that the land area has a significance value of 0.000
<0.05, which means that the land area has a fast relationship with the income of cocoa farmers
in Batuparigi Village, Tobadak District, Central Mamuju Regency. For the fertilizer variable, it
has a significant value of 0.002 <0.05, which means that fertilizer has a fast relationship with
the income of cocoa farmers. The seed variable has a significant value of 0.001 <0.05, which
means that the seeds have a fast relationship with the income of cocoa farmers. While the
pesticide variable has a significant value of 0.686 <0.05, which means that the pesticide does
not have a past relationship with the income of cocoa farmers. Finally, the labor variable has a
significant value of 0.042 <0.05, which means that labor has a fast relationship with the income
of cocoa farmers.
Classification test of determination used where the value of determination can be grouped
as follows: 0.41 to 0.70 correlation is strong, 0.71 to 0.90 is very strong, 0.91 to 0.00 is very
strong, and if 1 means perfect (Sugiyono, 2014). The results of the correlation analysis test can
be seen in the following table 1.11.
Table 11.
Determination Test
Model R R
Square
Adjusted R
Square
Std. Error of the
Estimate
1 .756a 0.571 0.469 1.149
Source: Processed data, 2020
The table above shows that the R2 value which is the value of the contribution of
independent variables, namely the area of land, fertilizers, seeds, pesticides, and labor to the

174 Jurnal Administrare: Jurnal Pemikiran Ilmiah dan Pendidikan Administrasi Perkantoran
Volume 8, Issue 1, January-June 2021. Pages 165-178
income of cocoa farmers in Batuparigi Village, Tobadak District, Mamuju Tengah Regency is
0.571 or 57.1 percent. This shows that the independent variable contributes to the increase in the
income of cocoa farmers, while the remaining 42.9 percent is the value of the contribution of the
influence that comes from other variables not examined in this study.
Discussion
The Influence of Land Area on Income of Cocoa Farmers
From the research results, it can be seen that the land area has a positive and significant
effect on the income of cocoa farmers. It can be seen that the t-count value is greater than the t-
table (2.353> 2.073) with a significance of 0.000 from the significant level of 0.05. Thus, land
area is one of the most important factors in the amount of income earned by cocoa farmers.
Land area is an important thing in agriculture because it will affect income. In other words, the
larger the land area, the higher or higher the yield. This is following research Pali (2016),
Wonda & Tomayahu (2018), Yormawi (2019), Nopiyanti (2020).
The Influence of Fertilizer Costs on Cocoa Farmers' Income
Fertilizer is what is needed in a plant such as cocoa because it will produce quality fruit,
but if they use of fertilizers is not regular, it will have a bad impact on the cocoa plant. This is
following the opinion Adisarwanto, (2008) said that applying fertilizers with the right
composition can produce quality products, but if they use of fertilizers is not according to the
right composition it can produce low-quality products.
Based on table 8, it can be seen that the cost of fertilizer does not have a significant effect
on the income of cocoa farmers. This is following the research of Cut & Irwanto (2017), but
different from the research conducted Ambarita & Kartika (2015). Fertilizer affects income
because applying fertilizer to plants can maintain the nutrients in the plant and improve and
provide plant content that is lacking or even unavailable on the ground to support plant growth.
To be able to increase higher income, it must be followed by the use of fertilizers regularly and
correctly, because the use of high doses of fertilizer for cocoa plants will reduce productivity in
the cocoa plant itself, thus affecting income.
The Influence of Seed Costs on Cocoa Farmers' Income
The use of seed costs incurred by farmers quite influences farmers 'income, although the
test results show that the effect of seed costs incurred by farmers affects cocoa farmers' income.
High-quality cocoa seeds come from superior varieties which is one of the factors that ensure
qualitative cocoa farmers' yields play an important role in increasing production. The cocoa
seeds in Batuparigi Village are superior seeds that are imported from outside the region so that
they affect the income of cocoa farmers. If farmers can take good care of the planted cocoa
seeds, the farmer's income will also increase.
From table 8 it can be seen that the cost of seeds affects, but not significantly, on the
income of cocoa farmers. This can be seen from the t-value which is smaller than the t-table
0.261 <2.073 with a significance of 0.797> 0.05. This is following the research by Cut &
Irwanto (2017).

Arwin Sanjaya, et al.; Determinant Factors of Income of Cocoa Farmers …| 175
The Influence of Pesticide Costs on Cocoa Farmers' Income
In table 8 it can be seen that the cost of pesticides does not have a positive and significant
impact on the income of cocoa farmers. This can be seen from the t-count value which is
smaller than the t-table -0.908 <2.073, with a significance of 0.274> 0.05. In general, the use of
pesticides plays a role in the income of cocoa farmers. The use of pesticides as a production
factor has proven that pesticides rapidly reduce pest populations so that attacks can be
prevented, and crop loss can be prevented. However, this study found that pesticides did not
have a positive and significant effect on cocoa farmers' income, as in the study (Cut & Irwanto,
2017).
The Influence of Labor on the Income of Cocoa Farmers
In table 8, it can be seen that labor has no positive and significant effect on cocoa farmer
income. This is different from research by Miswar, (2017) who argues that labor has a positive
and significant effect on the income of cocoa farmers in Peunaron District. In other words, the
direction of the relationship between the number of workers and income is unidirectional, where
an increase or decrease in the number of workers will result in an increase or decrease in the
income of cocoa farmers.
Labor is one of the variables that affect the income of cocoa farmers. Skills and
knowledge are needed to further increase the income of cocoa farmers so that they do not find it
difficult to care for cocoa plants. According to previous research Pali (2016) labor is an
important factor in cocoa farming. Labor is a supporting factor for other products because it also
determines the production process in numbers which are not only seen from the availability of
labor but also the quality and type of labor that need to be considered.
CONCLUSION
The determinant factors of income of cocoa farmers in Batuparigi Village, Tobadak
District, Central Mamuju Regency, are land area, cost of fertilizer, cost of seeds, cost of
pesticides, and labor. The land area has a significant effect on the income of cocoa farmers
because the more land they have, the more land they have, the more land is planted by farmers.
Meanwhile, the cost of fertilizers, the cost of seeds, the cost of pesticides, and labor do not have
a significant effect on the income of cocoa farmers because the use of large amounts of
fertilizers that do not match the dosage and type of fertilizer will reduce income. Likewise with
the cost of seedlings, although the more seeds planted, the higher the production yields, but the
maximum limit on the use of seeds must also be considered carefully because if it crosses the
limit it will affect the production and income of cocoa farmers. The cost of pesticides does not
have a significant effect on income, because excessive use of pesticides is not friendly to the
environment and also the nutrients in the soil, in the long run, will be eroded, which will reduce
income. And, the number of workers does not have a significant effect on the income of cocoa
farmers because the more labor is used, the more costs will be incurred to provide wages.
176 Jurnal Administrare: Jurnal Pemikiran Ilmiah dan Pendidikan Administrasi Perkantoran
Volume 8, Issue 1, January-June 2021. Pages 165-178
REFERENCES
Adisarwanto, T. (2008). Efisiensi penggunaan pupuk kalium pada kedelai di lahan sawah.
Buletin Palawija, 7–8, 30–38.
Ambarita, J. P., & Kartika, I. N. (2015). Pengaruh luas lahan, penggunaan pestisida, tenaga
kerja, pupuk terhadap produksi kopi di Kecamatan Pekutatan Kabupaten Jembrana. E-
Jurnal Ekonomi Pembangunan Universitas Udayana, 4(7), 44553.
Badan Pusat Statistik. (2016). Luas Tanaman Perkebunan yang Menghasilkan Menurut
Kabupaten (Hektar).
Badan Pusat Statistik. (2018). Statistik Kakao Indonesia 2017.
Balitbangtan Sulawesi Barat, B. (2020). Kiat Sukses Berusaha Tani Kakao.
Cut, G., & Irwanto. (2017). Pengaruh Biaya Produksi, Pengalaman, Dan Keterampilan
Terhadap Pendapatan Usahatani Kakao (Theobroma Cacao) Di Kecamatan Karang Baru.
AGRISAMUDRA, 4 No. 2.
Direktorat Jenderal Perkebunan. (2015). Rencana Strategis Direktorat Jenderal Perkebunan
Tahun 2015-2019.
Ghozali, I. (2016). Aplikasi Analisis Multivariate dengan Program IBM SPSS 23. (Edisi 8).
Semarang: Badan Penerbit Universitas Diponegoro.
Ghozali, I. (2018). Aplikasi analisis multivariete dengan program IBM SPSS 23.
IEI dan UNIED. (2019). Proyeksi Ekspor Berdasarkan Industri: Komoditas Unggulan.
Indonesia Eximbank.
Miswar, M. (2017). Pengaruh Penggunaan Pupuk, Tenaga Kerja Dan Luas Areal Terhadap
Pendapatan Petani Coklat Di Kecamatan Peunaron Kabupaten Aceh Timur. Jurnal
Samudra Ekonomika, 1(2), 142–150.
Munarso, S. J. (2016). Penanganan Pascapanen untuk Peningkatan Mutu dan Daya Saing
Komoditas Kakao. J Litbang Pertan, 3(35), 111–120.
Nachtsheim, C. J., Neter, J., Li, W., & Kutner, M. H. (2004). Applied Linear Statistical Models.
Journal Of The Royal Statistical Society Series A General. Https://Doi.
Org/10.2307/2984653.
Narimawati, U. (2008). Metodologi Penelitian Kualitatif dan Kuantitatif; Teori dan Aplikasi.
Agung Media.
Nopiyanti. (2020). Pengaruh Luas Lahan, Jumlah Produksi dan Jumlah Tenaga Kerja
Terhadap Pendapatan Usaha Petani Kopi di Kelurahan Kota Baru Kecamatan Lahat
Kabupaten Lahat. UIN Raden Fatah Palembang.
Pali, A. (2016). Faktor-faktor yang Mempengaruhi Pendapatan Usahatani Jagung di Desa
Bontokassi Kecamatan Galesong Selatan Kabupaten Takalar. Universitas Islam Negeri
Alauddin Makassar.

Arwin Sanjaya, et al.; Determinant Factors of Income of Cocoa Farmers …| 177
Prastowo, B., Karmawati, E., Rubijo, S., Indrawanto, C., & Munarso, S. J. (2010). Budidaya
dan Pasca Panen Kopi. Pusat Penelitian Dan Pengembangan Perkebunan. Bogor, 70.
Sugiyono. (2014). Metode Penelitian Pendidikan pendekatan Kuantitatif, Kualitatif dan R&D.
In Metode Penelitian Ilmiah.
Wonda, M., & Tomayahu, E. (2018). Pendapatan Usahatani Tanaman Kakao (Teobroma kakao)
Di Kelurahan Hinekombe, Distrik Waibu, Kabupaten Jayapura. Agrologia, 5(1).
Yormawi, I. (2019). Analisis Faktor-Faktor Sosial Ekonomi yang Mempengaruhi Pendapatan
Petani Kakao di Desa Pasapa Kecamatan Budong-Budong Kabupaten Mamuju Tengah
Provinsi Sulawesi Barat. LaGeografia, 16(1), 6–19.
178 Jurnal Administrare: Jurnal Pemikiran Ilmiah dan Pendidikan Administrasi Perkantoran
Volume 8, Issue 1, January-June 2021. Pages 165-178
This page is intentionally left blank
This page is intentionally left blank