Embed Size (px)
Citation preview
Adusei, Cogent Business & Management (2016), 3: 1199519http://dx.doi.org/10.1080/23311975.2016.1199519
BANKING & FINANCE | RESEARCH ARTICLE
Determinants of bank technical efficiency: Evidence from rural and community banks in GhanaMichael Adusei1*
Abstract: What are the determinants of the technical efficiency of rural and com-munity banks in Ghana? This paper addresses this question with data from 101 rural and community banks in Ghana. Data envelopment analysis based on the variable return to scale assumption and binary logistic regression technique has been used for analysis. The results show that only 20 rural and community banks are techni-cally efficient. The binary logistic regression analysis provides evidence that size, profitability, and bank funding quality are significant determinants of technical efficiency in the rural banking industry in Ghana. Whereas an increase in the size and funding quality of a rural bank results in a decrease in its technical efficiency, an increase in the profitability of a rural bank improves its technical efficiency. It can be inferred from these results that the resource utilization of many rural and commu-nity banks in Ghana is weak and that the resource utilization performance of a rural bank can be assessed by considering its size, profitability, and funding quality.
Subjects: Area Studies; Economics, Finance, Business & Industry; Social Sciences
Keywords: rural and community banks; technical efficiency; data envelopment analysis; Ghana
JEL classifications: G20; G21
*Corresponding author: Michael Adusei, Department of Accounting and Finance, Kwame Nkrumah University of Science and Technology, Kumasi, Ghana E-mail: [email protected]
Reviewing editor:David McMillan, University of Stirling, UK
Additional information is available at the end of the article
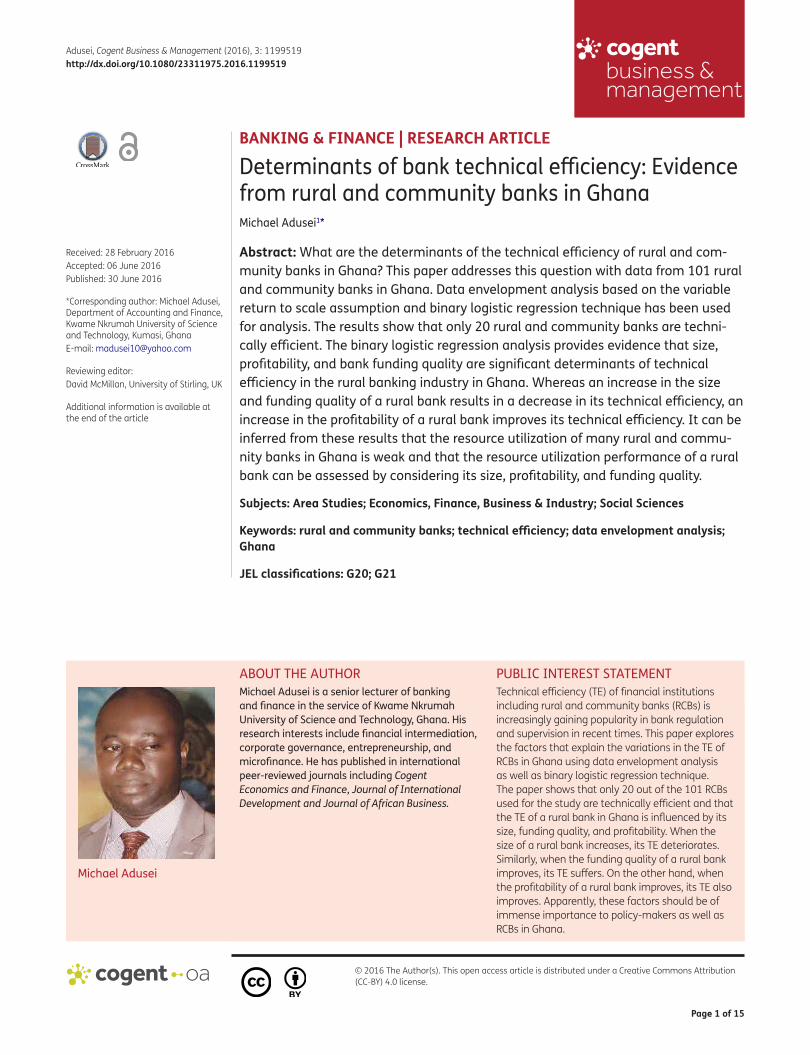
ABOUT THE AUTHORMichael Adusei is a senior lecturer of banking and finance in the service of Kwame Nkrumah University of Science and Technology, Ghana. His research interests include financial intermediation, corporate governance, entrepreneurship, and microfinance. He has published in international peer-reviewed journals including Cogent Economics and Finance, Journal of International Development and Journal of African Business.
PUBLIC INTEREST STATEMENT Technical efficiency (TE) of financial institutions including rural and community banks (RCBs) is increasingly gaining popularity in bank regulation and supervision in recent times. This paper explores the factors that explain the variations in the TE of RCBs in Ghana using data envelopment analysis as well as binary logistic regression technique. The paper shows that only 20 out of the 101 RCBs used for the study are technically efficient and that the TE of a rural bank in Ghana is influenced by its size, funding quality, and profitability. When the size of a rural bank increases, its TE deteriorates. Similarly, when the funding quality of a rural bank improves, its TE suffers. On the other hand, when the profitability of a rural bank improves, its TE also improves. Apparently, these factors should be of immense importance to policy-makers as well as RCBs in Ghana.
Received: 28 February 2016Accepted: 06 June 2016Published: 30 June 2016
© 2016 The Author(s). This open access article is distributed under a Creative Commons Attribution (CC-BY) 4.0 license.
Page 1 of 15
Michael Adusei

Page 2 of 15
Adusei, Cogent Business & Management (2016), 3: 1199519http://dx.doi.org/10.1080/23311975.2016.1199519
1. IntroductionThere is no doubt that the instability of the banking sector poses a serious threat to the foundations of every economy. This is because when a lot of banks become distressed in the banking industry resources are misallocated, overall return on capital drops and high transaction costs are incurred in the industry. The cumulative effect is that the growth of the sector in particular as well as the growth of the economy in general is undermined (Kumar, 2008). It is for this reason that bank performance measurement is at the heart of bank regulation in every economy.
One measure of bank performance which could indicate the vulnerability of a bank to financial distress is technical efficiency (TE). TE measures the distance of a firm’s performance from the best-practice frontier that represents the optimal use of resources (Yin, Yang, & Mehran, 2013). It indi-cates the resource utilization performance of a firm relative to its peers.
The TE measurement of banks is of paramount importance to central banks in assessing the effects of policy interventions such as deregulation in the banking industry. Besides, in a vibrant and competi-tive banking system, only strong technically efficient and profitable banks can promise a realistic return to their stakeholders and reduce the probability of bankruptcy. Consistent with this postula-tion, the banking literature is flooded with studies on the TE of commercial banks (Fujii, Managi, & Matousek, 2014; Homma, Tsutsui, & Uchida, 2014; Hou, Wang, & Zhang, 2014; Rosman, Wahab, & Zainol, 2014; Shyu & Chiang, 2012; Sufian, 2009; Tecles & Tabak, 2010; Yin et al., 2013). However, what is observable about these studies is that most of them truncate their investigations at assessing only the TE of the financial institutions they investigate. They fail to extend their investigations to identify the factors that predict TE. Only few of these studies have explored the factors that account for TE (e.g. Al-Gasaymeh, 2016; Řepková, 2015; Rosman et al., 2014; Singh & Fida, 2015; Sufian, 2009).
The purpose of this paper, therefore, is to expand the frontiers of the empirical literature on the deter-minants of bank TE with data from the rural banking industry in Ghana. The paper shows that only 20 out of the 101 rural and community banks (RCBs) used for the study are technically efficient and that the TE of a rural bank in Ghana is influenced by its size, funding quality, and profitability. When the size of a rural bank increases, its TE deteriorates. Similarly, when the funding quality of a rural bank improves, its TE suffers. On the other hand, when the profitability of a rural bank improves, its TE also improves.
The current study is different from a recent one on RCBs in Ghana done by Iddrisu, Aboagye, and Osei (2014) in that it employs current data, utilizes a larger sample size, and transcends the borders of hackneyed mere analysis of TE to explore the factors that account for RCBs’ TE. Consequently, it should offer a better understanding of the TE of RCBs in Ghana than the previous study.
The value of this paper is founded on the following reasons. First, the paper contributes to the ongoing debate on the effect of size on bank TE with evidence from the rural banking industry that bank size hurts bank TE. This contribution is especially significant because, over the years, the debate on the size-TE hypothesis has revolved around commercial banks. Thus, the current evidence repre-sents a new perspective on the size-TE hypothesis. Second, to the extent apparently that studies on the determinants of bank TE have not considered the effect of funding quality on bank TE, its inclu-sion in the current study represents an extension of the frontiers of the bank TE literature. Third, the finding that bank profitability supports bank TE reinforces the theoretical and empirical position that there is an inextricable link between bank profitability and bank TE. Fourth, in terms of policy signifi-cance, the study provides a hint to policy-makers in Ghana that most RCBs are technically inefficient which calls for efficiency-enhancing interventions.
2. Overview of rural banking in GhanaLargely, the rural banking model was integrated into the banking system in Ghana in the early 1970s to address two obstacles to rural financial intermediation (collateral and current accounts requirements of commercial banks) that had made access to credit in the rural areas very difficult (Asiedu-Mante, 2011). Before the advent of the model, a special development bank called agricultural development
Page 3 of 15
Adusei, Cogent Business & Management (2016), 3: 1199519http://dx.doi.org/10.1080/23311975.2016.1199519
bank (ADB) had been set up to promote rural financial intermediation as part of efforts to accelerate the growth of agriculture in Ghana. However, with time it became apparent that the demand for financial services in the rural areas had outgrown the capacity of ADB. This led to the introduction of the rural banking model with the establishment of Nyakrom Rural Bank in 1976. This was done at the recommendation of the two-man team sent by the Bank of Ghana to understudy the rural banking model of Philippines.
Rural banks are also called RCBs.1 They are special banks established to carry on the business of unit banking in the rural communities in Ghana. As unit banks, RCBs are not mandated to have branches; their operations are restricted to geographically defined locations. They are limited liabil-ity companies whose shares are owned by residents of the localities where they are set up with limits placed on the number of shares an individual can acquire. These limits are placed as a control mech-anism to avoid concentrated ownership structure of the banks.
The highest decision-making body in the governance system of a rural bank is the board of direc-tors. The board of a rural bank is formed with the approval of the Bank of Ghana after the prospective directors have completed and submitted the director’s questionnaire accompanied by the state-ment of affairs of their financial positions to the Bank of Ghana for review. The board of directors of a new rural bank becomes extinct at the first annual general meeting of the bank but the directors are eligible to seek re-election. Subsequently, one-third of the directors of the bank are to step down by rotation but shall be allowed to seek re-election pursuant to section 298 of the Companies Code of Ghana 1963 (ACT 179).
There are four major services offered by RCBs. These are microfinance loans, susu loans, salary loans, and commercial loans (Nair & Fissha, 2010). Table 1 provides details of major products mar-keted by RCBs.
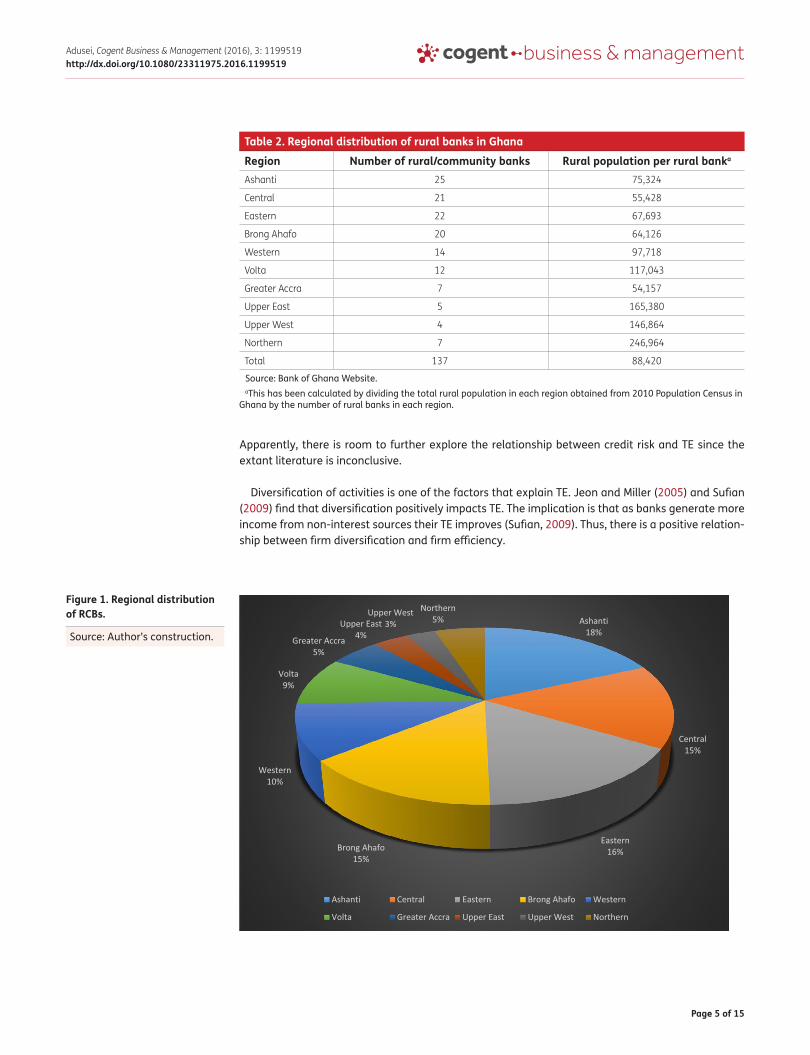
As at January 2013, when this study commenced there were 137 RCBs (www.bog.gov.gh) with the regional distribution provided in Table 2. As the table shows, in terms of absolute figures, Ashanti region has the highest number of RCBs followed by Eastern region. The region with the lowest num-ber is Upper West, accounting for only four out of the 137 RCBs in Ghana. However, in terms of rural population served by the RCBs in their regions, Central region leads with each rural bank in the region serving 55,428 rural dwellers. The region with the poorest ratio is Northern region. A rural bank in the Northern region serves 246,964 dwellers.
Figure 1 shows the regional distribution of RCBs in terms of percentages. It can be observed that Ashanti commands the highest percentage of 18 followed by Eastern region which holds 16. Upper West region has the lowest percentage of 3.
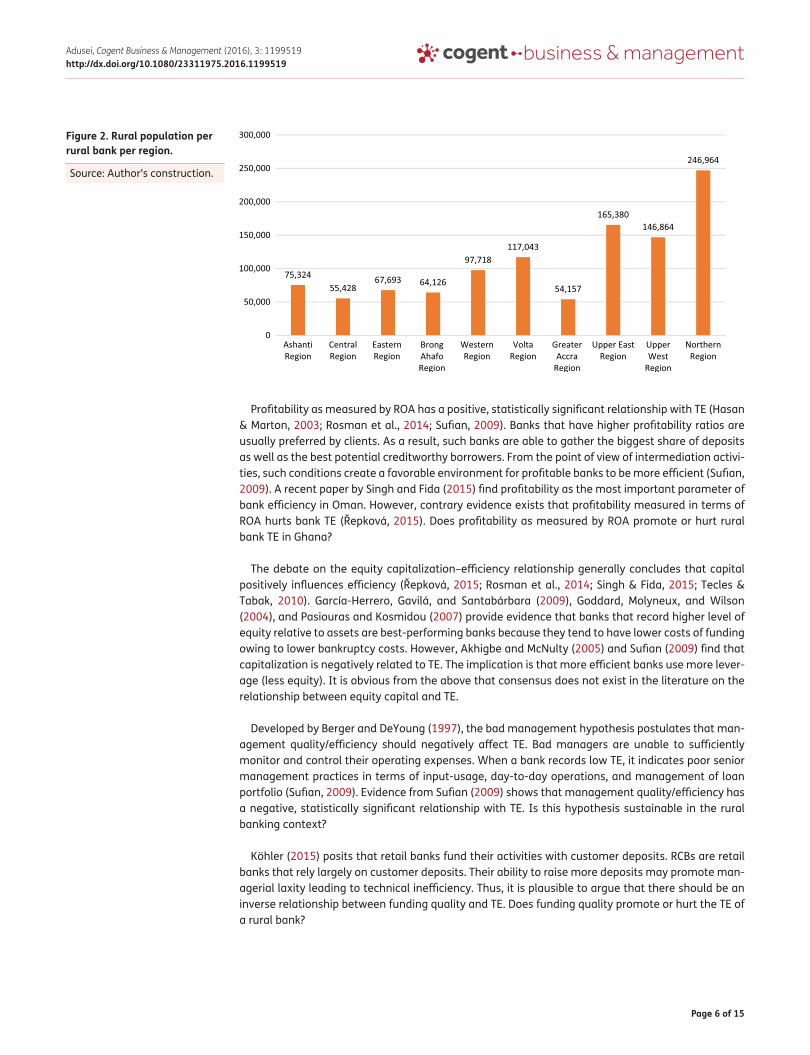
Figure 2 depicts the regional distribution of RCBs relative to regional rural population. It is observ-able that Greater Accra region has the lowest ratio followed by Central region. The region with the highest ratio is the Northern region. Apparently, Northern region needs more RCBs for efficient and effective rural financial intermediation.
3. Review of theoretical and empirical studiesThere is no doubt that the search for factors that significantly explain bank TE is increasingly gather-ing momentum in recent times (Al-Gasaymeh, 2016; Řepková, 2015; See & He, 2015; Singh & Fida, 2015). However, consensus as to the variables that significantly explain bank TE appears elusive.
The efficient structure hypothesis, the structure-conduct-performance hypothesis, and the quiet-life hypothesis provide an explanation for the effect of firm size on firm TE. Credited to Demsetz (1973), the efficient structure hypothesis suggests that under market competition efficient firms out-wit the competition and grow larger, gain greater market share, and chalk higher profits. It postu-lates that a market becomes more efficient as it becomes more concentrated. On the other hand,

Page 4 of 15
Adusei, Cogent Business & Management (2016), 3: 1199519http://dx.doi.org/10.1080/23311975.2016.1199519
the structure-conduct-performance hypothesis posits that market concentration promotes low de-gree of competition culminating in market inefficiency. The quiet-life hypothesis argues that firms in a concentrated market hardly reduce costs because of unproductive expenditures to increase and keep monopoly power, deficient managerial effort, lack of profit-maximizing behavior, and/or sur-vival of inefficient managers (Berger & Hannan, 1998).
Homma et al. (2014) use data from Japan to test the above hypotheses and report that, consistent with the efficient structure hypothesis, Japanese banks grow larger. They also report that, in line with the quite-life hypothesis, market concentration diminishes bank efficiency (Homma et al., 2014). However, Yin et al. (2013) find that bank size is negatively related to efficiency to some point (at the lower end) and that as bank size grows larger efficiency is hurt. According to Rosman et al. (2014), larger banks spend less on their inputs because of their perceived market power. Increasing returns to scale obtained from the spread of fixed costs over a large volume of services as well as increasing returns to scale gained from a specialized workforce has been cited to explain the positive relationship between size and efficiency (Hauner, 2005). On the other hand, as postulated by the quiet-life hypothesis, a negative relationship between size and efficiency is also predictable. Recent studies by Al-Gasaymeh (2016), Řepková (2015), and Singh and Fida (2015), find no significant effect of bank size on bank TE. In effect, it can be argued that the debate on the relationship between size and TE is inconclusive.
Developed by Berger and DeYoung (1997), the skimping hypothesis suggests that a bank that seeks to enhance cost efficiency as a way of maximizing long run profits may decide to cut down cost of operations in order to be cost-efficient in the short run by skimping on the resources allo-cated to loan screening and monitoring (underwriting cost). This may result in adverse selection with dire consequences for credit quality of the bank. In other words, the skimping strategy may result in the bank experiencing greater loan performance problems in the long run. The hypothesis points to a negative relationship between efficiency and credit risk. Sufian (2009) provides evidence in support of the skimping hypothesis with a study that reports a negative statistically significant relationship between credit risk and bank TE. Some studies have also reported that banks that are approaching failure tend to have low-cost efficiency and record high ratios of problem loans. Additionally, dis-tressed banks tend to deviate significantly from the best-practice frontiers (Wheelock & Wilson, 1995). However, Řepková (2015) finds no significant relationship between credit risk and TE.
Table 1. Major rural bank credit products
Source: Nair and Fissha (2010).aGH¢1 = US$4.
Loan type DescriptionMicrofinance loans These are four-to-six month loans with interest rate ranging between 30 and 36%
offered to groups of individuals to fund micro and small income-generating activi-ties. In some rural banks, the group is the borrower, in others each member of the group is the borrower. However, in both cases, the group assumes a joint liability for the loan. A microfinance loan usually does not exceed GH¢ 1000a. Mostly, the size falls between GH¢ 100 and GH¢ 500
Susu loans These are deposit-driven loans offered to individuals. The loans are offered after the client has saved with the bank (mostly daily and weekly deposits) for three months. The size of a susu loan is similar to that of a microfinance loan. The difference between a susu loan and microfinance loan is that whereas the former is given to individuals the latter is offered to groups
Salary loans These are salary-secured loans offered to workers whose salaries pass through the bank. The loans have maximum term of 48 months with interest rate ranging between 30 and 33%. Consumption, investment, and social purposes usually trigger salary loans. The size of a salary loan depends on the salary of the borrower
Commercial loans These are loans given to companies and individual entrepreneurs for working capital or fixed capital. The maximum size of a commercial loan is GH¢ 100,000, with the maximum term of 36 months and interest rate falling between 28 and 35%
Page 5 of 15
Adusei, Cogent Business & Management (2016), 3: 1199519http://dx.doi.org/10.1080/23311975.2016.1199519
Apparently, there is room to further explore the relationship between credit risk and TE since the extant literature is inconclusive.
Diversification of activities is one of the factors that explain TE. Jeon and Miller (2005) and Sufian (2009) find that diversification positively impacts TE. The implication is that as banks generate more income from non-interest sources their TE improves (Sufian, 2009). Thus, there is a positive relation-ship between firm diversification and firm efficiency.
Figure 1. Regional distribution of RCBs.
Source: Author’s construction.
Table 2. Regional distribution of rural banks in Ghana
Source: Bank of Ghana Website.aThis has been calculated by dividing the total rural population in each region obtained from 2010 Population Census in
Ghana by the number of rural banks in each region.
Region Number of rural/community banks Rural population per rural banka
Ashanti 25 75,324
Central 21 55,428
Eastern 22 67,693
Brong Ahafo 20 64,126
Western 14 97,718
Volta 12 117,043
Greater Accra 7 54,157
Upper East 5 165,380
Upper West 4 146,864
Northern 7 246,964
Total 137 88,420
Page 6 of 15
Adusei, Cogent Business & Management (2016), 3: 1199519http://dx.doi.org/10.1080/23311975.2016.1199519
Profitability as measured by ROA has a positive, statistically significant relationship with TE (Hasan & Marton, 2003; Rosman et al., 2014; Sufian, 2009). Banks that have higher profitability ratios are usually preferred by clients. As a result, such banks are able to gather the biggest share of deposits as well as the best potential creditworthy borrowers. From the point of view of intermediation activi-ties, such conditions create a favorable environment for profitable banks to be more efficient (Sufian, 2009). A recent paper by Singh and Fida (2015) find profitability as the most important parameter of bank efficiency in Oman. However, contrary evidence exists that profitability measured in terms of ROA hurts bank TE (Řepková, 2015). Does profitability as measured by ROA promote or hurt rural bank TE in Ghana?
The debate on the equity capitalization–efficiency relationship generally concludes that capital positively influences efficiency (Řepková, 2015; Rosman et al., 2014; Singh & Fida, 2015; Tecles & Tabak, 2010). García-Herrero, Gavilá, and Santabárbara (2009), Goddard, Molyneux, and Wilson (2004), and Pasiouras and Kosmidou (2007) provide evidence that banks that record higher level of equity relative to assets are best-performing banks because they tend to have lower costs of funding owing to lower bankruptcy costs. However, Akhigbe and McNulty (2005) and Sufian (2009) find that capitalization is negatively related to TE. The implication is that more efficient banks use more lever-age (less equity). It is obvious from the above that consensus does not exist in the literature on the relationship between equity capital and TE.
Developed by Berger and DeYoung (1997), the bad management hypothesis postulates that man-agement quality/efficiency should negatively affect TE. Bad managers are unable to sufficiently monitor and control their operating expenses. When a bank records low TE, it indicates poor senior management practices in terms of input-usage, day-to-day operations, and management of loan portfolio (Sufian, 2009). Evidence from Sufian (2009) shows that management quality/efficiency has a negative, statistically significant relationship with TE. Is this hypothesis sustainable in the rural banking context?
Köhler (2015) posits that retail banks fund their activities with customer deposits. RCBs are retail banks that rely largely on customer deposits. Their ability to raise more deposits may promote man-agerial laxity leading to technical inefficiency. Thus, it is plausible to argue that there should be an inverse relationship between funding quality and TE. Does funding quality promote or hurt the TE of a rural bank?
Figure 2. Rural population per rural bank per region.
Source: Author’s construction.
Page 7 of 15
Adusei, Cogent Business & Management (2016), 3: 1199519http://dx.doi.org/10.1080/23311975.2016.1199519
4. Methodology
4.1. Analytical frameworkThe study adopts a two-stage approach to data analysis. The first stage involves the measurement of the TE of RCBs. The second stage involves the use of the TE scores of RCBs to explore the determi-nants of TE.
4.2. Technical efficiency analysisData envelopment analysis (DEA) is used to determine the TE scores of RCBs based on constant-re-turn-to-scale technique (Banker, Charnes, & Cooper, 1984). It performs multiple comparisons be-tween a set of homogeneous units (Gutiérrez-Nieto, Serrano-Cinca, & Mar Molinero, 2007). The choice of the DEA methodology is informed by its acclaimed superiority to the conventional para-metric techniques. For instance, whereas the conventional parametric techniques require prior as-sumptions about the distributions of the observations, DEA does not (LaPlante & Paradi, 2015). According to Berger and Humphrey (1997), DEA is appropriate when there is no justification for conventional cost and profit functions.
When DEA is applied to multiple outputs and inputs, efficiency is defined as the ratio of weighted sum of outputs to weighted sum of inputs. The weights for the ratio are calculated by the constraint that each DMU’s ratio must be less than or equal to one, thus condensing multiple inputs and out-puts into a single “virtual” input and single “virtual” output without providing pre-assigned weights. Having done this, the efficiency score is calculated by dividing weighted outputs by the weighted inputs. The weighted efficiency scores are then used to determine the TE scores of the DMUs by solv-ing the following efficiency-maximizing problem with variable return to scale technology assumption:
Subject to:
where c = a specific rural bank to be evaluated, yrj = the amount of output r from rural bank, Xij = the amount of input i to rural bank j, ur = weight chosen for output r, vi = weight chosen for input i, n = number of rural banks, s = number of outputs, and m = number of inputs.
The above equation suggests that a bank in the sample seeks to maximize the ratio of weighted outputs to weighted inputs subject to the constraint that none of the banks in the sample should have an efficiency score of more than unitary using the weights. The weights are, however, assumed to be unknown but obtained through optimization.
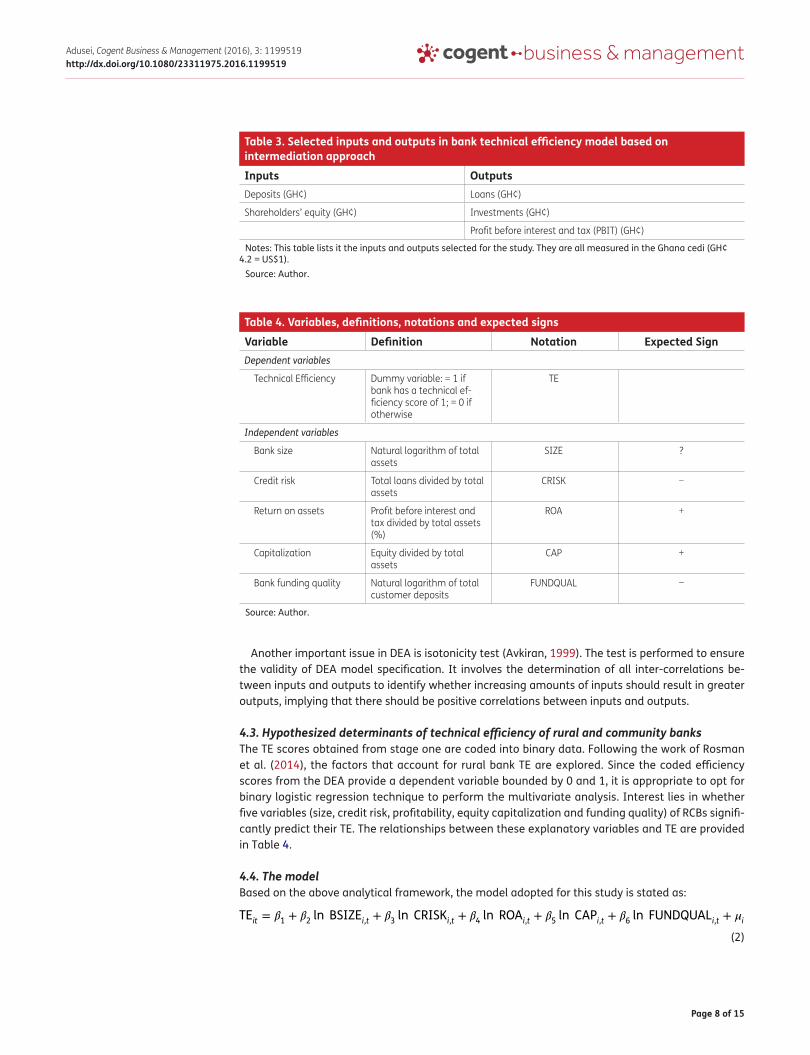
Variable selection (inputs and outputs selection) is one of the important requirements for DEA. Two approaches are used to select inputs and outputs for DEA: production and intermediation ap-proaches. The production approach views bank as providing services to its clients in the form of transactions with the objective of either minimizing the amount of resources it consumes in provid-ing various products and services or maximizing products and services for given levels of resources (Avkiran, 2006). The intermediation approach, on the other hand, views bank as channels of wealth transfer. Banks take funds from the saving surplus units in the form of deposits and other funds such as insurance policyholder liabilities, transform them, and give them out to the savings deficit units in the form of loans and other assets such as investments to generate income. Following the example of previous studies on the TE of banks (Mostafa, 2007; Rosman et al., 2014), we favor the intermedia-tion approach. It is, thus, used to select the variables listed in Table 3.
Maxhc =
s∑
r=1
uryrc∕
m∑
i=1
viXic
(1)
s∑
r=1
uryri∕
m∑
i=1
viXij ≤ 1;ur , vi ≥ 0 r = 1,… , S; i = 1,… ,mand j = 1,… ,n
Page 8 of 15
Adusei, Cogent Business & Management (2016), 3: 1199519http://dx.doi.org/10.1080/23311975.2016.1199519
Another important issue in DEA is isotonicity test (Avkiran, 1999). The test is performed to ensure the validity of DEA model specification. It involves the determination of all inter-correlations be-tween inputs and outputs to identify whether increasing amounts of inputs should result in greater outputs, implying that there should be positive correlations between inputs and outputs.
4.3. Hypothesized determinants of technical efficiency of rural and community banksThe TE scores obtained from stage one are coded into binary data. Following the work of Rosman et al. (2014), the factors that account for rural bank TE are explored. Since the coded efficiency scores from the DEA provide a dependent variable bounded by 0 and 1, it is appropriate to opt for binary logistic regression technique to perform the multivariate analysis. Interest lies in whether five variables (size, credit risk, profitability, equity capitalization and funding quality) of RCBs signifi-cantly predict their TE. The relationships between these explanatory variables and TE are provided in Table 4.
4.4. The modelBased on the above analytical framework, the model adopted for this study is stated as:
(2)
TEit = �1+ �
2ln BSIZEi,t + �
3ln CRISKi,t + �
4ln ROAi,t + �
5ln CAPi,t + �
6ln FUNDQUALi,t + �i,t
Table 4. Variables, definitions, notations and expected signs
Source: Author.
Variable Definition Notation Expected SignDependent variables
Technical Efficiency Dummy variable: = 1 if bank has a technical ef-ficiency score of 1; = 0 if otherwise
TE
Independent variables
Bank size Natural logarithm of total assets
SIZE ?
Credit risk Total loans divided by total assets
CRISK −
Return on assets Profit before interest and tax divided by total assets (%)
ROA +
Capitalization Equity divided by total assets
CAP +
Bank funding quality Natural logarithm of total customer deposits
FUNDQUAL −
Table 3. Selected inputs and outputs in bank technical efficiency model based on intermediation approach
Notes: This table lists it the inputs and outputs selected for the study. They are all measured in the Ghana cedi (GH¢ 4.2 = US$1).
Source: Author.
Inputs Outputs Deposits (GH¢) Loans (GH¢)
Shareholders’ equity (GH¢) Investments (GH¢)
Profit before interest and tax (PBIT) (GH¢)
Page 9 of 15
Adusei, Cogent Business & Management (2016), 3: 1199519http://dx.doi.org/10.1080/23311975.2016.1199519
where TE refers to bank TE score obtained from the coded DEA scores, i denotes the bank being evaluated, t examines time period, ln denotes natural logarithm, β is the parameter estimated, μ is the stochastic error term, SIZE denotes size of bank, CRISK denotes credit risk, ROA denotes bank profitability, CAP denotes equity capitalization, and FUNDQUAL denotes bank funding quality.
4.5. Data sourcesQuantitative data have been extracted from the reports of all RCBs in Ghana compiled by the Apex Bank (the supervisory body of RCBs in Ghana). Inclusion of a rural bank in the sample is based on availability of complete data needed for the study. Thus, all RCBs with requisite data needed for the study have been included in the study.
5. Empirical resultsThe analysis is in two parts. In the first part, the TE of 101 RCBs is measured using the DEA methodol-ogy. The second part of the analysis uses the results from the first part (TE scores) to run binary lo-gistic regression.
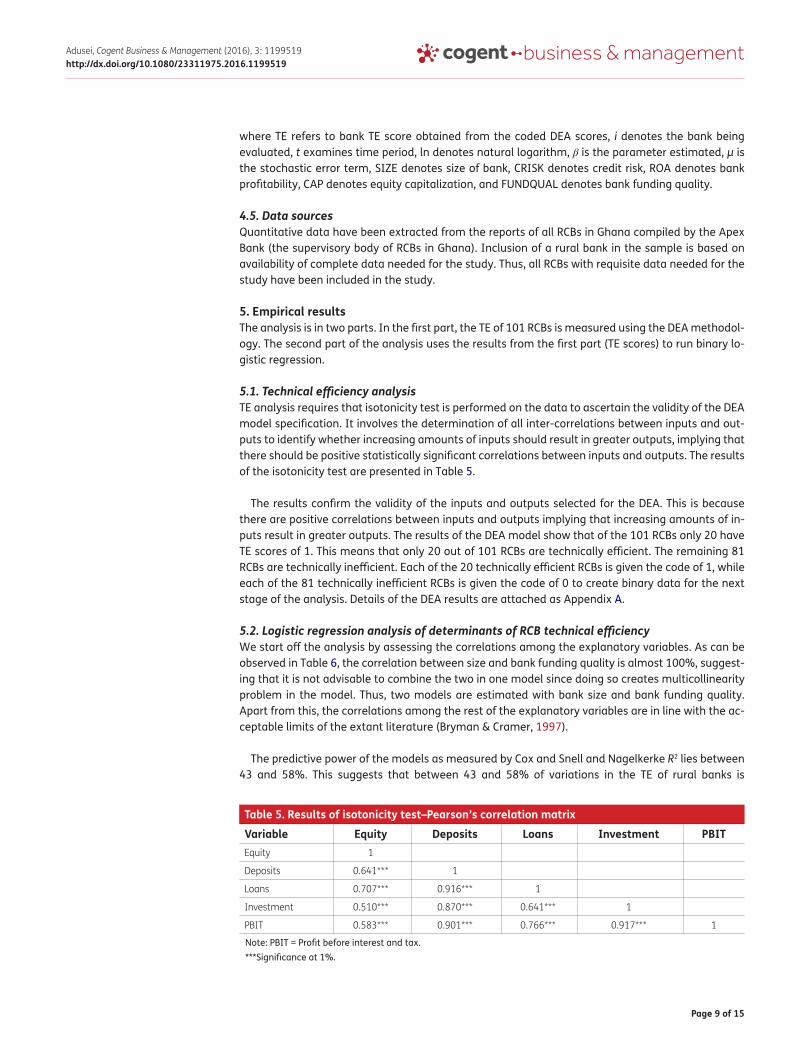
5.1. Technical efficiency analysisTE analysis requires that isotonicity test is performed on the data to ascertain the validity of the DEA model specification. It involves the determination of all inter-correlations between inputs and out-puts to identify whether increasing amounts of inputs should result in greater outputs, implying that there should be positive statistically significant correlations between inputs and outputs. The results of the isotonicity test are presented in Table 5.
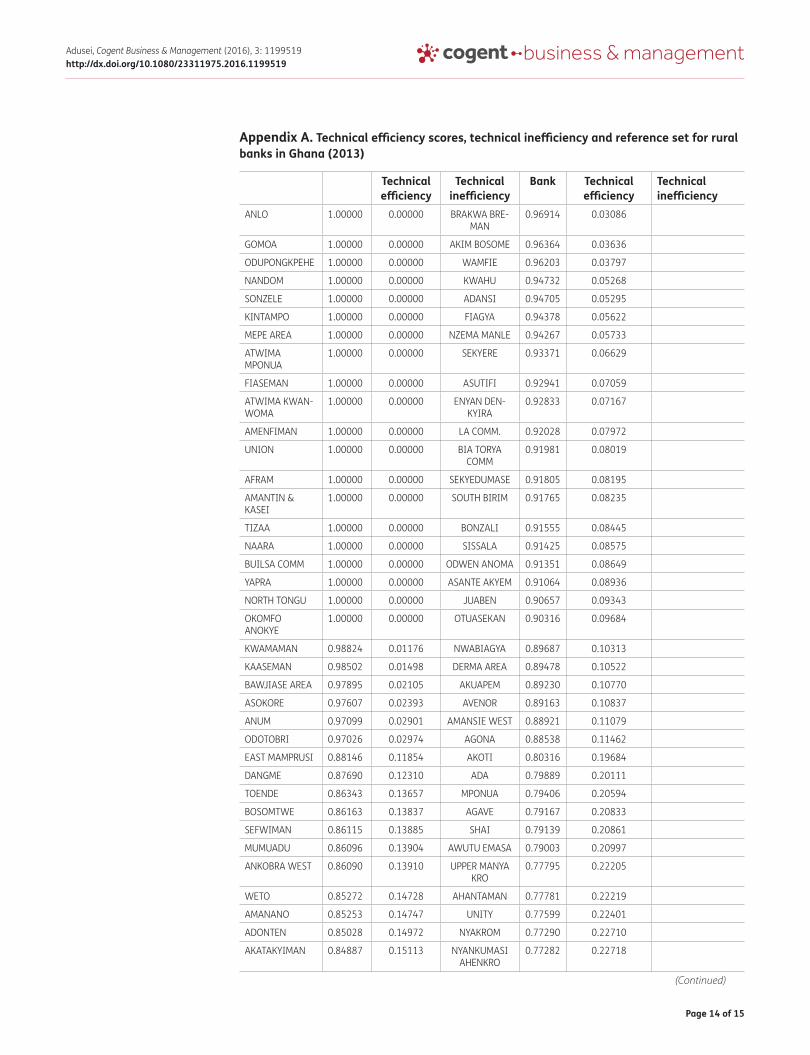
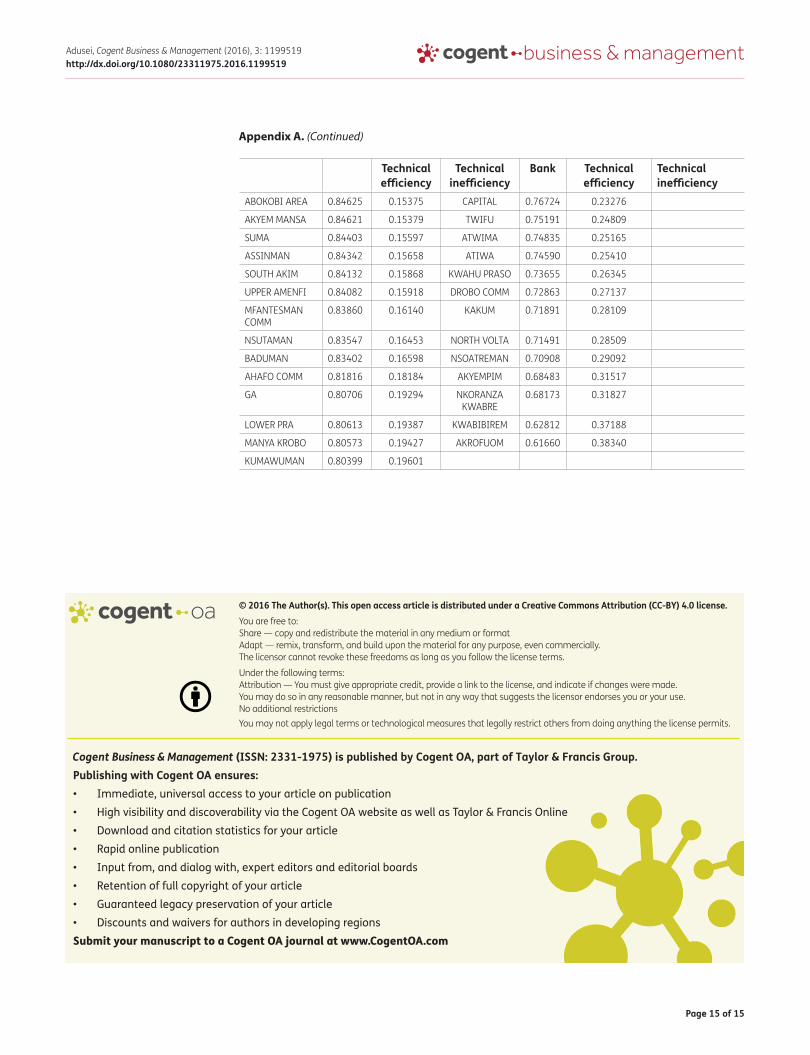
The results confirm the validity of the inputs and outputs selected for the DEA. This is because there are positive correlations between inputs and outputs implying that increasing amounts of in-puts result in greater outputs. The results of the DEA model show that of the 101 RCBs only 20 have TE scores of 1. This means that only 20 out of 101 RCBs are technically efficient. The remaining 81 RCBs are technically inefficient. Each of the 20 technically efficient RCBs is given the code of 1, while each of the 81 technically inefficient RCBs is given the code of 0 to create binary data for the next stage of the analysis. Details of the DEA results are attached as Appendix A.
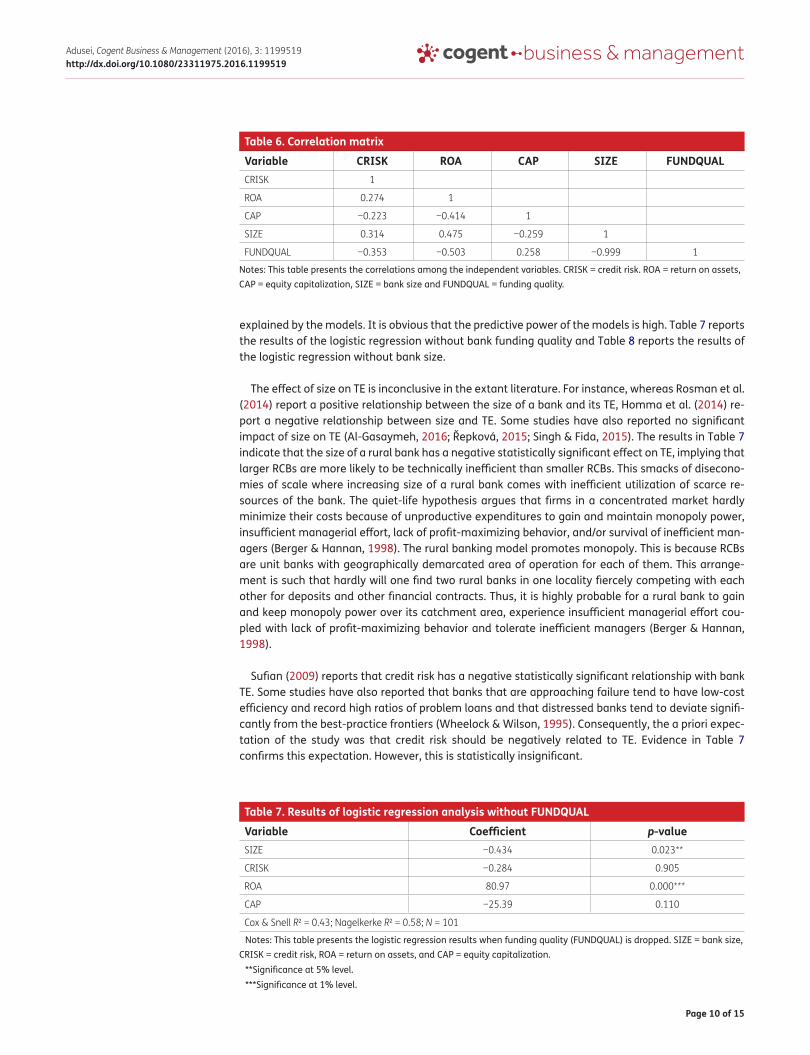
5.2. Logistic regression analysis of determinants of RCB technical efficiencyWe start off the analysis by assessing the correlations among the explanatory variables. As can be observed in Table 6, the correlation between size and bank funding quality is almost 100%, suggest-ing that it is not advisable to combine the two in one model since doing so creates multicollinearity problem in the model. Thus, two models are estimated with bank size and bank funding quality. Apart from this, the correlations among the rest of the explanatory variables are in line with the ac-ceptable limits of the extant literature (Bryman & Cramer, 1997).
The predictive power of the models as measured by Cox and Snell and Nagelkerke R2 lies between 43 and 58%. This suggests that between 43 and 58% of variations in the TE of rural banks is
Table 5. Results of isotonicity test–Pearson’s correlation matrix
Note: PBIT = Profit before interest and tax.***Significance at 1%.
Variable Equity Deposits Loans Investment PBITEquity 1
Deposits 0.641*** 1
Loans 0.707*** 0.916*** 1
Investment 0.510*** 0.870*** 0.641*** 1
PBIT 0.583*** 0.901*** 0.766*** 0.917*** 1
Page 10 of 15
Adusei, Cogent Business & Management (2016), 3: 1199519http://dx.doi.org/10.1080/23311975.2016.1199519
explained by the models. It is obvious that the predictive power of the models is high. Table 7 reports the results of the logistic regression without bank funding quality and Table 8 reports the results of the logistic regression without bank size.
The effect of size on TE is inconclusive in the extant literature. For instance, whereas Rosman et al. (2014) report a positive relationship between the size of a bank and its TE, Homma et al. (2014) re-port a negative relationship between size and TE. Some studies have also reported no significant impact of size on TE (Al-Gasaymeh, 2016; Řepková, 2015; Singh & Fida, 2015). The results in Table 7 indicate that the size of a rural bank has a negative statistically significant effect on TE, implying that larger RCBs are more likely to be technically inefficient than smaller RCBs. This smacks of disecono-mies of scale where increasing size of a rural bank comes with inefficient utilization of scarce re-sources of the bank. The quiet-life hypothesis argues that firms in a concentrated market hardly minimize their costs because of unproductive expenditures to gain and maintain monopoly power, insufficient managerial effort, lack of profit-maximizing behavior, and/or survival of inefficient man-agers (Berger & Hannan, 1998). The rural banking model promotes monopoly. This is because RCBs are unit banks with geographically demarcated area of operation for each of them. This arrange-ment is such that hardly will one find two rural banks in one locality fiercely competing with each other for deposits and other financial contracts. Thus, it is highly probable for a rural bank to gain and keep monopoly power over its catchment area, experience insufficient managerial effort cou-pled with lack of profit-maximizing behavior and tolerate inefficient managers (Berger & Hannan, 1998).
Sufian (2009) reports that credit risk has a negative statistically significant relationship with bank TE. Some studies have also reported that banks that are approaching failure tend to have low-cost efficiency and record high ratios of problem loans and that distressed banks tend to deviate signifi-cantly from the best-practice frontiers (Wheelock & Wilson, 1995). Consequently, the a priori expec-tation of the study was that credit risk should be negatively related to TE. Evidence in Table 7 confirms this expectation. However, this is statistically insignificant.
Table 7. Results of logistic regression analysis without FUNDQUAL
Notes: This table presents the logistic regression results when funding quality (FUNDQUAL) is dropped. SIZE = bank size, CRISK = credit risk, ROA = return on assets, and CAP = equity capitalization.
**Significance at 5% level.***Significance at 1% level.
Variable Coefficient p-valueSIZE −0.434 0.023**
CRISK −0.284 0.905
ROA 80.97 0.000***
CAP −25.39 0.110
Cox & Snell R2 = 0.43; Nagelkerke R2 = 0.58; N = 101
Table 6. Correlation matrix
Notes: This table presents the correlations among the independent variables. CRISK = credit risk. ROA = return on assets, CAP = equity capitalization, SIZE = bank size and FUNDQUAL = funding quality.
Variable CRISK ROA CAP SIZE FUNDQUALCRISK 1
ROA 0.274 1
CAP −0.223 −0.414 1
SIZE 0.314 0.475 −0.259 1
FUNDQUAL −0.353 −0.503 0.258 −0.999 1
Page 11 of 15
Adusei, Cogent Business & Management (2016), 3: 1199519http://dx.doi.org/10.1080/23311975.2016.1199519
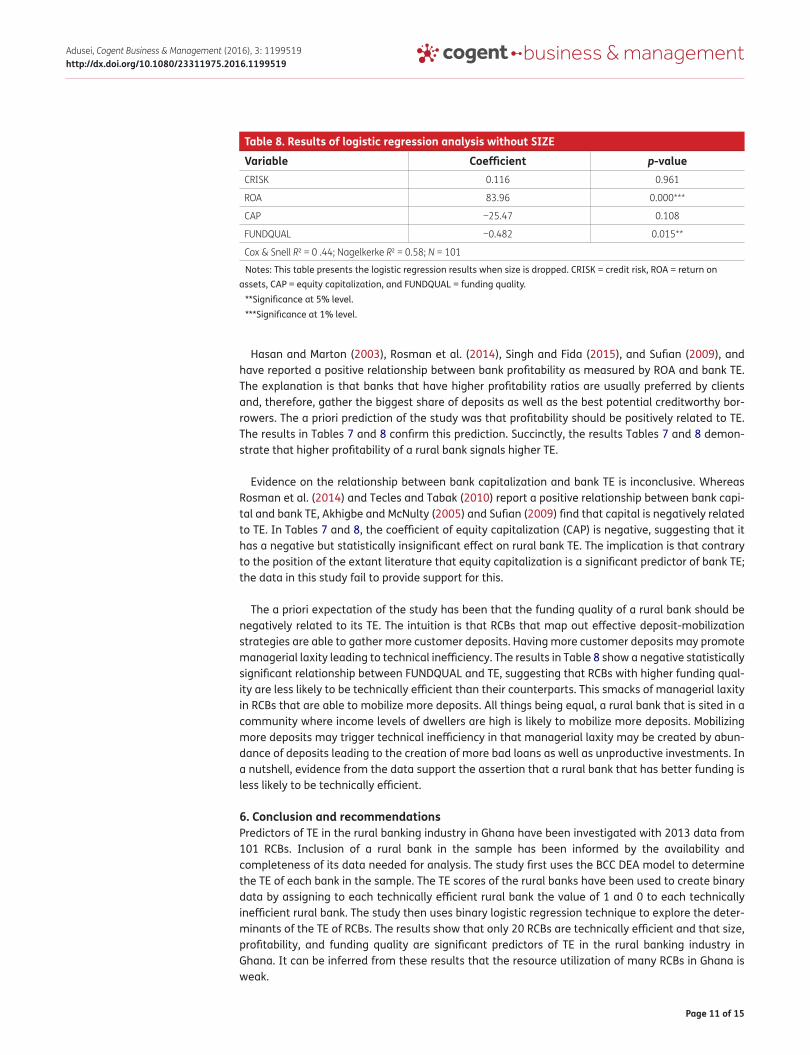
Hasan and Marton (2003), Rosman et al. (2014), Singh and Fida (2015), and Sufian (2009), and have reported a positive relationship between bank profitability as measured by ROA and bank TE. The explanation is that banks that have higher profitability ratios are usually preferred by clients and, therefore, gather the biggest share of deposits as well as the best potential creditworthy bor-rowers. The a priori prediction of the study was that profitability should be positively related to TE. The results in Tables 7 and 8 confirm this prediction. Succinctly, the results Tables 7 and 8 demon-strate that higher profitability of a rural bank signals higher TE.
Evidence on the relationship between bank capitalization and bank TE is inconclusive. Whereas Rosman et al. (2014) and Tecles and Tabak (2010) report a positive relationship between bank capi-tal and bank TE, Akhigbe and McNulty (2005) and Sufian (2009) find that capital is negatively related to TE. In Tables 7 and 8, the coefficient of equity capitalization (CAP) is negative, suggesting that it has a negative but statistically insignificant effect on rural bank TE. The implication is that contrary to the position of the extant literature that equity capitalization is a significant predictor of bank TE; the data in this study fail to provide support for this.
The a priori expectation of the study has been that the funding quality of a rural bank should be negatively related to its TE. The intuition is that RCBs that map out effective deposit-mobilization strategies are able to gather more customer deposits. Having more customer deposits may promote managerial laxity leading to technical inefficiency. The results in Table 8 show a negative statistically significant relationship between FUNDQUAL and TE, suggesting that RCBs with higher funding qual-ity are less likely to be technically efficient than their counterparts. This smacks of managerial laxity in RCBs that are able to mobilize more deposits. All things being equal, a rural bank that is sited in a community where income levels of dwellers are high is likely to mobilize more deposits. Mobilizing more deposits may trigger technical inefficiency in that managerial laxity may be created by abun-dance of deposits leading to the creation of more bad loans as well as unproductive investments. In a nutshell, evidence from the data support the assertion that a rural bank that has better funding is less likely to be technically efficient.
6. Conclusion and recommendationsPredictors of TE in the rural banking industry in Ghana have been investigated with 2013 data from 101 RCBs. Inclusion of a rural bank in the sample has been informed by the availability and completeness of its data needed for analysis. The study first uses the BCC DEA model to determine the TE of each bank in the sample. The TE scores of the rural banks have been used to create binary data by assigning to each technically efficient rural bank the value of 1 and 0 to each technically inefficient rural bank. The study then uses binary logistic regression technique to explore the deter-minants of the TE of RCBs. The results show that only 20 RCBs are technically efficient and that size, profitability, and funding quality are significant predictors of TE in the rural banking industry in Ghana. It can be inferred from these results that the resource utilization of many RCBs in Ghana is weak.
Table 8. Results of logistic regression analysis without SIZE
Notes: This table presents the logistic regression results when size is dropped. CRISK = credit risk, ROA = return on assets, CAP = equity capitalization, and FUNDQUAL = funding quality.
**Significance at 5% level.***Significance at 1% level.
Variable Coefficient p-valueCRISK 0.116 0.961
ROA 83.96 0.000***
CAP −25.47 0.108
FUNDQUAL −0.482 0.015**
Cox & Snell R2 = 0 .44; Nagelkerke R2 = 0.58; N = 101
Page 12 of 15
Adusei, Cogent Business & Management (2016), 3: 1199519http://dx.doi.org/10.1080/23311975.2016.1199519
The results of the study suggest that RCBs in Ghana need efficiency-improvement interventions. Considering the strategic importance of RCBs as agents of rural financial deepening in Ghana, allow-ing the status to remain may not augur well for agriculture as well as rural development in Ghana. It is, thus, recommended that the Bank of Ghana, in collaboration with the ARB Apex Bank, should organize regular efficiency training programs and workshops for boards of directors and managers of RCBs. It is envisaged that the adoption and implementation of this initiative are likely to promote the sustainability of RCBs as well as deepen financial inclusion with incalculable economic benefits for Ghana’s economy.
The observation that size hurts the TE of RCBs points to the need for the Bank of Ghana to intensify its regulation on the growth of RCBs. To the extent that growth in size implies a dip in the TE of RCBs tactfully constraining their growth may be instrumental to improving their TE. Apparently, this is not going to be smooth judging from that, in recent times, managers of RCBs have been making frantic efforts to expand as a way of maximizing shareholder value. That notwithstanding, allowing them to grow without controls may spell doom for the entire financial system in the near future.
The negative statistically significant relationship between funding quality and TE points to poor utilization of customer deposits which may be due to ineffective lending standards. It is recommend-ed that RCBs should strengthen their lending standards so that deposits mobilized from customers will be given to credit-worthy customers for maximization of shareholders’ wealth. Putting in place effec-tive lending standards and ensuring strict adherence to them will go a long way to improve RCBs’ TE.
The literature identifies diversification and management efficiency as significant predictors of TE. However, due to data constraints the current study has not been able to investigate whether these variables have significant effects on the TE of RCBs. This serves as one of the areas where future studies can explore.
FundingThe author received no direct funding for this research.
Author detailsMichael Adusei1
E-mail: [email protected] Department of Accounting and Finance, Kwame Nkrumah
University of Science and Technology, Kumasi, Ghana.
Citation informationCite this article as: Determinants of bank technical efficiency: Evidence from rural and community banks in Ghana, Michael Adusei, Cogent Business & Management (2016), 3: 1199519.
Note1. In this paper, rural banks and rural and community
banks are used interchangeably.
ReferencesAkhigbe, A., & McNulty, J. E. (2005). Profit efficiency sources
and differences among small and large U.S. commercial banks. Journal of Economics and Finance, 29, 289–299. http://dx.doi.org/10.1007/BF02761575
Al-Gasaymeh, A. (2016). Bank efficiency determinant: Evidence from the gulf cooperation council countries. Research in International Business and Finance, 38, 214–223. http://dx.doi.org/10.1016/j.ribaf.2016.04.018
Asiedu-Mante, E. (2011). Rural Banking in Ghana. Ghana: Combert Impressions.
Avkiran, N. (1999). An application reference for data envelopment analysis in branch banking: Helping the novice researcher. International Journal of Bank Marketing, 17, 206–220. http://dx.doi.org/10.1108/02652329910292675
Avkiran, N. K. (2006). Developing foreign bank efficiency models for DEA grounded in finance theory. Socio-Economic Planning Sciences, 40, 275–296. http://dx.doi.org/10.1016/j.seps.2004.10.006
Banker, R. D., Charnes, A., & Cooper, W. W. (1984). Some models for estimating technical and scale inefficiencies in data envelopment analysis. Management Science, 30, 1078–1092. http://dx.doi.org/10.1287/mnsc.30.9.1078
Berger, A. N., & DeYoung, R. (1997). Problem loans and cost efficiency in commercial banks. Journal of Banking and Finance, 21, 849–870. http://dx.doi.org/10.1016/S0378-4266(97)00003-4
Berger, A. N., & Hannan, T. H. (1998). The efficiency cost of market power in the banking industry: A test of the “quiet life” and related hypotheses. Review of Economics and Statistics, 80, 454–465. http://dx.doi.org/10.1162/003465398557555
Berger, A. N., & Humphrey, D. B. (1997). Efficiency of financial institutions: International survey and directions for future research. European Journal of Operational Research, 98, 175–212. http://dx.doi.org/10.1016/S0377-2217(96)00342-6
Bryman, A., & Cramer, D. (1997). Quantitative data analysis with SPSS for windows: A guide for social scientists. London: Routledge.
Demsetz, H. (1973). Industry structure, market rivalry, and public policy. The Journal of Law and Economics, 16, 1–9. http://dx.doi.org/10.1086/466752
Fujii, H., Managi, S., & Matousek, R. (2014). Indian bank efficiency and productivity changes with undesirable outputs: A disaggregated approach. Journal of Banking and Finance, 38, 41–50. http://dx.doi.org/10.1016/j.jbankfin.2013.09.022
García-Herrero, A., Gavilá, S., & Santabárbara, D. (2009). What explains the low profitability of Chinese banks? Journal of Banking and Finance, 33, 2080–2092. http://dx.doi.org/10.1016/j.jbankfin.2009.05.005

Page 13 of 15
Adusei, Cogent Business & Management (2016), 3: 1199519http://dx.doi.org/10.1080/23311975.2016.1199519
Goddard, J., Molyneux, P., & Wilson, J. (2004). The profitability of european banks: A cross-sectional and dynamic panel analysis. The Manchester School, 72, 363–381. http://dx.doi.org/10.1111/manc.2004.72.issue-3
Gutiérrez-Nieto, B., Serrano-Cinca, C., & Mar Molinero, C. (2007). Microfinance institutions and efficiency. Omega, 35, 131–142. http://dx.doi.org/10.1016/j.omega.2005.04.001
Hasan, I., & Marton, K. (2003). Development and efficiency of the banking sector in a transitional economy: Hungarian experience. Journal of Banking and Finance, 27, 2249–2271. http://dx.doi.org/10.1016/S0378-4266(02)00328-X
Hauner, D. (2005). Explaining efficiency differences among large German and Austrian banks. Applied Economics, 37, 969–980. http://dx.doi.org/10.1080/00036840500081820
Homma, T., Tsutsui, Y., & Uchida, H. (2014). Firm growth and efficiency in the banking industry: A new test of the efficient structure hypothesis. Journal of Banking and Finance, 40, 143–153. http://dx.doi.org/10.1016/j.jbankfin.2013.11.031
Hou, X., Wang, Q., & Zhang, Q. (2014). Market structure, risk taking, and the efficiency of Chinese commercial banks. Emerging Markets Review, 20, 75–88. http://dx.doi.org/10.1016/j.ememar.2014.06.001
Iddrisu, A., Aboagye, A. Q. Q., & Osei, K. (2014). Measuring rural bank efficiency in Ghana: An application of the data envelopment analysis (DEA) approach. Journal of Human and Social Science Research, 3, 41–59.
Jeon, Y., & Miller, S. M. (2005). Performance of domestic and foreign banks: The case of Korea and the Asian financial crisis. Global Economic Review, 34, 145–165. http://dx.doi.org/10.1080/12265080500117491
Köhler, M. (2015). Which banks are more risky? The impact of business models on bank stability. Journal of Financial Stability, 16, 195–212. http://dx.doi.org/10.1016/j.jfs.2014.02.005
Kumar, S. (2008). An analysis of efficiency-profitability relationship in Indian public sector banks. Global Business Review, 9, 115–129. http://dx.doi.org/10.1177/097215090700900108
LaPlante, A. E., & Paradi, J. C. (2015). Evaluation of bank branch growth potential using data envelopment analysis. Omega, 52, 33–41. http://dx.doi.org/10.1016/j.omega.2014.10.009
Mostafa, M. (2007). Modeling the efficiency of GCC banks: A data envelopment analysis approach. International Journal of Productivity and Performance Management, 56, 623–643. http://dx.doi.org/10.1108/17410400710823651
Nair, A., & Fissha, A. (2010). Rural banking: The case of rural and community banks in Ghana, agriculture and rural development (Discussion Paper No. 48). Washington, DC: The World Bank.
Pasiouras, F., & Kosmidou, K. (2007). Factors influencing the profitability of domestic and foreign commercial banks in the European Union. Research in International Business and Finance, 21, 222–237. http://dx.doi.org/10.1016/j.ribaf.2006.03.007
Řepková, I. (2015). Banking efficiency determinants in the Czech banking sector. Procedia Economics and Finance, 23, 191–196.
Rosman, R., Wahab, N. A., & Zainol, Z. (2014). Efficiency of Islamic banks during the financial crisis: An analysis of Middle Eastern and Asian countries. Pacific-Basin Finance Journal, 28, 76–90. http://dx.doi.org/10.1016/j.pacfin.2013.11.001
See, K. F., & He, Y. (2015). Determinants of technical efficiency in Chinese banking: A double bootstrap data envelopment analysis approach. Global Economic Review, 44, 286–307. http://dx.doi.org/10.1080/1226508X.2015.1014392
Shyu, J., & Chiang, T. (2012). Measuring the true managerial efficiency of bank branches in Taiwan: A three-stage DEA analysis. Expert Systems with Applications, 39, 11494–11502. http://dx.doi.org/10.1016/j.eswa.2012.04.005
Singh, D., & Fida, A. B. (2015). Technical efficiency and its determinants: An empirical study on banking sector of Oman. Problems and Perspectives in Management, 13, 168–175.
Sufian, F. (2009). Determinants of bank efficiency during unstable macroeconomic environment: Empirical evidence from Malaysia. Research in International Business and Finance, 23, 54–77. http://dx.doi.org/10.1016/j.ribaf.2008.07.002
Tecles, P. L., & Tabak, B. M. (2010). Determinants of bank efficiency: The case of Brazil. European Journal of Operational Research, 207, 1587–1598. http://dx.doi.org/10.1016/j.ejor.2010.06.007
Wheelock, D. C., & Wilson, P. W. (1995). Explaining bank failures: Deposit insurance, regulation and efficiency. The Review of Economics and Statistics, 77, 689–700. http://dx.doi.org/10.2307/2109816
Yin, H., Yang, J., & Mehran, J. (2013). An empirical study of bank efficiency in China after WTO accession. Global Finance Journal, 24, 153–170. http://dx.doi.org/10.1016/j.gfj.2013.07.001
Page 14 of 15
Adusei, Cogent Business & Management (2016), 3: 1199519http://dx.doi.org/10.1080/23311975.2016.1199519
Appendix A. Technical efficiency scores, technical inefficiency and reference set for rural banks in Ghana (2013)
Technical efficiency
Technical inefficiency
Bank Technical efficiency
Technical inefficiency
ANLO 1.00000 0.00000 BRAKWA BRE-MAN
0.96914 0.03086
GOMOA 1.00000 0.00000 AKIM BOSOME 0.96364 0.03636
ODUPONGKPEHE 1.00000 0.00000 WAMFIE 0.96203 0.03797
NANDOM 1.00000 0.00000 KWAHU 0.94732 0.05268
SONZELE 1.00000 0.00000 ADANSI 0.94705 0.05295
KINTAMPO 1.00000 0.00000 FIAGYA 0.94378 0.05622
MEPE AREA 1.00000 0.00000 NZEMA MANLE 0.94267 0.05733
ATWIMA MPONUA
1.00000 0.00000 SEKYERE 0.93371 0.06629
FIASEMAN 1.00000 0.00000 ASUTIFI 0.92941 0.07059
ATWIMA KWAN-WOMA
1.00000 0.00000 ENYAN DEN-KYIRA
0.92833 0.07167
AMENFIMAN 1.00000 0.00000 LA COMM. 0.92028 0.07972
UNION 1.00000 0.00000 BIA TORYA COMM
0.91981 0.08019
AFRAM 1.00000 0.00000 SEKYEDUMASE 0.91805 0.08195
AMANTIN & KASEI
1.00000 0.00000 SOUTH BIRIM 0.91765 0.08235
TIZAA 1.00000 0.00000 BONZALI 0.91555 0.08445
NAARA 1.00000 0.00000 SISSALA 0.91425 0.08575
BUILSA COMM 1.00000 0.00000 ODWEN ANOMA 0.91351 0.08649
YAPRA 1.00000 0.00000 ASANTE AKYEM 0.91064 0.08936
NORTH TONGU 1.00000 0.00000 JUABEN 0.90657 0.09343
OKOMFO ANOKYE
1.00000 0.00000 OTUASEKAN 0.90316 0.09684
KWAMAMAN 0.98824 0.01176 NWABIAGYA 0.89687 0.10313
KAASEMAN 0.98502 0.01498 DERMA AREA 0.89478 0.10522
BAWJIASE AREA 0.97895 0.02105 AKUAPEM 0.89230 0.10770
ASOKORE 0.97607 0.02393 AVENOR 0.89163 0.10837
ANUM 0.97099 0.02901 AMANSIE WEST 0.88921 0.11079
ODOTOBRI 0.97026 0.02974 AGONA 0.88538 0.11462
EAST MAMPRUSI 0.88146 0.11854 AKOTI 0.80316 0.19684
DANGME 0.87690 0.12310 ADA 0.79889 0.20111
TOENDE 0.86343 0.13657 MPONUA 0.79406 0.20594
BOSOMTWE 0.86163 0.13837 AGAVE 0.79167 0.20833
SEFWIMAN 0.86115 0.13885 SHAI 0.79139 0.20861
MUMUADU 0.86096 0.13904 AWUTU EMASA 0.79003 0.20997
ANKOBRA WEST 0.86090 0.13910 UPPER MANYA KRO
0.77795 0.22205
WETO 0.85272 0.14728 AHANTAMAN 0.77781 0.22219
AMANANO 0.85253 0.14747 UNITY 0.77599 0.22401
ADONTEN 0.85028 0.14972 NYAKROM 0.77290 0.22710
AKATAKYIMAN 0.84887 0.15113 NYANKUMASI AHENKRO
0.77282 0.22718
(Continued)
Page 15 of 15
Adusei, Cogent Business & Management (2016), 3: 1199519http://dx.doi.org/10.1080/23311975.2016.1199519
© 2016 The Author(s). This open access article is distributed under a Creative Commons Attribution (CC-BY) 4.0 license.
Technical efficiency
Technical inefficiency
Bank Technical efficiency
Technical inefficiency
ABOKOBI AREA 0.84625 0.15375 CAPITAL 0.76724 0.23276
AKYEM MANSA 0.84621 0.15379 TWIFU 0.75191 0.24809
SUMA 0.84403 0.15597 ATWIMA 0.74835 0.25165
ASSINMAN 0.84342 0.15658 ATIWA 0.74590 0.25410
SOUTH AKIM 0.84132 0.15868 KWAHU PRASO 0.73655 0.26345
UPPER AMENFI 0.84082 0.15918 DROBO COMM 0.72863 0.27137
MFANTESMAN COMM
0.83860 0.16140 KAKUM 0.71891 0.28109
NSUTAMAN 0.83547 0.16453 NORTH VOLTA 0.71491 0.28509
BADUMAN 0.83402 0.16598 NSOATREMAN 0.70908 0.29092
AHAFO COMM 0.81816 0.18184 AKYEMPIM 0.68483 0.31517
GA 0.80706 0.19294 NKORANZA KWABRE
0.68173 0.31827
LOWER PRA 0.80613 0.19387 KWABIBIREM 0.62812 0.37188
MANYA KROBO 0.80573 0.19427 AKROFUOM 0.61660 0.38340
KUMAWUMAN 0.80399 0.19601
Appendix A. (Continued)