Embed Size (px)
Citation preview

- 1 -
Determinants of Claim Frequency
In CTP Schemes
Prepared by Raewin Davies, Rosi Winn and Jack Jiang
Presented to the Institute of Actuaries of Australia Accident Compensation Seminar 28 November to 1 December 2004.
This paper has been prepared for the Institute of Actuaries of Australia’s (IAAust) Accident Compensation Seminar, 2004. The IAAust Council wishes it to be understood that opinions put forward herein are not necessarily those of
the IAAust and the Council is not responsible for those opinions.
The Institute of Actuaries of Australia Level 7 Challis House 4 Martin Place
Sydney NSW Australia 2000 Telephone: +61 2 9233 3466 Facsimile: +61 2 9233 3446
Email: [email protected] Website: www.actuaries.asn.au

- 2 -
Determinants of Claim Frequency in CTP Schemes
1 Introduction For the past 30 years, the environment in which Transport Accident Schemes are operating has changed rapidly. On the one hand, technological advancements have led to improved safety on the roads. On the other hand, changes in scheme designs and common law tort reforms have altered the access to compensation for injured parties. Throughout Australia, casualty rates are declining and claim frequencies have fallen. For some states, recent claim frequency experience appears atypical, making projections of future experience problematic. In Section 2 of our paper we examine the commonalities in claim frequency and casualty experience across different jurisdictions in Australia. In Section 3 we develop a framework for examining the factors influencing the claim frequency. In Section 4 we examine different elements of this framework to gain insight into the impact of the various factors on the frequency of transport accidents and casualties. An understanding of the factors influencing the recent experience can assist with formulating reasonable scenarios for the near future. Section 5 sums up the results of our investigations.

- 3 -
2 Experience by state
We compare claim number experience across jurisdictions via measures of claim frequencies and casualty rates.
2.1 Casualty Rates A casualty is any person killed or injured as a result of a car accident.
Changes in casualties per 1000 vehicles by State, Base year = 1995
40
60
80
100
120
140
1990
1991
1992
1993
1994
1995
1996
1997
1998
1999
2000
2001
2002
2003
Accident Year Ending 31-Dec
NSWVICQLDACTSANT
• Prior to October 2000, it was not compulsory in Queensland for an injured claimant to report the accident to the police before lodging a claim. The casualty rate increased by around 14% following the change in lodgement procedures.
• From 1990-1995, for those states and territories for which data was available, the decrease in casualty rate has been similar at around 40%.
• From 1995-2003, the ACT has a spectacular drop in the casualty rate, although with the smaller size of the territory, it is unclear whether the lower rate is sustainable.
• South Australia is the only state for which the casualties are more volatile, and casualties have increased after 1995.

- 4 -
2.2 Claim Frequency
Change in Claim Frequency by StateBase year = 1995
40
50
60
70
80
90
100
110
120
1990
1991
1992
1993
1994
1995
1996
1997
1998
1999
2000
2001
2002
2003
Accident Year Ending 31-Dec
NSW
VIC
QLD
ACT
NT
Note: Claim frequency includes an estimate for IBNR claims.
• Various legislative changes have been enacted over the last 14 years,
impacting the eligibility to receive compensation. • For those state / territories for which data is available, the claim
frequency increased between 1990-1994. • Contrary to other states, claim frequencies increased in Queensland
between 1997 to 2001. • For all states, experience from 2001 has been one of falling claim
frequencies, in part driven by legislative changes.

- 5 -
3 Factors influencing Transport Accident Claims For the remainder of this paper we are primarily examining third party claims. The exact definitions for what constitutes a claim vary between the different jurisdictions but can be generalised as described below. The starting point for a claim is a vehicle accident. For each accident there may be casualties or only property damage. Where there are casualties these may be to the at-fault driver (which would make them ineligible to claim in most of the Schemes) or to a third party. The injured third party may then become a claimant or remain outside of the Scheme. This can be represented by the following diagram. Development of third party motor claims
Accidents
Casualties
Claimants
Third Party Casualties
Non-casualty accidents
At Fault Casualties
Non-claimants
* Based on an at-fault scheme design By examining the factors that impact each stage of this flowchart we can build a framework for examining the drivers of the experience of the Schemes. We note at this stage that the framework could be used as a basis for examining claim frequency or claims cost. The application to claim frequency is more intuitive; however we note that the two are inextricably linked. In fact we consider the severity of the experience at each stage in the flowchart above to be one of the main contributors to the outcome at subsequent stages. As part of our examination of the factors that impact each stage in the flowchart we reviewed the academic literature. This research located “The Haddon Matrix”: a framework that had been developed by the public health community in the 1940’s as a conceptual framework for organising both risk measures and countermeasure strategies.

- 6 -
The matrix can be applied to a number of different situations and has been applied to road traffic accidents as follows: The Haddon Matrix1
Drivers Vehicles Environments
Pre-
Cra
sh
• Driving Experience • Drinking and driving
(legislation & penalties, education)
• State of repair (vehicle inspection programs)
• Illumination (daytime running lights, flags for long loads)
• Road geometrics (highway standards
• Weather (storm warnings & driving advisories)
• Darkness (day-night speed limit differentials)
Cra
sh • “The Second Collision”
(seat belt legislation) • Auto interiors
(design of car dashboards, airbags)
• Roadside obstacles (clearing trees)
Post
-C
rash
• Respond to emergency (carrying cell phone)
• Motor vehicle standards(Fire or rollover)
• Medical Service (Emergency Response)
This approach for organising the factors is useful in that is has two functions:
• It can be used as a tool for monitoring experience and understanding the relative importance of the different factors
• It can then be used as a basis for driving changes to the experience, in fact many of the initiatives to improve road safety have been attempts to modify one of the factors shown
o For example many of the road safety campaigns and vehicle registration and driver licensing processes aim to address the pre-crash factors.
For the purposes of this paper we are more interested in the first function: understanding the factors influencing accidents and the relative importance of each. We are also interested in extending the application somewhat in that we are interested in both the factors influencing accidents and then how those accidents develop into third party claims. We have brainstormed to find the factors that we believe are the main influences at each stage. These are shown in the diagram below.
1http://people.hofstra.edu/geotrans/eng/ch7en/meth7en/ch7m3en.html

- 7 -
Factors influencing transport accident claims
Number and Severity of Accidents
Number and Severity of Casualties
Number of CTP Claims
Number of vehicles on road
Number of passengers per
vehicle
Road SafetyDesign
speed limitsroad surface quality
Vehicle SafetySeat beltsAirbags
General design
Driver BehavioursAlcoholFatigue
Use of seat beltsDriving skills
Mix of road users balance of cars,
motorbikes, pedestrians etc in different areas
Weather ConditionsRainIceFog
Number and Severity of
Third Party Casualties Propensity to Claim
Benefits availableBenefit alternatives –
Medicare etcJudicial attitudes
Claimant attitudes
The factors shown have been categorised by colour. In doing so we have considered the extent by which the factors have been or are able to be modified and the mechanism used. The groups are as follows: Yellow boxes: modifiable factors which have been actively used in attempts to
improve road traffic accident experience Orange boxes: modifiable factors which are impacted by the social
environment but in general have not been actively used (would expect gradual changes over time)
Blue box: unmodifiable factor White box: modifiable factors relating to claimant experience rather than
accident experience We have shown the link we consider most significant in black and also the main secondary influences. It is difficult to separately identify the factors for many of the stages, for example vehicle safety initiatives such as rear lights may well reduce the number of accidents and may also reduce the number of casualties by reducing the severity of accidents.

- 8 -
4 Investigations
We have investigated a number of the factors shown in the above framework in an attempt to improve our understanding of the factors driving the experience we discussed in Section 3 and to understand the relative importance of each factor.
4.1 Accidents2
NSW Accident Rate
0.0
5.0
10.0
15.0
20.0
25.0
30.0
35.0
1976 1981 1986 1991 1996 2001
Year
Acc
iden
ts /
1000
veh
icle
s
Note: Accident data prior to July 1975 is not available on a consistent basis, and has therefore been omitted.
From 1976 to 1992, the NSW accident rate declined at around 3.6% p.a., then at a slower rate thereafter of around 1.3% p.a. to 2001. The accident rate in 2002 and 2003 is below this trend. The falling accident rate is generally attributed to various road safety initiatives3, including:
• Random breath testing • Speed cameras • Driver education • Improved roads • Improved vehicle safety.
It is hypothesised that some fluctuation around the long term declining trend is, at least in part, attributable to weather patterns. This is examined later in this paper.
2 http://www.rta.nsw.gov.au/roadsafety/downloads/. Annual statistical statements 3 http://www.atsb.gov.au/road/pdf/mgraph23.pdf

- 9 -
We have not examined the influence of improvements in road safety and driver behaviour. Vehicle safety factors are covered in section 4.2.1
4.1.1 Influence of Alcohol4
Random breath testing was first introduced in Victoria in 1976, with NSW coming on board in 1982. There are around 2 million RBTs p.a. in NSW. The use of RBTs, and the failure rate, is show below:
NSW - Random breath testing
0
100
200
300
400
500
600
700
800
1990 1991 1992 1993 1994 1995 1996 1997 1998 1999
RB
Ts p
er 1
000
vehi
cles
0.00%
0.50%
1.00%
1.50%
2.00%
2.50%
3.00%
3.50%
4.00%
Failu
re ra
te
Stationary Mobile% fail - stationary % fail - mobile
Note: RBT statistics are not readily available after 1999.
Between 1990 and 1995, compliance with drink-driving laws improved significantly, with the proportion of drivers failing RBTs falling by over 20%. However, from 1997 to 1999, the failure rate deteriorated, with the 1999 failure rate worse than prior years. Whilst the incidence of accidents involving alcohol is low, there is a strong link between drink-driving and severity of accident.
4 http://www.rta.nsw.gov.au/roadsafety/downloads. Annual statistical statements. Hard copies of earlier reports provided by the RTA

- 10 -
NSW - Alcohol involvement in accidents
No
Unknown
Yes
Only 4% of accidents over the 1985-2003 period are known to have involved alcohol. However, 21% of fatal accidents, and 7% of injury accidents are known to have involved alcohol. The link between fatal accidents known to involve alcohol and RBT failure rates in NSW is presented below:
NSW - Fatal crashes and RBT failues
0
50
100
150
200
250
1985
1987
1989
1991
1993
1995
1997
1999
2001
2003
Fata
l cra
shes
invo
lvin
g al
coho
l
0.00%
0.25%
0.50%
0.75%
1.00%
1.25%
1.50%
% F
ail R
BT
Fatal % fail total (weighted)
In NSW, fatal crashes involving alcohol fell from 1985 through to 1998, but have been higher thereafter. This coincides with a worsening in the RBT failure rate.
4.2 Casualties5
Trends in the number of casualties provide an indication of the changes in the severity of accidents over time.
5 http://www.rta.nsw.gov.au/roadsafety/downloads. Annual statistical statements.

- 11 -
NSW - Fatalities and casualties per accident
0.000
0.005
0.010
0.015
0.020
0.025
1976 1981 1986 1991 1996 2001Year
Fata
lity
rate
0.0
0.1
0.2
0.3
0.4
0.5
0.6
0.7
Cas
ualty
rate
Fatalities Casualties
Fatalities per accident fell significantly over the 1980s, with a smaller decline thereafter. Over the whole period, fatalities per accident have declined by nearly 2% p.a. Casualties per accident (including fatalities) were broadly constant until the early 1990s, then declined to 1999, but have been higher from 2000 to 2003.
4.2.1 Car safety measures
Monash University Accident Research Centre reported in 2000 on the relative safety of passenger vehicles.6 This was an update of earlier work, produced in 1992 and 1994. Vehicles are rated according to two safety measures, namely:
• Crashworthiness: the relative safety of a vehicle in preventing severe injury to their own driver in crashes, where severe injury is defined as a fatality or a hospitalisation as a result of a tow-away crash;
• Aggressivity: the relative risk of serious injury vehicles pose to drivers of other vehicles with which they collide.
The ratings are calculated adjusting for factors not associated with vehicle design but which are known to influence injury outcome in a crash. These include sex and age of the driver, speed zone, state, number of vehicles involved and year of crash.
A few of the findings are briefly paraphrased below:
66 http://www.monash.edu.au/muarc/reports/muarc171.

- 12 -
Vehicle Crashworthiness over time
Note: For copyright reasons, the table is from a brochure7 available from the report’s sponsoring organisations, VicRoads, Transport Accident Commission, NSW Roads and Traffic Authority, NRMA Ltd, Queensland Transport.
Vehicle safety improved rapidly over the 1970s with at around a 5% improvement in crashworthiness per year of manufacture, then improved at a slower rate over the 1980s to the mid 1990s, with limited change thereafter. With nearly 60% of the NSW passenger fleet manufactured in the 1990s or later, and nearly 90% after 1985, 8 most of the safety improvements are now incorporated throughout the NSW car fleet. The National Road Safety Strategy for 2001-2010 assumes a 10% reduction in road fatalities by 2010 as the benefits from improvements to new vehicle occupant protection achieved during the 1990s continue to accrue as newer, safer vehicles progressively replace existing vehicles. Gains assumed by the Road Safety Strategy from new technology are small. 9 Thus, without significant safety gains in vehicle design, further gains in serious injury risk from vehicle design are expected to be lower than in previous years.
7http://www.rta.nsw.gov.au/roadsafety/downloads/buyers_guide_used_car_safety_ratings_2003.pdf 8Australian Bureau of Statistics 9309.0 9http://www.atcouncil.gov.au/actionplan.pdf

- 13 -
Crashworthiness by vehicle type
0% 20% 40% 60% 80% 100%
4 WD
Large
Medium
Small
% of vehicles by make of vehicle
Significantly betterBetter than averageAverageWorse than averageSignificantly worse
Note: The table is from a brochure available from the report’s sponsoring organisations.
The relative safety improves with increasing vehicle mass, from small to large vehicles. Four-wheel drive vehicles include both lighter and the traditional large four-wheel drive.
Aggressivity by vehicle type
0% 20% 40% 60% 80% 100%
4 WD
Large
Medium
Small
% of vehicles by make of vehicle
Significantly betterBetter than averageAverageWorse than averageSignificantly worse
Note: A number of vehicle makes of unknown aggressivity are excluded from the above graph.
Of note is the higher proportion of four-wheel drive vehicle models with a worse than average risk of serious injury to drivers of other vehicles with which they collide. Four-wheel drives have increased in popularity. In 1990 4WDs made up 12 per cent of all new car sales and by 1998 this had increased to 17 per cent. The number of kilometres travelled by 4WDs, as a proportion of all vehicle kilometres travelled, increased from 5 per cent in 1995 to 9 per

- 14 -
cent in 1998.10 The increase in the casualties per accident observed from the late 1990s appears attributable, at least in part, to the increased use of 4WDs.
4.2.2 Casualties per accident by road user1112
NSW - Casualties per accident by road user
0.00
0.05
0.10
0.15
0.20
0.25
0.30
0.35
1976 1981 1986 1991 1996 2001
Year
Driver Passenger Motor cyclistPedestrian Pedal cyclist
Note : Motor cyclists includes pillion passengers.
For most road users, casualties per accident have been decreasing, drivers being the clear exception. This is examined further below:
NSW - % change in casualties per accident
-50%
-25%
0%
25%
50%
75%
100%
125%
1976 1981 1986 1991 1996 2001
Year
Driver Passenger Motor cyclistPedestrian Pedal cyclist
Note: Change in casualties is measured as the 2 year average, relative to the 1976-77 casualty rate per accident.13
Casualties within each road user group can be impacted by different factors. For example, wearing of helmets became compulsory for motor cyclists by
1310 http://www.atsb.gov.au/road/mgraph/mgraph11/index.cfm 11 http://www.rta.nsw.gov.au/roadsafety/downloads. Annual Statistics statements

- 15 -
1973, and for pedal cyclists by 1992. For drivers and passengers, one would expect car design to have a similar impact on the casualty rates of the 2 groups. This is clearly not the case, with the driver casualty rate increasing, whilst passenger casualty rate has decreased. The raw casualty data for drivers and passengers is graphed below.
NSW - Driver and passenger casualties
02,0004,0006,0008,000
10,00012,00014,00016,00018,000
1960 1965 1970 1975 1980 1985 1990 1995 2000
Driver Passenger
Driver and passenger casualties began to diverge in the early 1970s, the divergence increasing through the 1980s and 1990s. In 1999 driver casualties increased by 6%, increasing again in 2000 by 14%, then continuing through to 2003 at or above this higher rate. At the same time, passenger casualties have not increased. Reasons for the increased divergence in recent years are not clear.

- 16 -
4.3 CTP Claims
4.3.1 CTP Claims per casualty by road user
NSW - s74 claims per casualty by road user
0.00
0.10
0.20
0.30
0.40
0.50
0.60
0.70
0.80
0.9019
89
1990
1991
1992
1993
1994
1995
1996
1997
1998
1999
2000
2001
2002
2003
Driver PassengerMotor cyclistPedestrianPedal cyclist
Legislative changes
New Act
Note: From Sep-99, Section 74 claims are “full” claims. It is also possible for claimants to submit an accident notification form and obtain a low level of compensation. Differing claim rates between road users are in part a reflection of eligibility to claim. For example, drivers will have a lower claim rate than passengers, as the NSW scheme is fault-based. Drivers in single-vehicle accidents (around 25% of all accidents) will be unable to claim. Changes in the claim rate over time reflect changes in the legislative environment.
Change in S74 claim rate (relative to 1993-94 claim rate)
-50%
-40%
-30%
-20%
-10%
0%
10%
20%
30%
1990 1991 1992 1993 1994 1995 1996 1997 1998 1999 2000 2001 2002 2003
Driver Passenger Motor cyclistPedestrian Pedal cyclist
Relative to the claim rate of 1993 and 1994, the claim rate of drivers and of passengers in the New Act period has fallen by similar percentages. The claim rate of other road users has fallen by a lesser amount.

- 17 -
4.4 Influence of Rainfall
We wanted to examine the widely reported effect of weather on the claim experience. In particular we hypothesised that the recent drought in NSW may be a factor contributing to the low claim frequencies observed in the last few years. We wondered whether it would be possible to quantify the impact of the lower rainfall on the claim experience. Investigating the effect on accidents of each individual factor is a difficult exercise; as we have noted above it is usually difficult to isolate a single cause for the event – more likely there are a number of contributing factors. We reviewed the literature which suggests an approach of matched sampling12
14 for analysing the effect of weather-related hazards. This approach recognises that there are many factors that impact on accident and claim rates and that it is difficult to control for these other factors. The technique first identifies data covering events for which there is adverse weather and then pairs each event with a suitable control event where the weather was good. For example, experience during a rainy Monday in February could be paired with that during a dry Monday in February. The accident experiences for the periods with adverse conditions are then compared to that during the control periods. This approach attempts to negate the effects of other variables that will affect the overall accident rate. The estimate of the effect of the adverse factor is based on the combined data from many event-control pairs. In this instance it is difficult to use the accident data we have because our data is only by month and it is difficult to establish a reasonable control month. Any monthly period is likely to have some rain and if we select a control month in the same year there will be other significant differences in hours of daylight etc. Alternatively, if we select control months from a different year trends in other factors (road design etc) will make the event-control comparison invalid. Our alternative is to make use of our claim data which we have on a daily basis. We also made use of mainly rainfall data which we had for a number of weather stations across NSW.13
15 Our data covered period 1st of January 1999 to 31st of December 2003. Before we tried the matched pair approach we did a number of simple analyses.
4.4.1 Ranking For each region we ranked the days of experience by rainfall and plotted the following data for the claims in that region:
• The average total numbers of claims in each decile
1412 Matched Sampling and Weather Hazards – Dr J Andrey. http://people.hofstra.edu/geotrans/eng/ch7en/ch7menu.html 13 Bureau of Meteorology

- 18 -
• A box plot for each decile showing the daily number of claims The graphs below show sample plots for the Sydney and Hunter regions.
RAINFALL DECILES
SYDNEY REGION Decile Obs Average
Rainfall Average # Claims
2 2398 0 16.01 4 133 0.03 16.91 5 542 0.10 15.01 6 507 0.59 14.89 7 510 1.75 16.17 8 511 4.92 17.54 9 511 21.90 19.99
HUNTER REGION Decile Obs Average
Rainfall Average # Claims
3 3210 0 4.65 6 356 0.33 4.92 7 489 1.55 4.98 8 502 5.54 5.17 9 507 23.91 6.23
SYDNEY REGION
Box plot for each decile Plot of mean values in each decile HUNTER REGION
Box plot for each decile Plot of mean values in each decile
The mean value graphs look to have an upward slope from left to right which suggests that there is a trend of increasing claims with increasing rainfall but the relationship is by no means clear before the highest two deciles.
Average number of claims
15
16
17
18
19
20
21
0 10 20 30Rainfall
Average number of claims
4.5
4.75
5
5.25
5.5
5.75
6
6.25
6.5
0 10 20 30Rainfall

- 19 -
4.4.2 Correlations A second simple test we did was to assess the correlation of the number of claims of different severities with the number of millimetres of rain recorded. We saw from the graph for Sydney above that the relationship between rainfall as measured in millimetres was unlikely to be a linear one so we also calculated the correlation of the claims variables with the log of the rainfall. These correlations are shown in the table below.
Variable Daily Rainfall Log (1+daily rainfall) Sev 0 claims 0.057 0.049 Sev 1 claims 0.076 0.077 Sev 2 claims 0.061 0.056 Sev 3 claims 0.034 0.031 Sev 4 claims 0.017 0.022 Sev 5 claims 0.006 0.008 Sev 6 claims 0.018 0.016 All claims 0.077 0.074
Given the unclear functional form of the relationship between the rainfall and claims variables it is difficult to draw strong conclusions from the numerical values calculated, however we noted the following:
• All the values shown are positive - confirming the expected result that
more claims occur when there is more rainfall • The correlations are stronger for the lower severity claims. This
suggests that lower rainfall will have a greater impact on numbers of claims than on the total cost of claims
4.4.3 Matched Sampling We used the matched sampling technique on our dataset of daily weather and claim information for NSW. The approach we took was as follows:
1 Identify reasonable categories for daily rainfall 2 For each region identify “events” where the daily rainfall was in a
given category 3 Find a control day for each event where there was no rain by using the
experience either one week or two weeks later 4 Sum up the number of claims of different severities and calculate the
ratio of claims during the events to that during the controls
This approach should control for factors such as changes in road conditions and systems, vehicle safety and drivers attitudes over the 10 year observation period, for differing hours of daylight at different times of year and for differing patterns of road use over the week. We also excluded experience for 2 months either side of the time the New Act was introduced to ensure each of the event-control pairs were in the same legislative environment. The daily rainfall and claims experience for each region in our data were as follows:

- 20 -
Days of Rainfall in Period (“Event days”) Region Nil 0 – 1.5 mm 1.5 – 5 mm 5 – 15 mm 15+ mm Central Western 2,704 1,071 502 467 215 Hunter 3,121 611 433 440 354 Illawarra 3,039 726 485 429 280 Murray 3,154 789 452 413 151 New England 3,698 375 346 335 205 North Coast 2,639 712 620 552 436 Sydney 2,327 1,339 576 473 244 All claims 20,682 5,623 3,414 3,109 1,885 Number of Claims during Event Days Region Nil 0 – 1.5 mm 1.5 – 5 mm 5 – 15 mm 15+ mm Central Western 5,057 1,958 928 983 542 Hunter 14,479 3,014 2,253 2,263 2,325 Illawarra 22,885 5,314 3,849 3,559 2,855 Murray 547 116 60 55 31 New England 7,635 785 696 798 564 North Coast 1,185 350 294 264 248 Sydney 37,077 20,313 9,639 8,678 5,120 All claims 88,865 31,850 17,719 16,600 11,685
We have examined the experience for all claims and then for claims of different severities. As there are comparatively few claims for the higher severity levels we have simply grouped them into three categories: Severity 0 & 1, Severity 2 & 3 and Severity 4, 5 & 6. We have only shown the results for all regions combined and for Sydney as these have the most data. We would note that the impact of rainfall would be different in the other regions as factors such as road design, driver attitudes and vehicle mix would be likely to interact in some way with the effect of rain.
All Regions Ratio of Event to Control Claim Numbers
Severity 0 – 1.5 mm 1.5 – 5 mm 5 – 15 mm 15 + mm Severity 0 & 1 0.96 1.06 1.10 1.38 Severity 2 & 3 0.96 1.05 1.12 1.26
Severity 4, 5 & 6 0.96 1.01 1.03 1.20 All claims 0.97 1.05 1.10 1.33
Event-Control Ratio for All Claims
50%
60%
70%
80%
90%
100%
110%
120%
130%
140%
150%
Severity 0 & 1 Severity 2 & 3 Severity 4, 5 & 6 All Claims
Rainfall 0 - 1.5 mm Rainfall 1.5 - 5.0 mm Rainfall 5 - 15 mm Rainfall 15 mm +
- 21 -
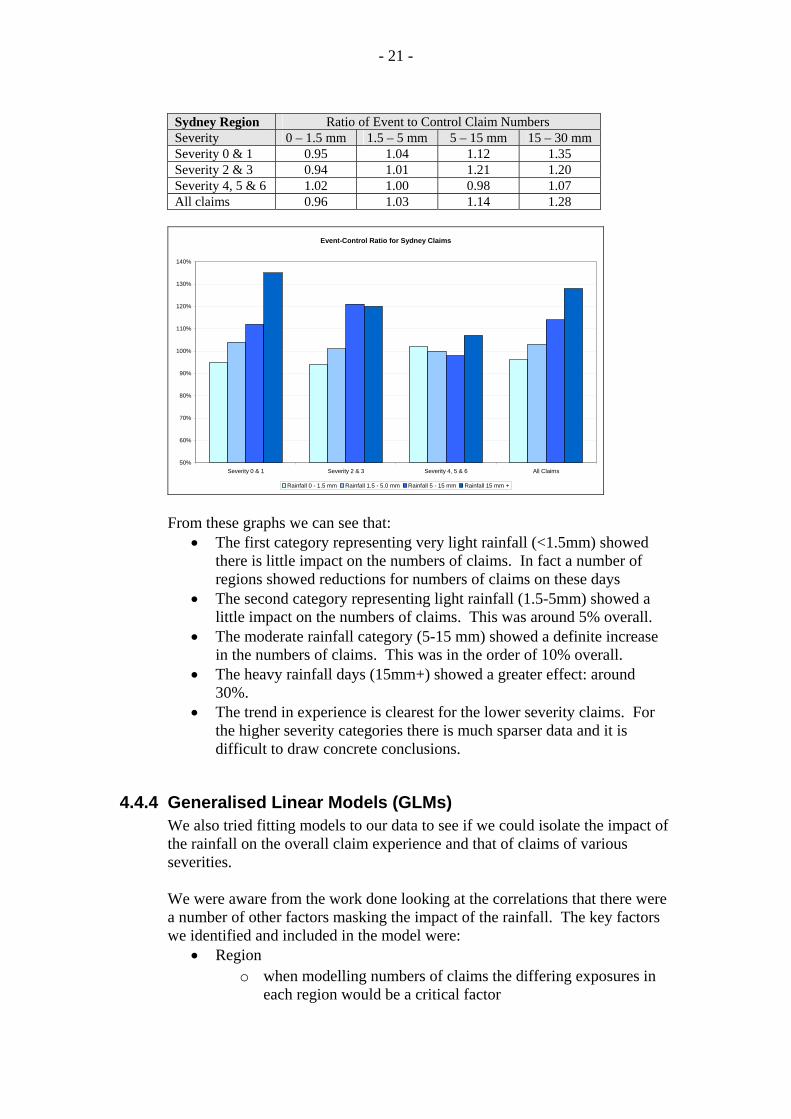
Sydney Region Ratio of Event to Control Claim Numbers Severity 0 – 1.5 mm 1.5 – 5 mm 5 – 15 mm 15 – 30 mm Severity 0 & 1 0.95 1.04 1.12 1.35 Severity 2 & 3 0.94 1.01 1.21 1.20 Severity 4, 5 & 6 1.02 1.00 0.98 1.07 All claims 0.96 1.03 1.14 1.28
Event-Control Ratio for Sydney Claims
50%
60%
70%
80%
90%
100%
110%
120%
130%
140%
Severity 0 & 1 Severity 2 & 3 Severity 4, 5 & 6 All Claims
Rainfall 0 - 1.5 mm Rainfall 1.5 - 5.0 mm Rainfall 5 - 15 mm Rainfall 15 mm +
From these graphs we can see that: • The first category representing very light rainfall (<1.5mm) showed
there is little impact on the numbers of claims. In fact a number of regions showed reductions for numbers of claims on these days
• The second category representing light rainfall (1.5-5mm) showed a little impact on the numbers of claims. This was around 5% overall.
• The moderate rainfall category (5-15 mm) showed a definite increase in the numbers of claims. This was in the order of 10% overall.
• The heavy rainfall days (15mm+) showed a greater effect: around 30%.
• The trend in experience is clearest for the lower severity claims. For the higher severity categories there is much sparser data and it is difficult to draw concrete conclusions.
4.4.4 Generalised Linear Models (GLMs) We also tried fitting models to our data to see if we could isolate the impact of the rainfall on the overall claim experience and that of claims of various severities. We were aware from the work done looking at the correlations that there were a number of other factors masking the impact of the rainfall. The key factors we identified and included in the model were:
• Region o when modelling numbers of claims the differing exposures in
each region would be a critical factor

- 22 -
o each region would also have different experience from different traffic volumes
• Year o we know that CTP claim frequency has been decreasing over
recent years, so a year variable would be a proxy for this trend in experience
o this would also allow for IBNR
We fitted two GLMs to model the number of claims, firstly with claims as a function of region and year and then as a function of region, year and rainfall. Adding rainfall as an explanatory variable only resulted in marginal improvements in the model fit as measured by the R2 value and deviance, however the rainfall parameter was significant.
There were a number of difficulties encountered in fitting the GLM, in particular:
• A number of different models produced similar fits but fitted quite different functional forms
• It was difficult to isolate the rainfall variable as one would expect it to be correlated in some way with other possible explanatory variables such as region, month or year. However if we exclude all such variables in the modelling the explanatory ability of the rainfall information becomes lost.
• As a result of these difficulties we discarded this analysis in favour of the matched sampling approach.
4.4.5 Impact on Claim Frequency The analyses show there is a significant impact of rainfall on claim frequency. However, we have not yet answered the question: “Has the level of rainfall had a significant impact on the claim frequency reductions that we have observed in recent years?”
In order to examine this on a state-wide basis we would need good data on the number of registrations in each area. We therefore chose just to examine the Sydney region.
The annual total rainfall and average over the period examined are shown in the graph below.

- 23 -
Annual Rainfall - Sydney
0
0.2
0.4
0.6
0.8
1
1.2
1.4
1.6
1.8
2
1990 1991 1992 1993 1994 1995 1996 1997 1998 1999 2000 2001 2002 2003
Year
Tota
l Ann
ual R
ainf
all (
m)
We can see that the last few years the rainfall has been below or close to the average but that this was also the case for much of the period from 1991 to 1997. The numbers of days in each of our rainfall categories for the last three years are as shown below:
Year Nil <1.5mm 1.5-5mm 5-15mm 15mm+ 2001 155 123 29 35 23 2002 180 108 34 28 15 2003 189 77 45 37 17
Average 1990-2003 171 98 43 35 18
The matched sampling analysis showed that there was little difference in the claim experience on a light rain day to that on a dry day, thus it is only the heavy rainfall days that make a significant difference. If we graph the experience in the higher rainfall categories for the last few years we can see that there have been below average numbers of days of high rain but that the variation from average is small.
Recent Rainfall Experience
05
10152025303540
5-15mm 15mm+
Rainfall Category
No
of d
ays
Average 2001 2002 2003

- 24 -
In order to quantify the impact this may have on the annual claim frequency we applied risk loadings of 5% to the 1.5-5mm category and 10% to the 5-15mm and 30% for the 15mm+ categories. These factors were selected using the matched sampling results. We then applied the loadings to the number of days in each category for a given year and normalised for a year of average rainfall. This showed that we would expect the rainfall to have had the following impacts on claim frequency as compared to the long term average:
-1.0%
-0.5%
0.0%
0.5%
1.0%
1.5%
1990
1991
1992
1993
1994
1995
1996
1997
1998
1999
2000
2001
2002
2003
Year
Diffe
renc
e to
Ave
rage
The frequency variations due to rainfall are less than 1% magnitude for all but one year in the period and in general the deviation from the long term average has only been by around 0.5%. These differences are comparatively small. For illustration in the recent NSW CTP environment a 1% change in frequency might mean a shift from 0.300% to 0.297%. We would therefore conclude that weather may have been a contributing factor to the reductions in claim frequency but that it is unlikely to have been one of the major factors.

- 25 -
5 Summary
In Section 2 of our paper we showed that there have been significant reductions to the frequency of both casualties and third party claims from traffic accidents. In Section 3 we developed a framework for examining the factors influencing this experience and investigated elements of this framework in Section 4. Using this framework, we would suggest that the major difference between trends in numbers of casualties and numbers of claims is the changing propensity to claim.
5.1 Review of Investigations of NSW Experience
In Section 4.1 we showed that there had been a dramatic reduction in the numbers of accidents over the period 1975 to 1992 and a continued but slower reduction for the period since then. We have not been able to examine all the factors we think have contributed to this but have shown there is a clear correlation between trends in numbers of random breath test failures and numbers of fatal accidents. In Section 4.2 we examined trends in the numbers of casualties per accident. The data for the last 25 years shows that although the overall casualty rate changed little the rates for more severe casualties have reduced. We hypothesised that a key factor in the number of casualties is vehicle safety and used research done by Monash University to show the improvements in vehicle “crashworthiness” have been broadly consistent with the decline in numbers of fatalities. We also noted the increase in numbers of casualties from the late 1990’s onwards and noted that this appears to be at least partially attributable to increased usage of 4WDs. We also noted that there has been a divergence between the casualty experience for drivers and passengers but have not been able to explain this change. In Section 4.3 we noted the legislative changes of 1999 have had greatest impact on the claim rate of drivers and passengers, reducing the claims per casualty by a greatest amount for this group than for other road users.
In Section 4.4 we examined the influence of rainfall on CTP claims in NSW. We demonstrated that there is some correlation between daily claim numbers and rainfall, in particular for the lower severity claims and used a matched sampling approach to show that the risk of claims may increase by up to 30% for days of heavy rain. However when we examined the impact this would

- 26 -
have on experience over a year we concluded that changes in rainfall would have caused the underlying claim frequency to vary by less 1% in most years.
5.2 Propensity to Claim
The framework we developed in Section 3 uses the term propensity to claim to represent the number of eligible third party casualties who become claimants.
The trends in the ratio of claimants to casualties are shown in the graph below.
Change in Claim Propensity by State
Base year = 1995
40
60
80
100
120
140
160
1990
1991
1992
1993
1994
1995
1996
1997
1998
1999
2000
2001
2002
2003
Accident Year Ending 31-Dec
NSW
VIC
QLD
ACT
NT
Note: This is not the same as the ratio of claimants to eligible third party casualties developed in our framework, but is a reasonable proxy for it and has the advantage of being readily available
This shows the following trends in experience:
• In New South Wales we have seen the propensity to claim fall steeply in recent years after the introduction of “Motor Accidents Compensation Act” in 1999, referred to as the “New Act”.
• In Queensland we saw a rapid increase in propensity to claim in the 1990’s followed by significant reductions since 1999.
• In the ACT we have seen rapid increases in propensity to claim over the period 1999-2002.
• In Victoria and the Northern Territory we have seen comparatively stable experience.
Changes in this actual propensity to claim are due to environmental and behavioural factors. The decision by a potential claimant to commence a claim will reflect an implicit cost-benefit analysis done by the claimant. They may be influenced by:
• The benefits available • The difficulty or perceived difficulty in accessing the benefits • Their own attitude and values • The attitudes of other stakeholders • The claimant’s (including claimant’s legal representative) knowledge
of the system

- 27 -
It is interesting to note that in NSW the benefits available over the 5 year period following the introduction of the New Act in 1999 have not changed, however claimants’ behaviour has changed over this period of time.
The effect of the provisions in the New Act was to reduce the benefits available to some potential claimants and also reduce the cost awards to legal representatives. Not surprisingly this has had the effect of reducing the numbers of claimants. More interesting is the length of time over which there has been a continued reduction as claimants and their advisors have gained understanding of the revised benefit entitlements. Over the period since 1990 the magnitudes of the changes in propensity to claim has exceeded that of changes in the numbers of accidents and in the numbers of casualties. We suggest that the main cause of changing propensities to claim is the benefits available within the Scheme and takes no great leap of faith to conclude that changes to Scheme design have been the single largest factor contributing to the reductions in claim frequency in recent years.