Embed Size (px)
Citation preview

DETERMINANTS OF ECONOMICS PROFICIENCY AMONG ARKANSAS K-12
TEACHERS AND THEIR ROLE IN TRAINING WORKSHOP EFFECTIVENESS
by Jennifer Logan and Brian Logan.
College of Business
Southern Arkansas University
P.O. Box 9285
Magnolia, AR 71754-9285
Phone: (870) 235-4310
Email: [email protected]
DETERMINANTS OF ECONOMICS PROFICIENCY AMONG ARKANSAS K-12
TEACHERS AND THEIR ROLE IN TRAINING WORKSHOP EFFECTIVENESS
ABSTRACT
This paper assesses the impact of teacher-training workshops on economic
literacy rates among high school teachers in the state of Arkansas. After the 2010
adoption of new frameworks for teaching economics, many Arkansas social studies
teachers will be working in unfamiliar subject areas. To address this, Economics
Arkansas, a non-profit educational organization, held a statewide series of activity-based
teacher training workshops throughout the summer of 2010. These workshops were
specifically designed to familiarize teachers with fundamental concepts in
microeconomics, macroeconomics, international economics and personal finance as
specified in the state frameworks.
Workshop effectiveness is measured using the TEL, or Test of Economic
Literacy, a nationally standardized economics exam for high school students. Pre and
post-tests were administered at the beginning and end of the workshop, respectively.
Scores from 7 teacher-training workshops are then aggregated to provide an overall
assessment of workshop effectiveness on economic literacy rates among the sample of
teachers in attendance.
INTRODUCTION
The Council for Economic Education is a non-profit organization that promotes
economy literacy and personal finance skills. The council delivers its educational
programs through a diversified network of state councils and university-based centers for
economic education. The state councils and centers provide these educational
services/programs according to state educational frameworks, teacher licensing
requirements, and resource availability.
The Council for Economic Education reported in their Survey of States that forty-
nine states as well as the District of Columbia had adopted economic standards into their
state curriculum by 2004 (CEE, 2005). Additionally, an economics class is required as a
course offering in 17 states, while students are required to attend an economics course in
15 states. Rebeck and Walstad (2000) show that student enrollment in economics courses
as a percentage of all high school graduates steadily increased from less than 24% to
almost 44% between 1982 and 1990. Since that time, enrollment levels have continued
to increase, so that by 2005 at least one-third of all U.S. high school graduates have
received some formal economic instruction. As of 2005, 49 states and the District of
Columbia include economics in their state-mandated frameworks (CEE, 2005). Some
studies have argued that the majority of secondary social studies teachers are
inadequately prepared to teach economics (Cargill, Jurosky and Wendel, 2008, and
Angrist and Guryan, 2004). Several studies such as Taylor, Yates, Meyer and Kinsella
(2011), Angrist and Guryan (2004), and Walstad (2001) promote teacher-training
workshops that are specific, concise, and comprehensive in their coverage of the material.
The Arkansas Department of Education has recently mandated that economics is
to be a required course in the high school curriculum. Up until this year, economics was
offered as an elective in many high school social studies curricula. School districts have
the choice to include economics in their social studies curriculum or their business and
career planning curriculum. Most schools have taken a social studies approach, pairing
economics and civics into one semester classes for ninth grade Arkansas students. As a
result, many social studies teachers will be instructing in economics with relatively little
experience with the subject. To address this concern, Economics Arkansas held a series
of 5-day workshops throughout the state in June and July 2010.
This change in state educational mandates creates an opportunity to assess the
effectiveness of such workshops on economic literacy rates of K-12 teachers. Teachers
were given a pre-test at the beginning of the workshop and a post-test at the end. The
pre-tests and post-tests are very similar, but are not the same exam. Scores from the
completed exams were compiled, along with background demographic and educational
information from the participating teachers. These scores were used to assess the
effectiveness of Economic Arkansas workshops on the economic literacy rates of K-12
Arkansas teachers.
RELATED STUDIES
Horton and Weidenaar (1975) states that the objective of economic education is to
“improve our understanding of the world in which we live” (p.42). They refer to this
statement as the consensus goal that was developed based on the distribution of
questionnaires to various economists, economic educators, teachers, and social scientists.
This goal includes smaller components of the economic big picture such as market
participants, decision-making and societal impacts.
Many of the states and school systems requiring economic instruction do not
require teacher certification in economics. Many fear that this results in “less-than-
qualified teachers” (Marlin, 1991, p. 5) tasked with the challenge of instructing in a field
where they have little experience. Furthermore, these teachers may develop negative
attitudes towards the course that may adversely influence students’ perceptions of
economics. Marlin (1991) investigates the relevance of these concerns using data from a
National Assessment of Economic Education (NAEE) survey conducted in 1987. The
findings of this study show that state mandates do have a negative effect on teacher
attitudes regarding economics as a subject. Secondly, negative teacher attitudes have a
direct impact on student learning. Lastly, Marlin (1991) finds that increased economic
education such as teacher training seminars and developmental instruction can have a
positive influence on teachers’ attitudes thereby improving student performance.
Teacher motivation levels may also be positively influenced by active-based
learning as discussed in Salemi (2003) and Salemi, Saunders and Walstad (1996). Active
learning advocates argue that activity-based learning engages the participants and holds
their interest, thus leading to potentially higher comprehension levels. Michel, Cater, and
Varela (2009) suggest that this teaching style helps students to develop analytical skills as
well as engages the students in reflective learning.
To address the lack of experience in economics observed for a substantial number
of secondary social studies teachers, Cargill, Jurosky and Wendel (2008) conduct a study
of a proposed Pilot Transition Program designed to help teachers integrate economics
into pre-existing civics classes. This is referred to as the “compromise path” in which
teachers were invited to attend a series of training seminars. Participating teachers
received condensed economics training in which they were presented an autonomous
nine-week course module designed to be included with a one-year high school civics
course. Pre- and post tests were administered to measure resulting changes in teacher

performance on the Test of Economic Literacy (TEL). Results demonstrated that overall,
participating teachers showed improvement in their levels of economic literacy. It is
assumed that higher levels of economic literacy rates among teachers will result in better
student outcomes.
DATA COLLECTION
This analysis is based on a similar study conducted by the Mississippi State
University Center for Economic Education and Financial Literacy. There have been very
few statewide studies of student economic literacy and even fewer studies of teacher
aptitude using generally accepted standardized test scores. The method employed as well
as the process of data collection in this research is closely based on the procedures used
in Grimes, Millea, and Thomas (2010).
Release and Consent forms were initially distributed and explained, thus all
teachers choosing to take part in this study did so voluntarily and informed of their rights
as human subjects. Teachers were then asked to fill out a questionnaire asking
demographic and education-related questions. Participating teachers were given a pre-
test to determine their initial level of economic literacy. At the end of the workshop,
teachers took a post-test. Pre and post-test scores were then aggregated and compiled in
order to assess the amount of improvement (or reduction in some cases) in understanding
among the participating teachers. The inclusion of the post-test scores allows for
comparisons of teachers’ economic literacy rates before and after the training workshop.
The Test of Economic Literacy, or TEL, was administered as the testing
instrument for the pre-test and post-test. The TEL exam consists of 40 multiple choice
questions. This test is divided into four individual parts: (1) Fundamentals of economics,
(2) Microeconomics, (3) Macroeconomics and (4) International Economics.
Economics Arkansas conducted a series of seven teacher-training workshops
throughout the state during the summer of 2010. These workshops lasted for five days.
Each day focused on a subset of the state-mandated frameworks in the following order:
(1) Economic Fundamentals, (2) Microeconomics, (3) Macroeconomics, (4) International
Economics, and (5) Personal Finance. From these seven training workshops, 182
teachers attended. Of the 182 teachers in attendance, 178 agreed to participate in the
study, providing 167 usable surveys and exams.
METHODOLOGY
The analysis in this study follows the econometric approach presented in Becker
and Walstad (1987) and used in Grimes, Millea, and Thomas (2010). This approach
estimates an educational production function where a measure of economic literacy is
modeled as a function of teachers’ demographic characteristics, personal endowments,
and environmental influences. Specifically, this model projects the following
relationship for individual teachers in the sample:
Personal Economic Literacy = f (D, E, H, T)
Where D denotes a vector of teachers’ demographic characteristics, E denotes a vector of
educational attainment, H denotes a vector of teachers’ human capital development, and
T denotes a vector of the teaching environment. Each teacher’s personal economic
literacy is measured based on their observed pre-test score. Equation [1] is provided
below:
[1] L = α0 + α1Di + α2Ei +α3Hi + α4Ti + εi.
Specifically, Di = (gender, age, race, first generation); Ei = (economics hours, master,
major); Hi = (training, continuing education credits earned); Ti = (subjects, average class
size, and high school) for each teacher, i. Table 1 provides a summary of the explanatory
variables and their expected signs. An explanation of their predicted signs is presented
below.
Demographic characteristics of teachers may explain a portion of initial economic
literacy rates, and thus pre-test scores, of participating teachers. GENDER and RACE
are controlled for using dummy variables. Specifically, studies estimating the gender gap
between male and female standardized test scores in economics have found that males
significantly outperformed females (Allgood and Walstad, 1999; Heath, 1989).
Additionally, racial minorities are predicted to have lower economic literacy rates relative
to Caucasian teachers as discussed in Grimes and Nelson (1998). The predicted
coefficient sign on the AGE variable is negative, implying that older teachers may react
more adversely to changes in curriculum relative to younger teachers. The predicted
coefficient sign for the 1st GENERATION variable is negative, suggesting that teachers
coming from a household in which one or both parents attended college may have grown
up with a larger emphasis on education relative to those whose parent(s) did not attend
college.
Teachers’ educational attainment is measured using the number of college
economics hours earned; the attainment of a Master degree, as well as the teacher’s
declared undergraduate major as reported on surveys. The predicted positive coefficient
sign for ECON HOURS and MASTER suggests that either teachers with more economics
hours or those with more overall hours are expected to earn relatively higher pretest
scores. This assumption is based on the findings of Lamb and Jacobs (2009). Lastly, the
estimated DEGREE MAJOR coefficient is predicted to be positive, suggesting that
teachers with a major in a disciplinary field will outperform teachers who majored in
education as discussed in Angrist and Guryan (2004) and Ballou (1996).
Teachers acquire professional development by attending training seminars and
accumulating continuing education units (CEUs) as required by school districts. This
study hypothesizes that as teachers attend additional training seminars conducted by
Economics Arkansas and the Federal Reserve, their economic literacy rates should
improve. Additionally, as teachers earn more credits in continuing education,
comprehension levels should increase in subjects where he/she teaches as discussed in
Green (2010) and Morewood, Ankrum and Bean (2010). For this reason, the predicted
coefficient sign on CONTINUING EDUCATION is predicted to be positive.
This study uses survey responses to measure factors of the teaching environment
such as the number of additional subjects taught within an academic year, average class
size, and whether the teacher instructs at the high school level or K-8 level. On the other
hand, the estimated coefficient signs on SUBJECTS and CLASS SIZE are hypothesized
to be negative based on the reasoning that as either the number of subjects taught or the
average class size increases, teachers’ resources are further stretched leading to lower
economic literacy rates. This prediction is based on the findings of Wyss, Tai and Sadler
(2007), Boozer and Rouse (2001), and Nye and Hedges (2001).
Lastly, the inclusion of the HIGH SCHOOL dummy variable allows for the
overall sample of teachers to be divided into various cohorts for comparison purposes as
seen in Grimes, Millea, and Thomas (2010). The individual cohorts include the overall

group of K-12 teachers, K-8 teachers, and high school teachers for grades 9-12.
Estimated coefficient signs on HIGH SCHOOL are predicted to be positive since many
high school teachers have already taught economics either as an individual elective or as
part of another course such as civics while K-8 teachers are less likely to have much
experience teaching economics.
RESULTS
Table 2 provides an overview of observed descriptive statistics including variable
means and standard deviations across the various grade levels taught. Pre-test (Form A)
and post-test (Form B) scores are presented for each teacher cohort. Pre-test score means
were 75.27%, for the overall sample. Subsample pre-test score means were 78.09% and
60% for high school and K-8 teachers, respectively. In each teacher cohort, the
Microeconomics section of the test received the highest scores in percentage terms. The
International section of the pre-test acquired the lowest scores for high school teachers as
well as the overall sample while K-8 teachers scored the lowest on the Macroeconomics
test section.
Post-test scores show very similar results, with score means of 78.8% for the
overall sample while high school and K-8 teachers had score means of 80.89% and
67.5%, respectively. As seen with the pre-tests, the International section of the TEL
displayed the lowest performance levels for high school teachers as well as the overall
sample while K-8 teachers again scored the lowest on the Macroeconomics section.
Observing the change in scores from pre-tests to post-tests, K-8 teachers
demonstrated the highest improvement in test scores. As shown in Table 2, high school

teachers demonstrated an improvement in economic literacy of over 2.8% while the
overall sample showed an improvement of over 3.5%. The K-8 teaching cohort observed
an increase in test scores of 7.5%. Likewise, K-8 teachers improved their test scores in
each section, with the highest gains shown in the Fundamentals section of the TEL. This
section also exhibits the highest improvement in scores for high school teachers as well
as the overall sample. Although K-8 teachers displayed improved scores for each
section, this was not the case for the other teacher cohorts. High school teachers as well
as the overall sample displayed modest losses in the Macroeconomics section, again
demonstrating a weakness in this section among teachers.
The results were statistically insignificant for changes in performance levels from
the pre-tests to the post-tests. However, there are a few findings to take note. First,
corresponding standard deviations decline from the pre-test observations to the post-test
scores. This shows that as performance rates increased, variability was reduced,
suggesting better uniformity of economic literacy rates among trained teachers relative to
prior observed knowledge. This could be a benefit of training programs for those who
create and implement frameworks to help understand the effectiveness of curriculum.
The curriculum is unlikely to be effectively administered with excessive variance in
economic literacy among teachers.
Many high school teachers have been instructing economics either as an
individual elective or as a part of another course, making them more familiar with the
concepts included on the TEL. Additionally, the TEL is designed for high school
students that have been learning high school level economics while K-8 teachers may not
cover the same concepts. This observed discrepancy between high school teachers and
K-8 teachers supports the findings of France, Summary, and Vasegh-Daneshvary (1989)
and explains a certain “catch-up-effect” occurring within this teacher cohort relative to
the others.
The observed TEL scores show that Arkansas teachers are literate in economics
relative to national high school students. When compared to the aggregate statistics for
high school students involved in the 1999-2000 TEL norming sample, Arkansas teachers’
scores demonstrate their level of understanding of the material. Norming sample
statistics show that the overall sample of U.S. students scored approximately 59.63% on
the pre-test and 61.25% on the post-test. Additionally, high school students with some
economics instruction scored 62.68% on the pre-test and 64.35% on the post-test
(Walstad and Rebeck, 2001). Notice that each sub-sample of teachers scored a higher
mean score than those reported in the norming sample for high school students.
Pre-Test Results
Equation [1] was estimated using the pre-test TEL scores for three separate
groupings of teachers: K-12 teachers, K-8 teachers, and 9-12 teachers. Standard
Ordinary Least Squares (OLS) was used and the results are presented in Table 3. The
resulting coefficients are provided with the corresponding t-statistics shown in
parentheses.
The coefficient on GENDER is positive and significant at the 5% critical value
level for the K-12 teacher group. This estimate suggests that male teachers performed
significantly better on the TEL relative to female teachers. This result supports the
findings discussed in Allgood and Walstad (1999) and Heath (1989). Although the

resulting coefficients for the remaining two subsamples were also positive they were not
significant.
The estimated coefficient on AGE is observed to be negative and significant at the
5% critical value level for K-8 teachers. This finding is consistent with earlier
predictions. However, the AGE coefficient is positive and significant at the 10% level
for high school teachers. Although this second finding contradicts the initial predictions
of the paper, perhaps it suggests that a learning curve exists for high school economics
teachers. In other words, those with more experience teaching economics at a level with
higher rigor relative to teachers in grades K-8 tend to demonstrate a higher level of
proficiency.
The results suggest that racial minorities scored significantly lower on the TEL
relative to Caucasian teachers. The coefficient on RACE is negative and statistically
significant at the 1% critical value level in each case. As shown in Table 3, the
coefficient of -24.17 shows that racial minorities tend to score approximately 24
percentage points lower than Caucasian teachers in the overall sample. This finding is
consistent with earlier studies of college student performance on nationally standardized
economics exams such as Grimes and Nelson (1998).
Economics hours earned in a teacher’s college experience are statistically
significant and positively correlated with economic literacy rates for the overall sample as
well as for high school teachers. As ECONOMICS HOURS earned increased by one,
economic literacy rates increased by approximately 0.79 percentage points for K-12
teachers and 0.75 percentage points for high school teachers. These results support the
findings of several previous studies (Walstad, 2001; Allgood and Walstad, 1999;

Bosshardt and Watts, 1990). Neither of the remaining educational attainment variables
were found to be significant in this analysis.
The coefficient for TRAINING was positive and statistically significant for
teachers in the K-8 cohort. Estimates were positive but not significant for the overall
sample as well as for high school teachers. This finding implies that teachers in the K-8
teacher cohort gained the most from professional development training. The results show
that K-8 teachers were likely to demonstrate a higher proficiency level on the TEL,
approximately 12.85 percentage points, relative to the other teacher cohorts. This finding
supports earlier predictions.
The estimated coefficient on class SIZE is negative and statistically significant for
teachers in the overall sample as well as high school teachers. The findings imply that as
class sizes increase, K-12 teachers tend to score 0.5 percentage points lower on the TEL
while high school teachers are likely to score 0.61 fewer points. These results support the
findings of Wyss, Tai and Sadler (2007), Boozer and Rouse (2001) and Nye and Hedges
(2001).
Lastly, the HIGH SCHOOL categorical variable included in the overall sample is
positive and statistically significant. This indicates that high school teachers
outperformed their K-8 counterparts by over 12 percentage points. These results are not
surprising since economics has been an elective in the majority of state high schools for
many years.
Post-Test Results
Equation [1] was again estimated using the post-test TEL scores for three separate
groupings of teachers: K-12 teachers, K-8 teachers, and 9-12 teachers. Standard
Ordinary Least Squares (OLS) was used and the results are presented in Table 4. The
resulting coefficients are provided with the corresponding t-statistics shown in
parentheses.
The resulting coefficients for the demographic characteristic variables are similar
to those discussed in the pre-test results. The coefficient on GENDER is positive and
significant at the 10% critical value level for the K-12 teacher group. This estimate
suggests that male teachers continued to outperformed their female colleagues at the end
of the weeklong seminar. This finding supports the results discussed in Allgood and
Walstad (1999) and Heath (1989). The estimated coefficient on AGE is negative and
significant at the 5% critical value level for K-8 teachers. This finding is consistent with
earlier predictions.
The results continue to demonstrate that racial minorities tend to score lower on
the TEL test relative to Caucasian teachers following the training seminar. The
coefficient on RACE is negative and statistically significant at the 1% critical value level
for the overall sample as well as for high school teachers. As shown in Table 4, the
coefficient of -18.11 shows that racial minorities tend to score approximately 18
percentage points lower than Caucasian teachers in the overall sample. This finding is
consistent with Grimes and Nelson (1998).
Economics hours earned continues to be positively correlated with economic
proficiency in this analysis. Following the 5-day training seminar, teachers with college
ECONOMIC HOURS were likely to outperform their peers by 0.54 percentage points for

the overall sample and by 0.49 percentage points among high school teachers. The
estimated coefficients are significant at the 5% critical value level in both cases. These
results continue to support the findings of several previous studies (Walstad, 2001;
Allgood and Walstad, 1999; Bosshardt and Watts, 1990). Neither of the remaining
educational attainment variables were found to be significant.
The estimated coefficient on class SIZE is negative and statistically significant for
teachers in the overall sample as well as high school teachers. The estimates demonstrate
that as class sizes increase, K-12 teachers tend to score 0.36 percentage points lower on
the TEL while high school teachers are likely to score 0.48 fewer points. These findings
support Wyss, Tai and Sadler (2007), Boozer and Rouse (2001) and Nye and Hedges
(2001).
Lastly, the HIGH SCHOOL categorical variable included in the overall sample is
positive and statistically significant. This indicates that high school teachers
outperformed their K-8 counterparts by over 11 percentage points following the
weeklong training seminar. These results are consistent with findings from the pre-test
teacher performances, suggesting a persistent difference between high school and K-8
teachers.
Pre - Post Results
Equation [1] was estimated using the difference between pre-test and post-test
scores. The specification is included to provide a clearer view of the relationship
between the determinants of teacher proficiency and workshop effectiveness. Results
from this estimation are shown in Table 5.

The estimated coefficients for RACE are positive and significant for each teacher
cohort. Recall the robust results of a negative correlation between racial minorities and
economic proficiency discussed previously in the paper. The earlier finding suggested
that teachers in a racial minority came to the workshop with a relatively lower level of
economic proficiency than Caucasian teachers. The estimated coefficients reported in
Table 5 demonstrate that teachers belonging to a racial minority showed relatively larger
gains in economic proficiency between the pre-test and post-test at the end of the 5-day
seminar. In other words, the economic workshop helped to improve economic literacy
more among teachers of a racial minority relative to Caucasian teachers that attended the
training. Although this result is the strongest for teachers in the K-8 cohort, this cohort
was the smallest in the sample with 26 of the 167 usable surveys and exams. Closer
inspection of the K-8 data reveals an imbalance between the number of minority and
Caucasian teachers coupled with an extreme outlier among the post - pre scores calls into
question the reliability of the race coefficient for the K-8 subsample.
Teachers with a MASTER degree did not perform at a higher level of efficiency
on the TEL exam following the workshop. This finding contradicts earlier predictions of
the paper. The interpretation of the authors is similar to the one suggested above. Due to
the small size of this particular cohort, a few teachers with Master degrees could be
establishing this correlation. For some teachers with Master degrees that have a
relatively high level of proficiency, large gains in economic proficiency are not
reasonable expectations given their experience and mastery. All other variables in the
post-pre specification are insignificant.

CONCLUDING REMARKS
This analysis identifies several factors that explain a teacher’s initial performance
on a standardized economics exam prior to receiving formal training in the subject.
Heterogeneity among teachers participating in this study was observed, with significant
differences in test scores correlated with differences in gender, age, race, and economic
hours attended in college. Additionally, this study examines the role of these factors in
the effectiveness of a select number of teacher training seminars for Arkansas teachers.
Workshop effectiveness is measured in terms of performance gains across the
multiple sections of the pre-test and post-test scores for the TEL. All teacher cohorts
showed improvement from pre-tests to post-tests, with K-8 teachers experiencing the
largest aggregate performance gains. These findings suggest that workshops are effective
across teacher groups, even with varying incoming proficiency levels. This study
demonstrated that some teachers in a racial minority came to the workshop with
relatively low levels of economic proficiency relative to the Caucasian teachers.
However, it was observed that this same group of teachers experienced larger
improvements in the TEL scores from the pre-test to the post-test. These results indicate
that workshops help lower proficiency groups catch up while still advancing economic
literacy rates for those with higher incoming proficiency levels.
There are several opportunities for future research regarding economic literacy
rates among teachers and workshop effectiveness. First, time series data would be useful
in tracking performance levels over time to measure experience factors as well as specific
workshop topics and coverage. Longitudinal data was used in Allgood and Walstad
(1999), showing that comprehensive teacher training in economics produces a long-run
payoff in economic literacy rates for teachers as well as their students. Second, the
reliability of estimated results would be improved by a larger sample size. This may
involve a joint-state effort or an increase in the number of workshops provided, thus
allowing for increased teacher participation in the study. Third, perhaps additional
testing instruments should be included along with or as a replacement to the TEL. One
potential testing instrument would be the PRAXIS, provided by educational testing
services for teachers as discussed in Angrist and Guryan (2004). Fourth, other
explanatory variables might help explain differences in economic literacy rates among
teachers such as school size to distinguish between urban and rural school districts where
available resopurces for teachers may differ greatly. Also, changes in teacher attitudes
may be possible to quantify, thus allowing for comparison across various teacher cohorts
as discussed in Marlin (1991). Lastly, the methodology may be improved by controlling
for quantitative literacy skills. Some teachers may be inherently strong in the quantitative
skills, thus giving them a relative advantage over teachers whose math skills may be
considered somewhat weak. Burrus, McGoldrick and Schuhmann (2005) address this
concern, explaining that strong quantitative skills may falsely appear as economic literacy
unless it is correctly controlled for. All of these potential outlets for economic literacy
could provide a better overall picture of current economic literacy rates among K-12
teachers and potential workshop effectiveness at addressing demonstrating strengths and
weaknesses across teacher cohorts.

REFERENCES
Allgood, S. and Walstad, W. B. (1999). The longitudinal effects of economic education
on teachers and their students. Journal of Economic Education, 30(2), 99-112.
Angrist, J. D. and Guryan, J. (2004). Teacher testing, teacher education, and teacher
characteristics. American Economic Review, 94(2), 241-246.
Ballou, D. (1996). Do public schools hire the best applicants? Quarterly Journal of
Economics, 111(1), 97-133.
Boozer, M. and C. Rouse. 2001. Intraschool variation in class size: patterns and
implications. Journal of Urban Economics, 50: 163-189.
Bosshardt, W. and Watts, M. (1990). Instructor effects and their determinants in
precollege economic education. Journal of Economic Education, 21(3), 265-276.
Burrus, R., McGoldrick, K., and Schuhmann, P.W. (2005). Student quantitative literacy:
Importance, measurement, and correlation with economic literacy. The American
Economist, 49(1), 49-65.
Cargill, T., Jurosky, J. and Wendel, J. (2008). Implementing economics standards: A
pilot transition program. Journal of Economic Education 39(2): 126-134.
Council for Economic Education. (March 2005). Survey of the States: Economic and
Personal Finance Education in Our Nation’s Schools in 2004. Located at
http://www.councilforeconed.org/about/survey2004 on 8/12/2010.
France, J., Summary, R. and Vasegh-Daneshvary, N. (1989). The impact of economic
education courses on knowledge and retention of knowledge of secondary and
primary teachers. Journal of Economic Education, 20(4): 346-354.
Green, A. (2010). Teachers’ continuing professional development and higher education.
Changing English: Studies in Culture and Education, 17(2): 215-227.
Grimes, P. W., Millea, M. and Thomas, M. K. (2010). Testing the economic literacy of
K-12 teachers: A state-wide baseline analysis. American Secondary Education,
38(3), 4-20.
Grimes, P.W. and Nelson, P.S. 1998. The social issues pedagogy vs. the traditional
principles of economics: An empirical examination. The American Economist,
42(1), 56-64.
Heath, J. A. (1989). An econometric model of the role of gender in economics
education. American Economic Review, 79(2), 226-230.
Horton, R. V. and Weidenaar, D. J. (1975). Wherefore economic education? The
Journal of Economic Education, 7(3), 40-44.
Lamb, L. C., and Jacobs, V. R. (2009). Establishing and maintaining program coherence
in a cohort-based graduate program. Teacher Educator 44(2), 126-142.
Marlin Jr, J. W. (1991). State-mandated economic education, teacher attitudes, and
student learning. Journal of Economic Education 22(1), 5-14.
Michel, N., Cater III, J. and Varela, O. (2009). Active versus passive teaching styles: An
empirical study of student learning outcomes. Human Resource Development
Quarterly 20(4), 397-418.
Morewood, A. L., Ankrum, J. W., and Bean, R. (2010). Teachers’ perceptions of the
influence of professional development on their knowledge of content, pedagogy,
and curriculum. College Reading Association Yearbook (31), 201-219.
Nye, B., and L. Hedges. 2001. Are effects of small classes cumulative? Evidence from
a Tennessee experiment. The Journal of Educational Research. 94(6): 336-346.
Parr, M. (2006). Knowing is not enough: We must do! Teacher development through
engagement in learning opportunities. International Journal of Learning 12(6),
135-140.
Rebeck, K. and Walstad, W. B. (2000). The status of economics in the high school
curriculum,” Journal of Economic Education 31(1), 95-101.
Salemi, M. K. 2003. A model teacher education program for economics. American
Economic Review 93(2), 455-459.
Salemi, M. K., Saunders, P. and Walstad, W. B. (1996). Teacher training programs in
economics: Past, present, and future. American Economic Review 86(2), 460-464.
Taylor, M., Yates, A., Meyer, L. H. and Kinsella, P. (2011). Teacher professional
leadership in support of teacher professional development,” Teaching and Teacher
Education 27(1), 85-94.
Walstad, W. B. 2001. Economic education in U.S. high schools. Journal of Economic
Perspectives 15(3), 195-210.
Walstad, W. B. and Rebeck, K. (2001). Test of Economic Literacy, 3rd
ed. National
Council on Economic Education.
Wyss, L., Tai, R. H., and Sadler, P. M. (2007) High school class-size and college
performance in science. The High School Journal 90(3), 45-53.
Table 1: Variable Specifications and Predicted Coefficient Signs
Variable Specification
Dependent Variable:
Pre-Test Score (Form A) TEL score from pre-test
Post-Test Score (Form B) TEL score from post-test
Post-Pre Test Score Form B score - Form A score
Demographic Characteristics:
GENDER [+] 1=male; 0=female
AGE [-] teacher’s age in years
RACE [-] 1 = racial affiliation is minority; 0=otherwise
1st GENERATION [-] 1=first generation college attendee
Educational Attainment:
ECON HOURS [+] number of economic college credit hours earned
MASTER [+] 1=Master degree; 0=otherwise
DEGREE MAJOR [+] 1=college degree earned in disciplinary field;
0=college degree earned in education
Human Capital Developments:
TRAINING [+] 1=has attended workshop(s) conducted by
Economics Arkansas or the Federal Reserve;
0=otherwise
CONTINUING EDUCATION [+] number of continuing education credits earned
by the teacher in a typical year
Teaching Environment:
SUBJECTS [-] Number of other courses taught during academic
year.
CLASS SIZE [-] Average number of pupils taught in each class
HIGH SCHOOL [+] 1=teaches high school; 0=teaches elementary or
middle/junior high school

Table 2: Computed Means and Standard Deviations of Variables by Teacher Cohort
Variable K-12 Teachers K-8 Teachers 9-12 Teachers
Dependent Variable
TEL (Form A) score 75.269 60.00 78.085
(15.301) (16.852) (13.251)
I: Fundamentals 76.176 59.615 79.230
(18.162) (20.597) (15.969)
II: Microeconomics 76.766 61.538 79.574
(18.474) (18.696) (17.066)
III: Macroeconomics 75.808 58.846 78.936
(18.703) (22.150) (16.243)
IV: International 69.760 60.256 71.513
(22.302) (27.112) (20.944)
TEL (Form B) score 78.802 67.50 80.887
(11.796) (11.381) (10.666)
V: Fundamentals 82.934 72.802 84.802
(12.879) (14.711) (11.639)
VI: Microeconomics 79.581 67.308 81.844
(15.614) (17.789) (14.122)
VII: Macroeconomics 74.791 60.385 77.447
(17.210) (16.366) (16.054)
VIII: International 74.551 67.308 75.887
(20.924) (19.137) (21.028)
Demographic Characteristics
Gender 0.425 0.154 0.475
(0.496) (0.368) (0.501)
Age 43.922 45.077 43.709
(11.872) (13.142) (11.661)
Race 0.048 0.038 0.057
(0.214) (0.196) (0.232)
1st Generation 0.563 0.423 0.589
(0.498) (0.504) (0.494)

Educational Attainment
Econ Hours 4.653 1.385 5.255
(4.055) (3.201) (3.914)
Master 0.467 0.308 0.496
(0.501) (0.471) (0.502)
Major 0.551 0.154 0.624
(0.499) (0.368) (0.486)
Human Capital Development
Training 0.347 0.231 0.369
(0.478) (0.430) (0.484)
CEUs 70.365 80.000 68.589
(15.117) (17.262) (14.048)
Teaching Environment
Subjects 2.503 4.231 2.184
(1.598) (2.673) (1.046)
Avg Class Size 22.341 20.538 22.674
(5.102) (5.798) (4.914)
High School 0.844 -.---- -.-----
(0.364) -.---- -.-----
Observations 167 26 141

Table 3: Assessment of Economic Literacy Among Participating K-12 Teachers (Pre-Test)
Variable K-12 Teachers K-8 Teachers 9-12 Teachers
Constant 66.280*** 81.467*** 76.112***
(8.000) (4.453) (8.635)
Demographic Characteristics:
Gender 4.472** 12.290 3.158
(2.186) (1.151) (1.555)
Age 0.090 -0.552** 0.186*
(0.997) (-2.525) (1.958)
Race -24.170*** -36.488*** -25.126***
(-5.145) (-2.982) (-5.559)
1st Generation -0.387 2.674 -1.641
(-0.186) (0.406) (-0.766)
Educational Attainment:
Econ Hours 0.789*** 0.407 0.755***
(2.978) (0.258) (2.850)
Master 3.069 6.919 1.717
(1.505) (1.075) (0.806)
Major 2.684 9.487 1.034
(1.313) (0.905) (0.495)
Human Capital Development:
Training 2.051 12.853* 0.877
(0.971) (1.785) (0.411)
CEUs -0.009 -0.134 0.047
(-0.136) (-0.858) (0.635)
Teaching Environment:
Subjects -0.651 -0.897 -0.217
(-0.949) (-0.845) (-0.205)
Avg Class Size -0.501** 0.448 -0.608***
(-2.561) (0.712) (-2.680)
High School 12.661*** -.--- -.---
(3.726) -.--- -.---
______________________________________________________________________________
F-Statistic 9.231 3.893 5.056
Adjusted R2
0.373 0.561 0.242________ Statistical significance at the 10%, 5%, and 1% critical value levels are denoted by *, **, and ***, respectively.
Table 4: Assessment of Economic Literacy Among Participating K-12 Teachers (Post-Test)
Variable K-12 Teachers K-8 Teachers 9-12 Teachers
Constant 73.056*** 67.721*** 83.102***
(10.812) (4.342) (11.256)
Demographic Characteristics:
Gender 2.772* -0.851 2.071
(1.663) (-0.093) (1.217)
Age -0.002 -0.403** 0.072
(-0.027) (-2.164) (0.902)
Race -18.111*** -13.282 -19.140***
(-4.729) (-1.273) (-5.056)
1st Generation -1.265 -1.472 -1.965
(-0.746) (-0.262) (-1.095)
Educational Attainment:
Econ Hours 0.544** 1.866 0.486**
(2.520) (1.389) (2.191)
Master 2.306 -2.424 2.212
(1.387) (-0.442) (1.240)
Major 1.415 9.507 0.246
(0.849) (1.064) (0.141)
Human Capital Development:
Training 0.491 7.351 0.260
(0.285) (1.198) (0.145)
CEUs 0.013 0.016 0.036
(0.234) (0.117) (0.593)
Teaching Environment:
Subjects -0.171 -1.281 0.226
(-0.306) (-1.416) (0.255)
Avg Class Size -0.364** 0.896 -0.485**
(-2.282) (1.670) (-2.552)
High School 11.031*** -.--- -.---
(3.983) -.--- -.---
______________________________________________________________________________
F-Statistic 6.902 1.968 3.774
Adjusted R2
0.299 0.299 0.179________ Statistical significance at the 10%, 5%, and 1% critical value levels are denoted by *, **, and ***, respectively.
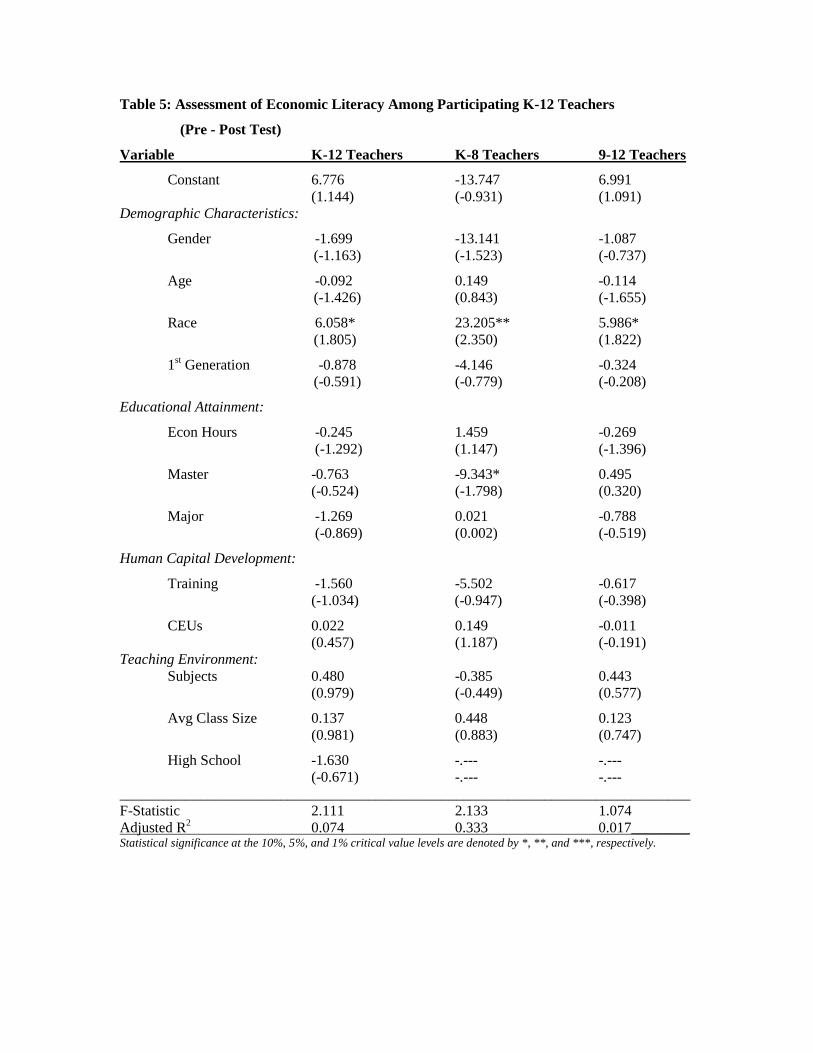
Table 5: Assessment of Economic Literacy Among Participating K-12 Teachers
(Pre - Post Test)
Variable K-12 Teachers K-8 Teachers 9-12 Teachers
Constant 6.776 -13.747 6.991
(1.144) (-0.931) (1.091)
Demographic Characteristics:
Gender -1.699 -13.141 -1.087
(-1.163) (-1.523) (-0.737)
Age -0.092 0.149 -0.114
(-1.426) (0.843) (-1.655)
Race 6.058* 23.205** 5.986*
(1.805) (2.350) (1.822)
1st Generation -0.878 -4.146 -0.324
(-0.591) (-0.779) (-0.208)
Educational Attainment:
Econ Hours -0.245 1.459 -0.269
(-1.292) (1.147) (-1.396)
Master -0.763 -9.343* 0.495
(-0.524) (-1.798) (0.320)
Major -1.269 0.021 -0.788
(-0.869) (0.002) (-0.519)
Human Capital Development:
Training -1.560 -5.502 -0.617
(-1.034) (-0.947) (-0.398)
CEUs 0.022 0.149 -0.011
(0.457) (1.187) (-0.191)
Teaching Environment:
Subjects 0.480 -0.385 0.443
(0.979) (-0.449) (0.577)
Avg Class Size 0.137 0.448 0.123
(0.981) (0.883) (0.747)
High School -1.630 -.--- -.---
(-0.671) -.--- -.---
______________________________________________________________________________
F-Statistic 2.111 2.133 1.074
Adjusted R2
0.074 0.333 0.017________ Statistical significance at the 10%, 5%, and 1% critical value levels are denoted by *, **, and ***, respectively.