Embed Size (px)
Citation preview
161
Pakistan Economic and Social Review Volume 46, No. 2 (Winter 2008), pp. 161-200
DETERMINANTS OF ENROLLMENT IN PRIMARY EDUCATION A Case Study of District Lahore
MAZHAR UL HAQ BALUCH and SAIMA SHAHID*
Abstract. This study is an attempt to analyze the primary school enrollment status in the city of Lahore; and provide estimates regarding the impact of household’s quantitative characteristics on enrollment decision. Primary data is collected from 3320 households where 2520 households belonged to the urban areas and 800 households belonged to the rural areas. Computations are carried out using both OLS and Logit models. The factors contributing positively and significantly to net enrollment of children at primary school level are found to be family size, dwelling ownership, expenses on education, literacy ratio and dependency ratio. It is also established that access to school is not a very significant factor towards inhibiting school attendance. Some of the results, with respect to the contribution of family size and dependency ratio to enrollment, are contradictory to the prior determined thoughts. Briefly, it can be concluded that despite the positive effect of some of the characteristics of individuals and households on gross as well as net enrollment, there are various more strong qualitative factors across the socio-economic spectrum that have differential impacts on school enrollment. Consequently, legislative measures need to be implemented to make primary education compulsory, in order to motivate all the children of respective age to complete primary school education.
I. INTRODUCTION The contribution of education towards economic development has been well recognized. Despite the criticism of Chicago School Approach, which said that the productivity role of education was negligible,1 a slow and steady, re-
*The authors are, respectively, Senior Research Fellow and Associate Research Follow at
Lahore School of Economics, Main Campus, Burki Road, Lahore (Pakistan). 1Arrow (1973) and Spence (1973).
162 Pakistan Economic and Social Review
emergence of faith in human capital marked the 1980s. The developing countries and international agencies started focusing on human investment. The contribution of education to economic growth has been found to be positive and significant not only in monetary terms but also in physical terms, such as farm efficiency and labor productivity. Education has also been found to be a significant factor in the reduction of poverty, improve-ment in income distribution and various dimensions of social, demographic and political development.2 Interestingly the relative significance of human capital is higher in developing countries, than in developed countries.3
Considering education to be a tool of paramount importance for mobilization of human resources for sustainable socio-economic growth, the government has been involved in formulating and implementing numerous policies to develop and improve the education system in order to make it compatible with requirements of the country.
ROLE OF GOVERNMENT OF PAKISTAN IN PROMOTING EDUCATION At the time of its inception, the literacy rate of Pakistan was about 10 percent. At that time it inherited only 10,000 primary schools, but due to the implementation of various policy measures and reforms, the number of primary schools in the country have reached 164,970 (84,179 for males and 80,791 for females) in 2003-04.4 The education system at school level in consonance with national, social, ideological and economic need of the country has been the prime assignment of every successive government. In 1992 National Education Policy was developed which recommended measures for the next 10 years. Prioritizing on the basis of significance, the education sector always got the goodwill of the policy makers and again in 2001 an Action Plan based on National Education Policy (1998-2010) was taken as an improved framework for developing specific targets and implementation strategies. The main focus of the reforms was to make primary schools more functional by providing the missing basic facilities and amenities to create an environment that was conducive to learning so that the children do not drop out on account of dysfunctional environment.
Punjab is a densely populated province with population of 73.621 million, which is 55.6 percent of the total population of the country. The
2Talik (1989) and Talik (1994). 3Psacharopoulos (1984). 4Government of Pakistan, 2005.
BALUCH and SHAHID: Determinants of Enrollment in Primary Education 163
population of the children belonging to the primary school going age group (05-09 years) is 11.226 million constituting 15.2 percent of the total population. Among these 51.8 percent are males while the remaining 48.2 percent are females.
Rural Population of Punjab accounts for 68.7 percent of the total population. The ratio of primary school going age children to total population is 15.8 percent in the rural areas. Such ratio in case of males is 16.0 percent and for females is 15.7 percent in rural areas of Punjab. In urban areas, the population of school going age children is relatively lower as compared to the rural areas. Children of the respective official age who attended school or completed primary education account for 49.9 percent overall. The proportion of such children (male & female) is higher in the urban region, which could be attributed to the school environment and other facilities available in urban localities. Consequently, children of school going age, who never attended school, account for 50.1 percent. In case of rural and urban areas the proportion of such children is 56.4 percent and 34.4 percent respectively, with a relatively higher percentage of females in both the areas.5
Recently the Government of Punjab has embarked upon an extensive reform program to enhance the quality of education in the province. In 2004 the World Bank extended US $100million, the first of a series of three IDA adjustment credits in support of the reform efforts. The effort of the reform’s program by government was classified in three major components:
Public Finance Reforms: The government has increased public expenditure on pro-poor services with a focus on education, by increasing provincial public sector expenditures with conditional grants for district government.
Devolution Reforms: In line with the devolution initiative, increased decision authority on resource allocation has been passed on to district governments. The provincial government would develop a framework to determine the role of service providers and users and institutionalize performance-based budgeting.
Education Sector Reforms: To improve education sector performance the government is taking measures to strengthen education accountability, by establishing transparent criteria for teacher recruitment and development process. These reforms support the effective use of School Councils (SCs) to
5Government of Pakistan, 2001.
164 Pakistan Economic and Social Review
strengthen parents and children’s participation in the process and to generate improvements in monitoring and evaluation of the education sector.
Certain primary school development pertaining to recent experience is briefly described below:
NGO Management of Public Schools (1998): The Charitable Trust Corporation for the Advancement, Rehabilitation and Education, adopted schools of Metropolitan Corporation, Lahore.
Early Childhood Education (1998-2010): The National Education Policy formally provided recognition to Kachi class at primary level, as a proxy for early childhood.
Universal Primary/Elementary Education: The objective of this program was Education For All (EFA). The targets determined under this development activity were to increase gross participation rate from 83 percent to 100 percent.
Universal Quality Primary Education (2004): The Project was initiated in six districts (Kasur, Shiekhupura, Sargodha, Mianwali, Rahim Yar Khan and Rajinpur) of Punjab to build the capacity of the District Government, District Education Team, Nazims, Union Councilors, NGOs; and strengthen partnership of 10700 Communities to support the process of achieving the UQPE in educationally effective, child friendly and gender sensitive schools.
A number of other development programs have been initiated with an extensively advertised mass literacy campaign carrying the slogan, “Our Dream — An Educated Punjab” to achieve the UN Millennium Development Goal (MGD) of Universal Primary Education by 2015.
EDUCATION IN THE CITY OF LAHORE Lahore is the most economically and socially developed district of the Punjab province. The population of Lahore district is 6.319 million with 17.6 percent in rural and 82.4 percent in urban area. Children belonging to the School going age group comprised 13.5 percent of the total population in 1998. Around 34.6 percent of the children remained out of school. The ratio of children who never attended school is lower in the urban region of Lahore. Hence increasing primary school enrollment has been an extremely important goal for the Government of Punjab. Various strategic measures have been formulated and implemented by the government to encourage the children belonging to the school going age group to complete at least primary education cycle.
BALUCH and SHAHID: Determinants of Enrollment in Primary Education 165
However, despite the implementation of all the policy measures and reforms for universalizing access and promoting equality and quality at primary school level, the targets of education for all could not be achieved even in the most economically and socially developed district (Lahore) of the Punjab province. There is thus a need to study the enrollment to identify the causes, and policy gap leading towards slow growth rate in enrollment in Lahore District.
II. OBJECTIVES OF THE STUDY The study has been designed to make two contributions to the literature on primary school enrollment. Firstly, an assessment of the impact of policy measures adopted at public level to increase enrollment and keep the students continue school till completion up to primary level, is carried out. This would reflect where the city stands presently in terms of gross as well as net enrollment at primary level. Secondly, the study provides estimates regarding the impact of household’s quantitative characteristics on enrollment decision. Though internal efficiency of the schools and the functioning pattern of the education system also have direct bearings on enrollment of children to primary school, this aspect could not be considered due to data constraint.
Considering the sequence of the theoretical concept of research process, the literature is reviewed in section III. A description of the sampling procedure and methodology is presented in section IV, and results of the study are elaborated in section V. To assess contribution of the various factors in enrollment up to primary education level, econometric models are applied. The results of these models have been discussed in section VI. Conclusions and proposed suggestions are given in section VII.
III. REVIEW OF LITERATURE An increase in primary enrollment has always been a priority for every successive government. It has been a debatable issue in every era and relevant measures have been proposed and implemented, during every regime. It is a major issue concerning most of the developing nations. Some of the available literature dealing with this issue has been presented here.
Handa (1999) points out that raising primary school enrollment is easier said than done. The relative importance of school supply versus households demand factors remains controversial, with serious implication for education policy. For the study he used household’s characteristics data and information on school infrastructure. The impact of school characteristics on household’s schooling decision was measured via a reduced form demand
166 Pakistan Economic and Social Review
equation for children’s schooling. The independent variables of this equation included characteristics of the individual (age), household characteristics that capture access to resources (age and sex of the head, literacy status of head etc.) and the vector of school infrastructural characteristics.
Marginal probabilities were derived by using probit estimation. The sample included children of primary school age (7 to 11years old) and the dependent variable accounted for whether the child was currently enrolled in school at the time of the survey. The results indicate that the education of adult household members seems most important in stimulating child enroll-ment. Moreover the dimensions of school quality, access or availability, and efficiency, all work to stimulate enrollment, although the effects are small and differ some what by gender.
Aakvik et al. (2005) have analyzed the effect of aspects of family background such as family income and parental education on the educational attainment of persons born from 1967 to 1972 in Norway. Standard OLS regression was applied to compute study estimates, where the dependant variable accounted for the level of education of the individual, and the independent variables included family income, family education and mother’s labor supply.
The individual and household characteristics are clearly very important determinants of school enrollment, particularly for girls. A child’s probability of enrollments is increasing in parental education, with mother’s education being relatively important in encouraging girls’ enrollment. The estimates also confirm the importance of some village contextual effects.
IV. SAMPLING PROCEDURE AND METHODOLOGY Sampling procedure entails the process involved in order to ensure effective representation of the universe concerned areas, and determination of the sample size. Considering the scope and objective of the study, mainly primary data was needed to derive the concerned conclusions. The data used in this study is primarily collected from the study titled, “District-Based Multiple Indicators Cluster Survey (2003-04)”. The study was conducted by Planning and Development department in collaboration with the Federal Bureau of Statistics and United Nation Children Funds (UNICEF). For that study the multistage cluster sample was done by the Federal Bureau of Statistics. To ensure statistical validity, a reasonably large sample size was selected for each district. Since the ensuing study was confined to the district Lahore, the sampling procedure adopted was that of MICs study. The Lahore
BALUCH and SHAHID: Determinants of Enrollment in Primary Education 167
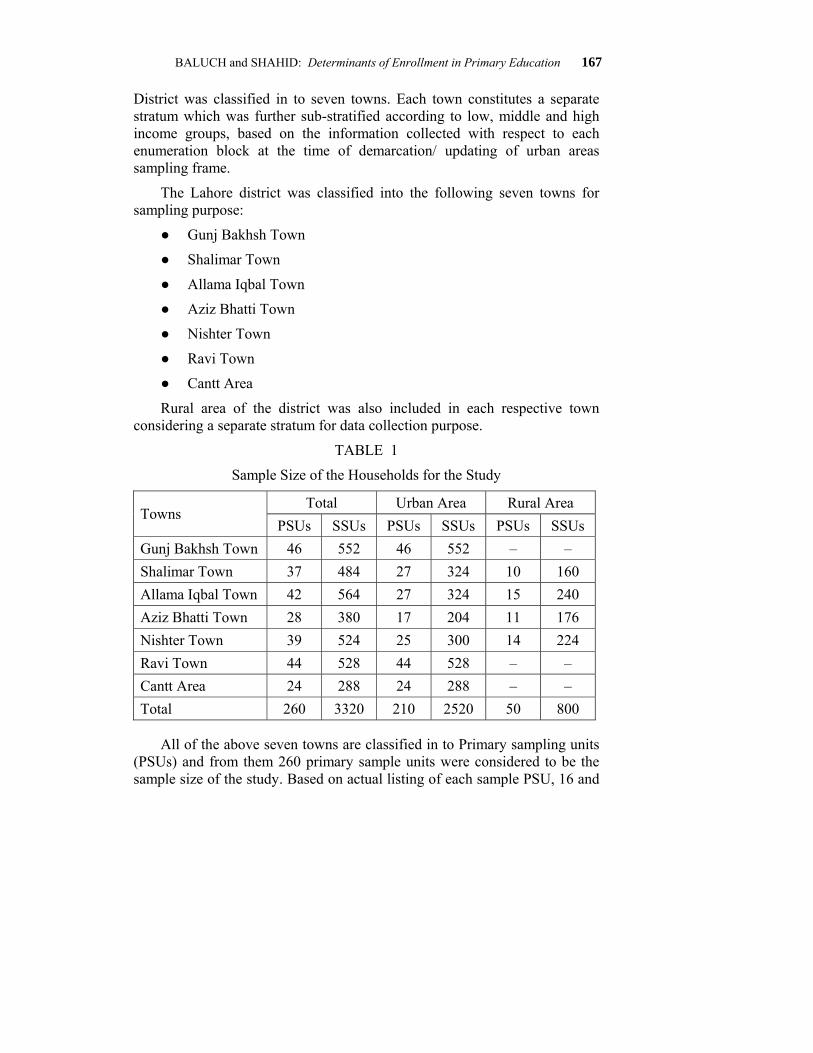
District was classified in to seven towns. Each town constitutes a separate stratum which was further sub-stratified according to low, middle and high income groups, based on the information collected with respect to each enumeration block at the time of demarcation/ updating of urban areas sampling frame.
The Lahore district was classified into the following seven towns for sampling purpose:
● Gunj Bakhsh Town
● Shalimar Town
● Allama Iqbal Town
● Aziz Bhatti Town
● Nishter Town
● Ravi Town
● Cantt Area
Rural area of the district was also included in each respective town considering a separate stratum for data collection purpose.
TABLE 1
Sample Size of the Households for the Study
Total Urban Area Rural Area Towns
PSUs SSUs PSUs SSUs PSUs SSUs Gunj Bakhsh Town 46 552 46 552 – – Shalimar Town 37 484 27 324 10 160 Allama Iqbal Town 42 564 27 324 15 240 Aziz Bhatti Town 28 380 17 204 11 176 Nishter Town 39 524 25 300 14 224 Ravi Town 44 528 44 528 – – Cantt Area 24 288 24 288 – – Total 260 3320 210 2520 50 800
All of the above seven towns are classified in to Primary sampling units (PSUs) and from them 260 primary sample units were considered to be the sample size of the study. Based on actual listing of each sample PSU, 16 and
168 Pakistan Economic and Social Review
12 households were selected from the rural and urban sample area respectively, adopting systematic sampling technique with random start. Consequently 260 PSUs (210 from Urban Area and 50 from Rural Area) were the sample size, whereas the secondary sampling units (SSUs) comprised 3,320 households among which 2,520 households were from the urban area and 800 households from rural area. The details regarding the sample size of the study are given in the Table 1.
METHODOLOGY To elaborate the answers of certain questions relating to study objectives and test certain hypotheses, estimates derived using mean and percentage are presented in a cross tabulation form. Moreover, χ2 test has been used to assess the proportionate variation’s effect on the characteristics of study interest emerged due to sample size of a specific segment separated under data processing pattern. Furthermore, in order to isolate the contribution of the factors determining the participation rate at primary level of education, econometric models have been applied.
As described in the literature review, earlier studies have mainly used the logit or probit functions in order to assess the determinants of participation rate. The probability of applying these models was optioned on the basis of participation rate for which the mean (one if child is enrolled in school) ranged from 0.49 to 0.70. This could lead towards variation in the dependent dummy. In the study the net enrollment mean was 0.677 and gross enrollment mean rate was 0.987. Since the nature of available data and the relevancy of the variables determine the econometric properties of the model, the OLS method would be a relatively better measure to assess the contribution of the determinants having bearings on school attendance at primary school level. However, an endeavor has been made to assess the contribution of the considered variables to enrollment by applying logit function as well.
The linear OLS model is applied for the study with specified regression equation as under:
Y = β1 + β2 X + β3 X1 + …. βn Xn + ξ (1)
The generalized form of the considered equation was as under:
P = β1 + β2 Fs + β3 Py + β4 He + β5 Dw + β6 Dr + β7 Sac + β8 Lit + β9 Pc + β10 Ee + ξ (2)
BALUCH and SHAHID: Determinants of Enrollment in Primary Education 169
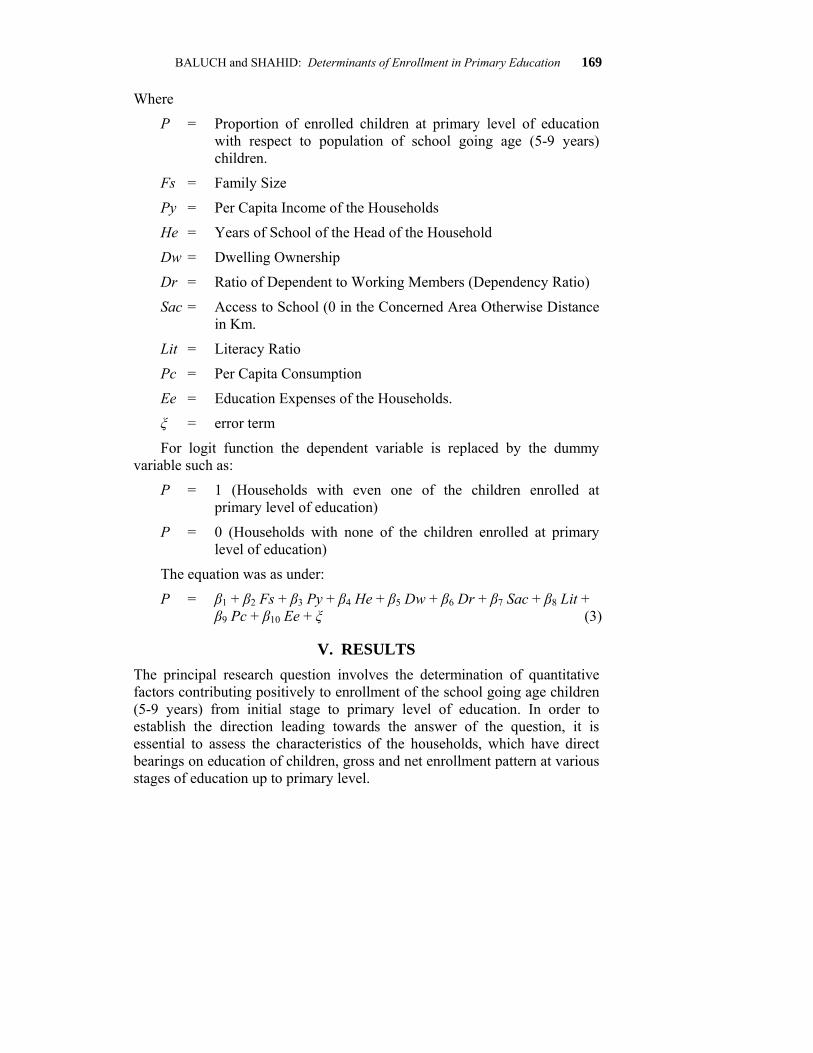
Where
P = Proportion of enrolled children at primary level of education with respect to population of school going age (5-9 years) children.
Fs = Family Size
Py = Per Capita Income of the Households
He = Years of School of the Head of the Household
Dw = Dwelling Ownership
Dr = Ratio of Dependent to Working Members (Dependency Ratio)
Sac = Access to School (0 in the Concerned Area Otherwise Distance in Km.
Lit = Literacy Ratio
Pc = Per Capita Consumption
Ee = Education Expenses of the Households.
ξ = error term
For logit function the dependent variable is replaced by the dummy variable such as:
P = 1 (Households with even one of the children enrolled at primary level of education)
P = 0 (Households with none of the children enrolled at primary level of education)
The equation was as under:
P = β1 + β2 Fs + β3 Py + β4 He + β5 Dw + β6 Dr + β7 Sac + β8 Lit + β9 Pc + β10 Ee + ξ (3)
V. RESULTS The principal research question involves the determination of quantitative factors contributing positively to enrollment of the school going age children (5-9 years) from initial stage to primary level of education. In order to establish the direction leading towards the answer of the question, it is essential to assess the characteristics of the households, which have direct bearings on education of children, gross and net enrollment pattern at various stages of education up to primary level.
170 Pakistan Economic and Social Review
CHARACTERISTICS OF THE HOUSEHOLDS The characteristics, generally accepted having direct bearings on enrollment pattern, are dwelling ownership, family size and its composition, literacy ratio, dependency ratio, and school going age children.
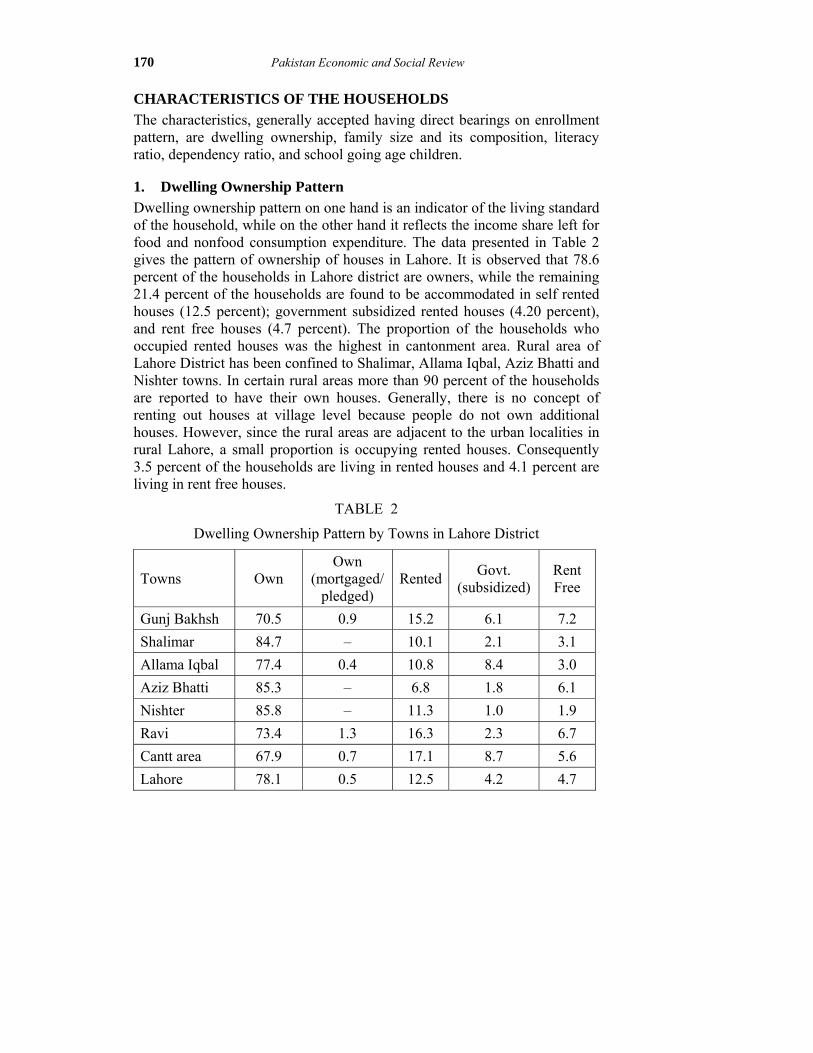
1. Dwelling Ownership Pattern Dwelling ownership pattern on one hand is an indicator of the living standard of the household, while on the other hand it reflects the income share left for food and nonfood consumption expenditure. The data presented in Table 2 gives the pattern of ownership of houses in Lahore. It is observed that 78.6 percent of the households in Lahore district are owners, while the remaining 21.4 percent of the households are found to be accommodated in self rented houses (12.5 percent); government subsidized rented houses (4.20 percent), and rent free houses (4.7 percent). The proportion of the households who occupied rented houses was the highest in cantonment area. Rural area of Lahore District has been confined to Shalimar, Allama Iqbal, Aziz Bhatti and Nishter towns. In certain rural areas more than 90 percent of the households are reported to have their own houses. Generally, there is no concept of renting out houses at village level because people do not own additional houses. However, since the rural areas are adjacent to the urban localities in rural Lahore, a small proportion is occupying rented houses. Consequently 3.5 percent of the households are living in rented houses and 4.1 percent are living in rent free houses.
TABLE 2
Dwelling Ownership Pattern by Towns in Lahore District
Towns Own Own
(mortgaged/ pledged)
Rented Govt. (subsidized)
Rent Free
Gunj Bakhsh 70.5 0.9 15.2 6.1 7.2 Shalimar 84.7 – 10.1 2.1 3.1 Allama Iqbal 77.4 0.4 10.8 8.4 3.0 Aziz Bhatti 85.3 – 6.8 1.8 6.1 Nishter 85.8 – 11.3 1.0 1.9 Ravi 73.4 1.3 16.3 2.3 6.7 Cantt area 67.9 0.7 17.1 8.7 5.6 Lahore 78.1 0.5 12.5 4.2 4.7
BALUCH and SHAHID: Determinants of Enrollment in Primary Education 171
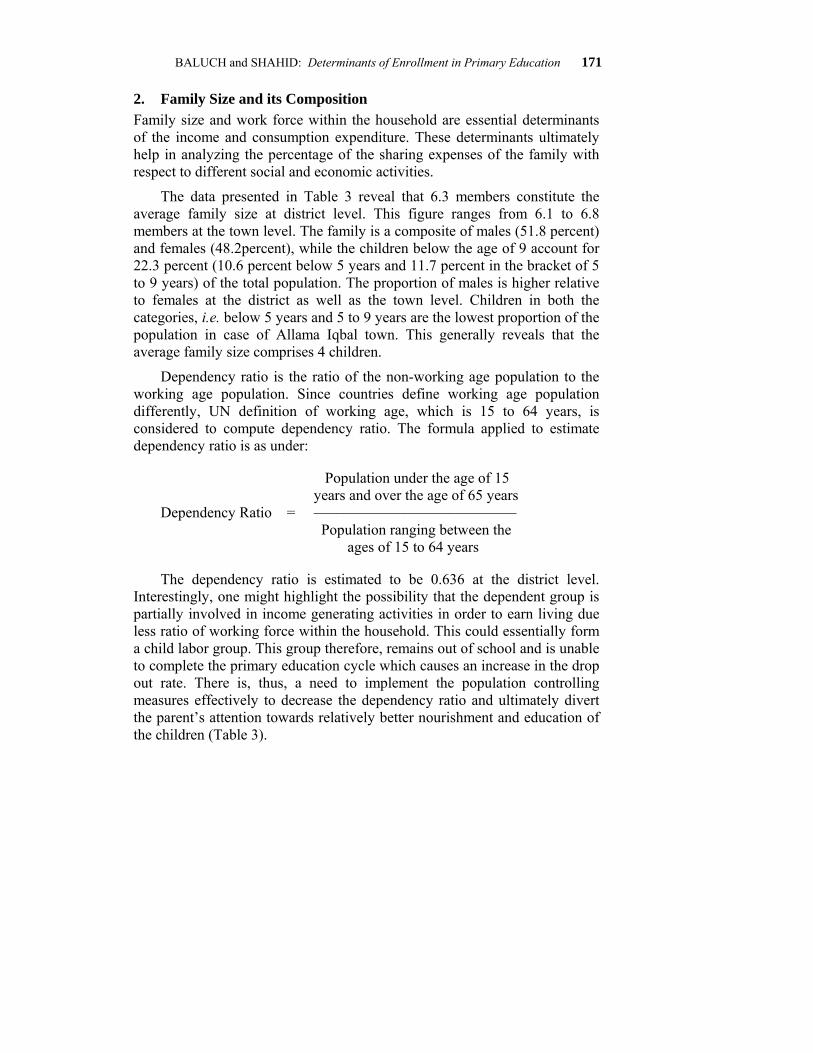
2. Family Size and its Composition Family size and work force within the household are essential determinants of the income and consumption expenditure. These determinants ultimately help in analyzing the percentage of the sharing expenses of the family with respect to different social and economic activities.
The data presented in Table 3 reveal that 6.3 members constitute the average family size at district level. This figure ranges from 6.1 to 6.8 members at the town level. The family is a composite of males (51.8 percent) and females (48.2percent), while the children below the age of 9 account for 22.3 percent (10.6 percent below 5 years and 11.7 percent in the bracket of 5 to 9 years) of the total population. The proportion of males is higher relative to females at the district as well as the town level. Children in both the categories, i.e. below 5 years and 5 to 9 years are the lowest proportion of the population in case of Allama Iqbal town. This generally reveals that the average family size comprises 4 children.
Dependency ratio is the ratio of the non-working age population to the working age population. Since countries define working age population differently, UN definition of working age, which is 15 to 64 years, is considered to compute dependency ratio. The formula applied to estimate dependency ratio is as under:
Population under the age of 15 years and over the age of 65 years Dependency Ratio = ––––––––––––––––––––––––––– Population ranging between the ages of 15 to 64 years
The dependency ratio is estimated to be 0.636 at the district level. Interestingly, one might highlight the possibility that the dependent group is partially involved in income generating activities in order to earn living due less ratio of working force within the household. This could essentially form a child labor group. This group therefore, remains out of school and is unable to complete the primary education cycle which causes an increase in the drop out rate. There is, thus, a need to implement the population controlling measures effectively to decrease the dependency ratio and ultimately divert the parent’s attention towards relatively better nourishment and education of the children (Table 3).
172 Pakistan Economic and Social Review
TABLE 3
Family Profile of the Sample Households by Towns in District Lahore
Children (< 5 Years)
Children (5-9 Years)
Towns Average Family
Size
Ratio of Males/
Females Total Male/ Female Total Male/
Female
D Ratio
%
Gunj Bakhsh 6.1 51.1 (48.9)
10.6 51.0 (49.0)
9.9 53.2 (46.2)
0.567
Shalimar 6.8 51.5 (48.5)
12.0 50.0 (50.0)
12.6 54.8 (45.2)
0.725
Allama Iqbal 6.1 52.1 (47.9)
8.8 50.3 (49.7)
10.7 50.7 (49.3)
0.593
Aziz Bhatti 6.3 51.9 (48.1)
11.1 47.6 (52.4)
13.2 46.2 (53.8)
0.688
Nishter 6.4 52.8 (47.2)
11.6 52.5 (47.5)
12.3 54.6 (45.4)
0.673
Ravi 6.3 51.7 (48.3)
10.1 47.1 (52.9)
11.6 51.4 (48.6)
0.609
Cantt area 6.3 51.0 (49.0)
10.8 51.8 (48.2)
11.7 53.5 (46.5)
0.616
Lahore 6.3 51.8 (48.2)
10.7 50.1 (49.9)
11.6 52.2 (47.8)
0.636
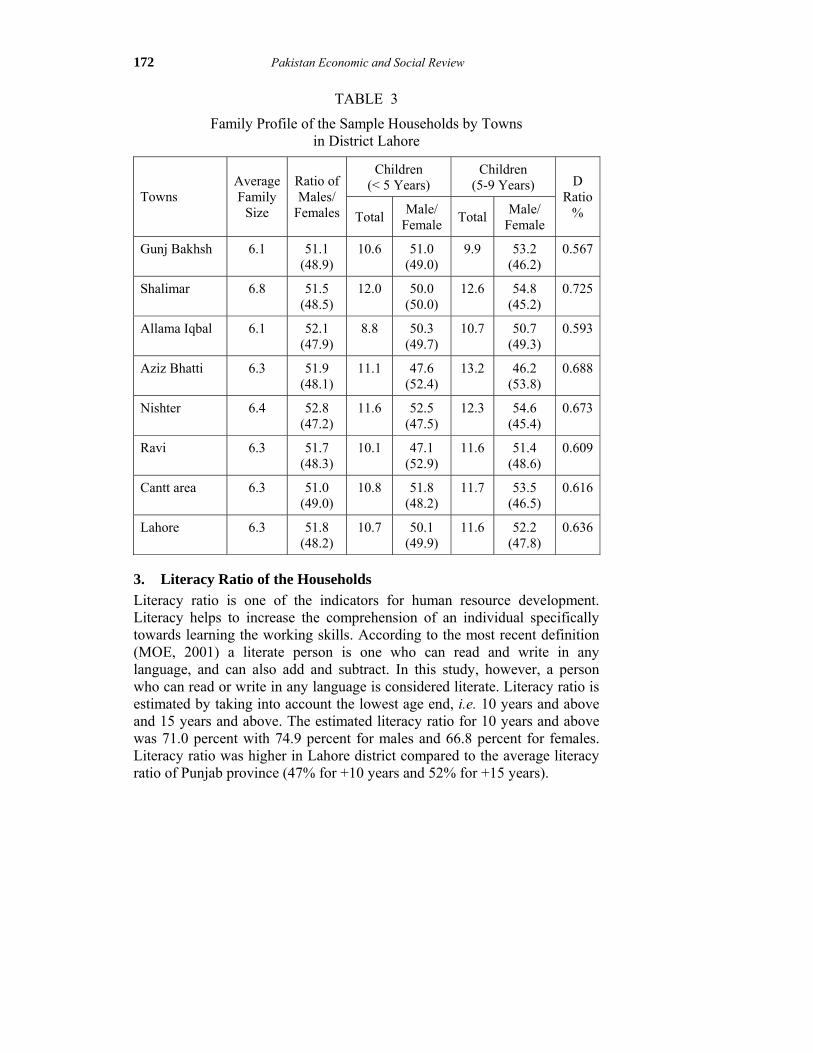
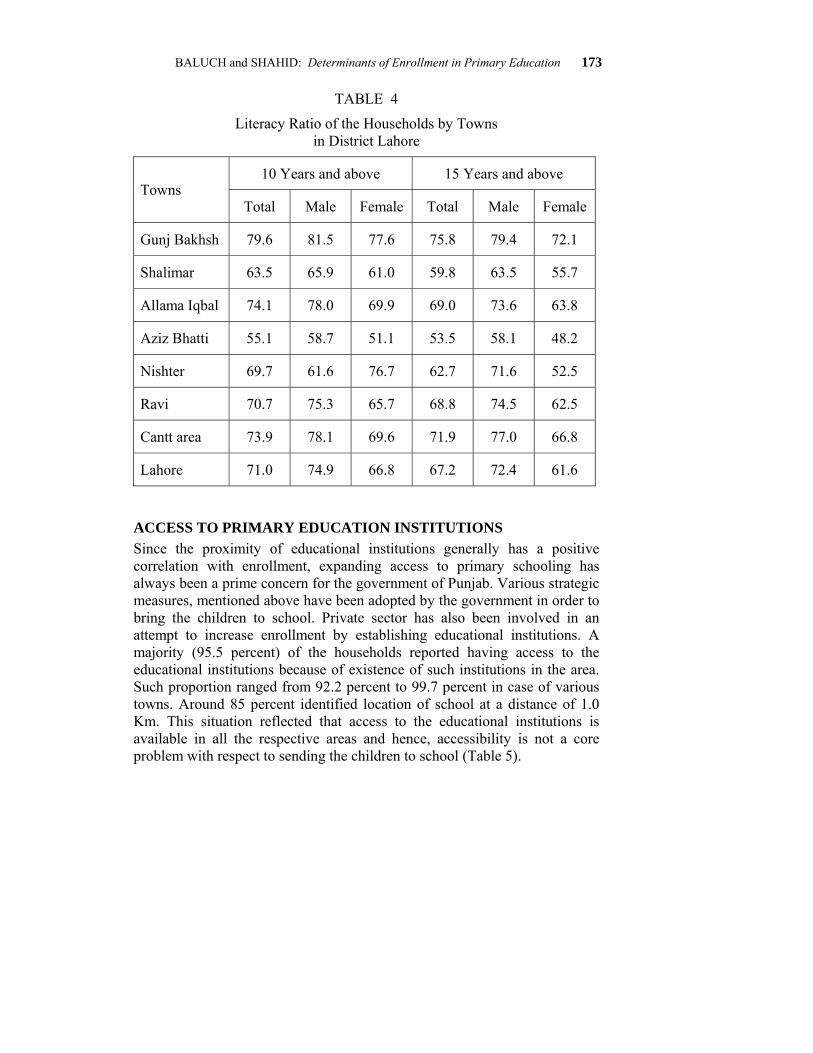
3. Literacy Ratio of the Households Literacy ratio is one of the indicators for human resource development. Literacy helps to increase the comprehension of an individual specifically towards learning the working skills. According to the most recent definition (MOE, 2001) a literate person is one who can read and write in any language, and can also add and subtract. In this study, however, a person who can read or write in any language is considered literate. Literacy ratio is estimated by taking into account the lowest age end, i.e. 10 years and above and 15 years and above. The estimated literacy ratio for 10 years and above was 71.0 percent with 74.9 percent for males and 66.8 percent for females. Literacy ratio was higher in Lahore district compared to the average literacy ratio of Punjab province (47% for +10 years and 52% for +15 years).
BALUCH and SHAHID: Determinants of Enrollment in Primary Education 173
TABLE 4
Literacy Ratio of the Households by Towns in District Lahore
10 Years and above 15 Years and above Towns
Total Male Female Total Male Female
Gunj Bakhsh 79.6 81.5 77.6 75.8 79.4 72.1
Shalimar 63.5 65.9 61.0 59.8 63.5 55.7
Allama Iqbal 74.1 78.0 69.9 69.0 73.6 63.8
Aziz Bhatti 55.1 58.7 51.1 53.5 58.1 48.2
Nishter 69.7 61.6 76.7 62.7 71.6 52.5
Ravi 70.7 75.3 65.7 68.8 74.5 62.5
Cantt area 73.9 78.1 69.6 71.9 77.0 66.8
Lahore 71.0 74.9 66.8 67.2 72.4 61.6
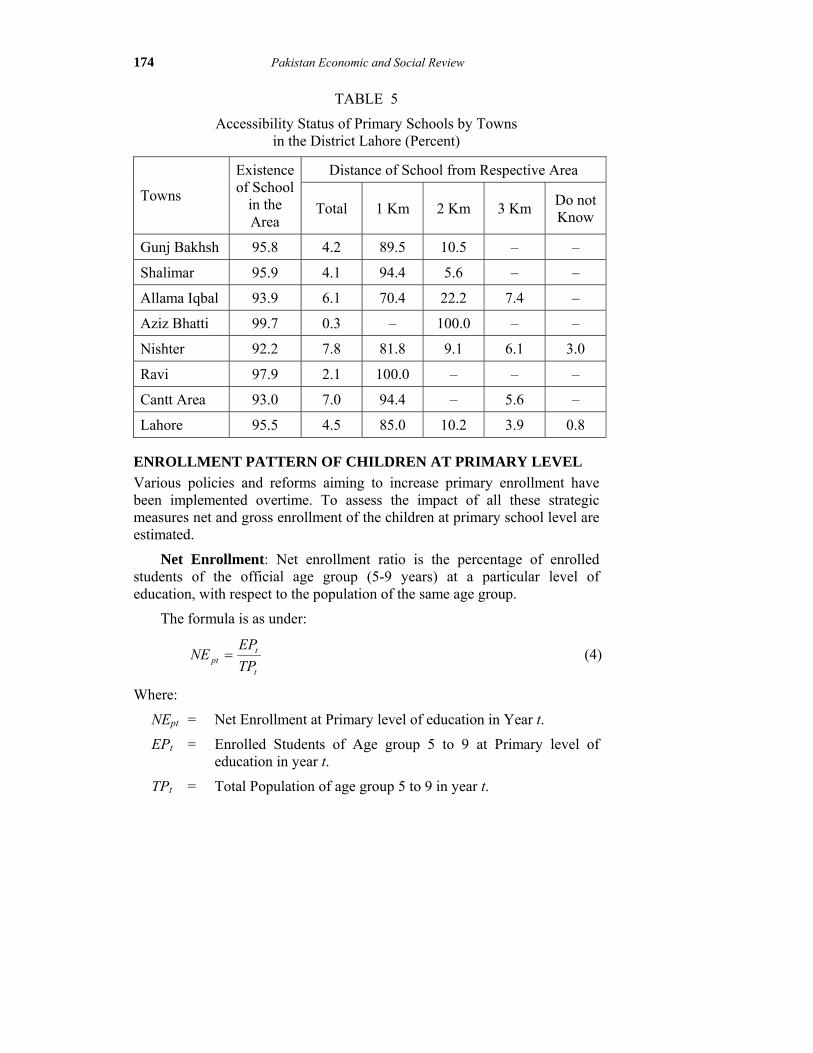
ACCESS TO PRIMARY EDUCATION INSTITUTIONS Since the proximity of educational institutions generally has a positive correlation with enrollment, expanding access to primary schooling has always been a prime concern for the government of Punjab. Various strategic measures, mentioned above have been adopted by the government in order to bring the children to school. Private sector has also been involved in an attempt to increase enrollment by establishing educational institutions. A majority (95.5 percent) of the households reported having access to the educational institutions because of existence of such institutions in the area. Such proportion ranged from 92.2 percent to 99.7 percent in case of various towns. Around 85 percent identified location of school at a distance of 1.0 Km. This situation reflected that access to the educational institutions is available in all the respective areas and hence, accessibility is not a core problem with respect to sending the children to school (Table 5).
174 Pakistan Economic and Social Review
TABLE 5
Accessibility Status of Primary Schools by Towns in the District Lahore (Percent)
Distance of School from Respective Area
Towns
Existence of School
in the Area
Total 1 Km 2 Km 3 Km Do not Know
Gunj Bakhsh 95.8 4.2 89.5 10.5 – –
Shalimar 95.9 4.1 94.4 5.6 – –
Allama Iqbal 93.9 6.1 70.4 22.2 7.4 –
Aziz Bhatti 99.7 0.3 – 100.0 – –
Nishter 92.2 7.8 81.8 9.1 6.1 3.0
Ravi 97.9 2.1 100.0 – – –
Cantt Area 93.0 7.0 94.4 – 5.6 –
Lahore 95.5 4.5 85.0 10.2 3.9 0.8
ENROLLMENT PATTERN OF CHILDREN AT PRIMARY LEVEL Various policies and reforms aiming to increase primary enrollment have been implemented overtime. To assess the impact of all these strategic measures net and gross enrollment of the children at primary school level are estimated.
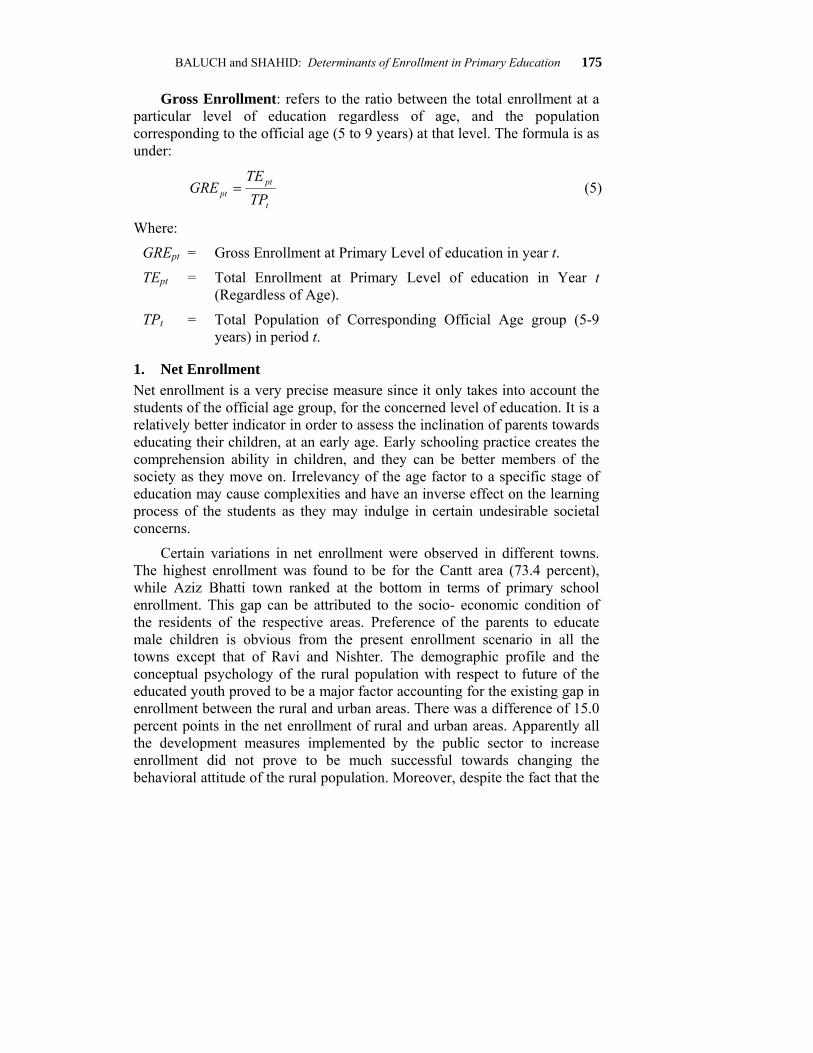
Net Enrollment: Net enrollment ratio is the percentage of enrolled students of the official age group (5-9 years) at a particular level of education, with respect to the population of the same age group.
The formula is as under:
t
tpt TP
EPNE = (4)
Where:
NEpt = Net Enrollment at Primary level of education in Year t.
EPt = Enrolled Students of Age group 5 to 9 at Primary level of education in year t.
TPt = Total Population of age group 5 to 9 in year t.
BALUCH and SHAHID: Determinants of Enrollment in Primary Education 175
Gross Enrollment: refers to the ratio between the total enrollment at a particular level of education regardless of age, and the population corresponding to the official age (5 to 9 years) at that level. The formula is as under:
t
ptpt TP
TEGRE = (5)
Where:
GREpt = Gross Enrollment at Primary Level of education in year t.
TEpt = Total Enrollment at Primary Level of education in Year t (Regardless of Age).
TPt = Total Population of Corresponding Official Age group (5-9 years) in period t.
1. Net Enrollment Net enrollment is a very precise measure since it only takes into account the students of the official age group, for the concerned level of education. It is a relatively better indicator in order to assess the inclination of parents towards educating their children, at an early age. Early schooling practice creates the comprehension ability in children, and they can be better members of the society as they move on. Irrelevancy of the age factor to a specific stage of education may cause complexities and have an inverse effect on the learning process of the students as they may indulge in certain undesirable societal concerns.
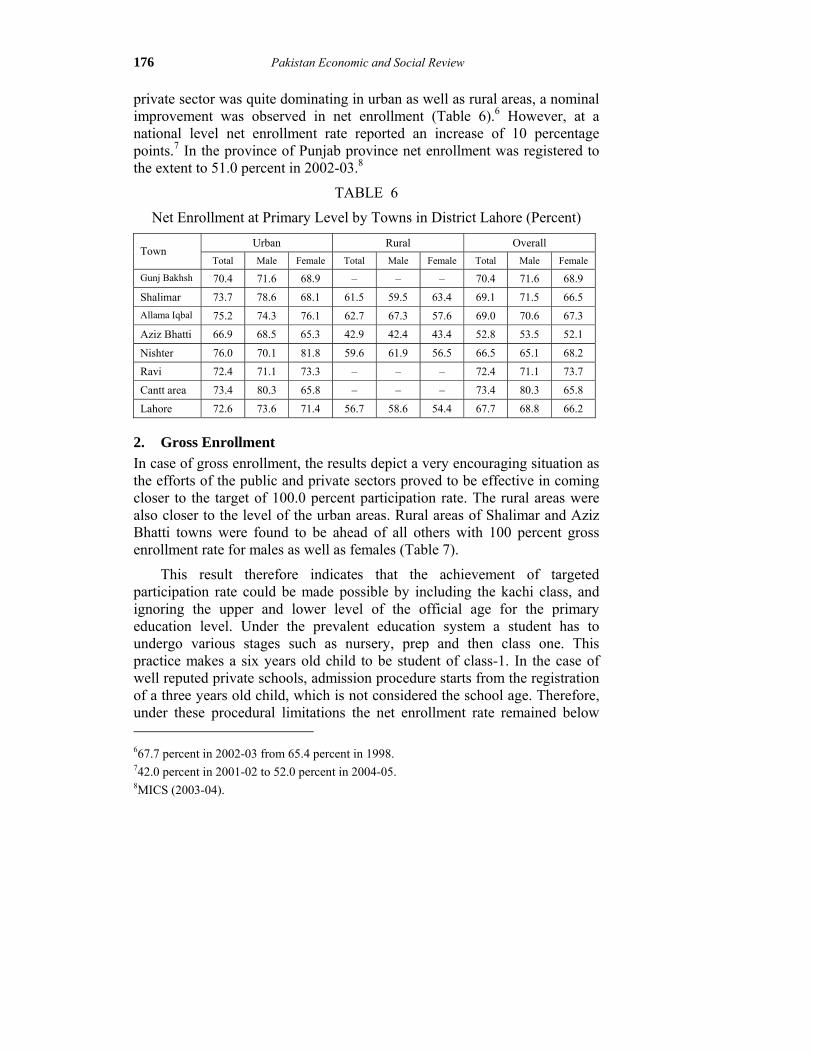
Certain variations in net enrollment were observed in different towns. The highest enrollment was found to be for the Cantt area (73.4 percent), while Aziz Bhatti town ranked at the bottom in terms of primary school enrollment. This gap can be attributed to the socio- economic condition of the residents of the respective areas. Preference of the parents to educate male children is obvious from the present enrollment scenario in all the towns except that of Ravi and Nishter. The demographic profile and the conceptual psychology of the rural population with respect to future of the educated youth proved to be a major factor accounting for the existing gap in enrollment between the rural and urban areas. There was a difference of 15.0 percent points in the net enrollment of rural and urban areas. Apparently all the development measures implemented by the public sector to increase enrollment did not prove to be much successful towards changing the behavioral attitude of the rural population. Moreover, despite the fact that the
176 Pakistan Economic and Social Review
private sector was quite dominating in urban as well as rural areas, a nominal improvement was observed in net enrollment (Table 6).6 However, at a national level net enrollment rate reported an increase of 10 percentage points.7 In the province of Punjab province net enrollment was registered to the extent to 51.0 percent in 2002-03.8
TABLE 6
Net Enrollment at Primary Level by Towns in District Lahore (Percent) Urban Rural Overall
Town Total Male Female Total Male Female Total Male Female
Gunj Bakhsh 70.4 71.6 68.9 – – – 70.4 71.6 68.9
Shalimar 73.7 78.6 68.1 61.5 59.5 63.4 69.1 71.5 66.5 Allama Iqbal 75.2 74.3 76.1 62.7 67.3 57.6 69.0 70.6 67.3
Aziz Bhatti 66.9 68.5 65.3 42.9 42.4 43.4 52.8 53.5 52.1
Nishter 76.0 70.1 81.8 59.6 61.9 56.5 66.5 65.1 68.2
Ravi 72.4 71.1 73.3 – – – 72.4 71.1 73.7
Cantt area 73.4 80.3 65.8 – – – 73.4 80.3 65.8
Lahore 72.6 73.6 71.4 56.7 58.6 54.4 67.7 68.8 66.2
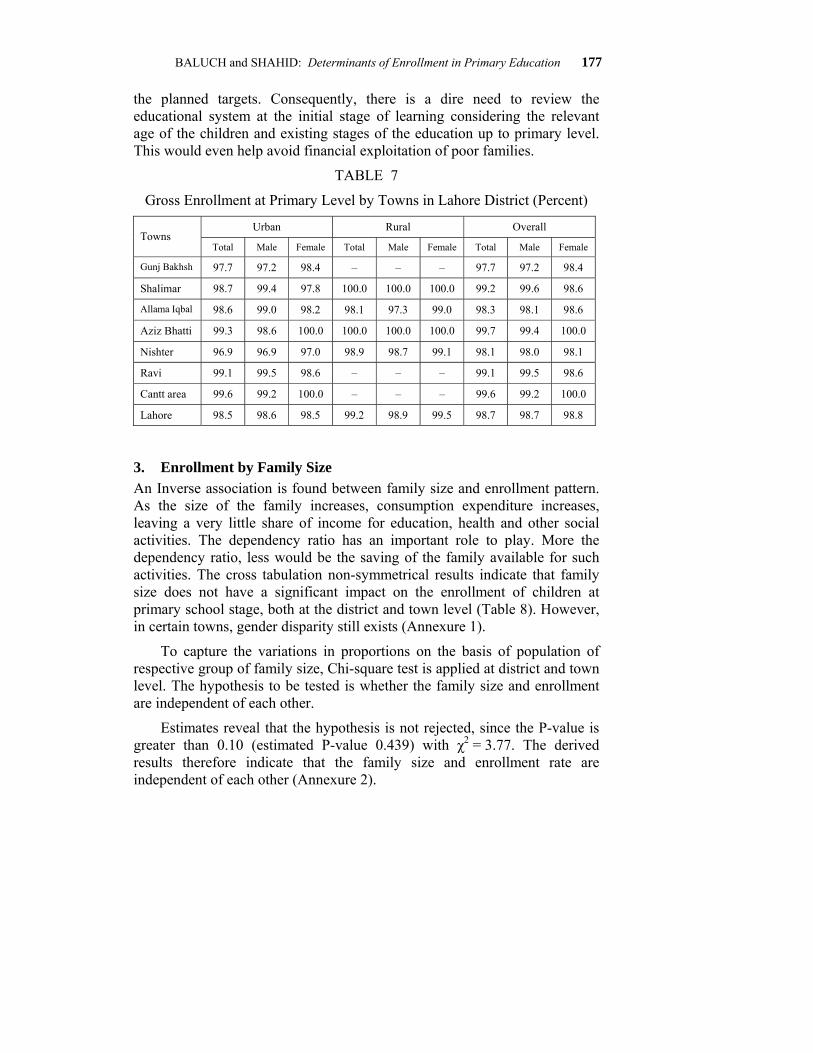
2. Gross Enrollment In case of gross enrollment, the results depict a very encouraging situation as the efforts of the public and private sectors proved to be effective in coming closer to the target of 100.0 percent participation rate. The rural areas were also closer to the level of the urban areas. Rural areas of Shalimar and Aziz Bhatti towns were found to be ahead of all others with 100 percent gross enrollment rate for males as well as females (Table 7).
This result therefore indicates that the achievement of targeted participation rate could be made possible by including the kachi class, and ignoring the upper and lower level of the official age for the primary education level. Under the prevalent education system a student has to undergo various stages such as nursery, prep and then class one. This practice makes a six years old child to be student of class-1. In the case of well reputed private schools, admission procedure starts from the registration of a three years old child, which is not considered the school age. Therefore, under these procedural limitations the net enrollment rate remained below 667.7 percent in 2002-03 from 65.4 percent in 1998. 742.0 percent in 2001-02 to 52.0 percent in 2004-05. 8MICS (2003-04).
BALUCH and SHAHID: Determinants of Enrollment in Primary Education 177
the planned targets. Consequently, there is a dire need to review the educational system at the initial stage of learning considering the relevant age of the children and existing stages of the education up to primary level. This would even help avoid financial exploitation of poor families.
TABLE 7
Gross Enrollment at Primary Level by Towns in Lahore District (Percent)
Urban Rural Overall Towns
Total Male Female Total Male Female Total Male Female
Gunj Bakhsh 97.7 97.2 98.4 – – – 97.7 97.2 98.4
Shalimar 98.7 99.4 97.8 100.0 100.0 100.0 99.2 99.6 98.6
Allama Iqbal 98.6 99.0 98.2 98.1 97.3 99.0 98.3 98.1 98.6
Aziz Bhatti 99.3 98.6 100.0 100.0 100.0 100.0 99.7 99.4 100.0
Nishter 96.9 96.9 97.0 98.9 98.7 99.1 98.1 98.0 98.1
Ravi 99.1 99.5 98.6 – – – 99.1 99.5 98.6
Cantt area 99.6 99.2 100.0 – – – 99.6 99.2 100.0
Lahore 98.5 98.6 98.5 99.2 98.9 99.5 98.7 98.7 98.8
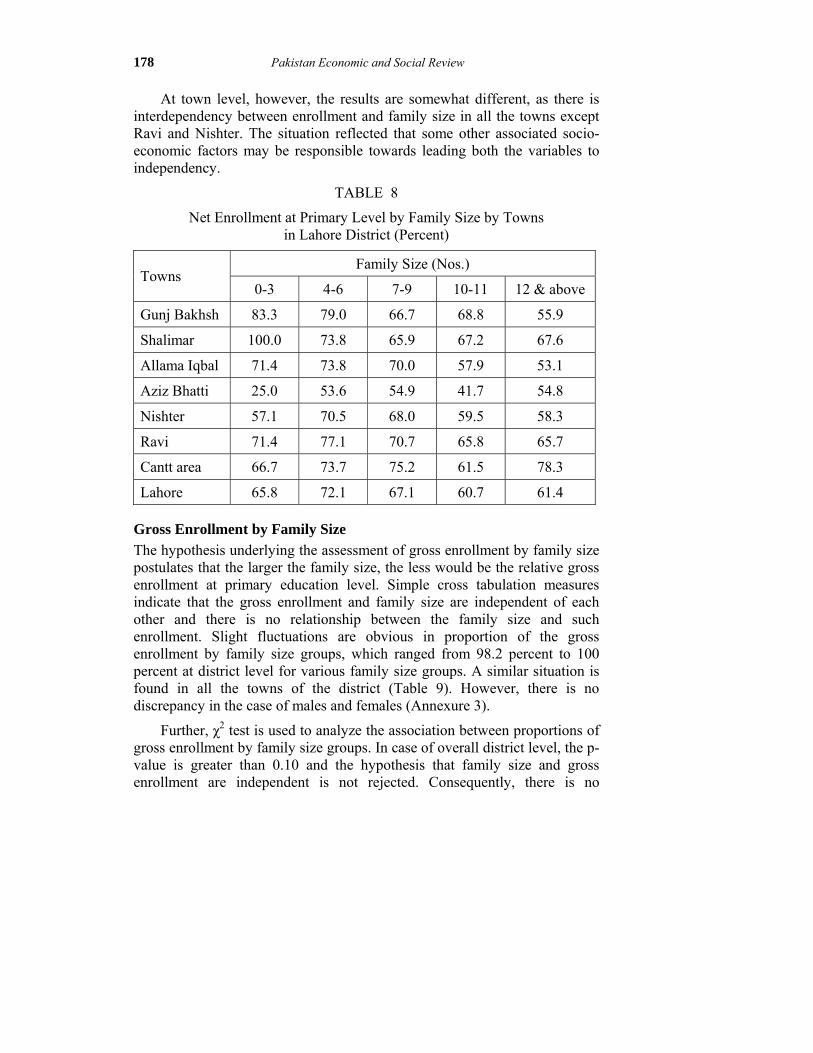
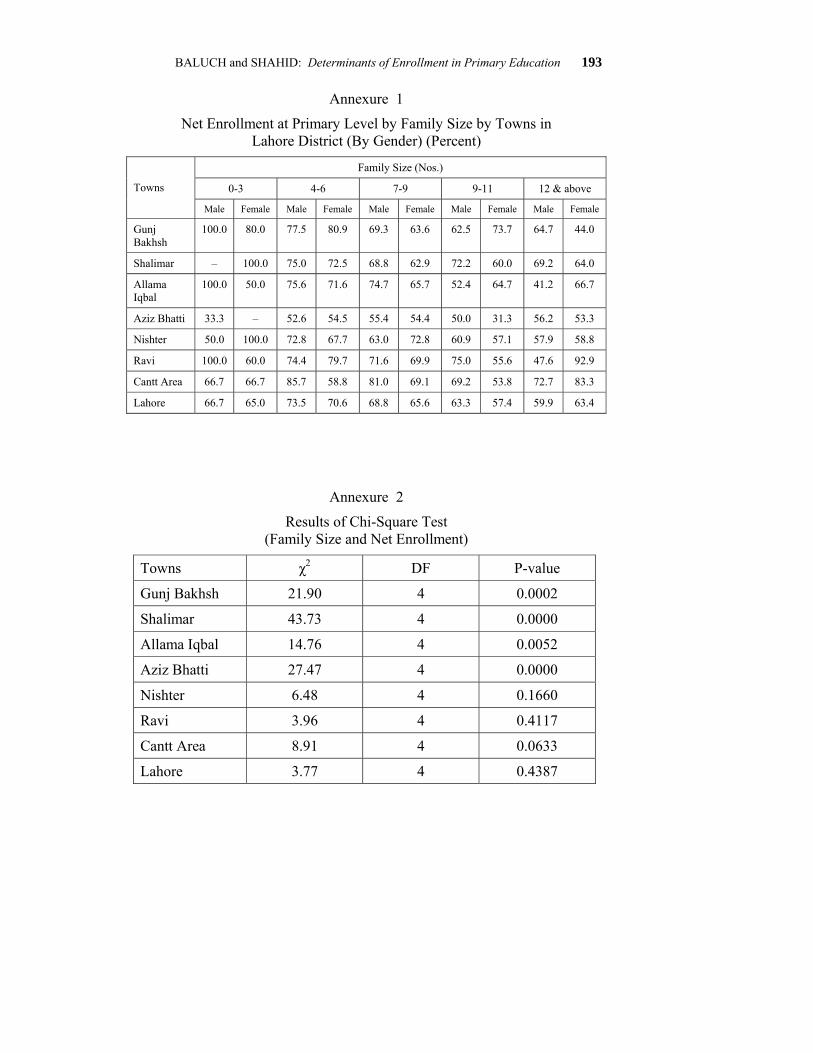
3. Enrollment by Family Size An Inverse association is found between family size and enrollment pattern. As the size of the family increases, consumption expenditure increases, leaving a very little share of income for education, health and other social activities. The dependency ratio has an important role to play. More the dependency ratio, less would be the saving of the family available for such activities. The cross tabulation non-symmetrical results indicate that family size does not have a significant impact on the enrollment of children at primary school stage, both at the district and town level (Table 8). However, in certain towns, gender disparity still exists (Annexure 1).
To capture the variations in proportions on the basis of population of respective group of family size, Chi-square test is applied at district and town level. The hypothesis to be tested is whether the family size and enrollment are independent of each other.
Estimates reveal that the hypothesis is not rejected, since the P-value is greater than 0.10 (estimated P-value 0.439) with χ2 = 3.77. The derived results therefore indicate that the family size and enrollment rate are independent of each other (Annexure 2).
178 Pakistan Economic and Social Review
At town level, however, the results are somewhat different, as there is interdependency between enrollment and family size in all the towns except Ravi and Nishter. The situation reflected that some other associated socio-economic factors may be responsible towards leading both the variables to independency.
TABLE 8
Net Enrollment at Primary Level by Family Size by Towns in Lahore District (Percent)
Family Size (Nos.) Towns
0-3 4-6 7-9 10-11 12 & above
Gunj Bakhsh 83.3 79.0 66.7 68.8 55.9
Shalimar 100.0 73.8 65.9 67.2 67.6
Allama Iqbal 71.4 73.8 70.0 57.9 53.1
Aziz Bhatti 25.0 53.6 54.9 41.7 54.8
Nishter 57.1 70.5 68.0 59.5 58.3
Ravi 71.4 77.1 70.7 65.8 65.7
Cantt area 66.7 73.7 75.2 61.5 78.3
Lahore 65.8 72.1 67.1 60.7 61.4
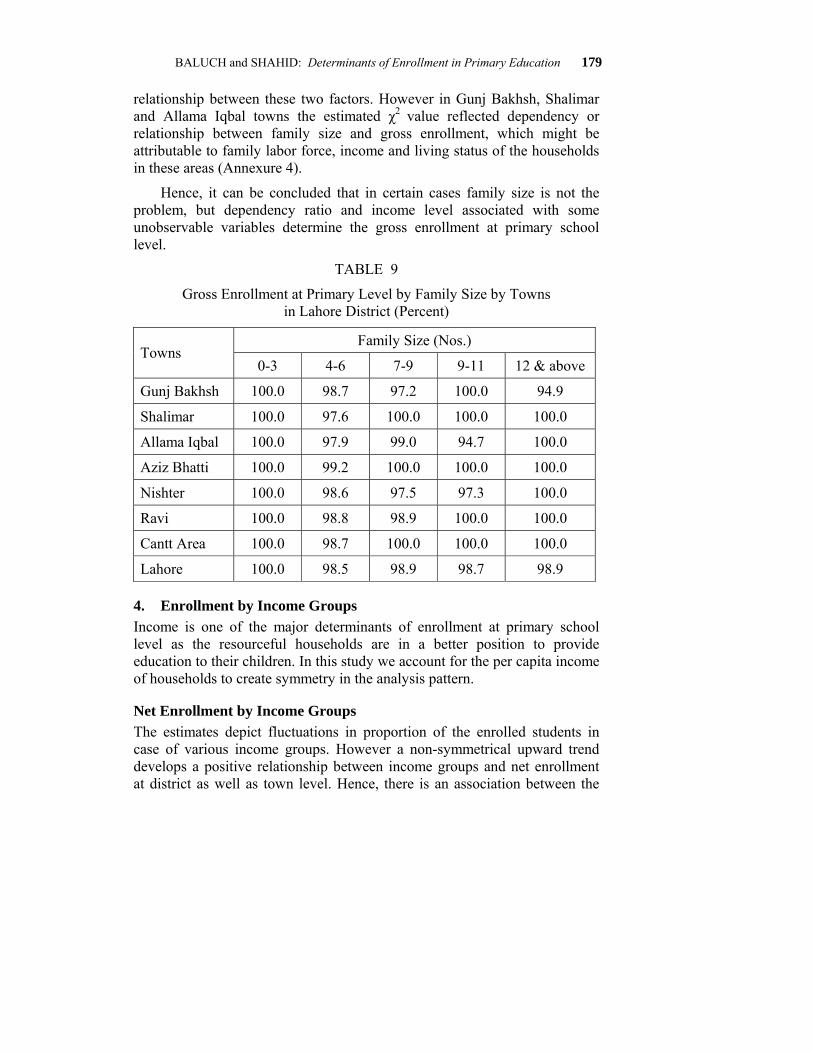
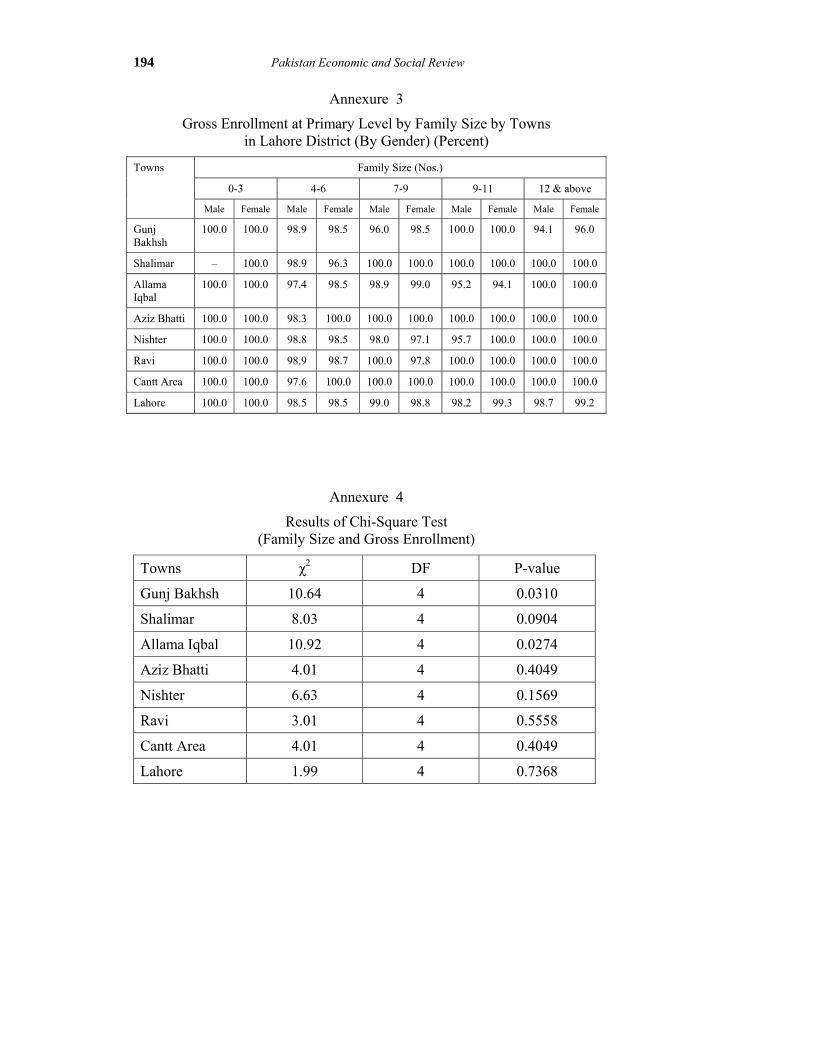
Gross Enrollment by Family Size The hypothesis underlying the assessment of gross enrollment by family size postulates that the larger the family size, the less would be the relative gross enrollment at primary education level. Simple cross tabulation measures indicate that the gross enrollment and family size are independent of each other and there is no relationship between the family size and such enrollment. Slight fluctuations are obvious in proportion of the gross enrollment by family size groups, which ranged from 98.2 percent to 100 percent at district level for various family size groups. A similar situation is found in all the towns of the district (Table 9). However, there is no discrepancy in the case of males and females (Annexure 3).
Further, χ2 test is used to analyze the association between proportions of gross enrollment by family size groups. In case of overall district level, the p-value is greater than 0.10 and the hypothesis that family size and gross enrollment are independent is not rejected. Consequently, there is no
BALUCH and SHAHID: Determinants of Enrollment in Primary Education 179
relationship between these two factors. However in Gunj Bakhsh, Shalimar and Allama Iqbal towns the estimated χ2 value reflected dependency or relationship between family size and gross enrollment, which might be attributable to family labor force, income and living status of the households in these areas (Annexure 4).
Hence, it can be concluded that in certain cases family size is not the problem, but dependency ratio and income level associated with some unobservable variables determine the gross enrollment at primary school level.
TABLE 9
Gross Enrollment at Primary Level by Family Size by Towns in Lahore District (Percent)
Family Size (Nos.) Towns
0-3 4-6 7-9 9-11 12 & above
Gunj Bakhsh 100.0 98.7 97.2 100.0 94.9
Shalimar 100.0 97.6 100.0 100.0 100.0
Allama Iqbal 100.0 97.9 99.0 94.7 100.0
Aziz Bhatti 100.0 99.2 100.0 100.0 100.0
Nishter 100.0 98.6 97.5 97.3 100.0
Ravi 100.0 98.8 98.9 100.0 100.0
Cantt Area 100.0 98.7 100.0 100.0 100.0
Lahore 100.0 98.5 98.9 98.7 98.9
4. Enrollment by Income Groups Income is one of the major determinants of enrollment at primary school level as the resourceful households are in a better position to provide education to their children. In this study we account for the per capita income of households to create symmetry in the analysis pattern.
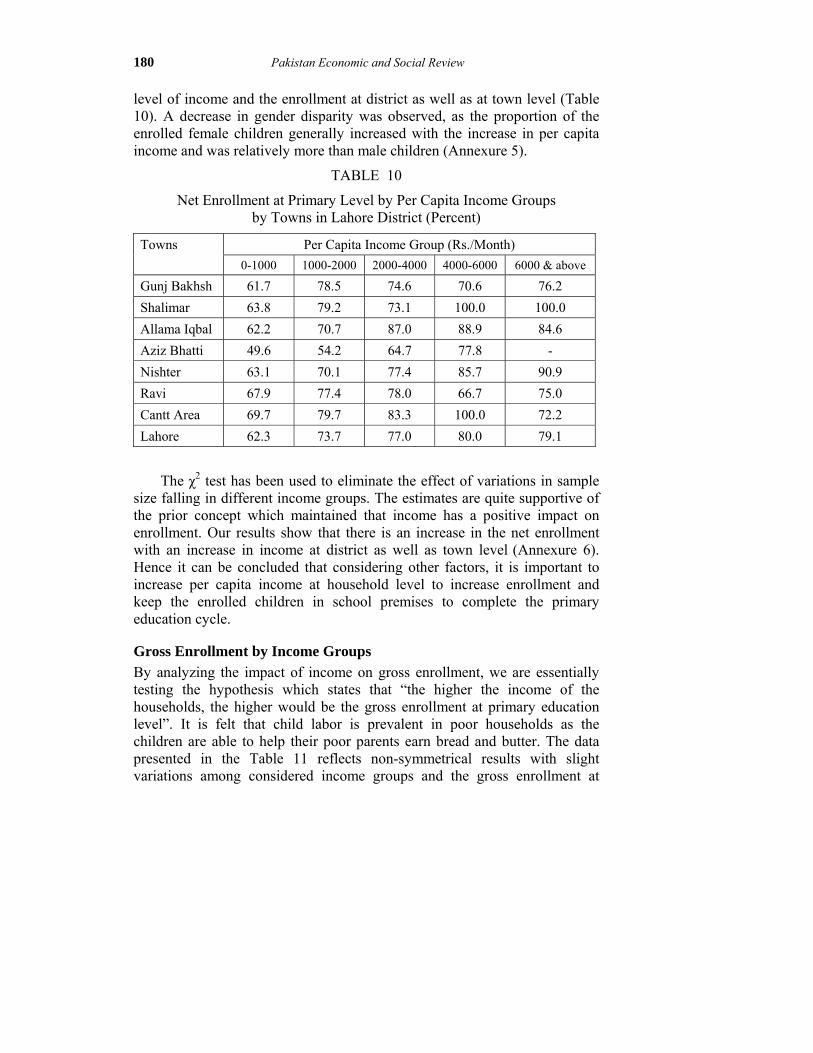
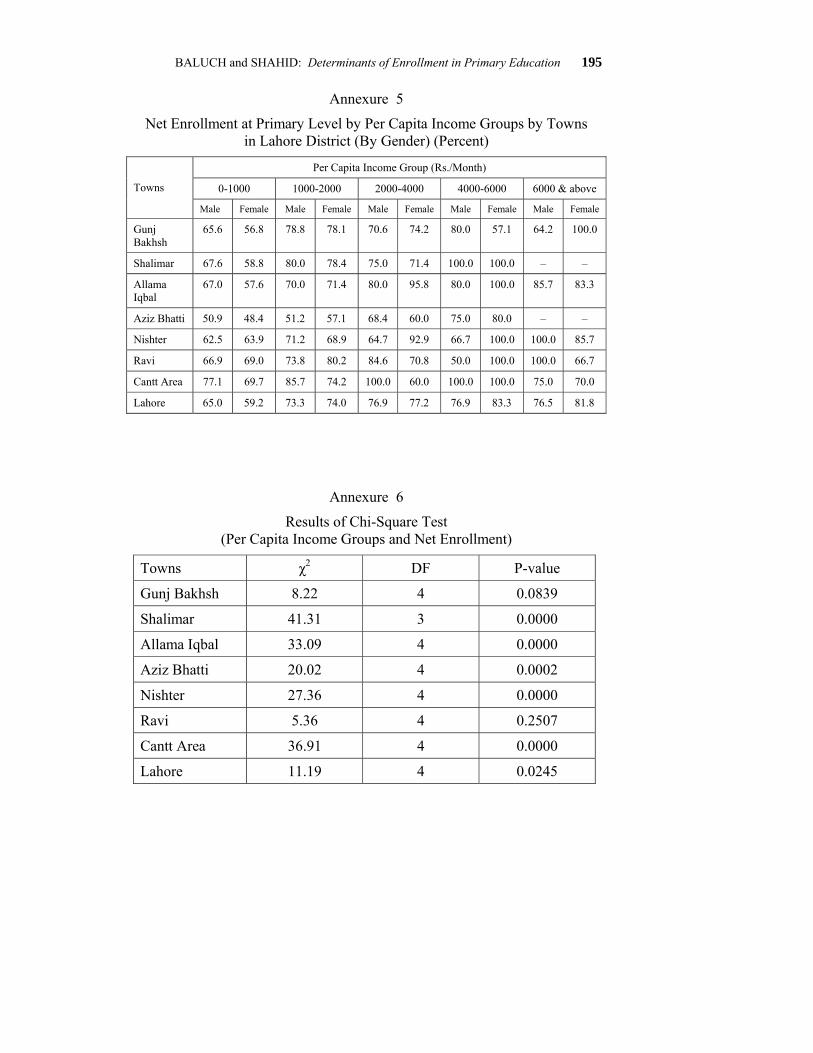
Net Enrollment by Income Groups The estimates depict fluctuations in proportion of the enrolled students in case of various income groups. However a non-symmetrical upward trend develops a positive relationship between income groups and net enrollment at district as well as town level. Hence, there is an association between the
180 Pakistan Economic and Social Review
level of income and the enrollment at district as well as at town level (Table 10). A decrease in gender disparity was observed, as the proportion of the enrolled female children generally increased with the increase in per capita income and was relatively more than male children (Annexure 5).
TABLE 10
Net Enrollment at Primary Level by Per Capita Income Groups by Towns in Lahore District (Percent)
Per Capita Income Group (Rs./Month) Towns 0-1000 1000-2000 2000-4000 4000-6000 6000 & above
Gunj Bakhsh 61.7 78.5 74.6 70.6 76.2 Shalimar 63.8 79.2 73.1 100.0 100.0 Allama Iqbal 62.2 70.7 87.0 88.9 84.6 Aziz Bhatti 49.6 54.2 64.7 77.8 - Nishter 63.1 70.1 77.4 85.7 90.9 Ravi 67.9 77.4 78.0 66.7 75.0 Cantt Area 69.7 79.7 83.3 100.0 72.2 Lahore 62.3 73.7 77.0 80.0 79.1
The χ2 test has been used to eliminate the effect of variations in sample size falling in different income groups. The estimates are quite supportive of the prior concept which maintained that income has a positive impact on enrollment. Our results show that there is an increase in the net enrollment with an increase in income at district as well as town level (Annexure 6). Hence it can be concluded that considering other factors, it is important to increase per capita income at household level to increase enrollment and keep the enrolled children in school premises to complete the primary education cycle.
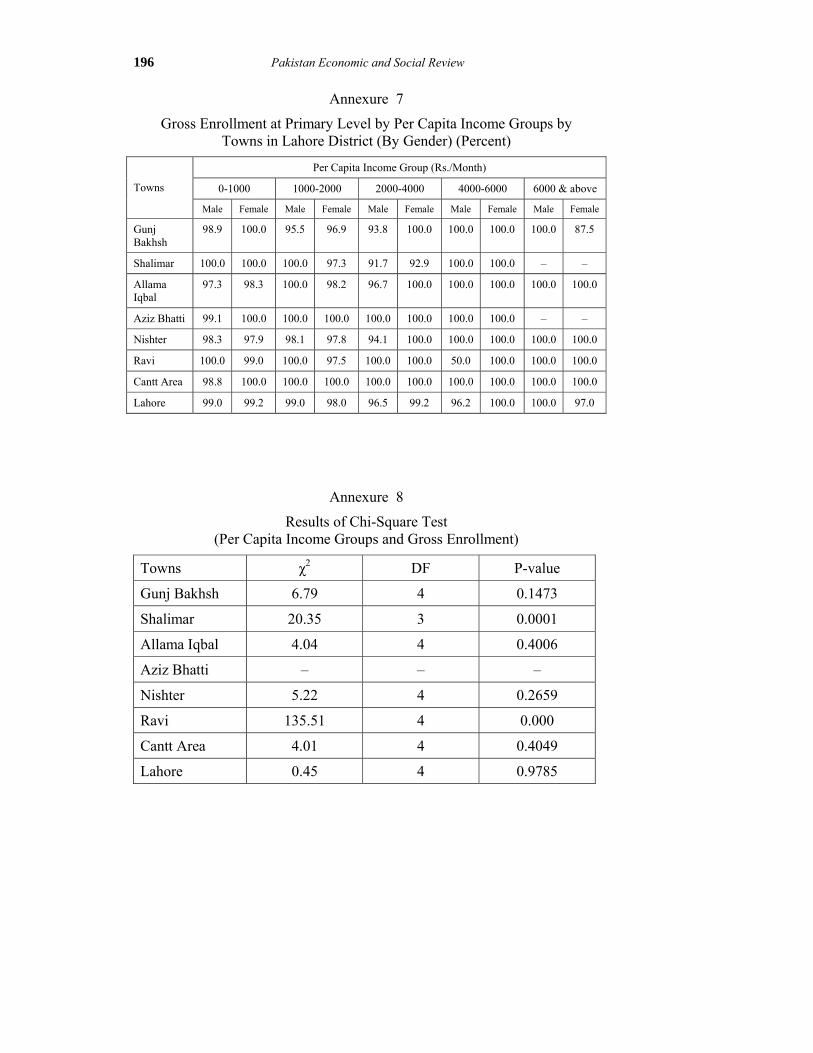
Gross Enrollment by Income Groups By analyzing the impact of income on gross enrollment, we are essentially testing the hypothesis which states that “the higher the income of the households, the higher would be the gross enrollment at primary education level”. It is felt that child labor is prevalent in poor households as the children are able to help their poor parents earn bread and butter. The data presented in the Table 11 reflects non-symmetrical results with slight variations among considered income groups and the gross enrollment at
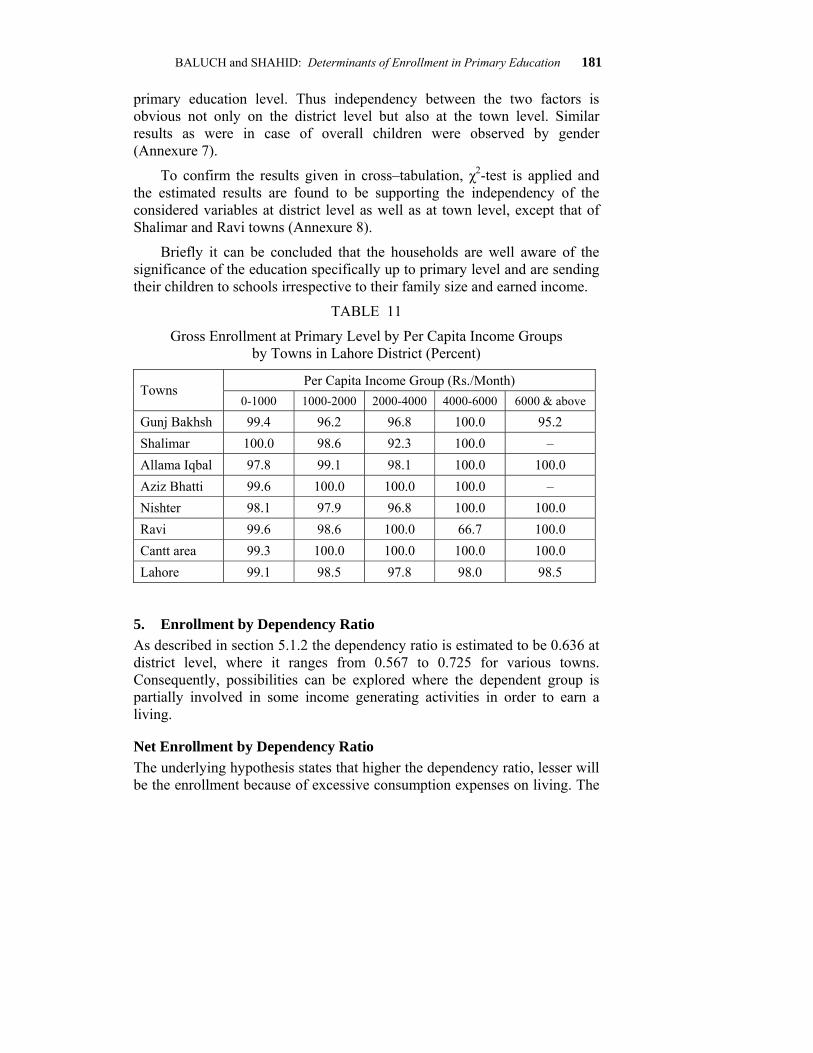
BALUCH and SHAHID: Determinants of Enrollment in Primary Education 181
primary education level. Thus independency between the two factors is obvious not only on the district level but also at the town level. Similar results as were in case of overall children were observed by gender (Annexure 7).
To confirm the results given in cross–tabulation, χ2-test is applied and the estimated results are found to be supporting the independency of the considered variables at district level as well as at town level, except that of Shalimar and Ravi towns (Annexure 8).
Briefly it can be concluded that the households are well aware of the significance of the education specifically up to primary level and are sending their children to schools irrespective to their family size and earned income.
TABLE 11
Gross Enrollment at Primary Level by Per Capita Income Groups by Towns in Lahore District (Percent)
Per Capita Income Group (Rs./Month) Towns
0-1000 1000-2000 2000-4000 4000-6000 6000 & above
Gunj Bakhsh 99.4 96.2 96.8 100.0 95.2 Shalimar 100.0 98.6 92.3 100.0 – Allama Iqbal 97.8 99.1 98.1 100.0 100.0 Aziz Bhatti 99.6 100.0 100.0 100.0 – Nishter 98.1 97.9 96.8 100.0 100.0 Ravi 99.6 98.6 100.0 66.7 100.0 Cantt area 99.3 100.0 100.0 100.0 100.0 Lahore 99.1 98.5 97.8 98.0 98.5
5. Enrollment by Dependency Ratio As described in section 5.1.2 the dependency ratio is estimated to be 0.636 at district level, where it ranges from 0.567 to 0.725 for various towns. Consequently, possibilities can be explored where the dependent group is partially involved in some income generating activities in order to earn a living.
Net Enrollment by Dependency Ratio The underlying hypothesis states that higher the dependency ratio, lesser will be the enrollment because of excessive consumption expenses on living. The
182 Pakistan Economic and Social Review
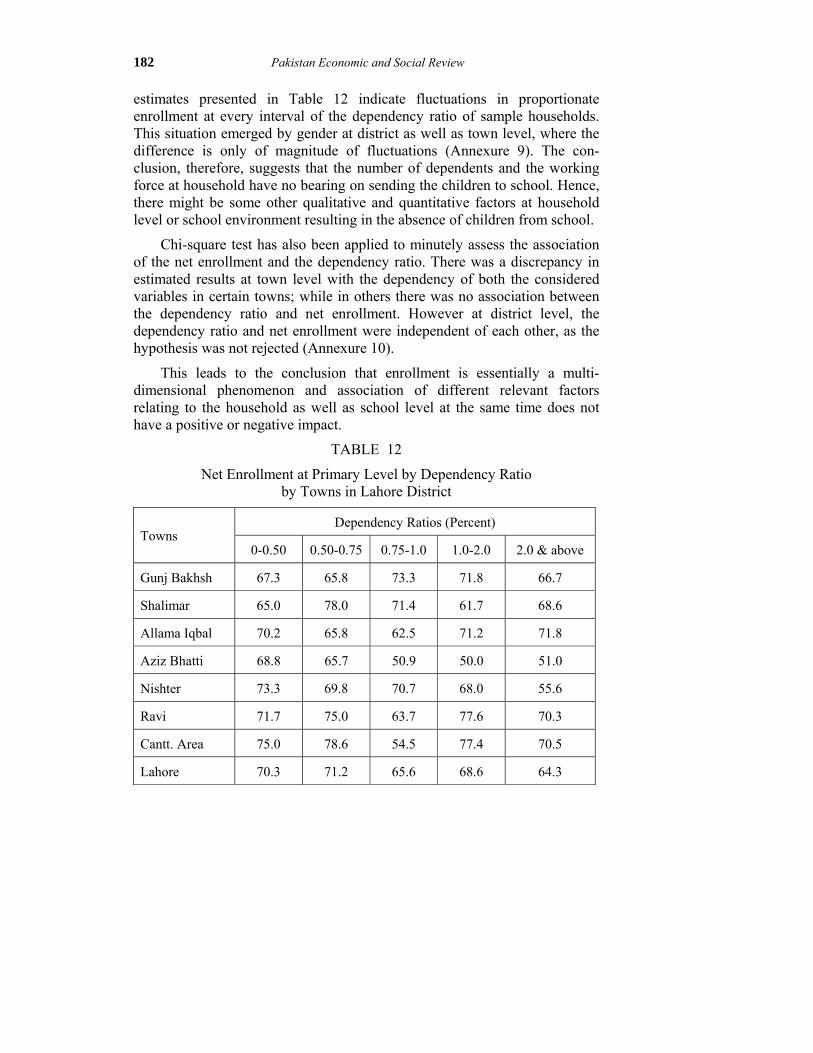
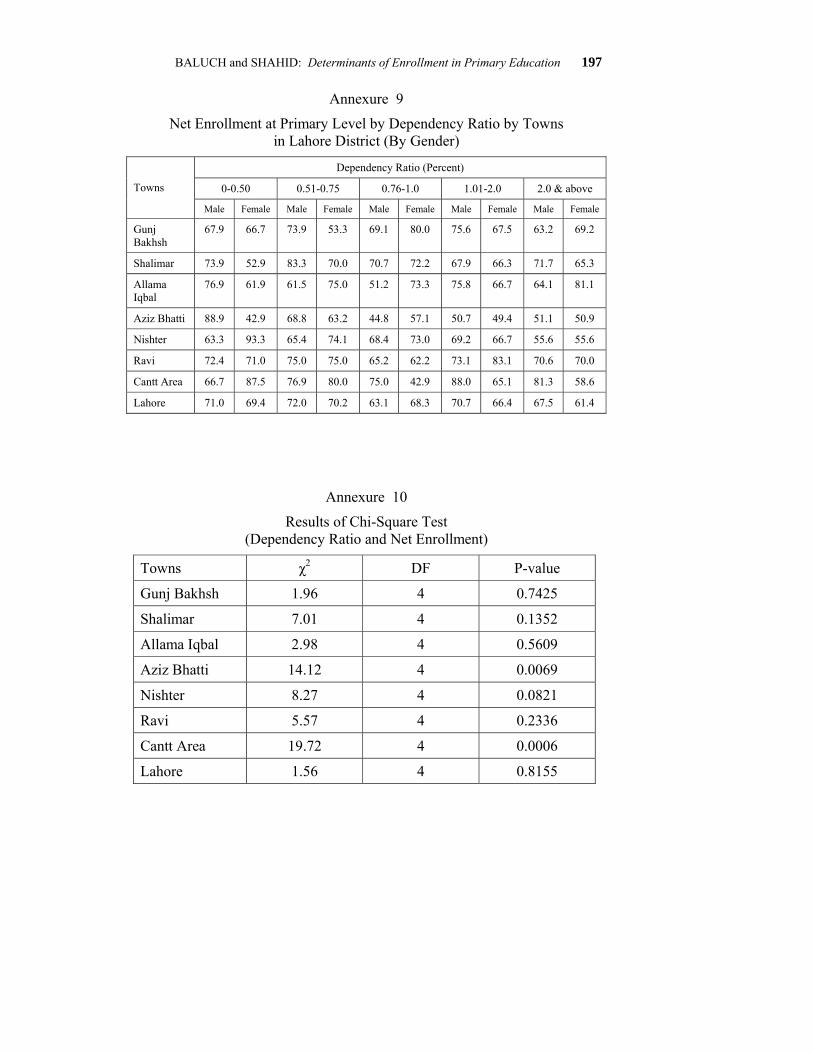
estimates presented in Table 12 indicate fluctuations in proportionate enrollment at every interval of the dependency ratio of sample households. This situation emerged by gender at district as well as town level, where the difference is only of magnitude of fluctuations (Annexure 9). The con-clusion, therefore, suggests that the number of dependents and the working force at household have no bearing on sending the children to school. Hence, there might be some other qualitative and quantitative factors at household level or school environment resulting in the absence of children from school.
Chi-square test has also been applied to minutely assess the association of the net enrollment and the dependency ratio. There was a discrepancy in estimated results at town level with the dependency of both the considered variables in certain towns; while in others there was no association between the dependency ratio and net enrollment. However at district level, the dependency ratio and net enrollment were independent of each other, as the hypothesis was not rejected (Annexure 10).
This leads to the conclusion that enrollment is essentially a multi-dimensional phenomenon and association of different relevant factors relating to the household as well as school level at the same time does not have a positive or negative impact.
TABLE 12
Net Enrollment at Primary Level by Dependency Ratio by Towns in Lahore District
Dependency Ratios (Percent) Towns
0-0.50 0.50-0.75 0.75-1.0 1.0-2.0 2.0 & above
Gunj Bakhsh 67.3 65.8 73.3 71.8 66.7
Shalimar 65.0 78.0 71.4 61.7 68.6
Allama Iqbal 70.2 65.8 62.5 71.2 71.8
Aziz Bhatti 68.8 65.7 50.9 50.0 51.0
Nishter 73.3 69.8 70.7 68.0 55.6
Ravi 71.7 75.0 63.7 77.6 70.3
Cantt. Area 75.0 78.6 54.5 77.4 70.5
Lahore 70.3 71.2 65.6 68.6 64.3
BALUCH and SHAHID: Determinants of Enrollment in Primary Education 183
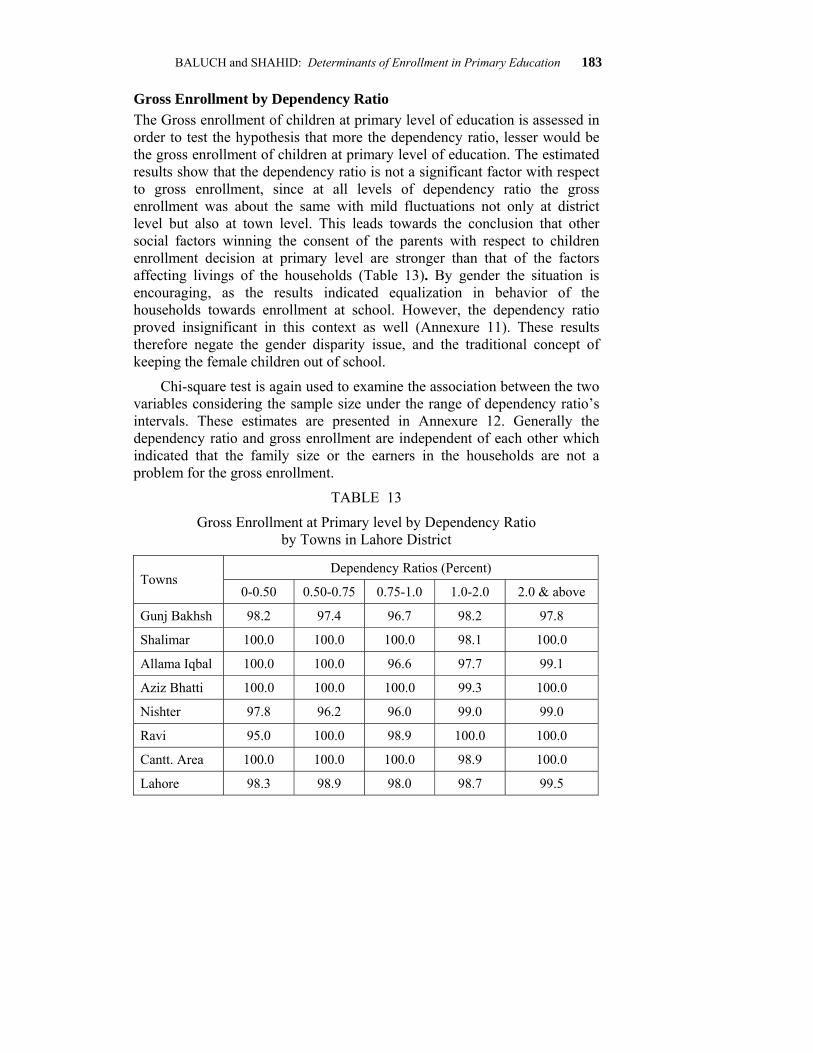
Gross Enrollment by Dependency Ratio The Gross enrollment of children at primary level of education is assessed in order to test the hypothesis that more the dependency ratio, lesser would be the gross enrollment of children at primary level of education. The estimated results show that the dependency ratio is not a significant factor with respect to gross enrollment, since at all levels of dependency ratio the gross enrollment was about the same with mild fluctuations not only at district level but also at town level. This leads towards the conclusion that other social factors winning the consent of the parents with respect to children enrollment decision at primary level are stronger than that of the factors affecting livings of the households (Table 13). By gender the situation is encouraging, as the results indicated equalization in behavior of the households towards enrollment at school. However, the dependency ratio proved insignificant in this context as well (Annexure 11). These results therefore negate the gender disparity issue, and the traditional concept of keeping the female children out of school.
Chi-square test is again used to examine the association between the two variables considering the sample size under the range of dependency ratio’s intervals. These estimates are presented in Annexure 12. Generally the dependency ratio and gross enrollment are independent of each other which indicated that the family size or the earners in the households are not a problem for the gross enrollment.
TABLE 13
Gross Enrollment at Primary level by Dependency Ratio by Towns in Lahore District
Dependency Ratios (Percent) Towns
0-0.50 0.50-0.75 0.75-1.0 1.0-2.0 2.0 & above
Gunj Bakhsh 98.2 97.4 96.7 98.2 97.8
Shalimar 100.0 100.0 100.0 98.1 100.0
Allama Iqbal 100.0 100.0 96.6 97.7 99.1
Aziz Bhatti 100.0 100.0 100.0 99.3 100.0
Nishter 97.8 96.2 96.0 99.0 99.0
Ravi 95.0 100.0 98.9 100.0 100.0
Cantt. Area 100.0 100.0 100.0 98.9 100.0
Lahore 98.3 98.9 98.0 98.7 99.5
184 Pakistan Economic and Social Review
Due to the fact that the district of Lahore is socio-economically ahead of all the other districts in Punjab, specific measures adopted by the public sector and provision of improved school infrastructure under public administration to expand education up to primary level resulted in awareness and significance of education at household level. This led to the fact that all the expected hypotheses are not rejected and some of the responsible factors proved to be abortive in this regard.
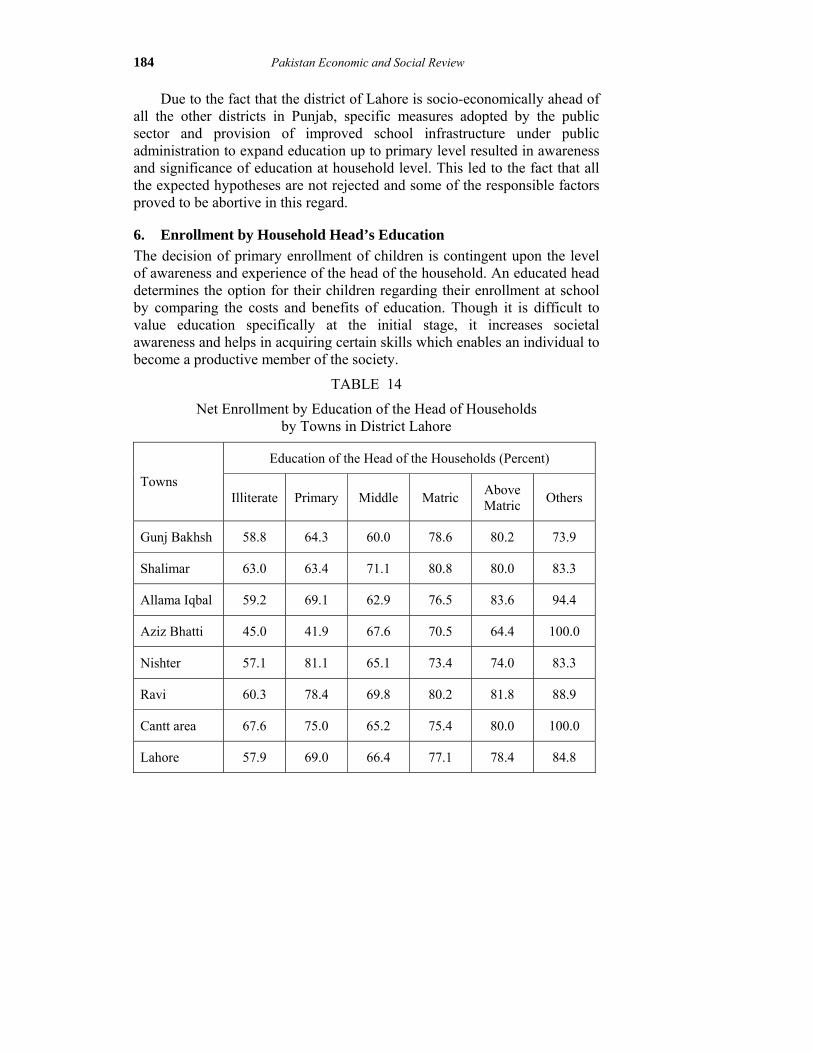
6. Enrollment by Household Head’s Education The decision of primary enrollment of children is contingent upon the level of awareness and experience of the head of the household. An educated head determines the option for their children regarding their enrollment at school by comparing the costs and benefits of education. Though it is difficult to value education specifically at the initial stage, it increases societal awareness and helps in acquiring certain skills which enables an individual to become a productive member of the society.
TABLE 14
Net Enrollment by Education of the Head of Households by Towns in District Lahore
Education of the Head of the Households (Percent)
Towns Illiterate Primary Middle Matric Above
Matric Others
Gunj Bakhsh 58.8 64.3 60.0 78.6 80.2 73.9
Shalimar 63.0 63.4 71.1 80.8 80.0 83.3
Allama Iqbal 59.2 69.1 62.9 76.5 83.6 94.4
Aziz Bhatti 45.0 41.9 67.6 70.5 64.4 100.0
Nishter 57.1 81.1 65.1 73.4 74.0 83.3
Ravi 60.3 78.4 69.8 80.2 81.8 88.9
Cantt area 67.6 75.0 65.2 75.4 80.0 100.0
Lahore 57.9 69.0 66.4 77.1 78.4 84.8
BALUCH and SHAHID: Determinants of Enrollment in Primary Education 185
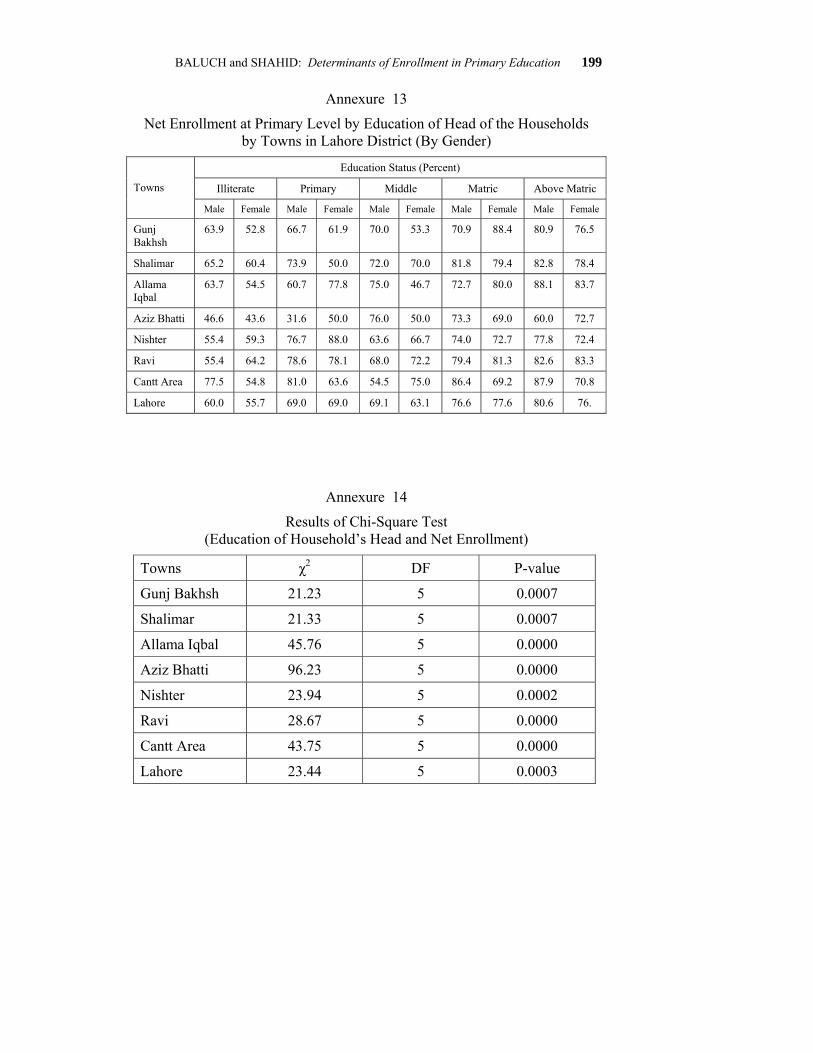
The estimates presented in Table 14 reveal that when a household is headed by an illiterate person, there is a lower probability that children of age of 5-9 would be enrolled in primary school, both at district and town level. Though a non symmetrical relation was obvious between the education level of the household head and the net enrollment of children at primary school education, the head of the households with matric and above matric level of education are found to be superior in terms of net enrollment of children at primary level. Similar results are observed in the case of enrollment by gender (Annexure 13).
To capture the ambiguities of the sample size of each group constituted on the basis of illiterate and educational status of literate, χ2 test is applied. Since the P-value was less than 0.01 at district level, the hypothesis that education of the head of the household was independent to net enrollment of the children at primary level was rejected (Annexure 14). Thus, the education of the head of the household has a positive and significant relationship with net enrollment. However, the difference in other associated variables result in contradictory findings in case of Shalimar, Allama Iqbal and Ravi towns, where failing to reject the hypothesis indicates independency of the two variables. Despite some contradictory results, this ultimately leads towards the point that education of the head of the households might prove an effective tool to increase net enrollment at primary level. Hence, there is a need for effective implementation of adult education scheme to create awareness in parents with respect to benefits of initial stage of education of children.
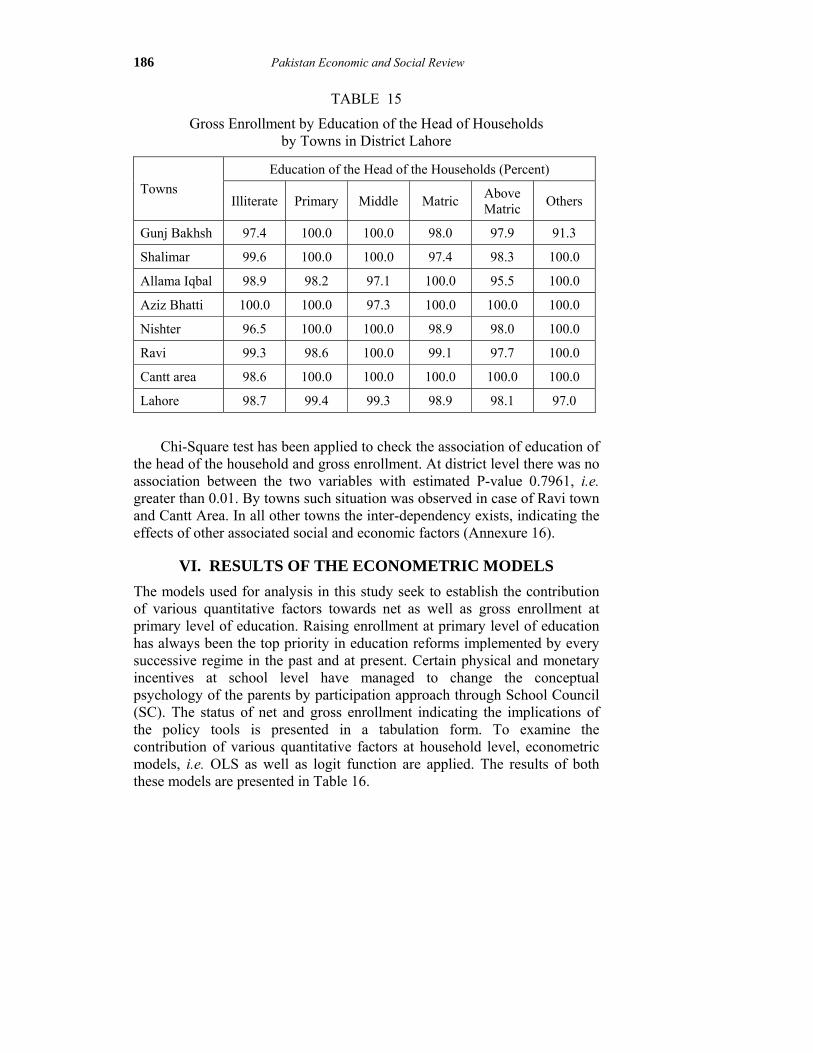
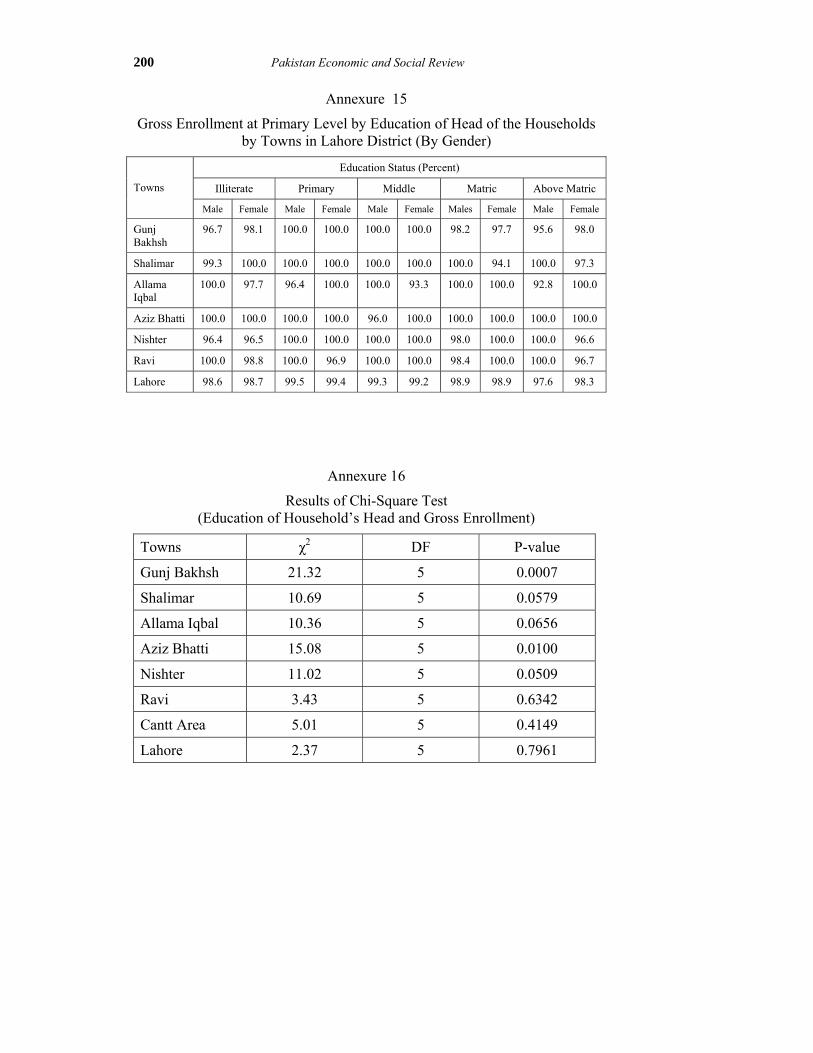
7. Gross Enrollment by Household Head’s Education The developed hypothesis maintains that there is a positive relationship between education of the head of the household and gross enrollment of the children. The estimates presented in Table 15 represent that gross enrollment up to primary level is generally independent of the educational status, at district and town level. Similar situation was registered and fluctuations were observed within educational status of the literate head of the households and gross enrollment of the children at primary level. Consequently, no specific or symmetrical trend appeared in this context. Moreover, the proportion of the children enrolled at primary school level was so high, that it was difficult to separate the contribution of the head’s educational status to gross enrollment. Nothing was obviously discriminating the results computed by gender in this context with no association between head of the household’s education and the gross enrollment of the children at primary school level (Annexure 15).
186 Pakistan Economic and Social Review
TABLE 15
Gross Enrollment by Education of the Head of Households by Towns in District Lahore
Education of the Head of the Households (Percent) Towns
Illiterate Primary Middle Matric Above Matric Others
Gunj Bakhsh 97.4 100.0 100.0 98.0 97.9 91.3
Shalimar 99.6 100.0 100.0 97.4 98.3 100.0
Allama Iqbal 98.9 98.2 97.1 100.0 95.5 100.0
Aziz Bhatti 100.0 100.0 97.3 100.0 100.0 100.0
Nishter 96.5 100.0 100.0 98.9 98.0 100.0
Ravi 99.3 98.6 100.0 99.1 97.7 100.0
Cantt area 98.6 100.0 100.0 100.0 100.0 100.0
Lahore 98.7 99.4 99.3 98.9 98.1 97.0
Chi-Square test has been applied to check the association of education of the head of the household and gross enrollment. At district level there was no association between the two variables with estimated P-value 0.7961, i.e. greater than 0.01. By towns such situation was observed in case of Ravi town and Cantt Area. In all other towns the inter-dependency exists, indicating the effects of other associated social and economic factors (Annexure 16).
VI. RESULTS OF THE ECONOMETRIC MODELS The models used for analysis in this study seek to establish the contribution of various quantitative factors towards net as well as gross enrollment at primary level of education. Raising enrollment at primary level of education has always been the top priority in education reforms implemented by every successive regime in the past and at present. Certain physical and monetary incentives at school level have managed to change the conceptual psychology of the parents by participation approach through School Council (SC). The status of net and gross enrollment indicating the implications of the policy tools is presented in a tabulation form. To examine the contribution of various quantitative factors at household level, econometric models, i.e. OLS as well as logit function are applied. The results of both these models are presented in Table 16.
BALUCH and SHAHID: Determinants of Enrollment in Primary Education 187
TABLE 16
Results of the Econometric Models (Dependent Variable — Gross Enrollment)
Simple Linear Regression Logit Function Variables
Coefficient t-Statistic Coefficient Z-Statistic
Constant –57.215 –7.271* –4.779 –13.374*
Education of HH 2.558 3.064* 0.053 1.565
School Distance –1.576 –0.265 –0.029 –0.114
Family Size 12.300 25.020* 0.361 15.872*
Dwelling Ownership 2.586 2.369* 0.131 2.857*
Household Income (per capita)
–9.88E-05 0.379 8.48E-06 0.458
Education Expenses 0.002 1.029 0.0002 2.977*
Literacy Ratio –0.224 –4.686* –0.003 –1.545
Dependency Ratio 80.506 50.633* 3.059 26.513*
Consumption Expen-diture per capita
4.57E-05 0.048 –8.13E-05 –1.656
^R2 0.555 0.451
Adjusted R2 0.554
F-ratio 451.797
^In case of logit Function McFadden R2
*Significant at 99.0 percent precision level
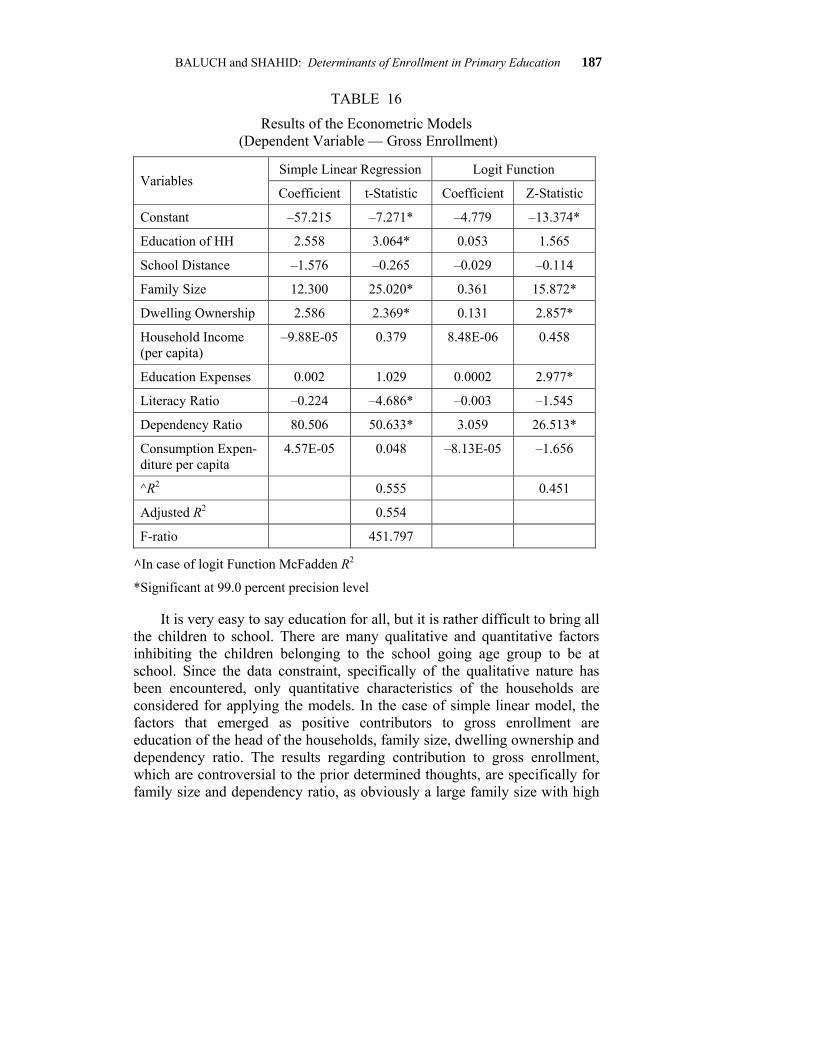
It is very easy to say education for all, but it is rather difficult to bring all the children to school. There are many qualitative and quantitative factors inhibiting the children belonging to the school going age group to be at school. Since the data constraint, specifically of the qualitative nature has been encountered, only quantitative characteristics of the households are considered for applying the models. In the case of simple linear model, the factors that emerged as positive contributors to gross enrollment are education of the head of the households, family size, dwelling ownership and dependency ratio. The results regarding contribution to gross enrollment, which are controversial to the prior determined thoughts, are specifically for family size and dependency ratio, as obviously a large family size with high
188 Pakistan Economic and Social Review
dependency ratio is expected to bear more expenses on living necessities, with a relative meager amount left for social concerns of the households. However it can be conceptually argued that as a greater number of children leads to an increase in the dependency ratio, an increase in gross enrollment might also be observed. Moreover, the level of education of the head of the household strictly determines the level of gross enrollment. This measure proved more effective to account for an increase in gross enrollment than the literacy ratio, which contributed significantly but negatively. An underlying reason might pertain to the age factor to which other literate members show lack of interest or have no decision power in sending the children who are older than the school-age to school and the final decision would be of the educated head of the household in this context.
In the logit function, the estimated results are somewhat different from the simple linear regression where the positive contribution of the education of the head turns out to be non significant. Moreover, the earlier negative contribution of the literacy ratio to gross enrollment, also proves to be non significant. Another variable, which affects the gross enrollment positively and significantly accounts for the expense of the household on education, which indirectly indicates the recognized importance of education of the children by the members of the household at all stages. The remaining variables included in the equations proved insignificant towards contribution to gross enrollment.
As described earlier, net enrollment is a better measure to assess school attendance. Econometric models (OLS and Logit Functions) are also applied considering the net enrollment as the dependent variable. The estimated results of this are presented in Table 17.
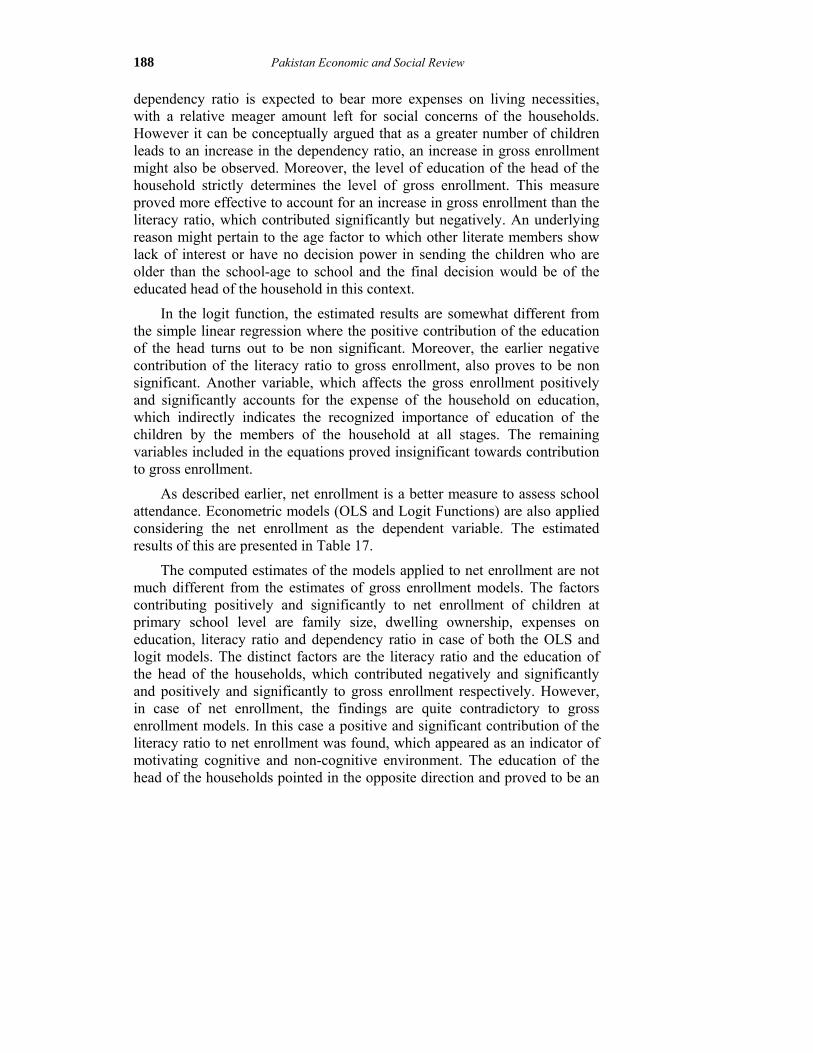
The computed estimates of the models applied to net enrollment are not much different from the estimates of gross enrollment models. The factors contributing positively and significantly to net enrollment of children at primary school level are family size, dwelling ownership, expenses on education, literacy ratio and dependency ratio in case of both the OLS and logit models. The distinct factors are the literacy ratio and the education of the head of the households, which contributed negatively and significantly and positively and significantly to gross enrollment respectively. However, in case of net enrollment, the findings are quite contradictory to gross enrollment models. In this case a positive and significant contribution of the literacy ratio to net enrollment was found, which appeared as an indicator of motivating cognitive and non-cognitive environment. The education of the head of the households pointed in the opposite direction and proved to be an
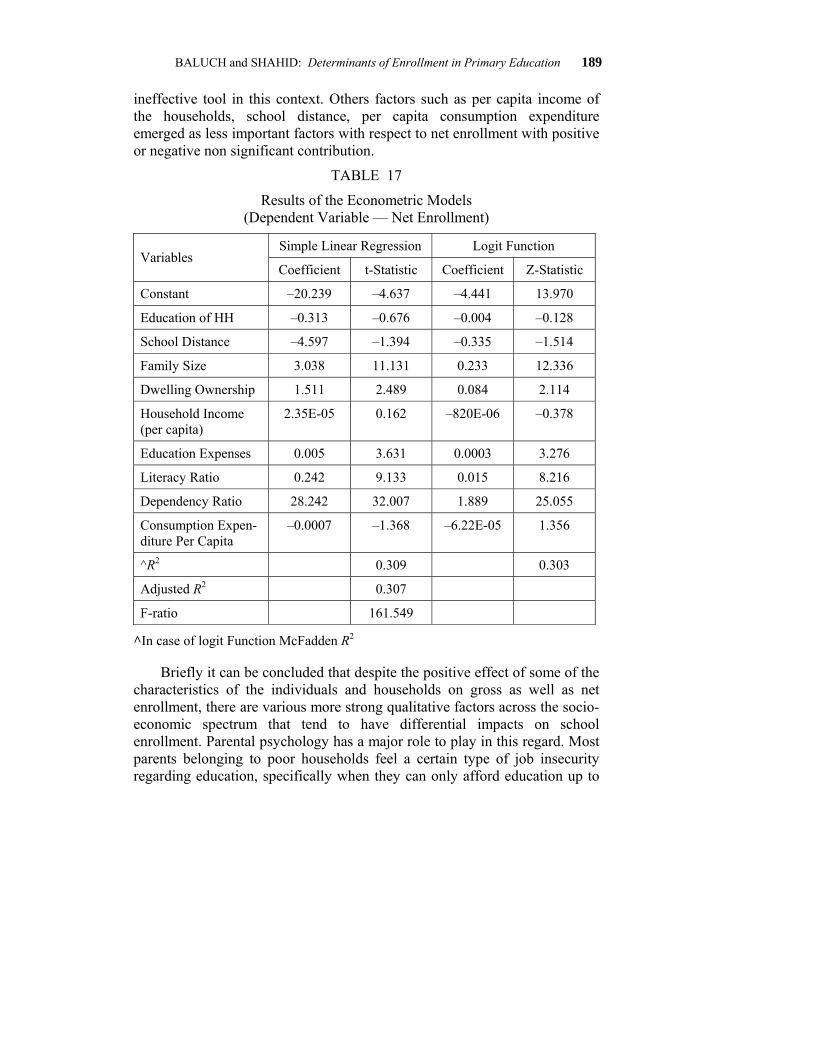
BALUCH and SHAHID: Determinants of Enrollment in Primary Education 189
ineffective tool in this context. Others factors such as per capita income of the households, school distance, per capita consumption expenditure emerged as less important factors with respect to net enrollment with positive or negative non significant contribution.
TABLE 17
Results of the Econometric Models (Dependent Variable — Net Enrollment)
Simple Linear Regression Logit Function Variables
Coefficient t-Statistic Coefficient Z-Statistic
Constant –20.239 –4.637 –4.441 13.970
Education of HH –0.313 –0.676 –0.004 –0.128
School Distance –4.597 –1.394 –0.335 –1.514
Family Size 3.038 11.131 0.233 12.336
Dwelling Ownership 1.511 2.489 0.084 2.114
Household Income (per capita)
2.35E-05 0.162 –820E-06 –0.378
Education Expenses 0.005 3.631 0.0003 3.276
Literacy Ratio 0.242 9.133 0.015 8.216
Dependency Ratio 28.242 32.007 1.889 25.055
Consumption Expen-diture Per Capita
–0.0007 –1.368 –6.22E-05 1.356
^R2 0.309 0.303
Adjusted R2 0.307
F-ratio 161.549
^In case of logit Function McFadden R2
Briefly it can be concluded that despite the positive effect of some of the characteristics of the individuals and households on gross as well as net enrollment, there are various more strong qualitative factors across the socio-economic spectrum that tend to have differential impacts on school enrollment. Parental psychology has a major role to play in this regard. Most parents belonging to poor households feel a certain type of job insecurity regarding education, specifically when they can only afford education up to
190 Pakistan Economic and Social Review
primary level. Consequently there is a need to implement certain revolutionary measures that would aim to create awareness regarding the importance of the basic education. To have more effective response of the basic education it is equally important to establish basic technical training units specifically in the rural areas in order to equip the children having primary or middle level education with some specific technical skills that would enable them to earn a living for their families.
VII. CONCLUSIONS AND POLICY IMPLICATIONS The conclusions derived from the estimated results reflect the importance of education of the children by the members of the households. Our main results contradicted the prior determined thoughts, as some of the major characteristics were found to be independent of enrollment. Consequently, parental conceptual psychology, i.e. what would be the future career of a child equipped with education up to primary, middle or even matric level, was the main inhibiting factor in children’s school enrollment decision of the households. Hence, there is a need to implement certain revolutionary measures to create awareness regarding importance of the basic education not only to adopt any income generating activity but also to comprehend the societal aspirations. To have strong response of the basic education it is equally important to establish basic technical training units in rural areas to equip the children having primary or middle level education with some specific technical skill leading them to adopt income generating activities through self-business or employment in industrial sector. Moreover some legislative measures should be implemented to make primary education compulsory to bring all the children of respective age to school to achieve the goal of educated Punjab.
BALUCH and SHAHID: Determinants of Enrollment in Primary Education 191
REFERENCES
Aakvik, A., K. G. Salvanes and K. Vaage (2005), Educational attainment and family background. German Economic Review, Volume 6(3), Veriein fur Social Politik and Blackwell Publishing Ltd. Garsington Road, Oxford ox4 2DQ, UK.
Arrow, K. J. (1973), Higher education as a filter. Journal of Public Economics, Volume 2(3), pp. 193-216.
Carmen, M. G. and A. Matilde (2001), Consumption Expenditure on Health and Education: Econometric Models and Evolution of OECD Countries in 1970-1996. Working Paper Series Economic Development No.50, Faculty of Economics and Econometrics, University of Santiago de Compostela.
Dostie, B. and R. Jayaraman (2006), Determinants of School Enrollment in Indian Village. Economic Development and Cultural Change (EDCC), Volume 54, No. 2, University of Chicago.
Dreze, J. and G. G. Kingdon (2001), School participation in rural India. Review of Development Economics, Volume 5(1), Blackwell Publisher 108 Cowley Road Oxford OX4 IJF, UK.
Edwards, L. N. (1976), School retention of teenagers over the business cycle. The Journal of Human Resources, Volume 11, No. 2, University of Wisconsin.
Government of Pakistan (2001), 1998 District Census Report of Lahore. Population Census Organization, Statistics Division, Islamabad.
Government of Pakistan (2001), 1998 District Census Report of Punjab. Population Census Organization, Statistics Division, Islamabad.
Government of Pakistan (2004), Education Sector Reforms: Action Plan 2001-02 to 2005-06. Ministry of Education, Islamabad, Pakistan.
Government of Pakistan (2005), Pakistan Social and Living Standards Measurement Survey (2004-05). Statistics Division, Federal Bureau of Statistics, Islamabad, Pakistan.
Government of Pakistan and UNESCO (2003), Quality of Primary Education in Pakistan. Preparatory Document for the Ministerial Meeting of South Asia EFA Forum 21-23 May, 2003, Ministry of Education and UNESCO Office, Islamabad.
192 Pakistan Economic and Social Review
Government of Punjab (2004), District-Based Multiple Indicators Cluster Survey. A Joint Venture of P&D Department, The Federal Bureau of Statistics and United Nations Children’s Fund (UNICEF). Punjab Bureau of Statistics, Lahore, Pakistan.
Handa, S. (1999), Raising Primary School Enrollment in Development Countries: The Relative Importance of Supply and Demand. FCND Discussion Paper No. 76, International Food Policy Research Institute, 2033 K Street, N.W. Washington, DC 20006, USA.
Orazem, L. P. and G. Victoria (2004), Child Labour, School Attendance and Performance: A Review. Working Paper # 04001, Working Paper Series, Department of Economics, IOWA State University.
Psachroupoulas, G. (1984), Contribution of Education to Economic Growth: Internation Comparisons of the Productivity and Causes of the Slowdown. Cambridge, Ballinger, 335-60.
Psachroupoulas, G. (1994), Returns to investment in education: A global update. World Development, Volume 22(9), pp. 1325-43.
Talik, J. B. J. (1989), Education and its relation to economic growth, poverty and income distribution. Discussion Paper No.46, World Bank Washington D.C.
Talik, J. B. J. (1994), Education for Development in Asia. Sage Publication, New Delhi.
BALUCH and SHAHID: Determinants of Enrollment in Primary Education 193
Annexure 1
Net Enrollment at Primary Level by Family Size by Towns in Lahore District (By Gender) (Percent)
Family Size (Nos.)
0-3 4-6 7-9 9-11 12 & above Towns
Male Female Male Female Male Female Male Female Male Female
Gunj Bakhsh
100.0 80.0 77.5 80.9 69.3 63.6 62.5 73.7 64.7 44.0
Shalimar – 100.0 75.0 72.5 68.8 62.9 72.2 60.0 69.2 64.0
Allama Iqbal
100.0 50.0 75.6 71.6 74.7 65.7 52.4 64.7 41.2 66.7
Aziz Bhatti 33.3 – 52.6 54.5 55.4 54.4 50.0 31.3 56.2 53.3
Nishter 50.0 100.0 72.8 67.7 63.0 72.8 60.9 57.1 57.9 58.8
Ravi 100.0 60.0 74.4 79.7 71.6 69.9 75.0 55.6 47.6 92.9
Cantt Area 66.7 66.7 85.7 58.8 81.0 69.1 69.2 53.8 72.7 83.3
Lahore 66.7 65.0 73.5 70.6 68.8 65.6 63.3 57.4 59.9 63.4
Annexure 2
Results of Chi-Square Test (Family Size and Net Enrollment)
Towns χ2 DF P-value
Gunj Bakhsh 21.90 4 0.0002
Shalimar 43.73 4 0.0000
Allama Iqbal 14.76 4 0.0052
Aziz Bhatti 27.47 4 0.0000
Nishter 6.48 4 0.1660
Ravi 3.96 4 0.4117
Cantt Area 8.91 4 0.0633
Lahore 3.77 4 0.4387
194 Pakistan Economic and Social Review
Annexure 3
Gross Enrollment at Primary Level by Family Size by Towns in Lahore District (By Gender) (Percent)
Family Size (Nos.)
0-3 4-6 7-9 9-11 12 & above
Towns
Male Female Male Female Male Female Male Female Male Female
Gunj Bakhsh
100.0 100.0 98.9 98.5 96.0 98.5 100.0 100.0 94.1 96.0
Shalimar – 100.0 98.9 96.3 100.0 100.0 100.0 100.0 100.0 100.0
Allama Iqbal
100.0 100.0 97.4 98.5 98.9 99.0 95.2 94.1 100.0 100.0
Aziz Bhatti 100.0 100.0 98.3 100.0 100.0 100.0 100.0 100.0 100.0 100.0
Nishter 100.0 100.0 98.8 98.5 98.0 97.1 95.7 100.0 100.0 100.0
Ravi 100.0 100.0 98.9 98.7 100.0 97.8 100.0 100.0 100.0 100.0
Cantt Area 100.0 100.0 97.6 100.0 100.0 100.0 100.0 100.0 100.0 100.0
Lahore 100.0 100.0 98.5 98.5 99.0 98.8 98.2 99.3 98.7 99.2
Annexure 4
Results of Chi-Square Test (Family Size and Gross Enrollment)
Towns χ2 DF P-value
Gunj Bakhsh 10.64 4 0.0310
Shalimar 8.03 4 0.0904
Allama Iqbal 10.92 4 0.0274
Aziz Bhatti 4.01 4 0.4049
Nishter 6.63 4 0.1569
Ravi 3.01 4 0.5558
Cantt Area 4.01 4 0.4049
Lahore 1.99 4 0.7368
BALUCH and SHAHID: Determinants of Enrollment in Primary Education 195
Annexure 5
Net Enrollment at Primary Level by Per Capita Income Groups by Towns in Lahore District (By Gender) (Percent)
Per Capita Income Group (Rs./Month)
0-1000 1000-2000 2000-4000 4000-6000 6000 & above Towns
Male Female Male Female Male Female Male Female Male Female
Gunj Bakhsh
65.6 56.8 78.8 78.1 70.6 74.2 80.0 57.1 64.2 100.0
Shalimar 67.6 58.8 80.0 78.4 75.0 71.4 100.0 100.0 – –
Allama Iqbal
67.0 57.6 70.0 71.4 80.0 95.8 80.0 100.0 85.7 83.3
Aziz Bhatti 50.9 48.4 51.2 57.1 68.4 60.0 75.0 80.0 – –
Nishter 62.5 63.9 71.2 68.9 64.7 92.9 66.7 100.0 100.0 85.7
Ravi 66.9 69.0 73.8 80.2 84.6 70.8 50.0 100.0 100.0 66.7
Cantt Area 77.1 69.7 85.7 74.2 100.0 60.0 100.0 100.0 75.0 70.0
Lahore 65.0 59.2 73.3 74.0 76.9 77.2 76.9 83.3 76.5 81.8
Annexure 6
Results of Chi-Square Test (Per Capita Income Groups and Net Enrollment)
Towns χ2 DF P-value
Gunj Bakhsh 8.22 4 0.0839
Shalimar 41.31 3 0.0000
Allama Iqbal 33.09 4 0.0000
Aziz Bhatti 20.02 4 0.0002
Nishter 27.36 4 0.0000
Ravi 5.36 4 0.2507
Cantt Area 36.91 4 0.0000
Lahore 11.19 4 0.0245
196 Pakistan Economic and Social Review
Annexure 7
Gross Enrollment at Primary Level by Per Capita Income Groups by Towns in Lahore District (By Gender) (Percent)
Per Capita Income Group (Rs./Month)
0-1000 1000-2000 2000-4000 4000-6000 6000 & above Towns
Male Female Male Female Male Female Male Female Male Female
Gunj Bakhsh
98.9 100.0 95.5 96.9 93.8 100.0 100.0 100.0 100.0 87.5
Shalimar 100.0 100.0 100.0 97.3 91.7 92.9 100.0 100.0 – –
Allama Iqbal
97.3 98.3 100.0 98.2 96.7 100.0 100.0 100.0 100.0 100.0
Aziz Bhatti 99.1 100.0 100.0 100.0 100.0 100.0 100.0 100.0 – –
Nishter 98.3 97.9 98.1 97.8 94.1 100.0 100.0 100.0 100.0 100.0
Ravi 100.0 99.0 100.0 97.5 100.0 100.0 50.0 100.0 100.0 100.0
Cantt Area 98.8 100.0 100.0 100.0 100.0 100.0 100.0 100.0 100.0 100.0
Lahore 99.0 99.2 99.0 98.0 96.5 99.2 96.2 100.0 100.0 97.0
Annexure 8
Results of Chi-Square Test (Per Capita Income Groups and Gross Enrollment)
Towns χ2 DF P-value
Gunj Bakhsh 6.79 4 0.1473
Shalimar 20.35 3 0.0001
Allama Iqbal 4.04 4 0.4006
Aziz Bhatti – – –
Nishter 5.22 4 0.2659
Ravi 135.51 4 0.000
Cantt Area 4.01 4 0.4049
Lahore 0.45 4 0.9785
BALUCH and SHAHID: Determinants of Enrollment in Primary Education 197
Annexure 9
Net Enrollment at Primary Level by Dependency Ratio by Towns in Lahore District (By Gender)
Dependency Ratio (Percent)
0-0.50 0.51-0.75 0.76-1.0 1.01-2.0 2.0 & above Towns
Male Female Male Female Male Female Male Female Male Female
Gunj Bakhsh
67.9 66.7 73.9 53.3 69.1 80.0 75.6 67.5 63.2 69.2
Shalimar 73.9 52.9 83.3 70.0 70.7 72.2 67.9 66.3 71.7 65.3
Allama Iqbal
76.9 61.9 61.5 75.0 51.2 73.3 75.8 66.7 64.1 81.1
Aziz Bhatti 88.9 42.9 68.8 63.2 44.8 57.1 50.7 49.4 51.1 50.9
Nishter 63.3 93.3 65.4 74.1 68.4 73.0 69.2 66.7 55.6 55.6
Ravi 72.4 71.0 75.0 75.0 65.2 62.2 73.1 83.1 70.6 70.0
Cantt Area 66.7 87.5 76.9 80.0 75.0 42.9 88.0 65.1 81.3 58.6
Lahore 71.0 69.4 72.0 70.2 63.1 68.3 70.7 66.4 67.5 61.4
Annexure 10
Results of Chi-Square Test (Dependency Ratio and Net Enrollment)
Towns χ2 DF P-value
Gunj Bakhsh 1.96 4 0.7425
Shalimar 7.01 4 0.1352
Allama Iqbal 2.98 4 0.5609
Aziz Bhatti 14.12 4 0.0069
Nishter 8.27 4 0.0821
Ravi 5.57 4 0.2336
Cantt Area 19.72 4 0.0006
Lahore 1.56 4 0.8155

198 Pakistan Economic and Social Review
Annexure 11
Gross Enrollment at Primary Level by Dependency Ratio by Towns in Lahore District (By Gender)
Dependency Ratio (Percent)
0-0.50 0.51-0.75 0.76-1.0 1.01-2.0 2.0 & above Towns
Male Female Male Female Male Female Male Female Male Female
Gunj Bakhsh
100.0 96.3 95.7 100.0 98.2 94.3 96.7 100.0 94.7 100.0
Shalimar 100.0 100.0 100.0 100.0 100.0 100.0 99.1 96.9 100.0 100.0
Allama Iqbal
100.0 100.0 100.0 100.0 97.7 95.6 95.4 100.0 100.0 98.4
Aziz Bhatti 100.0 100.0 100.0 100.0 100.0 100.0 98.6 100.0 100.0 100.0
Nishter 100.0 93.3 96.2 96.3 94.7 97.3 98.1 100.0 100.0 97.8
Ravi 100.0 90.3 100.0 100.0 97.8 100.0 100.0 100.0 100.0 100.0
Cantt Area 100.0 100.0 100.0 100.0 100.0 100.0 98.0 100.0 100.0 100.0
Lahore 100.0 96.3 98.7 99.2 98.1 97.9 98.1 99.4 99.6 99.3
Annexure 12
Results of Chi-Square Test (Dependency Ratio and Gross Enrollment)
Towns χ2 DF P-value
Gunj Bakhsh 0.51 4 0.9723
Shalimar 8.03 4 0.0904
Allama Iqbal 5.74 4 0.2198
Aziz Bhatti 4.01 4 0.4049
Nishter 3.93 4 0.4159
Ravi 15.86 4 0.0032
Cantt Area 4.01 4 0.4049
Lahore 0.88 4 0.9277
BALUCH and SHAHID: Determinants of Enrollment in Primary Education 199
Annexure 13
Net Enrollment at Primary Level by Education of Head of the Households by Towns in Lahore District (By Gender)
Education Status (Percent)
Illiterate Primary Middle Matric Above Matric Towns
Male Female Male Female Male Female Male Female Male Female
Gunj Bakhsh
63.9 52.8 66.7 61.9 70.0 53.3 70.9 88.4 80.9 76.5
Shalimar 65.2 60.4 73.9 50.0 72.0 70.0 81.8 79.4 82.8 78.4
Allama Iqbal
63.7 54.5 60.7 77.8 75.0 46.7 72.7 80.0 88.1 83.7
Aziz Bhatti 46.6 43.6 31.6 50.0 76.0 50.0 73.3 69.0 60.0 72.7
Nishter 55.4 59.3 76.7 88.0 63.6 66.7 74.0 72.7 77.8 72.4
Ravi 55.4 64.2 78.6 78.1 68.0 72.2 79.4 81.3 82.6 83.3
Cantt Area 77.5 54.8 81.0 63.6 54.5 75.0 86.4 69.2 87.9 70.8
Lahore 60.0 55.7 69.0 69.0 69.1 63.1 76.6 77.6 80.6 76.
Annexure 14
Results of Chi-Square Test (Education of Household’s Head and Net Enrollment)
Towns χ2 DF P-value
Gunj Bakhsh 21.23 5 0.0007
Shalimar 21.33 5 0.0007
Allama Iqbal 45.76 5 0.0000
Aziz Bhatti 96.23 5 0.0000
Nishter 23.94 5 0.0002
Ravi 28.67 5 0.0000
Cantt Area 43.75 5 0.0000
Lahore 23.44 5 0.0003
200 Pakistan Economic and Social Review
Annexure 15
Gross Enrollment at Primary Level by Education of Head of the Households by Towns in Lahore District (By Gender)
Education Status (Percent)
Illiterate Primary Middle Matric Above Matric Towns
Male Female Male Female Male Female Males Female Male Female
Gunj Bakhsh
96.7 98.1 100.0 100.0 100.0 100.0 98.2 97.7 95.6 98.0
Shalimar 99.3 100.0 100.0 100.0 100.0 100.0 100.0 94.1 100.0 97.3
Allama Iqbal
100.0 97.7 96.4 100.0 100.0 93.3 100.0 100.0 92.8 100.0
Aziz Bhatti 100.0 100.0 100.0 100.0 96.0 100.0 100.0 100.0 100.0 100.0
Nishter 96.4 96.5 100.0 100.0 100.0 100.0 98.0 100.0 100.0 96.6
Ravi 100.0 98.8 100.0 96.9 100.0 100.0 98.4 100.0 100.0 96.7
Lahore 98.6 98.7 99.5 99.4 99.3 99.2 98.9 98.9 97.6 98.3
Annexure 16
Results of Chi-Square Test (Education of Household’s Head and Gross Enrollment)
Towns χ2 DF P-value
Gunj Bakhsh 21.32 5 0.0007
Shalimar 10.69 5 0.0579
Allama Iqbal 10.36 5 0.0656
Aziz Bhatti 15.08 5 0.0100
Nishter 11.02 5 0.0509
Ravi 3.43 5 0.6342
Cantt Area 5.01 5 0.4149
Lahore 2.37 5 0.7961