Embed Size (px)
Citation preview

Determinants of Food Industry Performance –
Empirical Evidence Based on a Survey
William Hartley Furtan1 and Johannes Sauer2
1University of Saskatchewan, Saskatoon, Canada 2Kent Business School, University of Kent, Imperial College at Wye, United Kingdom
and University of Copenhagen, Denmark ([email protected])
Selected Paper for presentation at the American Agricultural Economics
Association Annual Meeting, Orlando, FL, July 27-29, 2008
Copyright 2008 by [H. Furtan and J. Sauer]. All rights reserved. Readers may make
verbatim copies of this document for non-commercial purposes by any means, provided
that this copyright notice appears on all such copies.

2
Abstract
This paper empirically investigates the determinants of firms’ performance in the agri-
food sector by using recent survey data for Denmark. Treating sales per employee as a proxy for value addition we estimate several bootstrapped regression models to draw conclusions on the marginal effects of potential performance determinants such as the form and nature of ownership, stage of the food chain and commodity sector, new product development, staff quality, firms’ competitive stance, and elements of firms’ strategy. To draw robust inferences we apply, besides the ordinary heteroscedasticity corrected Tobit ML-estimator, a nonparametric least absolute deviations estimator (LAD/CLAD) based on a quantile regression procedure. The results indicate that we cannot reject the hypothesis of no influence of dominant orientation on value added. Rather, firms’ focus on human capital, stage and commodity sector better explains their value addition. We can reject the hypothesis that regional networks have no influence on value added. Differences in location, emphasis on human capital and the negative influence of outsourcing on value added all provide supporting evidence. We reject the hypothesis of no influence of FDI, and moreover propose that FDI has targeted the domestic Danish market as a source of value added.
Keywords: value added, innovation, organizational type JEL classification: Q13, O31, O33
1. Introduction
There is a perceived need to increase the rate at which food industry firms add
value to food products. In a world of increased global competition the competitiveness of
firms can be enhanced by innovation. Traill and Muelenberg (2002) lists a number of
hypotheses regarding the relationship between innovation and firm performance in the
food industry as a means of formalizing a research agenda on this topic. There has been
surprisingly little research into the attributes of firms that can, do, or might deliver such
value added benefits. Moreover, much of the research to date has used case studies with
limited recourse to statistics and theoretical models of firm behaviour. This paper uses a
theoretical model of innovation and employs a recent survey of Danish food industry firms

3
to identify relationships between value added and the attributes and behaviour of the
firms.1
Christy and Connor (1989) have proposed that changes in value addition are
associated with structural and behavioural change in the food marketing system. Focusing
on structure, Rogers (2001) found that market shares of the largest firms in the US food
industry were highly correlated with those large firms’ shares of industry value added.
Conversely, Gould and Carson (1998) as well as Buhr (2004) both identified small firms’
value-adding activities that are essentially defensive: adding value as an alternative to cost
and logistics saving through economies of scale. Buhr’s interviews with food industry
firms revealed that they view product differentiation as being the key to adding value.
Branding (as a product differentiation tool) was investigated by Baker et al. (2006) and
Brester and Schroeder (1995) for linkages to value addition, and in both cases the
relationship was found to be associated with vertical relationships in the marketing
channels. Bressler (1999) examined cases of vertical integration as a means of adding
value, and found linkages to a broad range of management variables including human
resource management, asset acquisition and the form and extent of sales growth.
Coltrain et al. (2000) examined a selection of firms with various differentiation
strategies, and defined “innovation” and “co-ordination” as the two main sources of value
addition. In that study, these two activities tended to focus on relations within the supply
chain. Bosworth and Loundes (2002) also found strong links between several forms of
innovation within the marketing channel and value added. Given the apparent significance
of innovation in value addition, it is somewhat surprising that research and development
(R&D) actions and expenditures have generally not been found to be closely associated
with value addition (Heshmati and Pietola, 2004; Bosworth and Loundes, 2002).
1 The ongoing research programme “Outlook and perspectives for the Danish Food Industry” is funded by a grant under the Danish Innovation law.

4
Jungnickel et al. (2004) and Walkenhorst (2001) examined relationships between
international features of firms (foreign direct investment (FDI), export performance, staff
located abroad) and measures of productivity and value added. Both found a positive
relationship between value added and FDI, and between value added and exports. Those
studies used publicly-available databases that did not contain information on some key
variables on these themes, such as the characteristics of staff and the use of outsourcing.
Strong links between value added and choice of marketing channel, and channel
relationships, have been identified by Brown (1995, in a Canadian study) and Sonobe et
al. (2004, in a Chinese study across several sectors). Baker et al. (2006) found evidence
that value generated at one stage of the chain might be expropriated by other firms by
applications of branding behaviour, particularly where such behaviour was related to
interactions between retailers and other firms. Lawrence at al. (1997) found that inter-
stage relationships were important in value addition, particularly when allocation of
production, processing, distribution and retailing space were concerned.
2. Danish Food Sector
There has been substantial consolidation in Danish food sector over the period
1995-2000 (Baker, 2003). Baker (2003) reports that consolidation of food processing
firms has been more pronounced in Denmark than in other parts of Europe. The reason for
this rapid consolidation is driven by the need for firms to gain economies of size in order
to compete with cheaper imports and a highly competitive export market. This
consolidation has impacted the profitability of the Danish food processing firms. Similarly
a reduction in the number of food industry wholesale firms has been more rapid in
Denmark than other parts of Europe (Baker 2003). Finally, in terms of industry
concentration levels the Danish food sector is similar to other parts of Europe (Baker
2003). Denmark has a CR5 of about 56% while the CR4 in the US is about 27% at the
national level.

5
One strong trend that has occurred in the Danish food marketing chain is the
increase in the share of the wholesale market controlled by non-specialized stores. This
trend is apparent in most EU countries, but Denmark has the largest increase (Baker
2003). In contrast the US has shown a strong increase in all types of food retailing outlets.
3. Model and Hypotheses
The idea of a ‘knowledge production function’ was first suggested by Griliches
(1979). This idea has been expanded by social scientists interested in knowledge spillovers
and location theory (Bode 2004, Breschi and Lissoni 2001, and Feldman 1999). In this
paper we too build on the idea of a knowledge production function. We start by assuming
that the firm wants to maximize expected profit subject to a technology constraint
(knowledge production function). We also assume that the firm has no pricing power in
either the output or input market. In the simplest form we specific this as
( )itMaxE Π
Subject to
( )[ ] ititititit ZAXhYN φ+=
where expected profit is E(πit) and can be written as E(PNNY-wX-R&D) , Nit is a vector of
the number of products produced by the firm, Yit is a vector of output levels for each of the
N products, and Xit is a vector of traditional inputs such as physical capital and labour, w
the cost per unit of the traditional inputs, and R&Dit is the expenditure on innovation all
for firm i, all in period t. The knowledge production function is specified as an innovation
function A(Zit) and φit is a random variable. In tradition production function A(Zit) is a
productivity shifter, which may augment specific inputs in a biased manner (biased
technological change) or in a neutral manner (neutral technological change).

6
In our model we specify the change in productivity to be a function of four
variables i.e. A(R&D, C, F, L). R&D is the level research expenditure made by the firm
and captures the effect of the investment made by the firm in innovation. C is a vector of
contractual arrangements i.e. types of contracts the firm has entered into for the purpose of
marketing the output or purchasing inputs. Different types of contracts can make the firm
more efficient and thus represent a form of ‘business’ innovation. F is the presence of
foreign direct investment in the firm and captures the formal spillovers that occur from
foreign direct investment. Variable L captures local spillovers and is measured by the
proximity of the firm to other firms in the country.
An increase in research expenditures will increase the level of innovation. This has
been shown extensively in the economics literature and has been the main focus of
numerous studies estimating rates of return to research investment. The impact of
increasing the level of contractual arrangements is to make the firm more efficient by
reducing transaction costs. The level of foreign direct investment is thought to increase the
level of innovation. Foreign investment brings with it new techniques, opens up markets,
and increases the level of business capital (contacts). Local spillovers occur through
agglomeration effects in the supply of specific inputs such as skilled labour and the local
availability of specialized services such as international tax lawyers, accountants, and
engineers.
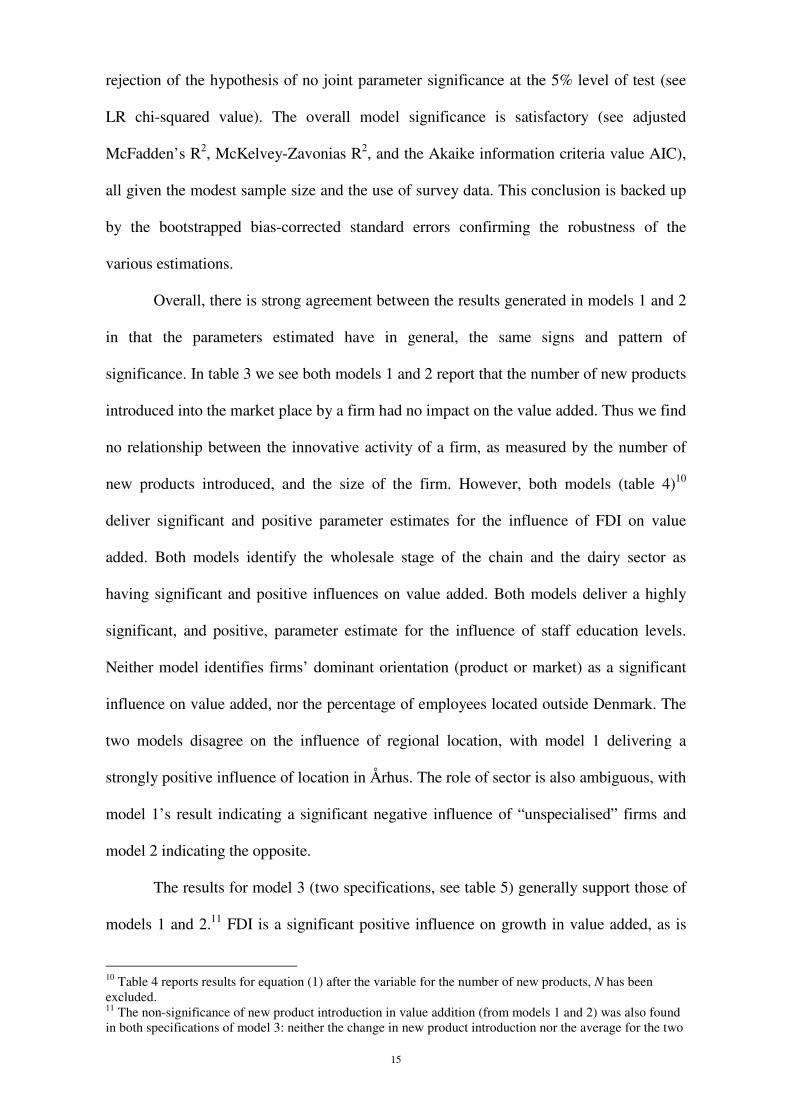
The impact of innovation on the output level of the firm is shown in figure 1. A
change in the level of A(.) shifts the function in a non parallel fashion. The larger the level
of traditional inputs used by the firm the greater is the impact of innovation on the total
output value of the firm. The change in A(.) can increase the level of output of existing
outputs (Y) or it can increase the number of products produced (N) or both (NY). For this
reason the first order conditions for profit maximization are not tractable.

7
Because the model is not tractable we do not work out the first order conditions
and develop a comparative static analysis to test hypotheses. As an alternative we use the
above model to test five hypotheses (see table 1) drawn from the agribusiness and
economics literature, using Danish food industry data. To the best of our knowledge none
of the hypothesis shown in table 1 has been tested using an innovation model with firm-
level data from the food industry.
In order to test the stated hypotheses we use three different econometric models.
We approach hypothesis 1-4 by specifying the following functional relationship (model
1):
( ), 1 , 2 , , , , , ,it it it it it ijt it ikt ilt imt
VA f N emp emp dFDI dR dCO dMS dFS dO= (1)
where VAit is value added or a proxy for profits measured by sales per employee, Nit is the
number of new products introduced, emp1it is the percentage of employees outside
Denmark, emp2it is the percentage of employees with university education, dFDIit is a
dummy variable for foreign direct investment in the firm, dRijt is a dummy variable for
location in region j, for firm i, all in period t.2 The variable dCOit is a dummy variable for
cooperative form, dMSit a dummy variable for marketing stage k3 and the dummy variable
dFSilt denotes firm i’s operation in sector l.4 Finally we include a dummy variable to
denote firm i’s dominant orientation m.5 The data set did not include research
expenditures made by the firm.
We do not measure the innovation activity of the firm directly rather include those
variables which make up the ‘knowledge production function’ and the traditional
production relationship. Intuition concerning human capital leads us to expect that the
2 København, Århus, Sønderjylland, Fyn, Viborg, Nordjylland, Vejle, Storstrøms, Frederiksborg,
Ringkøbing, Ribe, Roskilde, Vestsjællandj
∈
.
3 { }primary, processing, wholesale, retail, ingredientsk∈ 4 { }fruits and vegetables, dairy, pork, poultry, meat, unspecialisedl∈ 5 { }market, process, productm∈

8
percentage of employees with a university education has a positive influence on value
added. The percentage of employees outside Denmark is (a proxy for off-shoring), as a
cost-lowering activity, is expected to increase value added. We expect that firms with
some foreign direct investment will be more productive, and so exhibit higher value added
than firms without foreign direct investment. We anticipate a cluster or agglomeration
effect, which will be indicated by the location dummy variable, and following (Asheim
and Coenen 2005) expect that the co-operative form will have a negative influence on
value added. We expect retail and processing firms to show greater value-added than other
firms. We have no particular expectations about different levels of value addition by
separate commodity sectors. Our examination of co-ordination within the marketing chain
centres on vertical integration, which is expected to be positively associated with value
added. This effect may, however, be difficult to detect due to its association with other
factors.
To test hypothesis 5 we propose a second model (model 2)
, 1 , 1 , 1 , 1 , 1 , 1 , 1( , 1 , 2 , , , , , , , )it t it t it t it t it t imt t it t i i i
VA f N emp emp dFDI dO dCO R MS FS− − − − − − −∆ = ∆ ∆ ∆ ∆ ∆ ∆ (2)
where ∆ denotes the difference of (t)-(t-1) for each variable, with t = 2005 and t-1 = 2000.6
Model 2 allows us to test for the variables’ marginal contribution to growth in value added
for each of the firms. In addition to the variables defined above, a selection of other
variables was included in the models at various stages of specification. The variable
∆dCOit,t-i drops out because there was no change in the number of firms of the cooperative
type over the time period. Only the most statistically significant variables, as well as those
important for testing the hypotheses listed in table 1, remained in the final models’
specification.
4. Data and Estimation Procedure
6 We did estimate a model with ∆N as a variable but it was insignificant. We have not included the results to save space.

9
The data used in this study are drawn from a survey of 444 Danish food industry
(non-farm) firms.7 The survey questionnaire addressed several elements of strategy and
behaviour, and sought responses for 2005 (the current year) and 2000 (in retrospective).
The interview-based survey was conducted between November 2005 and March 2006 and
resulted in 131 valid responses (i.e. 30% response rate and a total sample of 262
observations). Descriptive statistics for the data set employed in the models are shown in
table 2.
An interview-based survey of Danish food industry firms was conducted
November -December 2005 and March - June 2006. Draft questionnaires were prepared,
and repeatedly circulated to 15 relevant organisations and numerous researchers during the
period May-October 2005. Six food industry firms were used to test the later drafts of the
questionnaire through mock interviews.
The questionnaire comprised 5 sections. In the first, basic descriptive numeric
information about firms was requested. The second section requested information about
firms' strategic emphases and actions, the third addressed new product introduction and
branding, the fourth firms' views on their competitive environment and the final section
firms' views on actual events and possible future ones. Each interview took around 50
minutes and targeted the firms' marketing manager or person responsible for marketing
and purchasing.
To identify target firms, a commercial database of firms' contact details was
purchased, with stratified sampling based on size (across size groups but excluding firms
with less than 5 employees) and sector (just 8 sectors included), and across three stages of
the marketing chain (retail, wholesale and processing). This sampling procedure yielded
986 firms, in many cases being the total number of eligible firms, given the stratified
sample. After eliminating defunct firms, incorrect contact details and subsidiaries of other
7 Further details of the survey and data are available from the authors.

10
firms in the sample, telephone contacts were made with 444 firms. The survey procedure
yielded 131 valid responses (a 30% response rate on 444 firms).
Econometric Model 1 - Bootstrapped Random-Effects Tobit Estimation
The dependent variable in model 1, VAit - sales per employee, is censored at zero
and thus violates a classical assumption of the linear regression model. Consequently, we
use a censored regression (also known as Tobit) model (see Maddala, 1994; Greene,
2003). By choosing a random-effects (RE) approach the unobservable factors that
differentiate the two cross-section units (2000, 2005) are assumed to be best characterized
as randomly distributed variables. The cross-sectional units of our analysis - agri-food
companies - vary quite a lot with respect to size, business focus and management style as
well as strategy, risk aversion etc. By assuming that these differences are randomly
distributed the general form of a RE model is given as
*it it itVA ε= + +itβ'x u (3)
where VA*it denotes the latent variable (value added) for firm i at time t, xit as a vector of
the observable explanatory variables for firm i in period t, uit as a vector capturing the
effects of relevant unobservable variables and time-invariant factors characterizing firm i
in period t, and εit as the stochastic disturbances of the model for firm i and period t. The
two randomly distributed stochastic elements of [3] form the composite error term as
ξ ε= +it it itu (4)
which is assumed to be normally distributed with the following characteristics
2u
2(0, ), = ε
ε
σ σ σξ
σ
Σ Σ
�
u
itN (5)

11
with σ denoting the standard deviation as usual. The dependent variable in [3] VA*it
denotes the latent variable and VAit as the proxy sales per employee for firm i at time t.
Hence, we construct the left-censored variable VAit used in estimation as
* *
*
if > 0
if 0it it
it
it
VA VAVA
L VA
=
≤ (6)
where L denotes the lower censoring bound, and use a RE Tobit ML estimation procedure
to obtain estimates of the parameters of the vector β' in (3) by maximizing the log-
likelihood function
1
1( , ) ln ln
n
i
VAL
τσ φ
σ σ σ=
− − = + Φ
∑
xβ xββ (7)
where φ and Φ are the probability density function and the cumulative density
function, respectively, for the standard normal distribution, σ as the standard deviation for
ξ , and τ as the threshold of censoring, here zero (see also Maddala, 1993). As is common
econometric knowledge, robust inference requires that the distribution of the error terms
follow a homoscedastic pattern. Hence, we use the heteroscedasticity-consistent
covariance matrix estimator proposed by White (1980) and report the corrected standard
errors and t-statistics.
To test for small-sample bias we further investigate the robustness of our estimates
obtained by (1) by applying a simple stochastic re-sampling procedure based on
bootstrapping techniques (see e.g. Efron 1979 or Efron/Tibshirani 1993). This seems to be
necessary as our panel data sample consists of a (rather) limited number of observations
and time units. If we suppose that ˆn
Ψ is an estimator of the parameter vector nψ
including all parameters obtained by estimating (1) based on our original sample of 229
observations 1( ,..., )nX x x= , then we are able to approximate the statistical properties of
ˆnΨ by studying a sample of C = 1000 bootstrap estimators ˆ ( ) , 1,...,n mc c CΨ = . These are

12
obtained by re-sampling our 229 and 110 observations respectively – with replacement –
from X and re-computing ˆnΨ by using each generated sample. Finally the sampling
characteristics of our vector of parameters is obtained from
(1) (1000)ˆ ˆ ˆ,...,
m m Ψ = Ψ Ψ (8)
As is extensively discussed by Horowitz (2001) and Efron and Tibshirani (1993),
the bias of the bootstrap as an estimator of ˆnΨ , ˆ
n nnBψ = Ψ −Ψ%
% , is itself a feasible
estimator of the bias of the asymptotic estimator of the true population parameter nψ .8
This holds also for the standard deviation of the bootstrapped empirical distribution
providing a natural estimator of the standard error for each initial parameter estimate. By
using a bias corrected bootstrap we aim to reduce the likely small sample bias in the initial
estimates. To examine the validity of the final model specifications we finally test for a
joint insignificance of the parameters in (1) by a generalized likelihood ratio testing
procedure. Further diagnosis tests were conducted to test for possible serial correlation in
the panel data used (following basically Wooldridge, 2002) as well as non-normality of
the residuals (see Jarque and Bera, 1980).
Model 2 - Censored Least Absolute Deviations Estimator (CLAD)
Both violations – heteroscedastic error terms and a non-normal error distribution –
lead to highly inconsistent Tobit regression results. However, there are alternative
estimation procedures which do not require the adherence to these error related
assumptions. Consequently, we choose as a second modelling approach for the pooled
sample the nonparametric censored least absolute deviations estimator (CLAD) developed
by Powell (1984, 1986) as a generalization of the least absolute deviation estimation for
non-negative dependent variables. Different contributions (Arabmazar and Schmidt, 1981;
8 Hence the bias-corrected estimator of
nψ can be computed by ˆ ˆ2n Bψψ ψ ψ− = −
%% .

13
Vijverberg, 1987; Rogers, 1993) show that the CLAD estimator is robust to
heteroscedasticity and is consistent and asymptotically normal for a wide class of error
distributions. The CLAD estimator is more robust to outliers, which arise frequently in the
case of survey data due to erroneous responses. If we re-write equations 3 and 6 as
follows:
max( ' , )it it iVA x Lβ ε= + (9)
The CLAD estimator of β minimizes the sum of absolute deviations, ε , assuming a
conditional median restriction on the error term. The objective function can thus be
specified as:
{ }1
1( ) min max , ' '
n
n i ii
S VA L xn
β β=
= −
∑ (10)
whereby the estimator uses the observations so that the median is preserved by monotonic
functions. Hence, the CLAD estimator involves the minimization of an objective function
that is not necessarily convex in β . Thus, obtaining a global minimum of (10) implies the
usage of numerical minimization algorithms based on the approximations of the first
derivative.9 The optimization procedure follows Jonston and DiNardo (1997) suggesting
the following steps: (i) estimating the median regression using the total sample to
determine the initial values for β , (ii) calculation of the values for the dependent variable
VA’it based on the estimated values for β by neglecting the observations for which VA’it
takes a negative value, and (iii) estimating the median regression based on the adjusted
sample to obtain new estimates for β . Steps (ii) and (iii) form the iteration process to
determine the final values for β . A crucial weakness of the CLAD estimator is its finite
sample bias resulting in mean-biased results for relatively small samples (see Paarsch,
1984). Since the estimator’s asymptotic variance-covariance matrix involves the
9 The iterative linear programming algorithm (ILPA) contained in STATA is used here.

14
estimation of the density function of the error term, we use bootstrap estimates of the
standard errors with about 1000 draws following the re/sampling procedure outlined
above.
Model 3 - Nonparametric Quantile Regression
Model 3 is based on the differences of the variables’ values between the two time
periods. Hence, the dependent variable ∆VAit no longer has a censored distribution.
However, due to the small sample size as well as the survey related frequency of outliers,
we use again a nonparametric quantile regression procedure based on a least absolute
deviation estimation (LAD). Equations (2) and (3) are estimated by following the
procedure outlined in the previous section. Hence, (9) is adjusted to account for an
uncensored dependent variable
, 1 , 1max( ' )it t it t iVA x β ε− −∆ = ∆ + (11)
The LAD estimator of β minimizes again the sum of absolute deviations, ε , assuming a
conditional median restriction on the error term. The objective function is now
{ }, 1 , 1
1
1( ) min max , ' '
n
n it t it ti
S VA L xn
β β− −
=
= ∆ − ∆
∑ (12)
Obtaining a global minimum of (12) implies again the usage of numerical minimization
algorithms based on the approximations of the first derivative. We finally also bootstrap
the quartile regression models for the differenced sample following the re-sampling
procedure outlined above and obtaining the sampling characteristics of our vector of
parameters as described by (9) after re-sampling the 110 observations with replacement.
5. Estimation Results
Tables 3, 4 and 5 summarize the results for the estimated censored regression
models. The diagnostic tests conducted for the Tobit regression indicate no serial
correlation, no rejection of the normality hypothesis with respect to the residual, and a
15
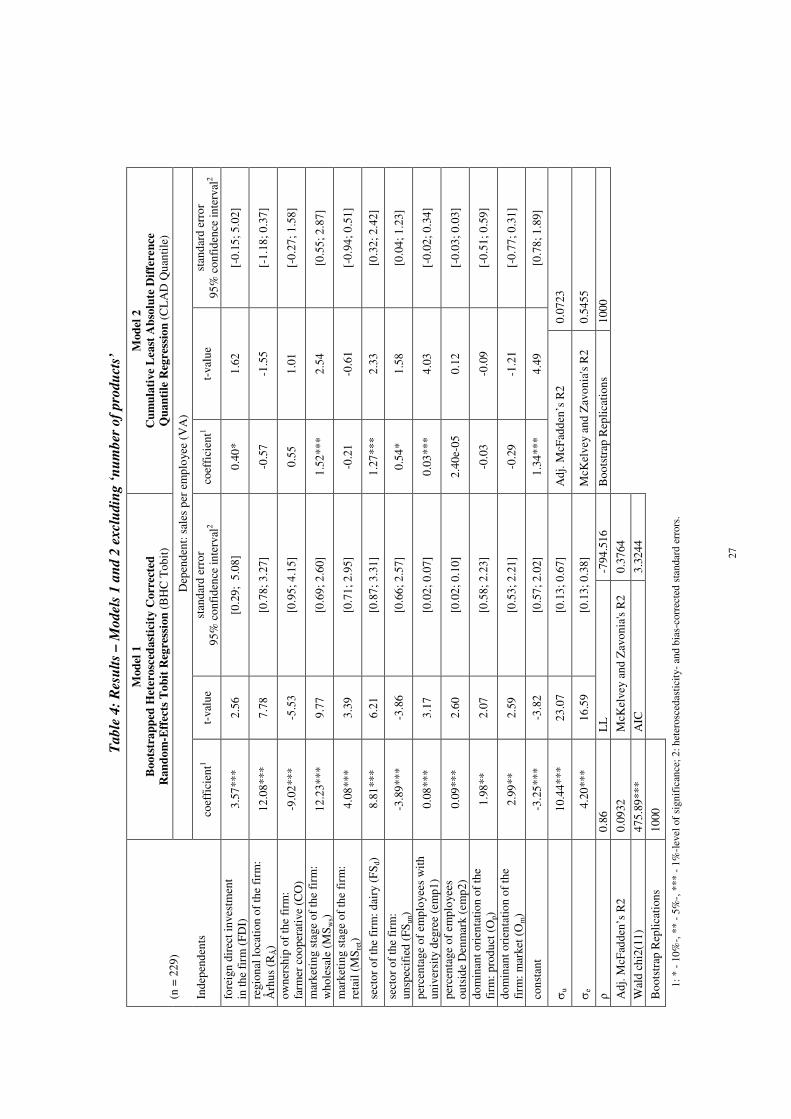
rejection of the hypothesis of no joint parameter significance at the 5% level of test (see
LR chi-squared value). The overall model significance is satisfactory (see adjusted
McFadden’s R2, McKelvey-Zavonias R2, and the Akaike information criteria value AIC),
all given the modest sample size and the use of survey data. This conclusion is backed up
by the bootstrapped bias-corrected standard errors confirming the robustness of the
various estimations.
Overall, there is strong agreement between the results generated in models 1 and 2
in that the parameters estimated have in general, the same signs and pattern of
significance. In table 3 we see both models 1 and 2 report that the number of new products
introduced into the market place by a firm had no impact on the value added. Thus we find
no relationship between the innovative activity of a firm, as measured by the number of
new products introduced, and the size of the firm. However, both models (table 4)10
deliver significant and positive parameter estimates for the influence of FDI on value
added. Both models identify the wholesale stage of the chain and the dairy sector as
having significant and positive influences on value added. Both models deliver a highly
significant, and positive, parameter estimate for the influence of staff education levels.
Neither model identifies firms’ dominant orientation (product or market) as a significant
influence on value added, nor the percentage of employees located outside Denmark. The
two models disagree on the influence of regional location, with model 1 delivering a
strongly positive influence of location in Århus. The role of sector is also ambiguous, with
model 1’s result indicating a significant negative influence of “unspecialised” firms and
model 2 indicating the opposite.
The results for model 3 (two specifications, see table 5) generally support those of
models 1 and 2.11 FDI is a significant positive influence on growth in value added, as is
10 Table 4 reports results for equation (1) after the variable for the number of new products, N has been excluded. 11 The non-significance of new product introduction in value addition (from models 1 and 2) was also found in both specifications of model 3: neither the change in new product introduction nor the average for the two

16
firms’ operation at the wholesale stage of the chain. Both specifications of model 3
indicate a negative influence on growth in value added of the number of employees
outside Denmark. Although both specifications of model 3 deliver similar R2 values, the
second specification (using average number of new products rather than its first
difference) delivers two more significant explanatory variables: a product orientation of
the firm (a positive influence on growth in value added) and a market orientation (a
negative influence). Neither of the two specifications deliver a significant parameter
estimate for location in Århus, although in both cases the t-value indicates that the
(positive) estimate is close to being significant at the 5% level of test.
6. Discussion of Results
Firms that introduced new products into the market did not have a significantly
higher value added then those that did not introduce new products. Thus we cannot reject
our first hypothesis. (This result did not change when we looked at the growth in value
added by firms.) There are at least three ways one can interprete this result. First, new
product innovation is not always profitable, especially in the short run. Firms that have
successful products in the market try to maintain the market for these products through
advertising and driving down production and marketing costs. In such cases new products
may be associated with higher costs of production at least in the short run. Second, food
firms may be more likely to innovate through process innovation and thus lower the costs
of production. Our data does not capture process innovation. Finally, innovation may
occur through strategic alliances, such as with foreign direct investment. This may open
up foreign markets allowing firms to drive down costs. The nature of the connection
between new product introductions and other activities of the firms is the subject of on-
going research, but at the current study cannot associate it strongly with value addition.
years is a significant driver of growth in value addition. We did not include a table showing this result in order to conserve on space.

17
There is an ongoing debate regarding the relationship between the size of firms and
their innovativeness. In the food sector many of the new innovations are not as expensive
to adopt as they are in very large capital intensive manufacturing industries, like the
aerospace sector. Perhaps capital constraints are more important in determining which
firms innovate, however we did not have data on the financial status of the firms.
The strong positive influence of staff education levels on value addition indicates
an important role for high quality human capital. This is highly consistent with the
negative influence of outsourced labour, and indicates a commitment to “knowledge-
based” industry. It also appears to be consistent with regional networking amongst firms
and with our inability to reject our second hypothesis: the insignificance of dominant
orientation. Our results indicate that instead of such orientations, Danish firms employ
sector (i.e. dairy), stage (i.e. wholesale) and educated employees to deliver value added.
This is, of course, not to say that Danish firms do not have a dominant orientation: rather
we claim that it is not an important determinant of value addition across a range of firms.
This interpretation is reinforced by the model of growth in value added, where dominant
orientations do play a role, but in this case they explain changes within a single firm,
rather than between firms.
The lack of significance of the co-operative form of business organization as an
explanation of value added is expected to some extent. However, we exercise caution in
interpreting this result because the dummy variable used may be masking other effects. In
particular, many of the processing firms in the sample are co-operatives and so the impact
of both dummies may be diluted by co-occurrence.
We are able to reject the third hypothesis that regional innovation systems do not
have an impact on a firm’s performance. Asheim and Coenen (2005) examined the
functional food ‘cluster’ in Scamia and found that the location of a university and research
organizations provided the seedbed for innovation. Braadland (2003) and Avermaete and

18
Viaenne (2000) identified regional networks as sources of innovation in agro-industry, the
bulk of it being organisational or involving the strengthening of existing brands and
market positions. A major advantage of Århus is the University of Århus and the
numerous food industry research facilities that have been built by both the public and
private sector in the area. It is the spillovers between research individuals together with
presence of university research that lead to new product and process innovation that
increases the productivity of firms. These interactions support the successful food
processing firms located in the Århus region. Our results support such an explanation of
value addition, specifically by identifying Århus as a centre for innovative food networks.
In addition to being an innovation centre, Århus’ geographic location favours relatively
lower cost access to export markets and the presence of an agro-industrial cluster (and the
majority of Danish livestock production) is likely to contribute to superior added value.
The positive influence of FDI on value addition implies we can reject our fourth
hypothesis. Thus we cannot rule out the importance that FDI has in the Danish food
sector. Aitken and Harrison (1999) have outlined a number of targets of FDI in the
manufacturing sector in Venezuela, including access to markets, general investment
considerations and the introduction of specific skills, experience and capital. (Surprisingly
little empirical research has been reported on how FDI impacts the economic performance
of firms in the food sector.) Each one of these explanations appears to have good
application to the data used here, and reinforces the impression gained from the strong
influence of FDI in the growth of value added (model 3). This is a particularly important
result given the pressure for Danish food companies to globalize because of reduced tariff
and non-tariff barriers.
Our final hypothesis is built on the relationship between the growth of a firm (as
measured by change in value added) and the number of new products introduced to the
market. We found no relationship between innovation and the growth in company size.

19
This was an expected result. A lot of product and process innovation is done in smaller
firms. Small firms without capital limitations are often more flexible and adaptable to new
ideas. We point out that the inclusion of average new product introduction levels in model
3 are associated with significance of dominant orientations, which do not feature strongly
elsewhere in the results.
What then does explain the growth of firm size? We found two variables to be
significant, FDI and if the firm is wholesale marketing stage of the industry. The most
important of these is FDI. Business networking is extremely important in a globalizing
economy; however it is also very expensive in terms of management time. One way to
achieve the benefits business networks is through FDI. This result is consistent with the
observation that more a liberalized trading environment provides potential benefits to
those firms that can increase exports or imports through strategic alliances.
The significance of the “wholesale” stage of the chain in value addition is likely to
be associated with its rapid consolidation since 1995 (see Baker, 2003). Consolidation,
ceteris paribus, is likely to raise the sales per employee for remaining firms. The dynamic
nature of this result is further supported by its strong significance in model 3. In practice,
value added is strongly contested between retailers and wholesalers, both of which have
experienced consolidation since 1995, although it has been most pronounced at wholesale
level (Baker, 2003). A similar within- versus between-firms argument explains the lack of
significance of university education in model 3: although value added has increased for
most firms between 2000 and 2005, the numbers of employees with a university education
at any one firm probably has not.
The non-significance of several variables that is not reported in the results are
worthy of note. First, export orientation of firms was dropped from the model for this
reason. This unexpected result indicates that firms serving export markets face fewer
opportunities for value addition than those concerned with domestic markets. More

20
importantly, the result provides a clue about the purpose of FDI in the Danish food
industry: it is unlikely to be motivated by access to EU and foreign markets, but rather
addresses the Danish market.
Although the survey provided data on competitiveness of markets (for products
and inputs), these also dropped out during specification. Value addition is likely to be
influenced by the structure of markets, but it appears that the effects have been captured in
the models by variables such as sector and stage of chain. This result requires examination
in future work.
7. Conclusions
The contribution of this paper is that it brings together a model of innovation using
a ‘knowledge production function’ and applies it to a set of data from the Danish food
sector. This unique and new set of data requires specific econometric techniques due to a
truncation of the distribution of the main dependent variable (a proxy for value addition)
and the distribution of both the explanatory variables and the models’ error terms. Overall,
model performance is strong and consistent and several conclusions can be drawn. The
model of growth in value added offers particular insights into within-firm emphasis and
strategy, and when seen in this light, its results support those of the pooled data that focus
on between-firm comparisons.
We cannot reject the null hypothesis of no influence of dominant orientation on
value added. Rather, firms’ focus on human capital, stage and commodity sector better
explains their value addition. We can reject the hypothesis that regional networks have no
influence on value added. Location in Århus, emphasis on human capital and the negative
influence of outsourcing on value added all provide supporting evidence. We reject the
hypothesis of no influence of FDI, and moreover propose that the FDI has targeted the
domestic Danish market as a source of value added. Evidence on the importance of firms’

21
dominant orientation is mixed at best, and we cannot reject the null hypothesis of no
influence on value added.
References
Aitken B and K. Harrison (1999) “Do Domestic Firms Benefit from Direct Foreign Investment? Evidence from Venezuela” American Economic Review, 89(3): 605-618. Asheim B.T. and L. Coenen (2005) “Knowledge bases and regional innovation systems: Comparing Nordic clusters” Research Policy, 34(8): 1173-1190. Avermaete, T. and J. Viaene (2002): “On Innovation and Meeting Regulations: the case of the Belgian Food Industry” Paper presented at the DRUID conference, Copenhagen and Elsinore. Baker, D., K. Baltzer and A. Møller (2006) "The Branding Behavior of Danish Food Industry Firms” Agribusiness 22(1): 31-50. Baker, D. (2003) “The Danish food marketing chain: developments and policy choices” Danish Institute of Food Economics, Rapport nr. 154. Braadland, T. (2000): “Innovation in the Norwegian food system” STEP programme report, Norwegian Research Council. Bode, E (2004) “The spatial pattern of localized R&D spillovers: an empirical investigation for Germany” Journal of Economic Geography 4: 43-64. Bosworth, D. and J. Loundes (2002) “The Dynamic Performance of Australian Enterprises” Melbourne Institute Working Paper No. 3/02, Melbourne. Breschi, S, and F. Lisson (2001) “Knowledge Spillovers and Local Innovation Systems: A Critical Survey” Industrial and Corporate Change, 10: 975-1005.
Brester, G.W. (1999) “Vertical integration of production agriculture into value-added niche markets: the case of Wheat Montana Farms and Bakery” Review of Agricultural Economics 21 (1): 276-285. Brester, G. S. and T. C. Schroeder (1995) "The Impacts of Brand and Generic Advertising in Meat Demand" American Journal of Agricultural Economics 77 (3): 969-979. Brown, W.M. (1995) “Competitiveness in a Resource Dependent Region: the case of food processing in Canada’s maritime provinces” Canadian Journal of Regional Science 23 (3): 410-425. Buhr, B.L (2004) “Case studies of direct marketing value-added pork products in a commodity market” Review of Agricultural Economics 26 (2): 266-279. Coltrain, D., D. Barton and M. Boland (2000) “Value added: opportunities and strategies” Working paper of the Arthur Capper Co-operative Center, Kansas State University. Christy, R.D. and J. M. Connor (1989) “Economic Forces influencing value-added food industries: implications for Southern agriculture” Southern Journal of Agricultural Economics 21 (1): 13-22.

22
Feldman, M.P. (1999) “The new economics of innovation, spillovers and agglomeration: a review of empirical studies” Economics of Innovation and New Technology 8:5-25. Gould, B.W and K.A. Carlson (1998) “Strategic management objectives of small manufacturers: a case study of the cheese industry” Review of Agricultural Economics 20 (2): 612-630. Greene, W.H. (2003). Econometric Analysis 5th ed. Prentice Hall, Upper Saddle River, New Jersey, USA. Griliches, Z. (1979) “Issues in assessing the contribution of R&D to productivity growth” Bell
Journal of Economics 10:92-1116. Heshmati A. and K. Pietola (2004), “The Relationship between Corporate Competitiveness Strategy, Innovation, Increased Efficiency, Productivity Growth and Outsourcing”, mimeo, College of Engineering, Seoul National University, Seoul. Jungnickel, R, L. Bellmann and P. Ellguth (2004) “Productivity in Foreign-owned Firms in Eastern Germany” New EIBA papers series, Brussels. Lawrence, J.D., V.J. Rhodes, G.A. Grimes and M.L. Hayenga (1997). “Vertical Coordination in the U.S. Pork Industry: Status, Motivations, and Expectations” Agribusiness 13 (1): 21-31. Maddala, G.S. (1983). Limited-Dependent and Qualitative Variables in Econometrics. Cambridge University Press, Cambridge UK. Rogers, T.R. (2001) “Structural Change in the U.S. Food Manufacturing, 1958-1997” Agribusiness, 17 (1): 3-32. Sonobe, T. , D. Hu and K. Otsuka (2004) “From Inferior to Superior Products: an enquiry into the Wenzhou model of industrial development in China” Working paper, Foundation of Advanced Studies on International Development, Tokyo. Traill, W.B., and M. Meulenberg. (2002) “Innovation in the Food Industry” Agribusiness 18 (1): 1-22. Walkenhorst, P. (2001). "Determinants of Foreign Direct Investment in the Food Industry: the case of Poland" Agribusiness 17 (3): 383-395.

23
Figure 1: Effect of change in innovation activity on the firm profit
h
X

24
Table 1. Hypotheses tested
Hypothesis Reference
1 There is no relationship between company size and innovation Traill and Muelenberg
2 Successful firms do not have a single dominant orientation to product, process, nor market
Traill and Muelenberg
3 Regional innovation systems do not have an impact on a firm’s performance
Asheim and Coenen
4 Foreign Direct Investment has as no influence on a firm’s performance
Aitken and Harrison
5 In product and market oriented firms, new product development does not drive firm growth.
Traill and Muelenberg

25
Table 2 – Descriptive Statistics
Variable Mean Stdev Min Max
sales per employee (mill DKK) 4.16 10.67 0.01 133.33 number of new products introduced (n) 93.15 417.86 0 5000 percentage of employees outside Denmark (%) 2.88 11.36 0 76 percentage of employees with university degree (%) 5.67 14.66 0 100 foreign direct investment in the firm (dummy: 1 - yes, 0 - no) 0.12 0.33 0 1 regional location of the firm (dummy: 1 - yes, 0 - no) - københavn (12 obs) - århus (24 obs) - sønderjylland (22 obs) - fyn (36 obs) - viborg (16 obs) - nordjylland (26 obs) - vejle (32 obs) - storstrøms (6 obs) - frederiksborg (8 obs) - ringkøbing (6 obs) - ribe (6 obs) - roskilde (10 obs) - vestsjælland (8 obs)
0.16 0.09 0.08 0.14 0.06 0.10 0.12 0.02 0.03 0.02 0.02 0.04 0.03
0.37 0.29 0.28 0.34 0.24 0.29 0.33 0.15 0.17 0.15 0.14 0.19 0.17
0 0 0 0 0 0 0 0 0 0 0 0 0
1 1 1 1 1 1 1 1 1 1 1 1 1
ownership of/by the firm* (dummy: 1 - yes, 0 - no) - owned by a farmer/farmer cooperative (22 obs) - owned by a non-food firm (41 obs) - ownership of a retail outlet (5 obs) - owned by distributer/wholesaler (6 obs) - ownership of a distributer/wholesaler (10 obs) - ownership of a processer (11 obs) - owned by services (6 obs) - owned by ingredients (1 obn)
0.08 0.16 0.02 0.04 0.06 0.04 0.02 0.01
0.28 0.37 0.14 0.19 0.25 0.20 0.15 0.06
0 0 0 0 0 0 0 0
1 1 1 1 1 1 1 1
marketing stage of the firm (dummy: 1 - yes, 0 - no) - primary (8 obs) - processing (108 obs) - wholsale (78 obs) - retail (54 obs) - ingredients (10 obs)
0.03 0.41 0.29 0.21 0.04
0.17 0.49 0.46 0.41 0.19
0 0 0 0 0
1 1 1 1 1
sector of the firm (dummy: 1 - yes, 0 - no) - feeding (2 obs) - fruits & vegetables (24 obs) - dairy (46 obs) - beef (10 obs) - pork (6 obs) - poultry (12 obs) - meat (50 obs) - unspecified (112 obs)
0.01 0.09 0.18 0.04 0.02 0.05 0.19 0.43
0.09 0.29 0.38 0.19 0.15 0.21 0.39 0.49
0 0 0 0 0 0 0 0
1 1 1 1 1 1 1 1
dominant orientation of the firm (dummy: 1 – yes, 0 – no) - market (85 obs) - process (15 obs) - product (64 obs)
0.32 0.06 0.24
0.47 0.23 0.43
0 0 0
1 1 1
*”ownership” refers to ownership of firms (or by firms) outside the stage of the marketing chain occupied by the firm.

26
Table
3:
Res
ult
s – M
odel
s 1 a
nd 2
in
clu
din
g ‘
nu
mber
of
pro
du
cts’
Mod
el 1
Boots
tra
pp
ed H
eter
osc
edast
icit
y C
orr
ecte
d
Ran
do
m-E
ffect
s T
ob
it R
egre
ssio
n (
BH
C T
obit)
Mod
el 2
Cu
mu
lati
ve
Least
Ab
solu
te D
iffe
ren
ce
Qu
an
tile
Reg
res
sio
n (
CL
AD
Qua
ntile
)
Dep
ende
nt: s
ales
per
em
ploy
ee (
VA
)
(n =
229
) In
depe
nden
ts
coef
fici
ent1
t-va
lue
stan
dard
err
or
95%
con
fide
nce
inte
rval
2 co
effi
cien
t1 t-
valu
e st
anda
rd e
rror
95
% c
onfi
denc
e in
terv
al2
num
ber
of p
rodu
cts
intr
oduc
ed (
np)
5.22
-05
0.17
[5
.25e
-03;
0.0
02]
-7.6
9e-0
5 -0
.42
[-4.
26e-
04; 1
.96e
-04]
fore
ign
dire
ct in
vest
men
t in
the
firm
(FD
I)
3.55
***
2.52
[0
.29;
5.0
8]
0.40
* 1.
62
[-0.
15; 5
.02]
regi
onal
loca
tion
of
the
firm
: Å
rhus
(R
Å)
12.0
8***
7.
78
[0.7
8; 3
.27]
-0
.57
-1.5
5 [-
1.18
; 0.3
7]
owne
rshi
p of
the
firm
: fa
rmer
coo
pera
tive
(C
O)
-9.0
1***
-5
.52
[0.9
5; 4
.15]
0.
55
1.01
[-
0.27
; 1.5
8]
mar
ketin
g st
age
of th
e fi
rm:
who
lesa
le (
MS w
s)
12.2
3***
9.
77
[0.6
9; 2
.60]
1.
52**
* 2.
54
[0.5
5; 2
.87]
mar
ketin
g st
age
of th
e fi
rm:
reta
il (M
S ret)
4.08
***
3.39
[0
.71;
2.9
5]
-0.2
1 -0
.61
[-0.
94; 0
.51]
sect
or o
f th
e fi
rm: d
airy
(FS
d)
8.81
***
6.21
[0
.87;
3.3
1]
1.27
***
2.33
[0
.32;
2.4
2]
sect
or o
f th
e fi
rm:
unsp
ecif
ied
(FS u
n)
-3.8
9***
-3
.86
[0.6
6; 2
.57]
0.
54*
1.58
[0
.04;
1.2
3]
perc
enta
ge o
f em
ploy
ees
wit
h un
iver
sity
deg
ree
(em
p1)
0.05
***
3.01
[0
.02;
0.0
7]
0.03
***
4.03
[-
0.02
; 0.3
4]
perc
enta
ge o
f em
ploy
ees
outs
ide
Den
mar
k (e
mp2
) 0.
09**
* 2.
60
[0.0
2; 0
.10]
2.
40e-
05
0.12
[-
0.03
; 0.0
3]
dom
inan
t ori
enta
tion
of
the
firm
: pr
oduc
t (O
p)
1.98
**
2.07
[0
.58;
2.2
3]
-0.0
3 -0
.09
[-0.
51; 0
.59]
dom
inan
t ori
enta
tion
of
the
firm
: m
arke
t (O
m)
2.99
**
2.59
[0
.53;
2.2
1]
-0.2
9 -1
.21
[-0.
77; 0
.31]
cons
tant
-3
.25*
**
-3.8
2 [0
.57;
2.0
2]
1.34
***
4.49
[0
.78;
1.8
9]
σu
10.4
4***
23
.07
[0.1
3; 0
.67]
A
dj. M
cFad
den’
s R
2 0.
0723
σe
4.20
***
16.5
9 [0
.13;
0.3
8]
McK
elve
y an
d Z
avon
ia's
R2
0.54
55
ρ
0.86
L
L
-791
.323
B
oots
trap
Rep
licat
ions
10
00
Adj
. McF
adde
n’s
R2
0.09
32
McK
elve
y an
d Z
avon
ia's
R2
0.37
64
Wal
d ch
i2(1
1)
475.
89**
* A
IC
3.32
44
Boo
tstr
ap R
eplic
atio
ns
1000
1:
* -
10%
-, *
* -
5%-,
***
- 1
%-l
evel
of s
igni
fica
nce;
2: h
eter
osce
dast
icity
- an
d bi
as-c
orre
cted
sta
ndar
d er
rors
.
27
Table
4:
Res
ult
s – M
odel
s 1 a
nd 2
excl
udin
g ‘
nu
mber
of
pro
du
cts’
Mod
el 1
Boots
tra
pp
ed H
eter
osc
edast
icit
y C
orr
ecte
d
Ran
do
m-E
ffect
s T
ob
it R
egre
ssio
n (
BH
C T
obit)
Mod
el 2
Cu
mu
lati
ve
Least
Ab
solu
te D
iffe
ren
ce
Qu
an
tile
Reg
res
sio
n (
CL
AD
Qua
ntile
)
Dep
ende
nt: s
ales
per
em
ploy
ee (
VA
)
(n =
229
) In
depe
nden
ts
coef
fici
ent1
t-va
lue
stan
dard
err
or
95%
con
fide
nce
inte
rval
2 co
effi
cien
t1 t-
valu
e st
anda
rd e
rror
95
% c
onfi
denc
e in
terv
al2
fore
ign
dire
ct in
vest
men
t in
the
firm
(FD
I)
3.57
***
2.56
[0
.29;
5.0
8]
0.40
* 1.
62
[-0.
15; 5
.02]
regi
onal
loca
tion
of th
e fi
rm:
Årh
us (
RÅ)
12.0
8***
7.
78
[0.7
8; 3
.27]
-0
.57
-1.5
5 [-
1.18
; 0.3
7]
owne
rshi
p of
the
firm
: fa
rmer
coo
pera
tive
(CO
) -9
.02*
**
-5.5
3 [0
.95;
4.1
5]
0.55
1.
01
[-0.
27; 1
.58]
mar
ketin
g st
age
of th
e fi
rm:
who
lesa
le (
MS w
s)
12.2
3***
9.
77
[0.6
9; 2
.60]
1.
52**
* 2.
54
[0.5
5; 2
.87]
mar
ketin
g st
age
of th
e fi
rm:
reta
il (M
S ret)
4.08
***
3.39
[0
.71;
2.9
5]
-0.2
1 -0
.61
[-0.
94; 0
.51]
sect
or o
f th
e fi
rm: d
airy
(FS
d)
8.81
***
6.21
[0
.87;
3.3
1]
1.27
***
2.33
[0
.32;
2.4
2]
sect
or o
f th
e fi
rm:
unsp
ecif
ied
(FS u
n)
-3.8
9***
-3
.86
[0.6
6; 2
.57]
0.
54*
1.58
[0
.04;
1.2
3]
perc
enta
ge o
f em
ploy
ees
with
un
iver
sity
deg
ree
(em
p1)
0.08
***
3.17
[0
.02;
0.0
7]
0.03
***
4.03
[-
0.02
; 0.3
4]
perc
enta
ge o
f em
ploy
ees
outs
ide
Den
mar
k (e
mp2
) 0.
09**
* 2.
60
[0.0
2; 0
.10]
2.
40e-
05
0.12
[-
0.03
; 0.0
3]
dom
inan
t ori
enta
tion
of th
e fi
rm: p
rodu
ct (
Op)
1.
98**
2.
07
[0.5
8; 2
.23]
-0
.03
-0.0
9 [-
0.51
; 0.5
9]
dom
inan
t ori
enta
tion
of th
e fi
rm: m
arke
t (O
m)
2.99
**
2.59
[0
.53;
2.2
1]
-0.2
9 -1
.21
[-0.
77; 0
.31]
cons
tant
-3
.25*
**
-3.8
2 [0
.57;
2.0
2]
1.34
***
4.49
[0
.78;
1.8
9]
σu
10.4
4***
23
.07
[0.1
3; 0
.67]
A
dj. M
cFad
den’
s R
2 0.
0723
σe
4.20
***
16.5
9 [0
.13;
0.3
8]
McK
elve
y an
d Z
avon
ia's
R2
0.54
55
ρ
0.86
L
L
-794
.516
B
oots
trap
Rep
licat
ions
10
00
Adj
. McF
adde
n’s
R2
0.09
32
McK
elve
y an
d Z
avon
ia's
R2
0.37
64
Wal
d ch
i2(1
1)
475.
89**
* A
IC
3.32
44
Boo
tstr
ap R
eplic
atio
ns
1000
1:
* -
10%
-, *
* -
5%-,
***
- 1
%-l
evel
of
sign
ific
ance
; 2: h
eter
osce
dast
icity
- an
d bi
as-c
orre
cted
sta
ndar
d er
rors
.

28
Table 5 Results – Model 3 excluding ‘number of products’
Model 3 Least Absolute Difference Quantile Regressions (LAD Quantile)
Dependent: difference in sales per employee (∆VAit,t-1)
(n = 110) Independents
(difference 2000 to 2005) coefficient1 t-value standard error
95% confidence interval2
foreign direct investment in the firm (∆FDIit,t-1)
0.61*** 7.46 [0.11; 0.20]
regional location of the firm: Århus (RÅit,t-1)
0.13* 1.67 [0.06; 0.13]
marketing stage of the firm: wholesale (MSwsit,t-1)
0.35*** 5.15 [0.08; 0.13]
marketing stage of the firm: retail (MSretit,t-1)
0.03 0.99 [0.08; 0.12]
sector of the firm: dairy (FSdit,t-1)
-0.04 -0.53 [0.07; 0.16]
sector of the firm: unspecified (FSun it,t-1)
0.04 0.57 [0.09; 0.16]
percentage of employees with university degree (∆emp it,t-1)
2.28e-03 0.76 [1.32e-03; 6.36e-03]
percentage of employees outside Denmark (∆emp2it,t-1)
-7.78e-03** -2.88 [1.14e-03; 7.53e-03]
dominant orientation of the firm: product (∆Opit,t-1)
2.27e-03 0.01 [-0.21; 0.22]
dominant orientation of the firm: market (∆Omit,t-1)
-0.08 0.15 [0.14; 0.20]
constant -2.27e-03 -0.05 [-0.03; 0.08]
Adj. McFadden’s R2 0.0375
McKelvey and Zavonia's R2 0.4854 Bootstrap Replications 1000
1: * - 10%-, ** - 5%-, *** - 1%-level of significance; 2: heteroscedasticity- and bias-corrected standard errors.