Embed Size (px)
Citation preview
Research Memorandum 17/2006 November 2006
DETERMINANTS OF FOREIGN DIRECT INVESTMENT IN EAST ASIA:
DID CHINA CROWD OUT FDI FROM HER DEVELOPING EAST ASIAN NEIGHBOURS?
Key points: • This paper applies a gravity model to investigate the determinants of foreign direct
investment (FDI) in East Asia. We find that economic fundamentals (such as market size, per capita income, and country risk indicators), economic and cultural ties, and information asymmetry are important determinants for FDI.
• Of the sub-components that measure country risks, we find that both the level and the
volatility of exchange rate matter in attracting FDI, as do some institutional quality indicators such as government stability and the degree of corruption in recipient countries.
• Globally, it appears that inward FDI among high-income OECD economies declined
substantially on average over the sample periods under investigation. Meanwhile, inward FDI of the high-income OECD economies in emerging market economies, particularly those in Latin America and Asia, gained substantially relative to their economic fundamentals.
• Our empirical results indicate that the ASEAN-4 (Indonesia, Malaysia, the Philippines, and Thailand) received above-average inward FDI from the high-income OECD economies, even over the period of the 1997-98 Asian financial crisis, after controlling for their economic fundamentals. By contrast, China’s FDI from the high-income OECD economies was below-average relative to its economic fundamentals. Thus, it is difficult to establish that China has crowded out FDI from her developing ASEAN neighbours.
• Both Hong Kong and Singapore have received more FDI on average from the European Union (EU), the US, and Japan. The FDI from these three economies in ASEAN-5 (Singapore plus ASEAN-4) was above the average over the sample periods studied. In contrast, only Japan invested more than the average in Greater China (Mainland China plus Hong Kong) in the 1990s. However, this was not the case for either the EU or the US.
Prepared by : Li-gang Liu, Kevin Chow and Unias Li Economic Research Division Research Department Hong Kong Monetary Authority

I. INTRODUCTION
Foreign direct investment (FDI) in East Asia has increased significantly since the early 1990s.1 It is estimated that FDI flows to the region rose by over 6 times from US$21 billion in 1990 to US$156 billion in 2005, notwithstanding some large falls during and after the 1997-98 Asian financial crisis. Mainland China, because of its large market, inexpensive but relatively skilled labour, and rapid economic growth, has emerged as the largest recipient of FDI flows in Asia, with inward FDI flows rising by 22 times from merely USD3.5 billion in 1990 to USD79.1 billion in 2005, accounting for more than half of the total inward FDI flows in Asia. However, China’s success has also raised serious concerns of her developing East Asian neighbours. They fear that China has crowded out FDI flows originally destined to their economies 2 Since FDI has traditionally played a significant role in helping to achieve high economic growth, the stakes are high for the growth prospect of these economies.
This paper investigates the claim that China diverts FDI from her
developing neighbours by using a well-established gravity model framework. We first identify the key determinants of inward FDI by employing a newly constructed database of bilateral FDI stocks among the high-income OECD economies, and between these economies and the rest of the world. We next assess quantitatively the impact of the China effect on her developing neighbours after controlling for their economic fundamentals, geographic distance and linkages, cultural ties, and country risks. We find little evidence of a crowding-out effect by China. In fact, the key ASEAN economies consistently received more FDI from the high-income OECD economies than China did. Although there are some signs that FDI from the EU-15 and the US in the ASEAN-4 declined in the 1990s, it cannot be established that the decline was caused by the China effect. With respect to Japanese FDI in the ASEAN-4 and China, we find that the ASEAN-4 consistently received much more than China compared with what their underlying economic conditions would warrant. Overall, it appears that China remained an under-achiever for FDI from the OECD economies.
1 We include both Northeast and Southeast Asia in East Asia, excluding Japan. Northeast Asia includes
Mainland China, Hong Kong, Taiwan, and South Korea. Southeast Asia includes key countries in the Association of Southeast Asian Nations (ASEAN) such as Indonesia, Malaysia, the Philippines, Singapore, Thailand, and other small and transition economies. We refer to the group of Indonesia, Malaysia, the Philippines, and Thailand as ASEAN-4. If including Singapore, it is called ASEAN-5. In addition, we use China and Mainland China interchangeably throughout the paper.
2 For example, former Deputy Prime Minister of Thailand, Supachai Panitchpakdi (2000) and fomer Prime Minister of Malaysia, Dr. Mahartir (2003) expressed concerns on the diversion effect from ASEAN to China. Former EU Trade Commissioner and the current Secretary General of WTO, Pascal Lamy (2003), also stated “[t]he current trend of [European] investment flowing into China diverts flows from ASEAN countries.”

2
The rest of the paper proceeds as follows. Section II provides an updated
analysis on the changing pattern of FDI flows to Asia. Section III reviews existing literature and discusses the estimation methodology. Section IV applies a gravity model to investigate key determinants of FDI and assesses whether China has indeed diverted FDI from the ASEAN economies. Section V summarises the findings and concludes. II. CHANGING PATTERNS OF INWARD FDI IN EAST ASIA
Global inward FDI flows reached US$648 billion in 2004, largely reflecting a strong rise in FDI flows to developing countries (Chart 1). Meanwhile, global inward FDI stock amounted to US$8.9 trillion in 2004. In the same year, the US remained the largest FDI recipient, followed by the UK and China. Similar to the pattern in international trade, global FDI flows mostly to developed countries, accounting for US$380 billion or 59% of global inward FDI flows in 2004.3 However, the share of global FDI flows to developing world has increased from 18% in 2000 to 36% in 2004 (Chart 2).4 Nearly half of those flows originated from three countries, in the order of the US, UK and surprisingly Luxembourg. With respect to the FDI recipient countries, developing Asia is the most favoured destination, followed by the Latin America. Within Asia, a significant portion goes to China, Hong Kong and Singapore, which together took up more than 80% of total inward FDI flows in the region. Chart 1: Global inward FDI flows by region
Chart 2: Share of global inward FDI flows by region
0
200
400
600
800
1,000
1,200
80 82 84 86 88 90 92 94 96 98 00 02 040
50
100
150
200
250
OECD (lhs)Asia: ex. Japan & Korea (rhs)Latin America (rhs)Africa (rhs)
USD bn USD bn
0
20
40
60
80
100
120
80 82 84 86 88 90 92 94 96 98 00 02 04-5
0
5
10
15
20
25
30
35OECD (lhs)Asia: ex. Japan & Korea (rhs)Latin America (rhs)Africa (rhs)
% share % share
Sources: IMF, CEIC and UNCTAD. Sources: IMF, CEIC and UNCTAD.
3 Developed countries mainly include OECD countries and EU-25 member countries. 4 Because of some statistical discrepancies, these two shares do not add up to 100 percent.
3
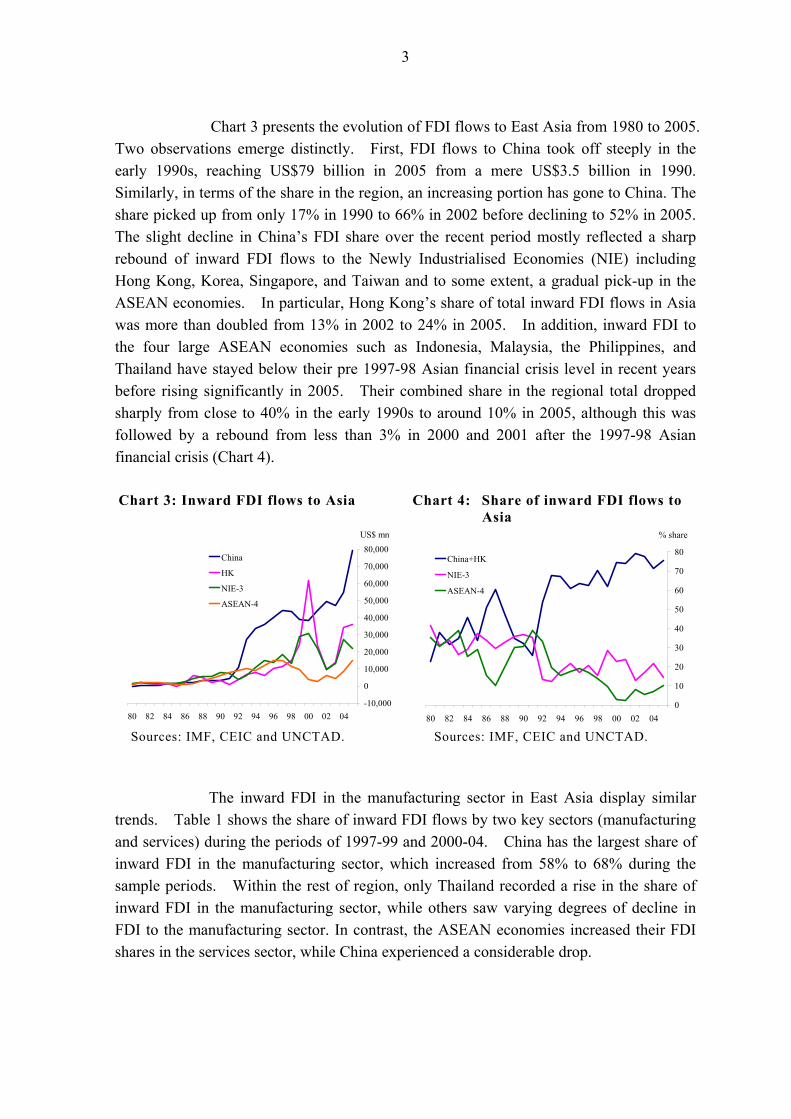
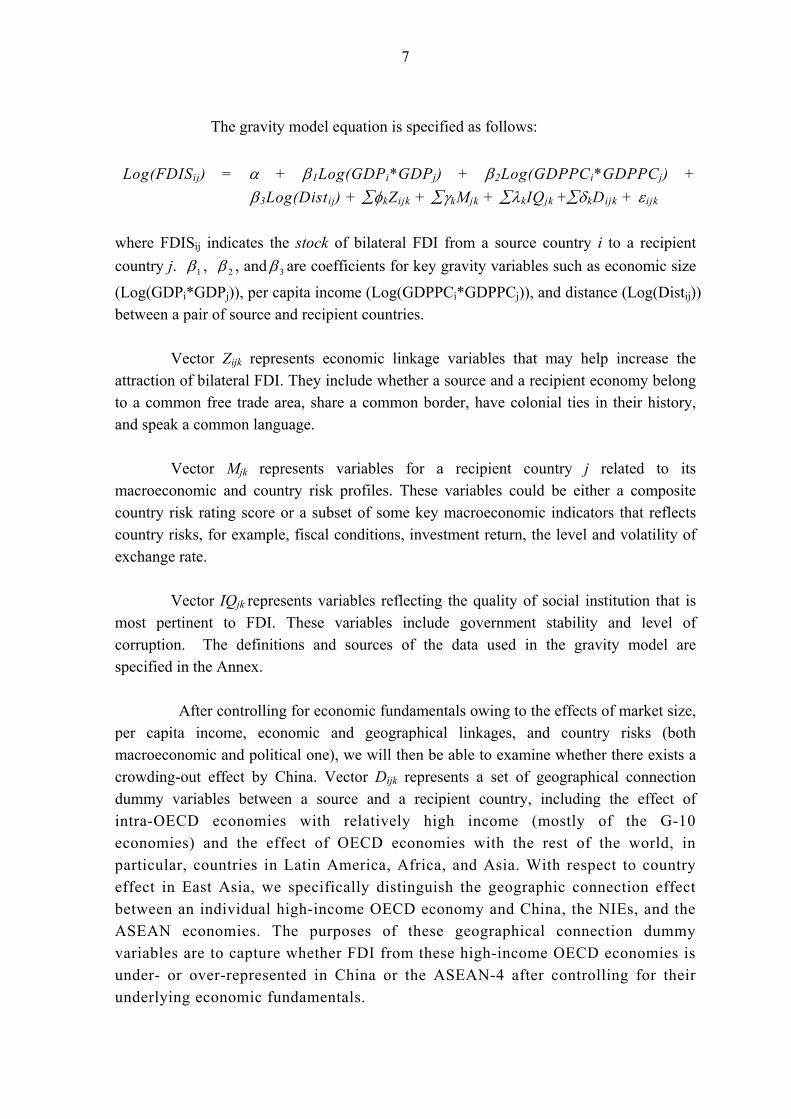
Chart 3 presents the evolution of FDI flows to East Asia from 1980 to 2005.
Two observations emerge distinctly. First, FDI flows to China took off steeply in the early 1990s, reaching US$79 billion in 2005 from a mere US$3.5 billion in 1990. Similarly, in terms of the share in the region, an increasing portion has gone to China. The share picked up from only 17% in 1990 to 66% in 2002 before declining to 52% in 2005. The slight decline in China’s FDI share over the recent period mostly reflected a sharp rebound of inward FDI flows to the Newly Industrialised Economies (NIE) including Hong Kong, Korea, Singapore, and Taiwan and to some extent, a gradual pick-up in the ASEAN economies. In particular, Hong Kong’s share of total inward FDI flows in Asia was more than doubled from 13% in 2002 to 24% in 2005. In addition, inward FDI to the four large ASEAN economies such as Indonesia, Malaysia, the Philippines, and Thailand have stayed below their pre 1997-98 Asian financial crisis level in recent years before rising significantly in 2005. Their combined share in the regional total dropped sharply from close to 40% in the early 1990s to around 10% in 2005, although this was followed by a rebound from less than 3% in 2000 and 2001 after the 1997-98 Asian financial crisis (Chart 4). Chart 3: Inward FDI flows to Asia Chart 4: Share of inward FDI flows to
Asia
-10,000
0
10,000
20,000
30,000
40,000
50,000
60,000
70,000
80,000
80 82 84 86 88 90 92 94 96 98 00 02 04
US$ mn
China
HK
NIE-3
ASEAN-4
0
10
20
30
40
50
60
70
80
80 82 84 86 88 90 92 94 96 98 00 02 04
% share
China+HK
NIE-3
ASEAN-4
Sources: IMF, CEIC and UNCTAD. Sources: IMF, CEIC and UNCTAD.
The inward FDI in the manufacturing sector in East Asia display similar
trends. Table 1 shows the share of inward FDI flows by two key sectors (manufacturing and services) during the periods of 1997-99 and 2000-04. China has the largest share of inward FDI in the manufacturing sector, which increased from 58% to 68% during the sample periods. Within the rest of region, only Thailand recorded a rise in the share of inward FDI in the manufacturing sector, while others saw varying degrees of decline in FDI to the manufacturing sector. In contrast, the ASEAN economies increased their FDI shares in the services sector, while China experienced a considerable drop.

4
Table 1: Share of inward FDI flows by sectors
Share of inward FDI (% share) 97-99 00-04 97-99 00-04 97-99 00-04 97-99 00-04 97-99 00-04 97-99 00-04 97-99 00-04
Manufacturing 58 68 70 43 43 30 n.a. n.a. 42 40 39 34 31 42 Chemical products 6 6 22 14 6 6 13 4 -- -- 4 3 3 5 Textile 4 4 4 4 1 1 2 2 -- -- 1 1 1 1 Electronics 6 13 26 9 15 11 29 46 -- -- 26 23 11 1 Machinery and transport equipment 3 3 6 5 8 8 5 8 -- -- 4 3 12 19
Other manufacturing goods 40 42 12 11 14 3 15 20 -- -- 3 5 3 16
Services 39 29 23 47 46 63 n.a. n.a. 56 59 53 58 57 55 Property & real estate 17 12 9 6 3 13 -- -- 1 1 1 3 4 11
Banking & finance 0 0 -- -- 9 21 -- -- 30 39 22 25 9 -11 Telecommunication & transportation 4 2 6 22 2 5 -- -- 9 1 2 1 -- --
Other services 19 15 8 18 31 24 -- -- 16 19 29 29 44 55
Taiwan ThailandKorea Malaysia PhilippinesChina Indonesia
Source: CEIC.
In addition, China’s per-capita FDI flows were on average about double those of the ASEAN-4 in 2004 and the numbers were more striking when compared to the coastal region of China (Chart 5). Even in China’s less prosperous inland regions, the per-capita FDI flows appeared to have caught up gradually.
Chart 5: Per capita inward FDI flows: China vs ASEAN-4
Chart 6: Per capita inward FDI stock: China vs ASEAN-4
0 20 40 60 80 100 120 140
1996-99
2000-03
2004
US$
ASEAN-4
China (coastal area)
China (average)
China (inland area)
0 100 200 300 400
1996-99
2000-03
2004
US$
ASEAN-4China
Source: CEIC and UNCTAD. Sources: CEIC, IMF and UNCTAD.

5
Although FDI flows per capita to China have increased considerably, China
was still far behind the ASEAN-4 with respect to per capita stock, which was US$189 for China and US$306 for the ASEAN-4 in 2004 (Chart 6). There is also an important difference in where the FDI flows originated. Most of China’s FDI flows were from Hong Kong, Taiwan, and increasingly from some offshore financial centres, notably the British Virgin Islands. For example, for the period 2000-03, FDI flows from high-income OECD economies only accounted for about one-third of China’s inward FDI flows, with Japan, the US and Germany taking the top three places (Chart 7). Of the FDI flows from Hong Kong and offshore financial centres, some empirical estimates suggest that about 30% to 50% of the flows to Mainland China were actually its own capital that was round-tripped to take advantage of favourable fiscal incentives and secure property rights enjoyed as foreign-funded firms (Xiao, 2004). In comparison, FDI flows to the ASEAN-4 are mostly from the high-income OECD economies and also from Singapore (Chart 8). Chart 7: Source of inward FDI flows to China (2000-03 average)
Chart 8: Source of inward FDI flows to ASEAN-4 economies (2000-03 average)
OECD31%
HK,SG,TW52%
ASEAN-42%
Others15%
OECD55%
HK,SG,TW33%
ASEAN-41%
Others11%
Source: UNCTAD. Source: UNCTAD. III. LITERATURE REVIEW AND METHODOLOGY Existing Literature
Earlier studies on the competition for FDI among the East Asian economies mainly focus on the impact of China’s accession to the World Trade Organization (WTO). Using a computable general equilibrium model to analyse the impact of WTO accession of China and Taiwan, Walmsley, Hertel and Ianchovichina (2001) estimate that China’s stock of FDI is expected to be 23% above the baseline by 2020, largely driven by the favourable trade effect after China’s WTO accession. As a result, FDI in the ASEAN economies and South Asia would be negatively affected. Chantasasawat, et al. (2004), applying a simultaneous two-equation system that incorporates underlying determinants

6
for FDI in Asia, find that the level of China’s FDI is negatively related to those of other East Asian economies, thus implying a FDI diversion effect by China. Though statistically significant, the China effect was not the most important determinant affecting the declining FDI flows to the rest of the region.
Adopting a similar framework, Mercereau (2005) shows that the previous diversion effect found in Chantasasawat, et al. (2004) could be mostly attributable to how the China effect is measured. This is because a logarithmic specification assumes that the crowding-out effect depends on the growth rate of FDI flows rather than the level, which potentially leads to distortion owing to a small base effect, especially in the early period of the sample in the case of China. As a result, the author introduced two alternative measures. The first one simply uses the share of China’s FDI flows as a regional total. The second one is less straightforward. It first estimates the quantity of diversion using a standard reduced form equation to determine FDI. Next, the estimated quantity is re-distributed according to the weight of an economy’s GDP size in the region. This weighted diversion effect is further tested to see whether China crowds out FDI from a country. In the end, the author finds that neither measure of the China effect appears to suggest that FDI flows to China have any direct impact on other countries in the region. This finding also applies to those low-income economies which compete with China directly for FDI in low-wage and labour intensive sectors. Methodology
In contrast to the methodology surveyed above, we apply a gravity model to investigate whether there is an FDI diversion effect on ASEAN economies by China. The gravity model has been proven to be a useful empirical tool to examine the determinants of trade, FDI, bank loans, or even equity flows.5
5 The gravity model states that two masses are proportionally attracted to each other but inversely attracted
to each other by distance. The theoretical underpinnings of the gravity model in economics and its applications were reviewed by Frankel (1997) and more recently Anderson and van Wincoop (2003). See Frankel (1997) for an application of the gravity model to explain the factors affecting the formation of trade blocs, Kawai and Urata (1998) on the relationship between trade and FDI using Japanese data at the industry level, Portes and Rey (2004) on the determinants of equity flows, Rose and Spiegel (2002) on the effect of a default on sovereign lending on bilateral trade, and Kawai and Liu (2004) on the determinants of international bank loans to developing economies.
7
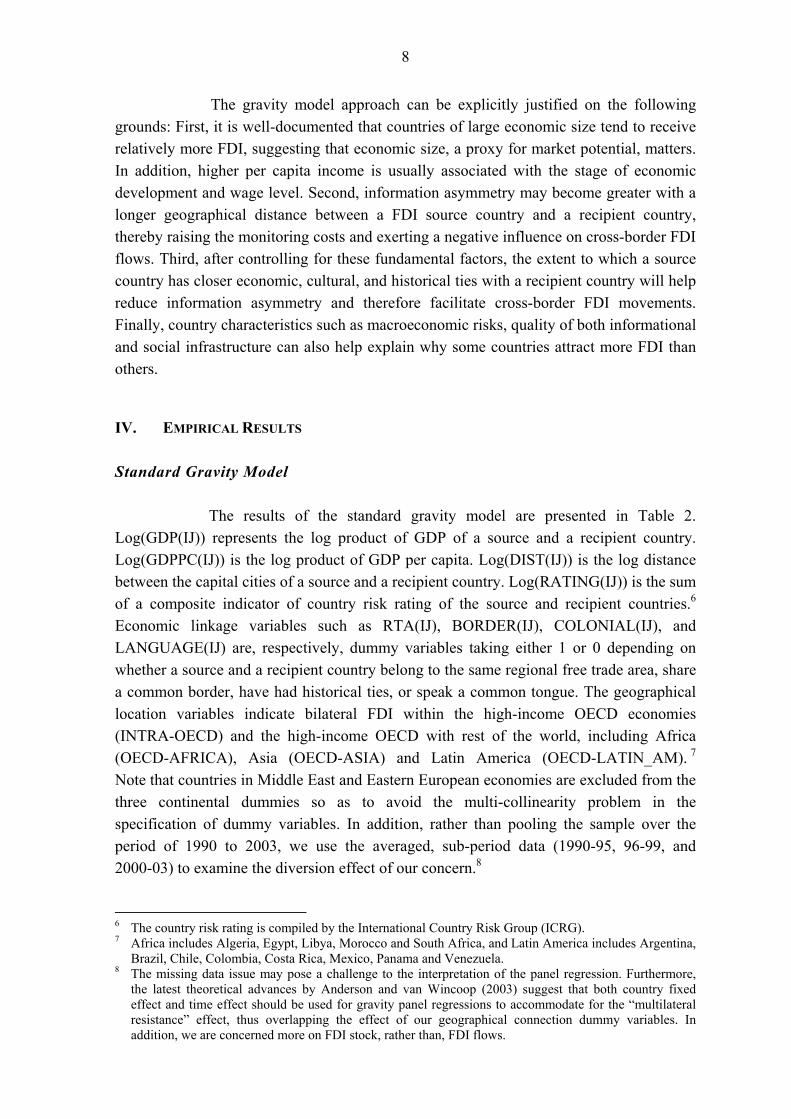
The gravity model equation is specified as follows: Log(FDISij) = α + β1Log(GDPi*GDPj) + β2Log(GDPPCi*GDPPCj) +
β3Log(Distij) + ∑φkZijk + ∑γkMjk + ∑λkIQjk +∑δkDijk + εijk
where FDISij indicates the stock of bilateral FDI from a source country i to a recipient country j. 1β , 2β , and 3β are coefficients for key gravity variables such as economic size
(Log(GDPi*GDPj)), per capita income (Log(GDPPCi*GDPPCj)), and distance (Log(Distij)) between a pair of source and recipient countries.
Vector Zijk represents economic linkage variables that may help increase the attraction of bilateral FDI. They include whether a source and a recipient economy belong to a common free trade area, share a common border, have colonial ties in their history, and speak a common language.
Vector Mjk represents variables for a recipient country j related to its macroeconomic and country risk profiles. These variables could be either a composite country risk rating score or a subset of some key macroeconomic indicators that reflects country risks, for example, fiscal conditions, investment return, the level and volatility of exchange rate.
Vector IQjk represents variables reflecting the quality of social institution that is most pertinent to FDI. These variables include government stability and level of corruption. The definitions and sources of the data used in the gravity model are specified in the Annex.
After controlling for economic fundamentals owing to the effects of market size, per capita income, economic and geographical linkages, and country risks (both macroeconomic and political one), we will then be able to examine whether there exists a crowding-out effect by China. Vector Dijk represents a set of geographical connection dummy variables between a source and a recipient country, including the effect of intra-OECD economies with relatively high income (mostly of the G-10 economies) and the effect of OECD economies with the rest of the world, in particular, countries in Latin America, Africa, and Asia. With respect to country effect in East Asia, we specifically distinguish the geographic connection effect between an individual high-income OECD economy and China, the NIEs, and the ASEAN economies. The purposes of these geographical connection dummy variables are to capture whether FDI from these high-income OECD economies is under- or over-represented in China or the ASEAN-4 after controlling for their underlying economic fundamentals.
8
The gravity model approach can be explicitly justified on the following grounds: First, it is well-documented that countries of large economic size tend to receive relatively more FDI, suggesting that economic size, a proxy for market potential, matters. In addition, higher per capita income is usually associated with the stage of economic development and wage level. Second, information asymmetry may become greater with a longer geographical distance between a FDI source country and a recipient country, thereby raising the monitoring costs and exerting a negative influence on cross-border FDI flows. Third, after controlling for these fundamental factors, the extent to which a source country has closer economic, cultural, and historical ties with a recipient country will help reduce information asymmetry and therefore facilitate cross-border FDI movements. Finally, country characteristics such as macroeconomic risks, quality of both informational and social infrastructure can also help explain why some countries attract more FDI than others. IV. EMPIRICAL RESULTS Standard Gravity Model
The results of the standard gravity model are presented in Table 2. Log(GDP(IJ)) represents the log product of GDP of a source and a recipient country. Log(GDPPC(IJ)) is the log product of GDP per capita. Log(DIST(IJ)) is the log distance between the capital cities of a source and a recipient country. Log(RATING(IJ)) is the sum of a composite indicator of country risk rating of the source and recipient countries.6 Economic linkage variables such as RTA(IJ), BORDER(IJ), COLONIAL(IJ), and LANGUAGE(IJ) are, respectively, dummy variables taking either 1 or 0 depending on whether a source and a recipient country belong to the same regional free trade area, share a common border, have had historical ties, or speak a common tongue. The geographical location variables indicate bilateral FDI within the high-income OECD economies (INTRA-OECD) and the high-income OECD with rest of the world, including Africa (OECD-AFRICA), Asia (OECD-ASIA) and Latin America (OECD-LATIN_AM). 7 Note that countries in Middle East and Eastern European economies are excluded from the three continental dummies so as to avoid the multi-collinearity problem in the specification of dummy variables. In addition, rather than pooling the sample over the period of 1990 to 2003, we use the averaged, sub-period data (1990-95, 96-99, and 2000-03) to examine the diversion effect of our concern.8
6 The country risk rating is compiled by the International Country Risk Group (ICRG). 7 Africa includes Algeria, Egypt, Libya, Morocco and South Africa, and Latin America includes Argentina,
Brazil, Chile, Colombia, Costa Rica, Mexico, Panama and Venezuela. 8 The missing data issue may pose a challenge to the interpretation of the panel regression. Furthermore,
the latest theoretical advances by Anderson and van Wincoop (2003) suggest that both country fixed effect and time effect should be used for gravity panel regressions to accommodate for the “multilateral resistance” effect, thus overlapping the effect of our geographical connection dummy variables. In addition, we are concerned more on FDI stock, rather than, FDI flows.
9
Gravity Variables: The coefficient of the log of the product of GDP
between FDI source and recipient countries always comes out as positive and highly significant statistically. Depending on the sub period under consideration, the coefficients are in the range between 0.96 and 1.10. The result indicates that the stock of bilateral FDI generally increases with the size of bilateral economies. Similarly, the estimated coefficient on GDP per capita is also positive and highly significant, supporting the notion that richer countries tend to receive more FDI. The coefficient becomes even larger during the 1996-99 and 2000-03 periods, suggesting the income level has become a more important element in FDI decisions while holding other variables constant. This could also reflect the large exchange rate depreciation in emerging market economies over the period because valuation changes of GDP, which is measured at current exchange rates.9
The distance variable is negative and statistically significant, indicating the farther away the two countries are from each other, the less FDI there will tend to be. This is because distance is a good proxy for information asymmetry and costs of transportation. This result is consistent with those found concerning other types of financial capital.10
Linkage Variables and Country Risk Rating: Although the regional free trade and common border dummy variables do not appear to be important to bilateral FDI, variables such as colonial ties and common language do show up statistically significant and also have the right sign, implying language and cultural ties help promote FDI. The country risk rating is highly significant and positive, suggesting the importance of macroeconomic fundamentals and social institutional quality in determining FDI.11
Geographical Location Variables—Global Trend: The INTRA-OECD geographical location dummy variable has a negative sign and is highly significant over all sub-sample period in the 1990s and the early 2000s. In addition, the absolute size of the coefficient is getting larger over the sub-sample periods, indicating that the intra-OECD FDI declined at a faster pace over time. This possibly reflects that increased competition because of globalization has lead multinational corporations in high-income OECD economies to explore new markets by expanding their operations and investment in fast-growing emerging markets. In addition, increased trade with developing world could also help explain this effect because of the positive trade and FDI nexus. As a result, this naturally reduces INTRA-OECD FDI.
9 The alternative would be to use PPP-based GDP. But PPP data are also subject to inconsistency and
measurement errors, as indicated by Srinivasan (1995). 10 Please see Portes and Rey (1999) for equity flows and Kawai and Liu (2004) for bank loans. 11 The higher the rating, the lower the overall risk of the country.

10
By contrast, the coefficients of the geographical connection variables
between the high-income OECD countries and the developing world have mostly been positive and statistically significant over the sub-sample periods, only with some exceptions for Africa over the sub-sample periods of 1996-99 and 2000-03 and Asia for the period of 2000-03. The coefficients associated with the Latin America dummy variable for all sub-periods are always positive and significant, although the size of these coefficients declines over time. Similar findings also apply to the Asia regional dummy variable, except for the latest sub-period where the coefficient is not statistically significant. This finding suggesting that the Latin American and to some extent, the Asian economies receive relatively more FDI from OECD economies after adjusting for their economic fundamentals.
Table 2: The Standard Gravity Model
Dependent variable: Bilateral FDI stock Independent variable 1990-95 1996-99 2000-03
Log(GDP(IJ)) 0.96 (25.4)***
1.07 (34.1)***
1.10 (29.3)***
Log(GDPPC(IJ)) 0.58 (7.7)***
0.63 (7.3)***
0.60 (5.7)***
Log(DIST(IJ)) -0.76 (-6.4)***
-0.71 (-6.7)***
-0.74 (-7.4)***
RTA(IJ) -0.16 (-0.6)
0.16 (0.8)
0.04 (0.2)
BORDER(IJ) 0.20 (0.8)
0.27 (1.0)
0.23 (0.8)
COLONIAL(IJ) 0.91 (1.5)
1.45 (4.2)***
1.46 (3.5)***
LANGUAGE(IJ) 0.79 (5.0)***
0.95 (6.8)***
1.22 (8.7)***
Log(RATING(IJ)) 2.70 (4.6)***
3.08 (4.6)***
4.42 (5.8)***
INTRA-OECD -0.47 (-2.1)**
-1.52 (-6.8)***
-2.14 (-9.2)***
OECD-LATIN_AM 1.37 (5.1)***
0.77 (3.0)***
0.65 (2.5)**
OECD-AFRICA 0.91 (2.7)***
0.40 (1.5)
0.34 (1.2)
OECD-ASIA 1.66 (7.2)***
0.72 (3.0)***
0.35 (1.5)
Adjusted R2 0.62 0.65 0.63 No. of observations 731 831 893
***, ** and * denote significance at 1%, 5% and 10% respectively. Figures in brackets are estimated standard errors corrected for heteroscedasticity.
11
Geographical Connection Variables—FDI Diversion in East Asia:
Geographical connection dummy variables are constructed by linking the FDI source countries with the recipient countries. For example, OECD-ASEAN-4 is a dummy variable that takes on value 1 if a high-income OECD country has FDI in an ASEAN-4 country and value 0 with a non-ASEAN-4 country. A positive (negative) coefficient implies that the country or region receives more (less) inward FDI than the average after controlling for economic fundamentals, geographical and cultural ties, and other economic linkage variables.
Table 3 summarises the result of geographical connection variables between OECD and the key groupings of the East Asian economies. For the period between 1990 and 95, all coefficients of the geographical connection variables between the high-income OECD and East Asian economies with the exception of China have a positive sign and are statistically significant. This suggests that after controlling for market size, income, information asymmetry, economic linkage, and country risks, The FDI from the high-income OECD economies in Singapore, Hong Kong, and the ASEAN-4 is overweight, relative to that in China. For the sub-period of 1996-99, the coefficient for the dummy variable of OECD-ASEAN-4 remains positive and statistically significant despite the effect of the 1997-98 Asian financial crisis. While the effect for Hong Kong and Singapore is no longer significant, the China country effect has turned out to be statistically significant with a positive sign. The fact that China was relatively unaffected by the financial crisis may explain this effect. For the sub-period of 2000-03, both the geographical connection effect for Singapore and Hong Kong turned negative; the Hong Kong effect is even more statistically significant. While the China effect is no longer significant, the country effect for the ASEAN-4 continues to be statistically significant and with a positive sign. The size of the coefficient also becomes larger than those of the previous periods.

12
Table 3: The Standard Gravity Model with Geographical Connection Variables
Dependent variable: Bilateral FDI stock Independent variable 1990-95 1996-99 2000-03 Log(GDP(IJ)) 0.99 0.98 1.06 1.08 1.09 1.13 (23.6)*** (24.5)*** (32.5)*** (33.8)*** (27.0)*** (29.8)*** Log(GDPPC(IJ)) 0.45 0.51 0.78 0.66 0.81 0.63 (4.2)*** (7.0)*** (8.0)*** (8.1)*** (6.5)*** (6.3)*** Log(DIST(IJ)) -0.66 -0.65 -0.65 -0.66 -0.66 -0.68 (-6.1)*** (-6.0)*** (-6.4)*** (-6.5)*** (-7.6)*** (-7.9)*** RTA(IJ) -0.25 -0.22 0.18 0.20 0.14 0.15 (-1.0) (-0.9) (0.9) (1.0) (0.8) (0.8) BORDER(IJ) 0.30 0.29 0.32 0.32 0.30 0.29 (1.1) (1.1) (1.3) (1.2) (1.1) (1.0) COLONIAL(IJ) 0.94 0.99 1.59 1.45 1.61 1.44 (1.6) (1.7)* (5.0)*** (4.2)*** (3.9)*** (3.2)*** LANGUAGE(IJ) 0.84 0.86 0.92 0.92 1.16 1.15 (5.3)*** (5.5)*** (6.8)*** (6.9)*** (8.5)*** (8.5)*** Log(RATING(IJ)) 3.44 3.24 2.79 2.68 4.02 4.11 (5.6)*** (5.6)*** (4.1)*** (4.0)*** (5.3)*** (5.6)*** INTRA-OECD(IJ) -1.01 -1.08 -1.95 -1.73 -2.59 -2.31 (-4.3)*** (-5.1)*** (-8.9)*** (-8.8)*** (-11.0)*** (-10.8)***OECD- Singapore 1.24 0.09 -0.53 (3.2)*** (0.2) (-1.2) OECD-ASEAN-4 1.31 1.30 1.39 (5.8)*** (6.0)*** (6.2)*** OECD-Hong Kong 1.05 -0.56 -1.38 (2.7)*** (-1.3) (-3.1)*** OECD-Mainland 0.10 1.13 0.39 (0.3) (4.0)*** (1.1) OECD-[SGP+ASEAN-4] 1.30
(6.4)*** 1.04
(5.0)*** 0.95
(4.4)*** OECD-[HK+ Mainland] 0.57
(2.5)** 0.38
(1.5) -0.45
(-1.6) Adjusted R2 0.61 0.61 0.66 0.65 0.64 0.63 No. of observations 731 731 831 831 893 893
***, ** and * denote significance at 1%, 5% and 10% respectively. Figures in brackets are estimated standard errors corrected for heteroscedasticity.

13
These findings suggest that the OECD FDI in the ASEAN-4 has been
consistently above the average after controlling for the economic fundamentals and geographical and cultural ties. However, the China effect only became statistically significant during the period of 1996-99, when the region was engulfed by the 1997-98 financial crisis. The effect of Singapore and Hong Kong is less certain, depending on the sub-sample period investigated.
Given the role of Hong Kong and Singapore as entrepots and financial centres for Mainland China and the ASEAN-4, respectively, it will not be surprising that some of the FDI from the OECD economies to China and the ASEAN-4 is conducted through Hong Kong and Singapore. Thus, it may be useful to aggregate the geographical connection effect by combining Hong Kong with Mainland China and Singapore with the ASEAN-4 so as to account for this effect. After aggregation, our finding appears to confirm that both regions are overweight in terms of OECD FDI for periods of 1990-95 and 1996-99. In addition, the coefficients of the OECD to the ASEAN-5 are much larger than those of OECD FDI to Greater China (including Hong Kong), suggesting even bigger exposure of OECD FDI in these five ASEAN economies. However, for the period 2000-03, the combined Hong Kong and China effect is no longer statistically significant, while the combined Singapore and ASEAN-4 effect continues to remain positive and significant. The Augmented Gravity Model
The results obtained in Table 4 build upon those of Table 3 by replacing the composite country risk ratings with a number of key macroeconomic and institutional quality indicators that are most pertinent to decisions of FDI. Other than the gravity variables and the economic linkage variables, the augmented gravity model includes macroeconomic indicators such as the averaged percentage change of the bilateral exchange rate Log(EXCHG(IJ)) between the recipient and source country currencies, the volatility of bilateral exchange rate Log(EXVOL(IJ)), the real GDP growth differential between a source and a borrowing country RGDPGD(IJ), and fiscal balance FISBAL(J) of the recipient country. In addition, a set of institutional quality indicators such as government stability index Log(GOVSTBL(IJ)) and the level of corruption Log(CORRUPT(IJ)) are included in the regression. Because there are negative numbers in EXCHG(IJ), RGDPGD(IJ) and FISBAL(J), we do not take logs for these variables.

14
Table 4: The Augmented Gravity Model
Dependent variable: Bilateral FDI stock Independent variable 1990-95 1996-99 2000-03 Log(GDP(IJ)) 1.04 1.01 1.14 1.15 1.09 1.12 (22.8)*** (23.5)*** (30.6)*** (30.7)*** (21.5)*** (22.1)*** Log(GDPPC(IJ)) 0.40 0.55 0.80 0.68 0.68 0.55 (3.3)*** (6.1)*** (8.8)*** (8.4)*** (5.7)*** (5.2)*** Log(DIST(IJ)) -0.64 -0.64 -0.70 -0.71 -0.73 -0.74 (-5.4)*** (-5.5)*** (-6.6)*** (-6.7)*** (-7.8)*** (-8.0)*** RTA(IJ) -0.05 -0.08 0.14 0.13 0.12 0.10 (-0.2) (-0.3) (0.6) (0.6) (0.6) (0.5) BORDER(IJ) 0.14 0.12 0.36 0.37 0.47 0.46 (0.5) (0.4) (1.4) (1.5) (1.7)* (1.7)* COLONIAL(IJ) 0.81 0.94 1.37 1.23 0.95 0.80 (1.3) (1.5) (3.4)*** (3.0)*** (3.4)*** (2.4)** LANGUAGE(IJ) 0.69 0.73 0.92 0.94 0.94 0.98 (4.4)*** (4.6)*** (6.8)*** (6.9)*** (6.4)*** (6.6)*** Log(EXCHG(IJ)) 0.13 0.12 0.96 0.93 0.53 0.43 (3.6)*** (3.4)*** (3.1)*** (3.0)*** (0.8) (0.6) Log(EXVOL(IJ)) -0.28
(-2.5)** -0.28 (-2.4)**
0.02 (0.3)
0.03 (0.4)
-0.02 (-3.0)***
-0.02 (-3.0)***
RGDPGD(IJ) -0.08 (-3.4)***
-0.07 (-2.9)***
-0.07 (-2.3)**
-0.08 (-2.7)***
-0.11 (-3.0)***
-0.12 (-3.5)***
FISBAL(J) -0.02 -0.01 0.11 0.07 0.06 0.04 (-0.5) (-0.5) (3.4)*** (2.3)** (2.6)*** (1.8)* Log(GOVSTBL(IJ)) 1.04 0.82 1.69 1.80 2.99 2.83 (2.9)*** (2.4)** (1.9)* (2.1)** (4.0)*** (3.8)*** Log(CORRUPT(IJ)) 0.97 0.80 0.92 0.91 1.24 1.22 (2.5)** (2.1)** (3.7)*** (3.6)*** (5.0)*** (4.9)*** INTRA-OECD -0.92 -1.11 -2.14 -1.86 -2.57 -2.27 (-3.0)*** (-4.0)*** (-9.9)*** (-9.4)*** (-10.4)*** (-10.2)***OECD-Singapore 1.12 -0.92 -1.10 (2.1)** (-1.8)* (-2.3)** OECD-ASEAN-4 1.00 0.98 1.09 (3.5)*** (4.1)*** (4.3)*** OECD-Hong Kong 1.02 -0.77 -1.35 (2.1)** (-1.8)* (-3.0)*** OECD-Mainland -0.91 0.70 -0.32 (-1.9)* (2.0)** (-0.8) OECD-[SGP+ASEAN-4] 1.06 0.69 0.61 (3.8)*** (2.9)*** (2.4)** OECD-[HK+Mainland] 0.11 0.14 -0.85 (0.3) (0.5) (-2.7)*** Adjusted R2 0.63 0.62 0.67 0.67 0.67 0.66 No. of observations 697 697 807 807 848 848
***, ** and * denote significance at 1%, 5% and 10% respectively. Figures in brackets are estimated standard errors corrected for heteroscedasticity.
15
Macroeconomic Indicators: The results show that most of the gravity and economic linkage variables are unaffected by the introduction of these new explanatory variables. Measured by the averaged percentage change of the recipient country currency per unit of the source country currency, the variable implies the higher the number, the cheaper the currency from the source country perspective. The coefficients of this variable for the three sub-periods are positive and statistically significant, suggesting a weaker domestic currency will attract more inward FDI because it reduces the funding costs in source country. However, this does not mean a sharp depreciation of home currency will necessarily attract more inward FDI if this also leads to higher exchange rate volatility. Our estimates indicate that exchange rate volatility in general has strong negative effects on FDI, except for the sub-period of 1996-99 in which period it has a positive sign though not statistically significant. Indeed, our results broadly confirm the result found in Kiyota and Urata (2004) where they found the Japanese FDI to the rest of the world is positively related to the exchange rate level but negatively related to the volatility of the exchange rate in recipient countries.
The real GDP growth differential between a source and a recipient country (RGDPD(IJ)) has negative and statistically significant coefficients for all three sub-periods, suggesting that higher economic growth (a proxy of return on capital) in a recipient than a host country tends to attract FDI. Fiscal balance FISBAL(J), measured as fiscal surplus (or deficit) as a share of GDP, has a negative sign for the sub-period of 1990-95 but a positive and significant sign for the later sub-periods. Because fiscal discipline contributes to price stability, which in turn will be conducive to macroeconomic stability and sustained economic growth, sound fiscal conditions in a host country appear to help attract FDI in a recipient country.
Institutional Quality Variables: Indexes for government stability and corruption in a recipient country, Log(GOVSTBL(J)) and Log(CORRUPT(J)), respectively are measures of the degree of political stability and the quality of the rule of law in a recipient country. Both indicators are measured as the lower the score, the higher degree of government instability or corruption. Thus, the positive and statistically significant coefficients for most of the sub-sample periods indicate that political instability and corruption in a host country tend to increase risks of FDI, thus negatively affecting the exposure of FDI from a source country. This finding is also consistent with that of Wei (1999), who showed that corruption and bureaucracy would significantly and negatively affect a host country’s ability to attract FDI.
Geographical Connection Variables: The augmented gravity model also confirms that the ASEAN-4 have been consistently over represented in OECD FDI in East Asia, while in the late 1990s and the early 2000s, Hong Kong and Singapore are under represented. Compared with the findings in the standard gravity model, China is mostly under represented on average by the OECD FDI, particularly in the early sub-sample period of 1990-95.
16
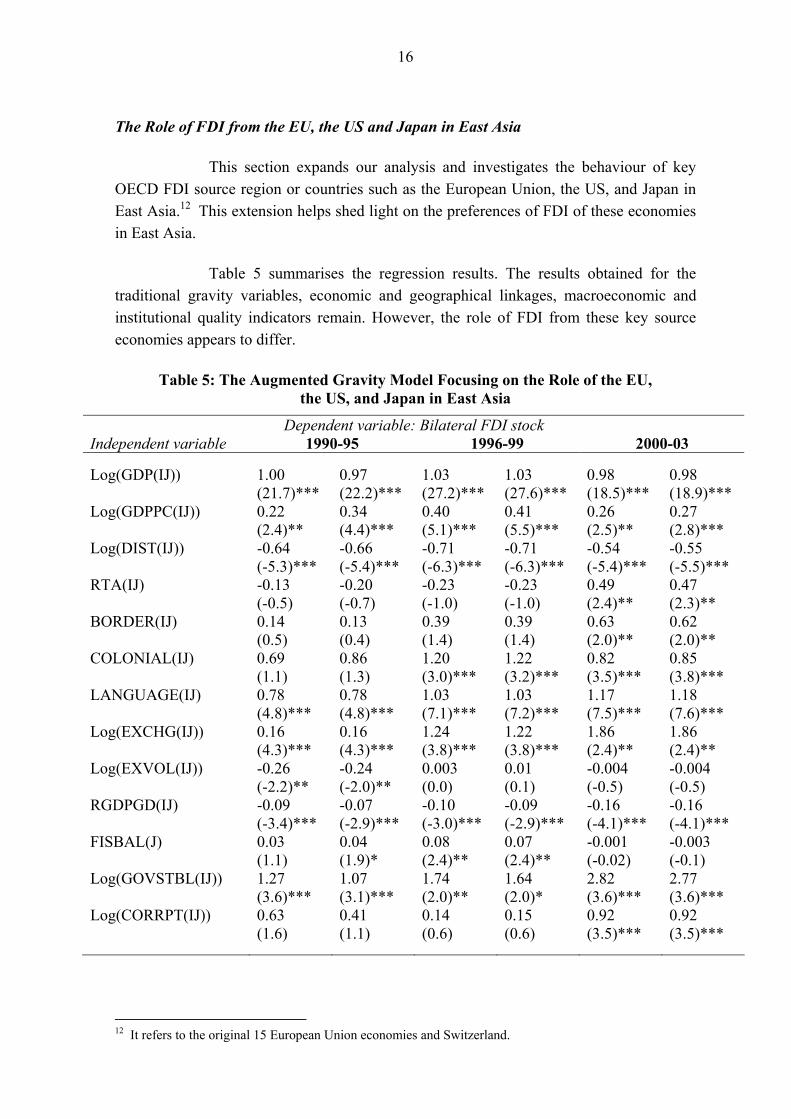
The Role of FDI from the EU, the US and Japan in East Asia
This section expands our analysis and investigates the behaviour of key OECD FDI source region or countries such as the European Union, the US, and Japan in East Asia.12 This extension helps shed light on the preferences of FDI of these economies in East Asia.
Table 5 summarises the regression results. The results obtained for the traditional gravity variables, economic and geographical linkages, macroeconomic and institutional quality indicators remain. However, the role of FDI from these key source economies appears to differ.
Table 5: The Augmented Gravity Model Focusing on the Role of the EU, the US, and Japan in East Asia
Dependent variable: Bilateral FDI stock Independent variable 1990-95 1996-99 2000-03 Log(GDP(IJ)) 1.00 0.97 1.03 1.03 0.98 0.98 (21.7)*** (22.2)*** (27.2)*** (27.6)*** (18.5)*** (18.9)*** Log(GDPPC(IJ)) 0.22 0.34 0.40 0.41 0.26 0.27 (2.4)** (4.4)*** (5.1)*** (5.5)*** (2.5)** (2.8)*** Log(DIST(IJ)) -0.64 -0.66 -0.71 -0.71 -0.54 -0.55 (-5.3)*** (-5.4)*** (-6.3)*** (-6.3)*** (-5.4)*** (-5.5)*** RTA(IJ) -0.13 -0.20 -0.23 -0.23 0.49 0.47 (-0.5) (-0.7) (-1.0) (-1.0) (2.4)** (2.3)** BORDER(IJ) 0.14 0.13 0.39 0.39 0.63 0.62 (0.5) (0.4) (1.4) (1.4) (2.0)** (2.0)** COLONIAL(IJ) 0.69 0.86 1.20 1.22 0.82 0.85 (1.1) (1.3) (3.0)*** (3.2)*** (3.5)*** (3.8)*** LANGUAGE(IJ) 0.78 0.78 1.03 1.03 1.17 1.18 (4.8)*** (4.8)*** (7.1)*** (7.2)*** (7.5)*** (7.6)*** Log(EXCHG(IJ)) 0.16 0.16 1.24 1.22 1.86 1.86 (4.3)*** (4.3)*** (3.8)*** (3.8)*** (2.4)** (2.4)** Log(EXVOL(IJ)) -0.26 -0.24 0.003 0.01 -0.004 -0.004 (-2.2)** (-2.0)** (0.0) (0.1) (-0.5) (-0.5) RGDPGD(IJ) -0.09 -0.07 -0.10 -0.09 -0.16 -0.16 (-3.4)*** (-2.9)*** (-3.0)*** (-2.9)*** (-4.1)*** (-4.1)*** FISBAL(J) 0.03 0.04 0.08 0.07 -0.001 -0.003 (1.1) (1.9)* (2.4)** (2.4)** (-0.02) (-0.1) Log(GOVSTBL(IJ)) 1.27 1.07 1.74 1.64 2.82 2.77 (3.6)*** (3.1)*** (2.0)** (2.0)* (3.6)*** (3.6)*** Log(CORRPT(IJ)) 0.63 0.41 0.14 0.15 0.92 0.92 (1.6) (1.1) (0.6) (0.6) (3.5)*** (3.5)***
12 It refers to the original 15 European Union economies and Switzerland.
17
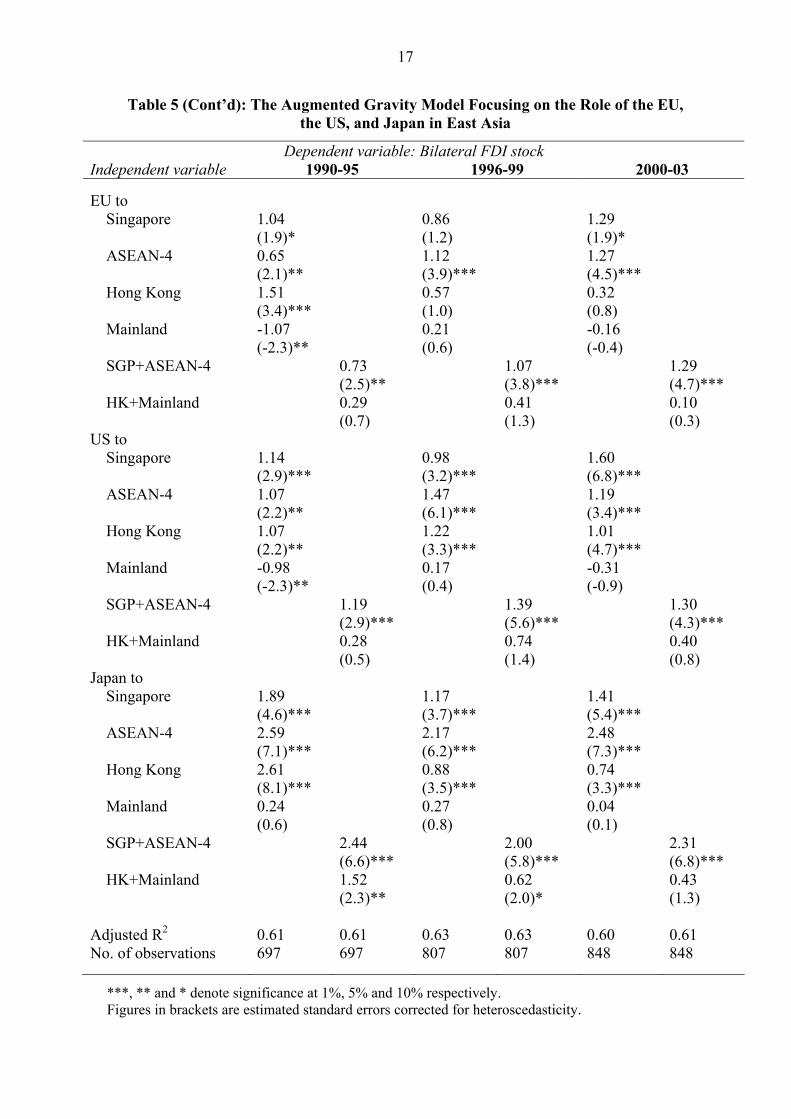
Table 5 (Cont’d): The Augmented Gravity Model Focusing on the Role of the EU, the US, and Japan in East Asia
Dependent variable: Bilateral FDI stock Independent variable 1990-95 1996-99 2000-03 EU to Singapore 1.04 0.86 1.29 (1.9)* (1.2) (1.9)* ASEAN-4 0.65 1.12 1.27 (2.1)** (3.9)*** (4.5)*** Hong Kong 1.51 0.57 0.32 (3.4)*** (1.0) (0.8) Mainland -1.07 0.21 -0.16 (-2.3)** (0.6) (-0.4)
SGP+ASEAN-4 0.73 1.07 1.29 (2.5)** (3.8)*** (4.7)***
HK+Mainland 0.29 0.41 0.10 (0.7) (1.3) (0.3) US to Singapore 1.14 0.98 1.60 (2.9)*** (3.2)*** (6.8)*** ASEAN-4 1.07 1.47 1.19 (2.2)** (6.1)*** (3.4)*** Hong Kong 1.07 1.22 1.01 (2.2)** (3.3)*** (4.7)*** Mainland -0.98 0.17 -0.31 (-2.3)** (0.4) (-0.9) SGP+ASEAN-4 1.19 1.39 1.30 (2.9)*** (5.6)*** (4.3)***
HK+Mainland 0.28 0.74 0.40 (0.5) (1.4) (0.8) Japan to Singapore 1.89 1.17 1.41 (4.6)*** (3.7)*** (5.4)*** ASEAN-4 2.59 2.17 2.48 (7.1)*** (6.2)*** (7.3)*** Hong Kong 2.61 0.88 0.74 (8.1)*** (3.5)*** (3.3)*** Mainland 0.24 0.27 0.04 (0.6) (0.8) (0.1)
SGP+ASEAN-4 2.44 2.00 2.31 (6.6)*** (5.8)*** (6.8)***
HK+Mainland 1.52 0.62 0.43 (2.3)** (2.0)* (1.3) Adjusted R2 0.61 0.61 0.63 0.63 0.60 0.61 No. of observations 697 697 807 807 848 848
***, ** and * denote significance at 1%, 5% and 10% respectively. Figures in brackets are estimated standard errors corrected for heteroscedasticity.
18
The EU and East Asia: The 15 EU economies were significant investors in
the ASEAN-4 over all the three sub-periods. The coefficient for the period of 2000-03 was almost doubled compared with that in the earlier period of 1990-95, revealing that the region is gaining FDI from the EU region relative to their economic fundamentals. Indeed, this finding disputes the statement by Lamy (2003) that the EU investment to China was at the expense of the ASEAN economies. Similarly, the EU FDI in Singapore was also increasing in most of the sub-periods examined, especially in the latest sub-period.
The coefficients of the EU-Mainland connection dummy variables indicate
that the EU investment in China did not appear to be over weight in the second half of 1990s and the early 2000s. Indeed, the EU under-weighted their FDI in China in the early 1990s. FDI from the EU in HK was overweight for the first half of the 1990s. However, this is no longer so in the second half of the 1990s and the early 2000s.
When looking at the combined effect, the EU investment in the ASEAN-5
(SGP+ASEAN4) is always overweight relative to their underlying economic fundamentals. In contrast, Greater China (HK+Mainland) did not appear to receive above-average FDI from the EU region in the three sub-sample periods.
The US and East Asia: The FDI from the US was always overweight in the ASEAN-4, Hong Kong, and Singapore relative to their fundamentals for all three sub-periods. However, it was never so for the Mainland. When examining the combined effect, we observe that the US investment in the ASEAN-5 is also overweight for all the sub periods investigated, but was never so for Greater China.
Japan and East Asia: Given their closer economic linkages and geographical proximity, it is not surprising that the Japanese FDI in East Asia, and particularly in the ASEAN economies is mostly above the average. However, with respect to China, the coefficients of the Japan-Mainland dummy are positive in all sub-sample periods, but are never statistically significant, suggesting that the Japanese FDI was never over weight in China in spite of their geographical proximity and other economic and cultural linkages. After adjusting for the Hong Kong and Singapore effect, the Japanese FDI in ASEAN-5 always has a positive and significant sign, while its FDI in Greater China (HK+Mainland) has a positive and significant coefficient in the 1990s, but it was no longer statistically significant for the early 2000s.
19
V. CONCLUDING REMARKS
This paper applies a gravity model framework to investigate the determinants of foreign direct investment among the OECD economies and between the OECD and the emerging market economies. We find that intra-OECD inward FDI declined substantially over the sub-sample periods studied. Meanwhile, OECD FDI in emerging market economies, particularly in those in Latin America and Asia, continued to gain prominence relative to their economic fundamentals. This reflects their increased market size and economic potentials, cost advantages, and improved macroeconomic fundamentals. In addition, we also find that both the level and volatility of exchange rate are important determinants to FDI, in addition to government stability and the degree of corruption of a recipient country.
On the claim that Mainland China has diverted FDI from its developing neighbours in East Asia, we find that there is hardly any empirical basis to support such a claim. In fact, the ASEAN economies have consistently received above-average inward FDI from the key OECD economies, even during the 1997-98 Asian financial crisis when these economies were under considerable stress. By contrast, the Mainland economy appears to have received below-average FDI from OECD economies in most of the sub-periods examined. It is thus difficult to establish the case that Mainland China is gaining FDI from the high-income OECD countries at the expense of the ASEAN economies.
Both Hong Kong and Singapore have also received above-average FDI
from key OECD economies such as the EU, the US, and Japan, partly reflecting their important financial intermediary role in channelling FDI to China and the ASEAN economies, respectively. After adjusting for the Hong Kong and Singapore effect, we found that the ASEAN-5 (including Singapore) receive more FDI than the model predicted from the EU, the US and Japan. The Japanese investors over-weighted their FDI in Greater China during the 1990s; but were no longer doing so in the early 2000s. When examining the FDI behaviour of the EU, the US, and Japan in East Asia, we find that these key OECD investors were always overweight in the ASEAN economies. However, over the sub-periods examined, there is little evidence to suggest that China received above-average FDI from these economies compared with what their economic fundamentals would warrant.
Although our results suggest China did not crowd out inward FDI from her
neighbours in general, it is not clear whether some sectors in the ASEAN economies may have suffered. Indeed, this is an important area to explore. In addition, owing to the lack of data to examine the effect of intra-East Asian FDI, we have largely ignored the issue of intra-East Asian inward FDI. This may become important as China is accelerating its capital account liberalisation and encouraging outward FDI. These issues remain as interesting topics to be explored in the future.

20
Annex: Data Definitions and Sources Variables Description Sources
Bilateral FDI stock
Outward FDI position from OECD countries to recipient countries (US$mn).
International Direct Investment, OECD Database.
GDP(IJ) Cross product of gross domestic product between the source country and recipient country (in current US$).
World development indicators (The World Bank) and the statistical yearbook of the Republic of Taiwan.
GDP per capita (IJ)
Cross product of GDP per capita between the source country and recipient country (in current US$).
World development indicators (The World Bank) and the statistical yearbook of the Republic of Taiwan.
Distance The geographical distance between the capital city of the source and recipient countries. In kilometres (km).
Jon Haveman’s international trade data.
Regional trade agreement
A dummy variable equal to 1 if there is free trade agreement between the source and recipient countries.
World Trade Organization database on regional trade agreements. (www.wto.org/english/tratop_e/region_e/region_e.htm)
Border A dummy variable equal to 1 if the source and recipient countries have common border.
Hammond Atlas of the World, 1994 and CIA, The World Fact Book.(http://www.cia.gov/cia/publications/factbook/)
Colony A dummy variable equal to 1 if the source and recipient countries have colonial relationship in the past.
CIA, The World Fact Book. (http://www.cia.gov/cia/publications/factbook/)
Language dummy
A dummy variable equal to 1 if the source and recipient countries share a common language.
CIA, The World Fact Book. (http://www.cia.gov/cia/publications/factbook/)
Changes in exchange rate
Simple averages of annual % changes of the exchange rate between the recipient and source countries.
International Financial Statistics (IMF).
Exchange rate volatility
Standard deviations of the foreign exchange rate divided by the mean.
International Financial Statistics (IMF).
Real GDP growth differential
Difference in real GDP growth between the source and recipient countries.
World Economic Outlook Database (IMF).
Fiscal balance Fiscal balance of the recipient country. International Financial Statistics (IMF).
ICRG country risk indicator
Sum of the source and recipient countries’ ICRG country risk index. Higher index value represents lower country risk.
International Country Risk Guide by the PRS Group.
Government stability index
Sum of the source and recipient countries’ government stability index.
International Country Risk Guide by the PRS Group.
Corruption index
Sum of source and recipient countries’ corruption index.
International Country Risk Guide by the PRS Group.
Country group dummy
A dummy variable equal to 1 if the recipient country belongs to the group.
Note: All variables are in logarithms except for the dummy variables.

21
References Anderson, James E. and Eric. van Wincoop, (2003), “Gravity with Gravitas: A Solution to
the Border Puzzle,” American Economic Review, Vol. 93, No. 1, pp. 170-92. Chantasasawat, Busakorn, K.C. Fung, Hitomi Iizaka and Alan Siu (2004), ‘Foreign Direct
Investment in China and East Asia,” Hong Kong Institute of Economics and Business Strategy Working Paper No. 1135, The University of Hong Kong, November 2004.
Eichengreen, Barry (2006), “How China is reorganizing the world economy”, Asian
Economic Policy Review Vol. 1, 73-97. Eichengreen, Barry and Hui Tong (2005), “Is China’s FDI Coming at the Expense of
Other Countries?”, NBER Working Paper 11335, May 2005.
Frankel, J. (1997). Regional Trading Blocs, Institute for International Economics: Washington DC. Globerman, Steven and Daniel Shapiro (2002), “Global Foreign Direct Investment Flows:
The Role of Governance Infrastructure”, World Development, Vol. 30, No.11, pp 1899-1919.
International Country Risk Guide, PRS Group International Direct Investment, OECD Online Database (http://www.sourceoecd.org) Kawai, Masahiro and Li-Gang Liu, (2004), “Determinants of International Commercial
Bank Loans to Developing Countries,” Journal of Japan and International Economies (forthcoming).
Kawai, Masahiro and Shinji Urata (1998). “Are Trade and Direct Investment Substitutes or Complements? An Empirical Analysis of Japanese Manufacturing Industries.” H. Lee and D. Roland-Holst, eds. Economic Development and Cooperation in the Pacific Basin: Trade, Investment, and Environmental Issues (Cambridge: Cambridge University Press), pp. 251-296.
Lamy, Pascal, 2003, Speech given at the International Chamber of Commerce in Bangkok
on 1 April 2003. Lim, Ewe-Ghee (2001), “Determinants of, and the Relation Between, Foreign Direct
Investment and Growth: A Summary of the Recent Literature”, IMF Working Paper WP/01/175, November 2001.
22
Liu, Li-Gang (2003), “Diversion of and Competition for FDI in Asia? Some Initial
Empirical Evidence”, unpublished manuscript, Asian Development Bank Institute. Mercereau, Benoit (2005), ”FDI Flows to Asia: Did the Dragon Crowd Out the Tigers?”,
IMF Working Paper No. WP/05/189, September 2005. Mohamad, Mahatir, 2003, Euromoney, 1 October 2003. Panitchpakdi, Supachai, 2000, Financial Times, 23 November 2000. Portes, Richard and Hélène Rey (2004), ”The determinants of cross-border equity flows”,
Journal of International Economics, Vol. 65, 269-296.
Rose, Andrew K. and Mark M. Spiegel, (2002), “A Gravity Model of Sovereign Lending: Trade, Default and Credit,” NBER Working Paper No. 9285 (October)
United Nations Conference on Trade and Development (UNCTAD), World Investment
Report, 2005. Wamsley, T., Hertel, T. and Ianchovichina, E. (2001), “Assessing the Impact of China’s
WTO Accession on Foreign Ownership”, Paper prepared at the 4th Global Economic Analysis Conference, Global Trade Analysis Project, Prudue University, June 2001.
World Bank, World Development Indicators, 2004 & 2005. Xiao, Geng (2004), “People’s Republic of China’s Round-Tripping FDI: Scale, Causes
and Implications”, ADB Institute Discussion Paper No. 7, July 2004.