Embed Size (px)
Citation preview

Determinants of Injury and Death in Canadian Firefighters
A Case for a National Firefighter Wellness Surveillance System
Rachel Ramsden, Jennifer Smith, Kate Turcotte, Len Garis, Kenneth Kunz, Paul Maxim, Larry Thomas, Ian Pike
February 2018


The British Columbia Injury Research and Prevention Unit (BCIRPU) was established by the Ministry of Health and the Minister’s Injury Prevention Advisory Committee in August 1997. BCIRPU is housed within the Evidence to Innovation research theme at BC Children’s Hospital (BCCH) and supported by the Provincial Health Services Authority (PHSA) and the University of British Columbia (UBC). BCIRPU’s vision is, to be a leader in the production and transfer of injury prevention knowledge and the integration of evidence-based injury prevention practices into the daily lives of those at risk, those who care for them, and those with a mandate for public health and safety in British Columbia.
Authors: Rachel Ramsden, Jennifer Smith, Kate Turcotte, Len Garis, Kenneth Kunz, Paul Maxim, Larry Thomas, Ian Pike
Reproduction, in its original form, is permitted for background use for private study, education instruction and research, provided appropriate credit is given to the BC Injury Research and Prevention Unit and the University of the Fraser Valley. Citation in editorial copy, for newsprint, radio and television is permitted. The material may not be reproduced for commercial use or profit, promotion, resale, or publication in whole or in part without written permission from the University of the Fraser Valley.
For any questions regarding this report, contact: BC Injury Research and Prevention Unit F508-4480 Oak Street Vancouver, BC V6H 3V4 Email: [email protected] Phone: (604) 875-3776 Fax: (604) 875-3569 Web page: www.injuryresearch.bc.ca
Suggested Citation: Ramsden R, Smith J, Turcotte K, Garis L, Kunz K, Maxim P, Thomas L, Pike I. Determinants of Injury and Death in Canadian Firefighters: A Case for a National Firefighter Wellness Surveillance System. A report by the BC Injury Research and Prevention Unit, for the University of the Fraser Valley: Abbotsford, BC. February 2018.
Table of Contents
List of Figures .............................................................................................................................................. 1
Executive Summary ..................................................................................................................................... 2
Introduction ................................................................................................................................................. 4
Methodology ................................................................................................................................................ 5
Literature Review ................................................................................................................................ 5
Data Analysis ....................................................................................................................................... 5
Risk Assessment: Determinants of Injury and Death ............................................................................... 7
Literature Review ................................................................................................................................ 7
Data Analysis ....................................................................................................................................... 9
Leading Causes of Injury and Death................................................................................................. 10
Cancer ................................................................................................................................................. 10
Cardiovascular Disease ..................................................................................................................... 21
Respiratory Disease .......................................................................................................................... 27
Mental Health .................................................................................................................................... 31
Volunteer Status ................................................................................................................................ 35
Discussion .................................................................................................................................................. 36
Limitations ......................................................................................................................................... 39
Injury Surveillance Systems ............................................................................................................. 39
Conclusion.................................................................................................................................................. 42
Appendices ................................................................................................................................................ 43
References.................................................................................................................................................. 64
Author Biographical Information............................................................................................................. 70
Acknowledgements ................................................................................................................................... 71
1
List of Figures
Figure 1: Firefighter Cancer Time-loss and Fatality Claims, by Province, 2006-2015, AWCBC .......... 12
Figure 2: Cancer Time-loss and Fatality Claims Average Annual Rates per 100,000 Firefighter Population by Province, 2006-2015, AWCBC.......................................................................................... 12
Figure 3: Percent of all Cancer Claims, by Age-group, 2006—2015, Canada, AWCBC ......................... 13
Figure 4: Firefighter Traumatic Injury Time-loss and Fatality Claims, by Province, 2006-2015, AWCBC ....................................................................................................................................................... 17
Figure 5: Traumatic Injury Time-loss and Fatality Claims Average Annual Rates per 100,000 Firefighter Population by Province, 2006-2015, AWCBC ...................................................................... 18
Figure 6: Percent of all Traumatic Injury Claims, by Age-group, 2006-2015, Canada, AWCBC .......... 19
Figure 7: Firefighter Cardiovascular Disease Time-loss and Fatality Claims, by Province, 2006-2015, AWCBC ....................................................................................................................................................... 23
Figure 8: Cardiovascular Disease Time-loss and Fatality Claims Average Annual Rates per 100,000 Firefighter Population by Province, 2006-2015, AWCBC ...................................................................... 23
Figure 9: Percent of all Cardiovascular Disease Claims, by Age-group, 2006-2015, Canada, AWCBC
.................................................................................................................................................................... 24
Figure 10: Firefighter Respiratory Disease Time-loss and Fatality Claims, by Province, 2006-2015, AWCBC ....................................................................................................................................................... 28
Figure 11: Respiratory Disease Time-loss and Fatality Claims Average Annual Rates per 100,000 Firefighter Population by Province, 2006-2015, AWCBC ...................................................................... 28
Figure 12: Percent of Respiratory Disease Claims, by Age-group, 2006-2015, Canada, AWCBC ........ 29
Figure 13: Firefighter Mental Health Time-loss and Fatality Claims, by Province, 2006-2015, AWCBC
......................................................................................................................................................................31
Figure 14: Mental Health Time-loss and Fatality Claims Average Annual Rates per 100,000 Firefighter Population by Province, 2006-2015, AWCBC ...................................................................... 32
Figure 15: Percent of Mental Health Claims, by Age-group, 2006-2015, Canada, AWCBC .................. 32
Figure 16: Proportion of Volunteer Firefighters, Professional Firefighters and Fatal Claims, by Cause, 2006-2015, British Columbia, WorkSafeBC ................................................................................. 35
Figure 17: : Average Annual Occupational Injury Claims Rates per 100,000 Firefighter Population, by Nature of Injury and Employment Status, 2006-2015, British Columbia, WorkSafeBC ................. 36

2
Executive Summary
Occupational injury is a significant concern facing the Canadian workforce resulting in lost work time
and income, medical expenses, compensation costs, and long-term health problems or disability.
Previous research has shown health risks associated with employment as a firefighter, and exposure
to a variety of injury-related hazards in the course of their occupation. Extreme temperatures, toxic
substances, strenuous physical labour, violence and other traumatic events are potential risks that
firefighters may experience when responding to emergency situations.
The purpose of this report is to describe injury, disease and death among Canadian firefighters. The
report aims to help the reader to understand the causes of injury, disease and death among Canadian
firefighters through an extensive review of previous research, as well as a detailed analysis of injury
claims data. Claims data from the Association of Workers’ Compensation Boards of Canada (AWCBC)
and WorkSafeBC for the years 2006 to 2015 for professional and volunteer firefighters are presented
to define priority issues for targeted health promotion and injury prevention interventions.
Main Findings
AWCBC data revealed five principle causes of injury and death among Canadian firefighters: cancer,
traumatic injury, cardiovascular disease, respiratory disease and mental health problems. Cancer
represented over 86% of all fatal claims, while traumatic injuries accounted for 90% of all time-loss
claims among firefighters, affecting an average one in every 50 firefighters each year. Mental health
was the third leading cause of time-loss claims among Canadian firefighters, but was considerably
less common, affecting an average 1 in 5,000 firefighters per year. While cardiovascular disease was
identified in previous research as a leading cause of mortality among firefighters in Canada, this study
found that cardiovascular disease fatality claims accounted for only 5% of fatal claims, affecting an
average 1 in 35,000 firefighters per year. Finally, respiratory disease accounted for slightly less than
2% of all fatal claims.
While previous research has shown that a healthy worker effect may exist among firefighters, AWCBC
data provides evidence for increased mortality from cancer among firefighters in comparison to the
general population, suggesting that lifestyle factors of firefighters do not play a preventative role in
relation to cancer mortality. Separate from these lifestyle factors, firefighters are known to be at a
high risk for stressful work situations that can lead to an increased risk for traumatic injury and
mental health issues. More recent research suggests that time off work due to mental health concerns
is an emerging trend in accepted time-loss claims by firefighters.
Conclusion
The findings within this report build on previous research and present further evidence for the risks
related to the occupation of firefighting. The results of this study suggest that cancer, traumatic injury
and mental health should be priority issues for researchers, employers and policy-makers working
to improve firefighter health and safety. Future studies that continue to explore the relationship
between the profession of firefighting and injury will improve the understanding of injury risks in

3
the fire service by employment status. Priority areas include the relationship between traumatic
injury and firefighter training and employment status, the onset of a mental health diagnosis in
relation to trauma on the job as a firefighter, and site-specific cancer rates among firefighters to
inform preventative screening policy.
Recommendations
It is difficult to get a complete and accurate picture of occupational injuries in Canada due to
limitations in the available surveillance systems. Currently, there is no provincial or federal database
that collects information related to all injuries or deaths that occur in the workplace. The results of
this report also provide further evidence of the need for a dedicated firefighter health surveillance
model – one that can monitor health trends and patterns among firefighters and which permits
earlier preventative interventions. Given the inherent limitations of using occupational claims data
to analyze injury and death within an occupation, a national firefighter injury surveillance model is
needed to support future research, as well as timely and responsive intervention.
This report presents valuable evidence supporting the concept that firefighters are at an increased
risk for certain causes of injury, disease and death. Dedicated resources should be devoted to health
promotion and injury prevention among firefighters across Canada. Primary prevention and earlier
detection, such as site-specific cancer screening, is essential to decrease the burden of cancer among
the firefighter population. It is recommended that fire departments implement health and wellness
programs as a key component of employee programs that focus on the primary prevention of cancer
and traumatic injury, and the promotion of mental health.

4
Introduction
In 2015, 852 workplace deaths were recorded in Canada. In this single year, there were 232,629
accepted claims for lost time due to a work-related injury or disease. [1] The consequences of
occupational injuries can be immense, including lost work time and income, medical expenses,
compensation costs, and long-term health problems or disability. In addition, an occupational injury
can place a burden on the family, friends, and employer of the injured worker.
Occupational health and safety hazards can transpire in any economic sector. Globally, 30-50% of
workers report exposure to physical, chemical or biological situations at work that may be hazardous
to their health. [2] In 2010, the average worker spent almost 8 hours at work each work day. [3]
According to the OECD Better Life Index, Canadians spend an estimated 20% of their lives at work
each year. [4] With a large portion of an individual's life dedicated to time in the workforce, it is
important to understand the risks associated with a chosen career.
Many factors can contribute to an occupational injury or disease. A theoretical model of occupational
injury shows that the risk for injury in the work force arises from the relationship between the work
environment or job tasks, the organization of the work, and the behavioural characteristics of the
individual. Safety performance behaviours have been found to be directly related to safety knowledge
and safety motivation. [5]
In Canada, firefighters are employed by a municipality in a professional or volunteer capacity,
depending on the size of the community. The roles and responsibilities of professional firefighters
include a wide variety of tasks. The main duties can include responding to emergency situations such
as fires, motor vehicle crashes, building collapses and forces of nature; rescuing victims, and
providing first aid and medical assistance; controlling fires using equipment; training; and providing
safety education to the public. [6]
Employment as a firefighter has been shown to pose a health risk to the employee. Some hazards
known to be associated with the role of a firefighter include exposure to contagious and infectious
diseases, and exposure to toxic products. In addition, the physical demands from strenuous physical
labour, repetitive movements, prolonged postures and activities for extended periods under extreme
conditions can result in overexertion, muscular strains, and other ergonomic concerns. Exposure to
extreme temperatures, excessive noise or involvement in dangerous situations from fire, unstable
structures, falling objects or extreme heights can all cause physical illness or injury. Further,
exposure to dangerous situations or traumatic events, as well as the impact of shift work, can result
in long-term psychological concerns. [7]
Due to the potential risks to firefighters in the workplace, there are many protective policies and
guidelines incorporated into the job by the employer. This report aims to describe the causes of
injury, disease and death among Canadian firefighters through an extensive review of relevant
literature, together with analysis of the Association of Workers’ Compensation Boards of Canada and
WorkSafeBC injury and fatality time-loss claims data.
5
Methodology
Literature Review
An extensive search of relevant literature was conducted using the following electronic databases:
Medline, Embase, Web of Science and SafetyLit. The search strategy included articles for the years
2000 to 2017 that identified causes of injury and death among firefighters. Approximately 300
articles were identified and subsequently reviewed. Of these, 119 articles met the inclusion criteria
and were included in the final review. Inclusion criteria were defined as follows: a study population
of firefighters from a developed country, and peer-reviewed articles published, or available for
translation, in English. Articles that focused on the health impacts of natural disasters or single
occurrence traumatic events were excluded, as they were not representative of the entire Canadian
firefighter population.
Two independent reviewers subjected the final 119 articles to quality assessment using the Downs
and Black checklist. [8] After quality review, a total of 62 articles were selected as high-quality studies
and were included in the final analysis and results presentation.
Data Analysis
Analysis was performed on data from two sources. The Association of Workers’ Compensation
Boards of Canada (AWCBC) provided national data on accepted time-loss claims due to injury and
fatality claims. In addition, provincial time-loss and fatality claims data for British Columbia were
provided by WorkSafeBC. It is important to note that these data do not include all workplace injuries;
only accepted claims for time-loss injuries and fatalities are presented in this analysis.
The AWCBC publishes accepted time-loss injury and fatality reports under the National Work Injuries
Statistics Program (NWISP). Data are submitted to the AWCBC by the twelve provincial and
territorial Canadian Workers’ Compensation Boards and Commissions (WCB), with the Northwest
Territories and Nunavut combined. Each provincial and territorial WCB organization codes their own
data. As such, coding practices may vary among provinces and territories. The AWCBC defines a time-
loss injury as, an injury for which a worker is compensated for a loss of wages following a work-related
incident (or exposure to a noxious chemical) or receives compensation for a permanent disability with
or without time lost in his or her employment.
The AWCBC data includes firefighter time-loss and fatality claims for the years 2006 to 2015,
inclusive. Time-loss claims data were provided for all provinces and territories, whereas fatality
claims data were provided for all provinces and territories except Nunavut, Northwest Territories,
Newfoundland and Prince Edward Island. The AWCBC data were provided in a series of five tables
describing nature of injury, body part injured, cause of injury, event, and occupation status by age
group, gender, year of claim, and province for fatalities and time-loss claims. In the AWCBC data,
small numbers are suppressed to protect the privacy of individual claimants. Any count equal to or
less than 3 was replaced in the data set with an “X” to protect personal identification. For the
purposes of this analysis, each “X” value was randomly replaced with the value 1, 2 or 3. This random
allocation of values to suppressed numbers ensured our ability to conduct the analysis without the
concern of dealing with missing data. Data were then analyzed to provide descriptive and cross-
tabulated statistics related to firefighter time-loss and fatality claims.

6
When interpreting the AWCBC data, coding for the variable Nature of Injury (including disease) was
grouped as shown in Appendix A, Table 3. To calculate the average annual rate of time-loss and
fatality claims, two methodologies were considered: a) use the true total values provided within the
AWCBC dataset as the indicator value for total number of claims; or b) use aggregated values across
provinces, including randomly allocated values to suppressed numbers to calculate the total number
of claims. Both methods yielded comparable results, as seen in Appendix 2, Table 1. To ensure
analogous methodology throughout the paper, method B was utilized to calculate rates throughout
the paper. To calculate the average annual number of claims by province, total fatality and total time-
loss claims were each divided by the number of years reported. Appendix A, Table 2 provides an
overview of the years reported for each province on time-loss and fatality claims.
In order to compare the number of time-loss and fatality claims by province, in comparison to the
number of firefighters employed in each province, firefighter population estimates were received
from the Canadian Association of Fire Chiefs. Firefighter population estimates by province/territory
were used to calculate the average annual rate of time-loss and fatality claims per 100,000 firefighter
population. Firefighter population estimates are based on 2012 data and are displayed in Table 1.
TABLE 1: NUMBER OF FIRE DEPARTMENTS, PROFESSIONAL FULL-TIME FIREFIGHTERS AND VOLUNTEER FIREFIGHTERS IN CANADA, BY PROVINCE/TERRITORY, 2012, CANADIAN ASSOCIATION OF FIRE CHIEFS
AB BC MB NB NL NWT NS NU ON PEI QU SK YU
Fire Departments
435 460 215 170 301 33 314 25 462 36 723 508 26
Full Time Firefighters
3500 3800 977 600 315 31.5 425 17 11032 10 4288 650 40
Volunteer Firefighters
6500 8100 3364 4000 5900 402 7500 346 19263 1000 17310 6400 305
WorkSafe BC claims data was analyzed to provide further information on employment status of
firefighters in relation to cause of injury and death. Accepted claims data was provided for the years
2006 to 2015, inclusive and included information on fatality and volunteer status. Information was
also provided for the variables body part injured, gender and age group. When interpreting the
WorkSafe BC data, coding for the variable Nature of Injury (including disease) was grouped as shown
in Appendix A, Table 4.
7
Risk Assessment: Determinants of Injury and Death
Literature Review
Career firefighters have the second highest injury rates among emergency responders. [9] A 2015
Australian study discovered that from 2003 to 2012, there were 6,997 reported firefighter injuries
on the job, accounting for 177 injuries per annum per 1,000 full-time employees. [10] A 2016 study
involving 19,000 Korean firefighters found that 354 firefighters per 1,000 workers experienced one
or more injuries in the previous year. The odds ratio (OR) of injury was 1.86 for firefighters (95% CI=
1.61-2.15) in comparison to officers1 when adjusting for age, marital status, smoking habit and career
period. These injuries accounted for an age-standardized absence days from work of 1,120 days per
1,000 workers in the previous year. [11]
In a 2013 American study of 462 male career firefighters in the Missouri Valley Region, 20.1% of
firefighters reported having one injury, 3.0% reported having two injuries and 1.7% reported having
three or more injuries within the previous 12-months. The primary types of injuries reported were
dislocation, strain or sprain (76.3%) and superficial or open wound injuries (13.0%). [12] In a 2015
study of 3,289 full-time paid firefighters in Greece, 11% of respondents reported a work-related
injury, with the most common types of injury reported being strains, acute back pain and ankle
injuries. In addition, 13% of respondents met the diagnostic criteria for Post-Traumatic Stress
Disorder (PTSD) symptoms. [13]
The most common cause of injury in a recent Australian study was muscular stress (74 injuries per
1,000 full-time employees annually), including sprains and strains. The most common body parts
injured were the knee, lower back, shoulder and ankle. [10] Suyama studied 850 firefighters over the
course of 29-months, with 477 worker's compensation reports were recorded during this time
period; 73.8% were from minor trauma, 11.7% were from blood-borne pathogen exposures, 5.7%
were from inhalation exposures, 8.8% were from cardiovascular disease, motor vehicle trauma, heat
or burns. [14]
In 2015, a Korean study found that all-cause mortality (adjusted relative risk (ARR) = 1.46, 95%
CI=1.13-1.89), overall cancer mortality (ARR = 1.54, 95% CI = 1.02-2.31) and mortality from external
injury, poisoning and external causes (ARR = 3.13, 95% CI = 1.80-5.46) were significantly higher
among firefighters employed for more than 20-years in comparison to non-firefighters and to
firefighters employed less than 10-years. [15]
Many articles within this review indicate that firefighters have an increased risk for traumatic injury.
Compared with office workers, a 2004 study found that firefighters reported less exposure to sitting
and an increase in biomechanically demanding activities, increased knee and ankle complaints and
disabilities resulting from back complaints, and reduced hypertension, stomach, heart, neck,
shoulder and arm complaints. [16] Hong determined that approximately 66% of firefighters
experienced occupational injuries and 56% reported multiple injuries. Firefighters with more than
17-years in fire services were more likely to report injuries (OR= 2.96; 95% CI = 1.92-4.58) and
1 Officers were considered individuals who perform administrative work, investigate fire grounds, or are involved in communication and informational systems.

8
multiple injuries (OR = 2.47; 95% CI = 1.49-4.10). The most commonly reported injuries were muscle
strains and sprains (74%), extremity injuries (60%), back injuries (54%), and burns (28%). [17]
Britton found that the most common injury mechanism was slips, trips and falls followed by use of
equipment, tools and machinery. [18] In addition, Vaulerin determined that sprains were the most
common type of injury, followed by tendinitis and muscle tears, and Baarts reported that firefighter's
highest associated injury category was upper extremity injuries. [19,20]
When comparing male firefighters to the general population, Baris found that there were statistically
significant excess risks for ischemic heart disease (SMR=1.09). [21] This study determined that there
is a decreased risk for mortality from nervous system diseases (SMR=0.47), cerebrovascular diseases
(SMR = 0.83), respiratory diseases (SMR = 0.67), genitourinary diseases (SMR = 0.54), all accidents
(SMR = 0.72), and suicide (SMR = 0.66). Mecham found that 1,100 emergency service injury reports
were submitted during the study period, of which 44 (4.0%, 95% CI 0-10.9%) involved an assault,
and 9 of these incidents were assaults on firefighters. [22]
Data from the United States Fire Administration (USFA) fatality database revealed that between 1990
and 2000, myocardial infarction was shown to have increased from 43% to 46.5% of firefighter
deaths, cerebrovascular accident increased from 1.7% to 3.6% of deaths, asphyxiation decreased
from 12.1% to 7.9% and burns decreased from 7.7% to 3.9%. The percentage of fatalities of
firefighters over age 40 has increased from 52% to 65%. [23] In a 2005 study, 1,411 male and 38
female firefighter deaths with known causes were identified. In male firefighters there was no excess
overall mortality from cancer, however female firefighters had an increased risk for atherosclerotic
heart disease (SMR = 3.85; 95% CI: 1.66-7.58). [24]
Hodous looked at the USFA annual summary of firefighter line-of-duty deaths and National Institute
for Occupational Safety and Health (NIOSH) Fire Fighter Fatality Investigation and Prevention
Program (FFFIPP) reports. [25] Firefighter deaths between 1998 and 2001 were analyzed and
categorized. Of a total 410 firefighter deaths, 47% were medical deaths, of which 90% were due to
myocardial infarction. The majority of these fatalities occurred at, or just after, a fire scene, indicative
of the physical and psychological stresses of the firefighting profession. Motor vehicle fatalities
comprised 18% and non-motor vehicle trauma comprised 35% of all firefighter deaths. Among non-
motor vehicle traumatic fatalities, 48% were from burns or asphyxiation. [25]
Contrary to these findings, Amadeo found that firefighters had lower all-cause mortality than the
general population (standardized mortality ratio (SMR)=0.81; 95%CI: 0.77-0.85). [26] While finding
no significant excess of mortality for any specific cause, this 2015 study did find that a greater number
of deaths than expected occurred for various digestive neoplasms. In addition, a 2001 study by Baris
found that firefighters had a similar mortality rate to the general United States male population for
all cancers (SMR=1.10) and all causes of death combined (SMR=0.96). [21] Wagner determined that
the conditional life expectancy of a German firefighter is 2.4 years longer than the normal male
German population. [27]
9
Data Analysis
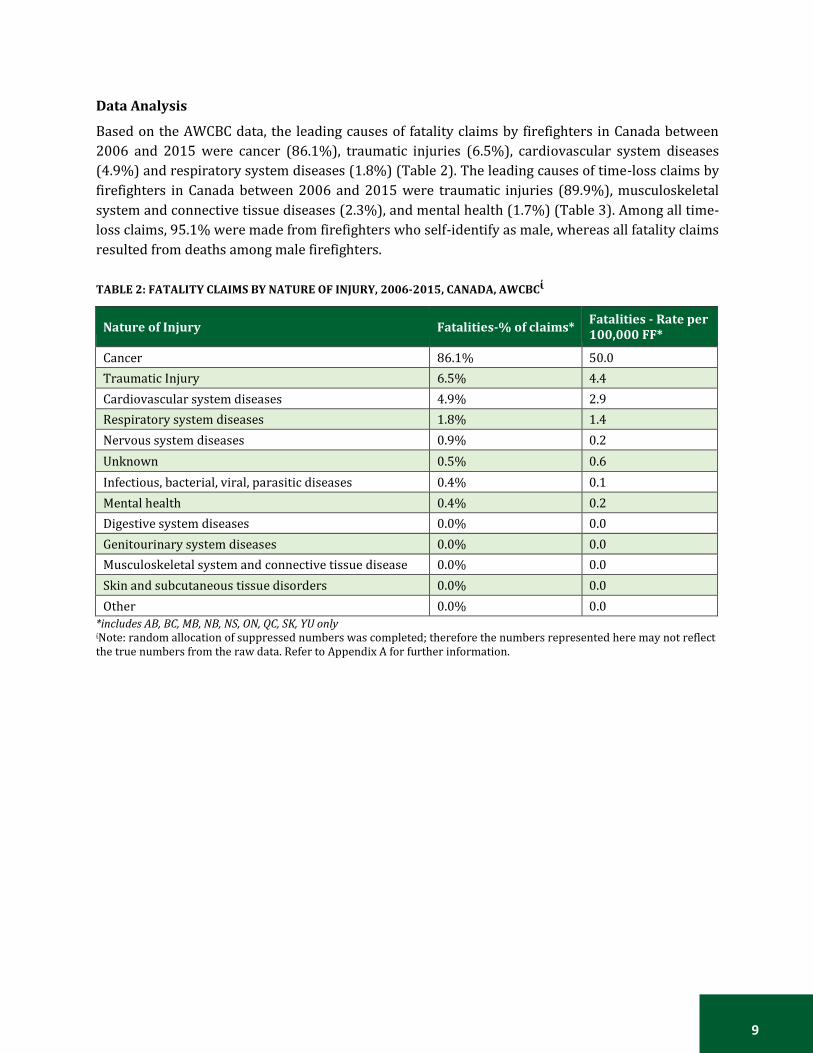
Based on the AWCBC data, the leading causes of fatality claims by firefighters in Canada between
2006 and 2015 were cancer (86.1%), traumatic injuries (6.5%), cardiovascular system diseases
(4.9%) and respiratory system diseases (1.8%) (Table 2). The leading causes of time-loss claims by
firefighters in Canada between 2006 and 2015 were traumatic injuries (89.9%), musculoskeletal
system and connective tissue diseases (2.3%), and mental health (1.7%) (Table 3). Among all time-
loss claims, 95.1% were made from firefighters who self-identify as male, whereas all fatality claims
resulted from deaths among male firefighters.
TABLE 2: FATALITY CLAIMS BY NATURE OF INJURY, 2006-2015, CANADA, AWCBCἰ
Nature of Injury Fatalities-% of claims* Fatalities - Rate per 100,000 FF*
Cancer 86.1% 50.0
Traumatic Injury 6.5% 4.4
Cardiovascular system diseases 4.9% 2.9
Respiratory system diseases 1.8% 1.4
Nervous system diseases 0.9% 0.2
Unknown 0.5% 0.6
Infectious, bacterial, viral, parasitic diseases 0.4% 0.1
Mental health 0.4% 0.2
Digestive system diseases 0.0% 0.0
Genitourinary system diseases 0.0% 0.0
Musculoskeletal system and connective tissue disease 0.0% 0.0
Skin and subcutaneous tissue disorders 0.0% 0.0
Other 0.0% 0.0
*includes AB, BC, MB, NB, NS, ON, QC, SK, YU only ἰNote: random allocation of suppressed numbers was completed; therefore the numbers represented here may not reflect the true numbers from the raw data. Refer to Appendix A for further information.

10
TABLE 3: TIME-LOSS CLAIMS BY NATURE OF INJURY, 2006-2015, CANADA, AWCBCἰ
Nature of Injury
Time-loss- %
Time-loss claims - Rate per 100,000 FF
Traumatic Injuries 89.9% 1661.3
Musculoskeletal system and connective tissue diseases
2.3% 33.7
Mental health 1.7% 24.0
Cancer 1.5% 23.5
Digestive system diseases 1.0% 15.1
Nervous system and sense organs diseases 0.9% 13.1
Other 0.8% 12.4
Unknown 0.6% 8.9
Cardiovascular system diseases 0.5% 6.5
Infectious, bacterial, viral, parasitic diseases 0.3% 5.3
Skin and subcutaneous tissue diseases 0.3% 4.6
Respiratory system diseases 0.2% 3.0
Genitourinary system diseases 0.0% 0.6 ἰNote: random allocation of suppressed numbers was completed; therefore the numbers represented here may not reflect
the true numbers from the raw data. Refer to Appendix A for further information.
Leading Causes of Injury and Death
Based on the literature review and analysis of available data, five principal and emerging trends have
been identified regarding injury and death among firefighters. According to the AWCBC data, cancer,
traumatic injury, cardiovascular disease, and respiratory disease are the leading causes of fatality
claims among Canadian firefighters. The literature supports these four causes as sources of mortality
among firefighters across the world. In addition, AWCBC data revealed that many time-loss claims by
firefighters are due to mental health reasons, also an emerging trend in the literature as a significant
contributor to lost time at work. For this reason, the five sub causes of cancer, traumatic injury,
cardiovascular disease, respiratory disease, and mental health are further analyzed below.
Cancer
Occupational cancer can arise when an employee is exposed to whole or partial particles of a
carcinogen in the workplace. [28] The proportion of cancer that can be attributed to occupational
exposure varies with type of cancer and occupation. Across all professions, the most common forms
of occupational cancer are lung cancer, bladder cancer and mesothelioma. [29] The World Health
Organization International Agency for Research on Cancer Monograph Working Group concluded in
2007 that firefighters face adverse occupational exposures in their employment, including exposure
to human carcinogens resulting in increased relative risks for testicular and prostate malignant
neoplasms and non-Hodgkin's lymphoma. [30]
While firefighters are subject to the same basic genetic and environmental factors that predispose
for cancer as the standard public, in the course of their duties they are confronted with additional
risks and exposures that place them in even greater peril of acquiring and subsequently dying of
11
cancer. While engaged in fire suppression and overhaul activities, often in uncontrolled and
hazardous environments and over the span of many years, firefighters are repeatedly exposed to
complex mixtures of concentrated carcinogens, which are generated de novo in the intense heat and
pressure of a fire. When organic and inorganic materials, such as those found in furniture, chemicals,
plastics, metal alloys, and modem construction materials are subject to incomplete thermochemical
decomposition, potentially thousands of toxic combustions products are produced and aerosolized
into the smoke, soot, and tar generated by the fire. Benzene, polycyclic aromatic hydrocarbons,
dioxins, polychlorinated biphenyls, asbestos fibers, and heavy metals such as lead, arsenic, and
cadmium are only a few examples of the carcinogens released. Furthermore, even the most efficient
personal protective equipment offers insufficient protection against these toxins, as many
firefighters anecdotally report smelling like smoke or burning plastic for days after fighting a fire.
The carcinogens thus encountered can be inhaled through the lungs, inadvertently swallowed via the
upper aerodigestive tract, or absorbed in significant concentrations directly through the skin, when
firefighters remove and handle contaminated bunker gear and equipment. In addition to the risk
factors outlined above, the International Agency for Research on Cancer (2010) has classified the
shift work that firefighters often operate under as a group 2A carcinogen, probably by reason of
disruption of the circadian clock genes involved in the sleep-wake cycle. [28]
Cancer was responsible for 86.1% of all fatality claims by firefighters in Canada between 2006 and
20152, at an annual rate of 50.0 fatalities per 100,000 Canadian firefighter population3. During this
period 1.5% of time-loss claims by Canadian firefighters were due to cancer, with an annual rate of
23.5 per 100,000 firefighter population.
Nationally, Ontario accounted for 44% of all time-loss claims and 50% of all fatality claims related to
cancer among firefighters (Figure 1). Ontario and Manitoba experienced the highest average rates of
cancer fatalities per firefighter population in an average year, at 94.7 and 94.5 per 100,000 firefighter
population, respectively. The highest rates of time-loss claims among firefighters were in the Yukon
(96.6 per 100,000 firefighter population), Alberta (58.0 per 100,000 firefighter population) and
British Columbia (51.3 per 100,000 firefighter population) (Figure 2). The majority of fatality claims
due to cancer were submitted by male firefighters over the age of 65 years. However, over 30% of all
time-loss claims due to cancer were for male firefighters between the ages of 45-59 years (Figure 3).
2 Includes data from AB, BC, MB, NB, NS, ON, QC, SK, YU only 3 Includes data from AB, BC, MB, NB, NS, ON, QC, SK, YU only

12
FIGURE 1: FIREFIGHTER CANCER TIME-LOSS AND FATALITY CLAIMS, BY PROVINCE, 2006-2015, AWCBCἰ
ND = no data provided *Indicates a value of 1≤ X ≤ 3 ἰNote: random allocation of suppressed numbers was completed; therefore the numbers represented here may not reflect the true numbers from the raw data. Refer to Appendix A for further information.
FIGURE 2: CANCER TIME-LOSS AND FATALITY CLAIMS AVERAGE ANNUAL RATES PER 100,000 FIREFIGHTER
POPULATION BY PROVINCE, 2006-2015, AWCBCἰ

13
ND= No data provided ἰNote: random allocation of suppressed small numbers was completed; therefore the numbers represented here may not reflect the true numbers from the raw data. Refer to Appendix A for further information.
FIGURE 3: PERCENT OF ALL CANCER CLAIMS, BY AGE GROUP, 2006—2015, CANADA, AWCBC
Korean firefighters have experienced excess morbidity in several cancer types, including colorectal
and urologic cancers, and non-Hodgkin's lymphoma, demonstrating similar trends to previous
studies for firefighters conducted in other countries. [15] However, a 2016 study found that paid
Australian firefighters have reduced mortality from cancer in comparison to the general population.
[31]
Amadeo found no significant increase in mortality among firefighters for any specific cause, however
the study found a greater number of deaths occurring for cancers of the rectum/anus, pancreas,
buccal-pharynx, stomach, liver, and larynx. [26] As well, Baris found the risks of mortality from colon
cancer (SMR=1.68), kidney cancer (SMR=2.20), non-Hodgkin's lymphoma (SMR=1.72), multiple
myeloma (SMR=2.31), and benign neoplasms (SMR=2.54) were increased among firefighters with at
least 20 years of service. [21] While this study found no significant increase in overall mortality
among Philadelphia firefighters, increased mortality for cancers of the colon and kidney, non-
Hodgkin's lymphoma and multiple myeloma were observed.
From a pool of 19,309 eligible male firefighters, a 2015 study identified 1,333 cancer deaths and
2,609 cancer incidence cases. [32] Significant positive associations occurred between fire-hours and
lung cancer mortality and incidence, and between fires attended to and leukemia mortality. Lung
cancer and leukemia mortality risks increased moderately with increases in firefighter exposure. A
2016 study observed no increased risk of lung cancer in firefighters, even after adjustment for
smoking and exposure to other occupational lung carcinogens. [33]

14
In comparison, a study of 36,813 firefighters followed between 1972 and 1999 found no excess
overall mortality from cancer among male firefighters compared to the general population, but
excesses mortality rates did exist for male breast cancer (SMR=7.41; 95% CI: 1.99-18.96) and thyroid
cancer (SMR=4.82; 95% CI: 1.30-12.34)]. Mortality from bladder cancer was also increased
(SMR=1.79; 95% CI: 0.98-3.00). Female firefighters had similar morality patterns to Florida women,
except for increased standard mortality rates for atherosclerotic heart disease (SMR=3.85; 95% CI:
1.66-7.58). [24]
In a cohort of 2,200 Scottish firefighters followed between 1984 and 2005, the overall mean annual
cancer incidence rate was 86.5 per 100,000 population versus 123.7 per 100,000 general population;
and the overall mean annual cancer mortality rate was 20.4 per 100,000 population, in comparison
to 59.9 per 100,000 general population. For specific cancers, the incidence of melanoma was found
to occur at a rate of 13.6 per 100,000 population, kidney cancer incidence rate was 9.1 per 100,000
population and kidney cancer mortality rate was 6.5 per 100,000 population. Large bowel cancer
incidence rate was 9.1 per 100,000 population and lung cancer incidence rate was 6.8 per 100,000
population. These cancer rates were found to be lower than those of the general Scottish population.
[34]
Glass proposed that lower mortality rates from cancer were likely a result of a strong, healthy worker
effect and lower smoking rates among firefighters compared with the general Australian population.
[31] Daniels found significant negative associations were evident for the exposure surrogates and
colorectal and prostate cancers, suggesting a healthy worker survivor effect, possibly enhanced by
medical screening. [32]
A summary of the global literature pertaining to the risk of cancer incidence and mortality among
firefighters is presented in Table 4.
TABLE 4: SELECTED ARTICLES- CAUSES OF INJURY AND DEATH AMONG FIREFIGHTERS: CANCER
Author (Year)
Title Objective Cancer Rates
Ahn YS Cancer To estimate cancer Colorectal cancer: SIR=1.27, 95% CI= 1.01-1.59 (2012) [35] morbidity of
professional morbidity in Korean male professional
Kidney cancer: SIR= 1.56, 95% CI=1.01-2.41 Bladder cancer: SIR=1.60, 95% CI=1.01-2.56
emergency emergency responders Non-Hodgkin's Lymphoma: SR=1.69, 95% CI= 1.01-
responders in and compare that with 2.67)
Korea. the Korean male general population.
Bates MN Registry-based To determine if Testicular cancer: OR= 1.54, 95% CI= 1.18-2.02 (2007) case-control California (U.S.) Melanoma: OR= 1.50, 95% CI=1.33-1.70
[36]4 study of cancer in California
professional firefighters were at an
Brain cancer: OR=1.35, 95% CI=1.06-1.72 Esophageal cancer: CI= 1.48, 95% CI= 1.14-1.91
firefighters. increased cancer risk Prostate cancer: OR=1.22, 95% CI= 1.12-1.33
relative to other occupations.
4 All results are displayed in Appendix B, Figure 3
15
Author (Year)
Title Objective Cancer Rates
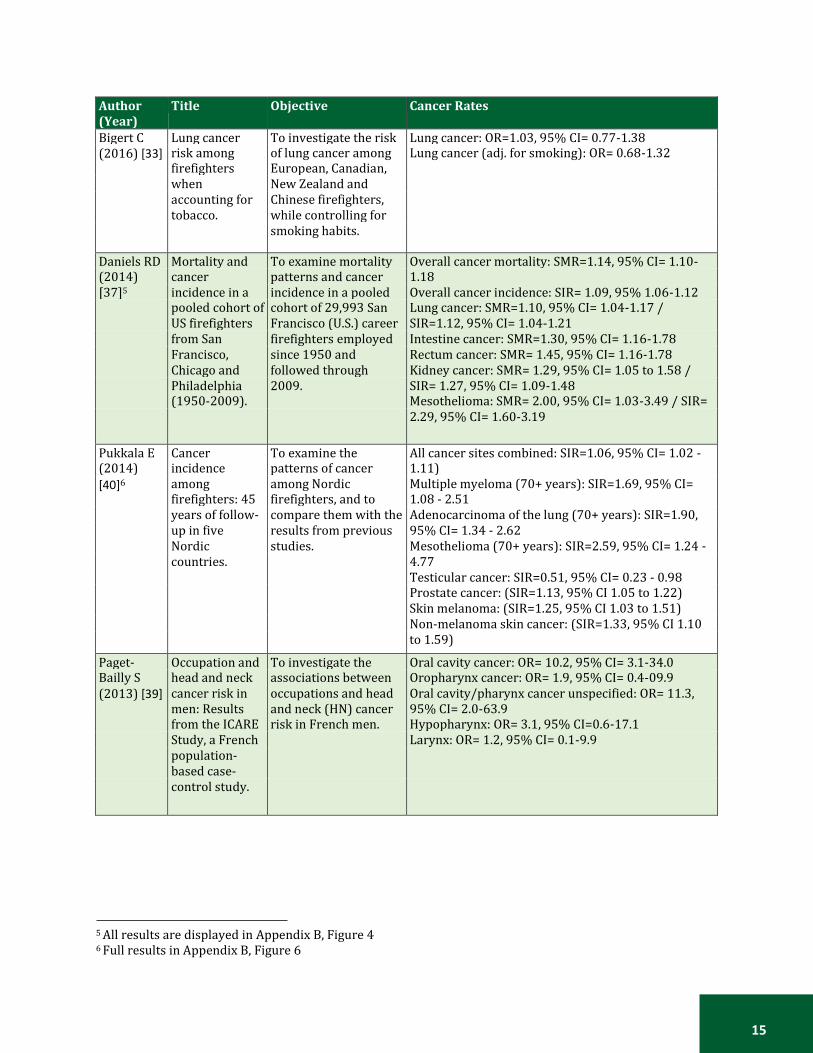
Bigert C Lung cancer To investigate the risk Lung cancer: OR=1.03, 95% CI= 0.77-1.38 (2016) [33] risk among
firefighters of lung cancer among European, Canadian,
Lung cancer (adj. for smoking): OR= 0.68-1.32
when New Zealand and accounting for Chinese firefighters, tobacco. while controlling for smoking habits.
Daniels RD Mortality and To examine mortality Overall cancer mortality: SMR=1.14, 95% CI= 1.10- (2014) cancer patterns and cancer 1.18 [37]5 incidence in a incidence in a pooled Overall cancer incidence: SIR= 1.09, 95% 1.06-1.12
pooled cohort of cohort of 29,993 San Lung cancer: SMR=1.10, 95% CI= 1.04-1.17 /
US firefighters Francisco (U.S.) career SIR=1.12, 95% CI= 1.04-1.21
from San firefighters employed Intestine cancer: SMR=1.30, 95% CI= 1.16-1.78
Francisco, since 1950 and Rectum cancer: SMR= 1.45, 95% CI= 1.16-1.78
Chicago and followed through Kidney cancer: SMR= 1.29, 95% CI= 1.05 to 1.58 /
Philadelphia 2009. SIR= 1.27, 95% CI= 1.09-1.48
(1950-2009). Mesothelioma: SMR= 2.00, 95% CI= 1.03-3.49 / SIR=
2.29, 95% CI= 1.60-3.19
Pukkala E Cancer To examine the All cancer sites combined: SIR=1.06, 95% CI= 1.02 - (2014) incidence patterns of cancer 1.11)
[40]6 among firefighters: 45
among Nordic firefighters, and to
Multiple myeloma (70+ years): SIR=1.69, 95% CI= 1.08 - 2.51
years of follow- compare them with the Adenocarcinoma of the lung (70+ years): SIR=1.90,
up in five results from previous 95% CI= 1.34 - 2.62
Nordic studies. Mesothelioma (70+ years): SIR=2.59, 95% CI= 1.24 -
countries. 4.77
Testicular cancer: SIR=0.51, 95% CI= 0.23 - 0.98
Prostate cancer: (SIR=1.13, 95% CI 1.05 to 1.22)
Skin melanoma: (SIR=1.25, 95% CI 1.03 to 1.51)
Non-melanoma skin cancer: (SIR=1.33, 95% CI 1.10
to 1.59)
Paget- Occupation and To investigate the Oral cavity cancer: OR= 10.2, 95% CI= 3.1-34.0 Bailly S head and neck associations between Oropharynx cancer: OR= 1.9, 95% CI= 0.4-09.9 (2013) [39] cancer risk in
men: Results occupations and head and neck (HN) cancer
Oral cavity/pharynx cancer unspecified: OR= 11.3, 95% CI= 2.0-63.9
from the ICARE risk in French men. Hypopharynx: OR= 3.1, 95% CI=0.6-17.1
Study, a French Larynx: OR= 1.2, 95% CI= 0.1-9.9
population- based case- control study.
5 All results are displayed in Appendix B, Figure 4 6 Full results in Appendix B, Figure 6

16
Author (Year)
Title Objective Cancer Rates
Glass DC Mortality and To investigate Overall risk of cancer: SIR= 1.09, 95% CI= 1.03-1.14 (2016) cancer mortality and cancer Overall cancer mortality: SMR= 0.81, 95% 0.72-0.90 [31]7 incidence in a incidence of paid male Prostate cancer: SIR= 1.23, 95% CI= 1.10-1.37
cohort of male Australian firefighters Melanoma: SIR= 1.45, 95% CI= 1.26-1.66
paid Australian and of subgroups of firefighters. firefighters.
Tsai RJ Risk of cancer To determine cancer Melanoma: OR=1.8, 95% CI= 1.4-2.1 (2015) [41] among
firefighters in risks among Californian (U.S.)
Multiple myeloma: OR= 1.4, 95%CI= 1.0-1.8 Acute myeloid leukemia: OR= 1.4, 95% CI= 1.0-2.0
California, firefighters that reflect Cancers of the esophagus: OR= 1.6, 95% CI= 1.2-2.1
1988-2007. risks from advances in Prostate: OR= 1.5, 95% CI= 1.3-1.7
building materials. Brain: OR= 1.5, 95% CI= 1.2-2.0
Kidney: OR= 1.3, 95% CI= 1.0-1.6
LeMasters Cancer Risk To review 32 studies Multiple myeloma: SRE8= 1.53, 95% CI= 1.21–1.94 GK (2006) Among on firefighters and to Non-Hodgkin lymphoma: SRE= 1.51, 95% CI= 1.31– [38] Firefighters: A quantitatively and 1.73 Prostate cancer: SRE= 1.28, 95% CI= 1.15–1.43
Review and qualitatively determine Testicular cancer: SRE = 2.02, 95% CI= 1.30–3.13
Meta-analysis of the cancer risk using a Skin: SRE= 1.39, 95% CI= 1.10–1.73
32 Studies meta-analysis. Malignant melanoma: SRE=1.32, 95% CI= 1.10–1.57
Brain: SRE=1.32, 95% CI= 1.12–1.54
Rectum: SRE= 1.29, 95% CI= 1.10–1.51
Buccal cavity and pharynx: SRE= 1.23, 95% CI= 0.96–
1.55 Stomach: SRE= 1.22, 95% CI= 1.04–1.44
Colon: SRE= 1.21, 95% CI= 1.03–1.41
Leukemia: SRE= 1.14, 95% CI= 0.98–1.31
Ide CW Cancer To determine the Overall mean annual cancer incidence rate: (2014) incidence and incidence of, and 86.5/100,000 population versus 123.7/100,000 [34] mortality in mortality from, cancer population (general population, GP), 95% CI= -290.3-
serving whole- in a cohort of -209.7
time Scottish firefighters 1984-2005
approximately 2200 serving full-time firefighters in Scotland, in comparison to the general population.
Overall mean annual cancer mortality rate: 20.4/100,000 population versus 59.9/100,000 population (GP), 95% CI= -57.5 - -22.5
Melanoma: 13.6/100,000 population versus 7.7/100,000 population (GP), 95% CI 3.0 - 8.8
Kidney cancer incidence: 9.1/100,000 population
versus 4.4/100,000 population (GP), 95% CI 2.4 -
6.7)
Kidney cancer mortality: 6.5/100,000 population
versus 1.9/100,000 population (GP), 95% CI 2.8 -
6.4)
Large bowel cancer: 9.1/100,000 population versus
13.8/100,000 population (GP), 95% CI -7.7 - -1.7
Lung cancer: 6.8/100,000 population versus
20.4/100,000 population (GP), 95% CI -7.7 - 1.0).
7 All results are displayed in Appendix B, Figure 5 8 Summary Risk Estimate
17
Traumatic Injury
The risk for traumatic injury, a sudden physical injury that requires immediate medical attention, is
well known among the firefighting occupation. The profession of firefighting is a high-hazard
occupation that involves exposures to heat and intense physical activity. In addition, firefighters
spend many hours in transit to get to emergency scenes, adding vehicle collision risk to their job
description. In the United States in 2016 there were 15,425 collisions involving fire department
emergency vehicles responding to or returning from incidents. [42]
Traumatic injury contributed to 6.5% of all fatality claims by firefighters in Canada between 2006
and 20159, at a rate of 4.4 fatalities per 100,000 Canadian firefighter population10 annually. Among
time-loss claims by Canadian firefighters during this period, 89.9% of claims were due to traumatic
injury, at a rate of 1,661.3 per 100,000 firefighter population.
Nationally, Ontario accounted for 34% of all time-loss claims and 35% of all fatality claims related to
traumatic injury (Figure 4). Alberta and Saskatchewan experienced the highest average rates of
traumatic injury fatalities per firefighter population in an average year, at 9.0 and 6.3 per 100,000
firefighter population, respectively. The highest rates of time-loss claims among firefighters were in
Manitoba (2,464.9 per 100,000 firefighter population), British Columbia (2,173.1 per 100,000
firefighter population) and Alberta (1,926.0 per 100,000 firefighter population) (Figure 5). The
majority of fatality claims due to traumatic injury among firefighters were submitted for males over
the age of 65 years. Time-loss claims for traumatic injury were highest between the ages of 35 to 49,
with a very low number of claims submitted for firefighters under the age of 25 (5.5%) or over the
age of 59 (7.5%) (Figure 6).
9 Includes data from AB, BC, MB, NB, NS, ON, QC, SK, YU only 10 Includes data from AB, BC, MB, NB, NS, ON, QC, SK, YU only

18
FIGURE 4: FIREFIGHTER TRAUMATIC INJURY TIME-LOSS AND FATALITY CLAIMS, BY PROVINCE, 2006-2015,
AWCBCἰ
ND = no data provided *Indicates a value of 1≤ X ≤ 3 ἰNote: random allocation of suppressed numbers was completed; therefore the numbers represented here may not reflect the true numbers from the raw data. Refer to Appendix A for further information.
FIGURE 5: TRAUMATIC INJURY TIME-LOSS AND FATALITY CLAIMS AVERAGE ANNUAL RATES PER 100,000
FIREFIGHTER POPULATION BY PROVINCE, 2006-2015, AWCBCἰ
ND = No data provided ἰNote: random allocation of suppressed small numbers was completed; therefore the numbers represented here may not reflect the true numbers from the raw data. Refer to Appendix A for further information.

19
FIGURE 6: PERCENT OF ALL TRAUMATIC INJURY CLAIMS, BY AGE GROUP, 2006-2015, CANADA, AWCBC
National and provincial data revealed that traumatic injury is the leading cause of time-loss claims
among firefighters. In addition to the determined risk for traumatic injury incidence, the literature
also demonstrated that traumatic injuries such as burns, extremity injuries and back injuries were
leading causes of time off work among firefighters (Table 5). In 2012, Hong found that approximately
66% of firefighters experienced occupational injuries. [17] The most commonly reported injuries
were muscle strains and sprains (74%), extremity injuries (60%), back injuries (54%), and burns
(28%). Similarly a 2015 study found that the largest causal mechanism for injury was muscular stress
(74 injuries per 1,000 full-time employees annually) and the principal injury type involved sprains
and strains. [10] The most common forms of injury mechanism were slips, trips and falls, and
equipment, tools and machinery. [11,43]
From 2002 to 2012, traumatic deaths accounted for 29.6% of all firefighter fatalities, with fatalities
involving a motor vehicle collision accounting for 9.3%. [23] Firefighters have been found to report
a low level assault incidence, and injuries from poisoning or environmental exposure were less likely
to result in a severe injury than were slips, trips or falls. [25, 43]

20
TABLE 5: SELECTED ARTICLES- CAUSES OF INJURY AND DEATH AMONG FIREFIGHTERS: TRAUMATIC INJURY
Lead Authors
Title Objective Results
Britton C Epidemiology of This report examined The most common injury mechanism was (2013) injuries to wildland firefighter slips/trips/falls followed by [43] wildland
firefighters. injuries reported to the U.S. Department of the
equipment/tools/machinery. Injuries from poisoning or environmental exposure were
Interior from the years less likely to lead to severe injury than slips,
2003 to 2007. trips, or falls (odds ratio, 0.45; 95%
confidence interval, 0.21-0.95).
Clark Hearing levels of The results of annual The results of this large-scale, cross- WW firefighters: Risk audiometric testing and a sectional, and longitudinal study indicate (2005) of occupational related questionnaire, that firefighters are not at risk for [44] noise-induced
hearing loss collected as part of a company-wide hearing
occupational noise-induced hearing loss, even though they work nonstandard shifts
assessed by cross- conservation program, and are occasionally exposed to high levels
sectional and were obtained from two of noise.
longitudinal data. large U.S. urban fire departments.
Hong O Occupational A total of 437 firefighters The most commonly reported injuries were (2012) injuries, duty from three U.S. states muscle strains and sprains (74%), [17] status, and factors
associated with participated in an Internet-based survey.
extremity injuries (60%), back injuries (54%), and burns (28%).
injuries among firefighters.
Hong O Hearing loss and A Web-based survey and a More than 40% showed hearing loss in the (2013) use of hearing standard audiometric test noise-sensitive frequencies (4 and 6 kHz). [45] protection among
career firefighters were performed with 425 firefighters from three
Firefighters having longer years of work in fire services demonstrated significantly
in the U.S. states in the U.S. worse hearing. Reported use of HPDs was
34% of the time that was needed.
Kahn SA Line of duty To report on all-cause line Between 1990-2000, 1140 firefighters (2015) firefighter of duty mortality among sustained a fatal injury while on duty; and [23] fatalities: An
evolving trend firefighters between 1990-2000 and 2002-
1174 were killed during 2002-2012. MI has increased from 43% to 46.5% of deaths
over time. 2012, using the U.S Fire (p=0.012) between the 2 decades.
Administration fatality Asphyxiation has decreased from 12.1% to
database. 7.9% (p=0.003) and burns have decreased
from 7.7% to 3.9% (p=0.0004).
Electrocution is down from 1.8% to 0.5%
(p=0.004). Death from trauma was
unchanged (27.8 to 29.6%, p=0.12). The
percentage of fatalities involving an MVC
has increased from 4.6 to 9.3% (p=0.0001).
Mechem Injuries from To determine the nature There were 1,100 injury reports submitted CC assaults on and frequency of injuries during the study period, of which 44 (4.0%, (2002) paramedics and resulting from assaults on 95% CI 0-10.9%) involved an assault. [22] firefighters in an
urban emergency urban paramedics and firefighters in a large, fire
Firefighters were assaulted in nine (20.5%) of these incidents.
medical services department-based system. emergency medical services system.

21
Lead Authors
Title Objective Results
Reichard Occupational To characterize injuries Sprains and strains were the leading injury AA injuries among among emergency medical (33-41%) among EMS, firefighter, and (2009) emergency services, firefighting, and police occupations. Police officers and [9] responders. police occupations by
using data from the career firefighters had the highest injury rates (8.5 and 7.4 injuries per 100 full-time
National Electronic Injury equivalent workers, respectively).
Surveillance System- Occupational Supplement (NEISS-Work) for injuries treated in U.S. hospital emergency departments in 2000-2001.
Suyama J Comparison of To compare injury rates in A total of 1,295 workers' compensation (2009) public safety workers' compensation events were documented, with [14] provider injury
rates. data for emergency medical services (EMS),
477 (36%) reported from fire. Lost time injuries were more common in fire (39%)
fire, and police providers and police (38%) than EMS (23%).
from one urban center Workers' compensation events common to
between January 1, 2005, all bureaus were minor trauma (76%) and
and May 31, 2007, were exposures to blood-borne pathogens
examined. (12%). Minor traumatic injuries, mostly
associated with axial musculoskeletal
strains and extremity injuries, were
responsible for the majority of injuries
resulting in missed work. Injuries more
common in a specific bureau included
cardiovascular disease, burns, and heat
illness (fire).
Taylor A retrospective Work-related injury data The largest causal mechanism was NA evaluation of from Australia's largest muscular stress (74 injuries per 1000 full- (2015) injuries to urban fire and rescue time employees annually), with 62.1% of [10] Australian urban
firefighters (2003 organization were analyzed from 2003 to
those incidents involving materials handling and slips, trips, and falls. The
to 2012): Injury 2012, with an emphasis on principal injury type involved sprains and
types, locations, classification (occurrence, strains. The most commonly injured sites
and causal mechanism, agency, were the knee, lower back, shoulder, and
mechanisms. nature, and location) and ankle.
demographic details.
Vaulerin Physical exercise Data were collected from a Sprains were the most prevalent type of J and burnout facets population-based sample injury (98%), followed by tendinitis (40%) (2016) predict injuries in of 220 male firefighters in and muscle tears (30%). More than two [19] a population-
based sample of France to describe the nature and site of injuries
thirds of these injuries were located at the ankle. The findings suggest that physical
French career and the relationships exercise and cognitive weariness can be
firefighters. among firefighter injuries, considered as risk factors for French
physical exercise, burnout firefighter injuries.
and coping strategies.
Cardiovascular Disease

22
Diseases of the circulatory system, such as ischemic heart disease, myocardial infarction (heart
attack), congestive heart failure and cerebrovascular disease, are identified under the broader term
of cardiovascular disease. [46] Cardiovascular disease is the leading cause of on-duty death among
firefighters. [47] The physical demands, emotional stress and environmental hazards that a
firefighter endures on the job place stress on the cardiovascular system. [48] Among firefighters
employed in the United States, coronary heart disease is responsible for 45% of on-duty deaths. [49]
Cardiovascular disease contributed to 4.9% of all fatality claims by firefighters in Canada between
2006 and 201511, at a rate of 2.9 fatalities per 100,000 Canadian firefighter population12 annually.
Among time-loss claims by Canadian firefighters, 0.5% of claims between 2006 and 2015 were due
to cardiovascular disease. Yearly time-loss claims for cardiovascular disease among firefighters
occurred at a rate of 6.5 per 100,000 firefighter population.
Nationally, Ontario accounted for 49% of all time-loss claims and 36% of all fatality claims related to
cardiovascular disease (Figure 7). The Yukon and New Brunswick experienced the highest average
rates of cardiovascular disease fatalities per firefighter population in an average year, at 579.7 and
21.7 per 100,000 firefighter population, respectively. However, the high rate of cardiovascular
disease fatalities in the Yukon can be accounted for by an extremely low firefighter population. The
highest rates of time-loss claims among firefighters were in the Yukon (32.2 per 100,000 firefighter
population), New Brunswick (17.4 per 100,000 firefighter population) and Ontario (11.6 per 100,000
firefighter population) (Figure 8). The highest proportion of fatality claims due to cardiovascular
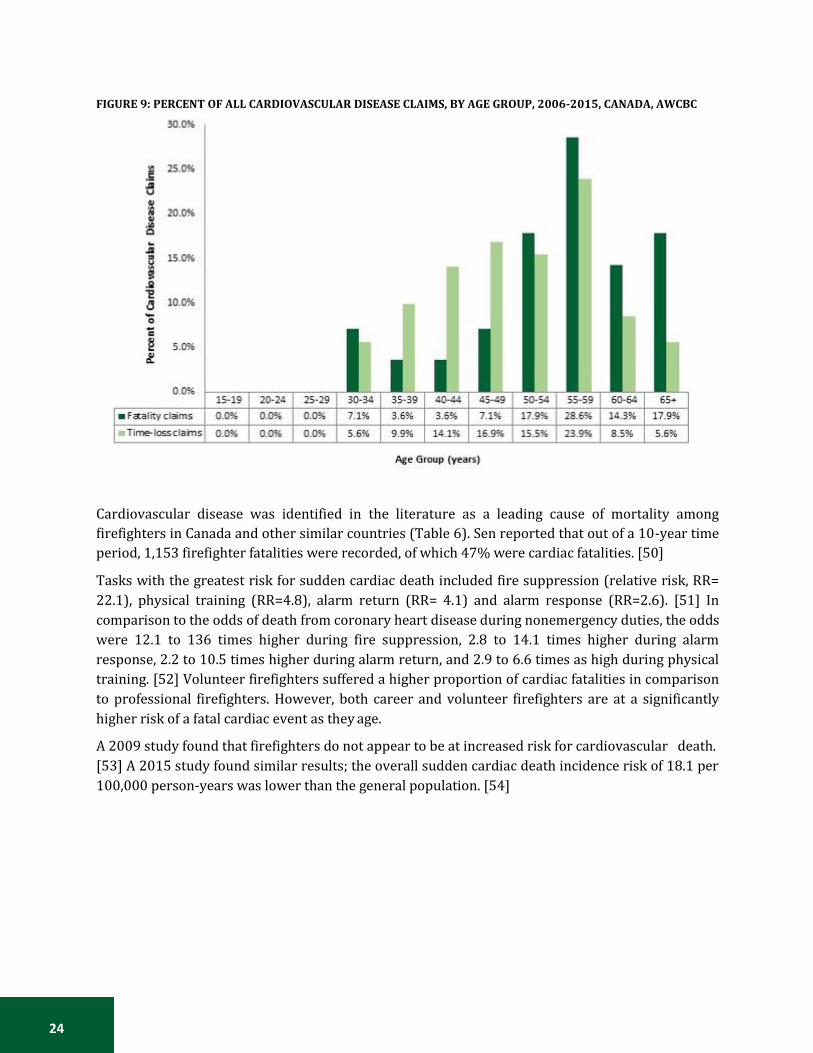
disease among firefighters was among males between the ages of 55-59 years (28.6%). Time-loss
claims from cardiovascular disease occurred most frequently between the ages of 55-59 (23.9%),
with very low number of claims submitted for males under the age of 30 (0.0%) (Figure 9).
11 Includes data from AB, BC, MB, NB, NS, ON, QC, SK, YU only 12 Includes data from AB, BC, MB, NB, NS, ON, QC, SK, YU only

23
FIGURE 7: FIREFIGHTER CARDIOVASCULAR DISEASE TIME-LOSS AND FATALITY CLAIMS, BY PROVINCE, 2006-
2015, AWCBCἰ
ND = No data provided *Indicates a value of 1≤ X ≤ 3 ἰNote: random allocation of suppressed numbers was completed; therefore the numbers represented here may not reflect the true numbers from the raw data. Refer to Appendix A for further information. FIGURE 8: CARDIOVASCULAR DISEASE TIME-LOSS AND FATALITY CLAIMS AVERAGE ANNUAL RATES PER 100,000
FIREFIGHTER POPULATION BY PROVINCE, 2006-2015, AWCBCἰ
ND = No data provided ἰNote: random allocation of suppressed numbers was completed; therefore the numbers represented here may not reflect the true numbers from the raw data. Refer to Appendix A for further information.
ND ND ND
24
FIGURE 9: PERCENT OF ALL CARDIOVASCULAR DISEASE CLAIMS, BY AGE GROUP, 2006-2015, CANADA, AWCBC
Cardiovascular disease was identified in the literature as a leading cause of mortality among
firefighters in Canada and other similar countries (Table 6). Sen reported that out of a 10-year time
period, 1,153 firefighter fatalities were recorded, of which 47% were cardiac fatalities. [50]
Tasks with the greatest risk for sudden cardiac death included fire suppression (relative risk, RR=
22.1), physical training (RR=4.8), alarm return (RR= 4.1) and alarm response (RR=2.6). [51] In
comparison to the odds of death from coronary heart disease during nonemergency duties, the odds
were 12.1 to 136 times higher during fire suppression, 2.8 to 14.1 times higher during alarm
response, 2.2 to 10.5 times higher during alarm return, and 2.9 to 6.6 times as high during physical
training. [52] Volunteer firefighters suffered a higher proportion of cardiac fatalities in comparison
to professional firefighters. However, both career and volunteer firefighters are at a significantly
higher risk of a fatal cardiac event as they age.
A 2009 study found that firefighters do not appear to be at increased risk for cardiovascular death.
[53] A 2015 study found similar results; the overall sudden cardiac death incidence risk of 18.1 per
100,000 person-years was lower than the general population. [54]

25
TABLE 6: SELECTED ARTICLES- CAUSES OF INJURY AND DEATH AMONG FIREFIGHTERS: CARDIOVASCULAR DISEASE
Lead Authors
Title Objective Results
Drew- Cardiovascular The purpose of this study was to Cardiovascular risk profiles of Nord DC risk factors identify cardiovascular disease risk firefighters are similar to those of (2009) among career factors among professional the general population. The [53] firefighters. firefighters in North America
through an extensive literature literature indicates that firefighters do not appear to be at
review. increased risk for cardiovascular
death. The overall data do not
suggest that firefighters are at
increased risk for CVD.
Farioli A Duty-related risk To investigate duty-related sudden SCD risk - fire suppression: RR = (2014) of sudden cardiac cardiac death among U.S. firefighters 22.1, 95% CI= 14.8-32.9 [51] death among
young US aged 45 or younger. SCD risk -alarm response: RR= 2.6,
95% CI= 1.5-4.6
firefighters. SCD risk - alarm return: RR= 4.1,
95% CI= 2.7-6.2
SCD risk -physical training: RR=
4.8, 95% CI= 3.2-7.2
Farioli A Incidence of This study investigated the incidence Overall SCD: IR=18.1 per 100 000 (2015) sudden cardiac of sudden cardiac death among U.S. person-years [54] death in a young
active population. male career firefighters. SCD (18 to 24 years): IR= 3.8 per
100 000 person-years
SCD (55 to 64 years): IR= 45.2 per
100 000 person-years
IRs among firefighters were lower
than those observed among the US
general population and US
military personnel.
Kales SN Emergency duties This study examined duty-specific SCD % - fire suppression: 32.1% (2007) and deaths from risks of death from coronary heart SCD % -alarm response: 13.4% [52] heart disease
among firefighters disease among on-duty U.S. firefighters from 1994 to 2004.
SCD % - alarm return: 17.4% SCD % -physical training: 12.5%
in the U.S. SCD %- non-fire emergencies:
9.4%
SCD %- nonemergency duties:
15.4%
As compared with the odds of
death from coronary heart disease
during nonemergency duties, the
odds were 12.1 to 136 times as
high during fire suppression, 2.8
to 14.1 times as high during alarm
response, 2.2 to 10.5 times as high
during alarm return, and 2.9 to 6.6
times as high during physical
training.

26
Lead Authors
Title Objective Results
Kales SN Firefighters and We sought to identify occupational SCD risk - fire suppression: OR = (2003) on-duty deaths and personal risk factors associated 64.1, 95% CI= 7.4-556 [55] from coronary
heart disease: A with on-duty coronary heart disease death.
SCD risk -alarm response: OR = 5.6, 95% CI= 1.1-28.8
case control SCD risk - alarm return: OR= 3.4,
study. 95% CI= 0.8-14.7
SCD risk -physical training: OR =
7.6, 95% CI= 1.8-31.3
Sen S Cardiac fatalities This study analyzed the Firefighter A total of 1153 firefighter fatalities (2016) in firefighters: An Fatalities and Statistics data occurred during the 10-year
[50] analysis of the U.S. fire
collected by the U.S. Fire Administration from January 2002 to
period reviewed. Of these, 47% were cardiac fatalities. Volunteer
administration December 2012 to determine firefighters suffered significantly
database. associations between age, firefighter higher proportion of cardiac
classification, duty-type, and cause of fatalities (62%; P <.05) followed
fatal cardiac event. by career firefighters (32%).
Additionally, cardiac fatalities
were the leading cause of death
for volunteer firefighters (54%; P
<.05). The highest proportion of
cardiac fatalities occurred on-the-
scene (29%; P <.05) followed by
after-duty fatalities (25%). Stress
and overexertion accounted for
98% of the cause of cardiac
fatalities.
Wolkow Coronary heart This study predicted the absolute CHD risk (males): 19.2% A disease risk in coronary heart disease risk in CHD risk (female): 5.1% (2014) volunteer Australian volunteer firefighters and Male [56] firefighters in
Victoria, Australia. compare the prevalence of individual coronary heart disease risk factors in
CHD risk (30-24): Mean RR: 0.6 CHD risk (35-39): Mean RR: 0.8
firefighters with age- and sex- CHD risk (40-44): Mean RR: 1.7
matched Australian population data. CHD risk (45-49): Mean RR: 3.9
CHD risk (50-54): Mean RR: 3.8
CHD risk (55-59): Mean RR: 4.3
CHD risk (60-64): Mean RR: 3.9
CHD risk (65-69): Mean RR: 3.0
CHD risk (70-74): Mean RR: 2.4
Female
CHD risk (30-24): Mean RR: 1.0
CHD risk (35-39): Mean RR: 1.5
CHD risk (40-44): Mean RR: 1.2
CHD risk (45-49): Mean RR: 1.3
CHD risk (50-54): Mean RR: 1.4
CHD risk (55-59): Mean RR: 1.2
CHD risk (60-64): Mean RR: 1.4
CHD risk (65-69): Mean RR: 1.0
CHD risk (70-74): Mean RR: 1.4
27
Lead Authors
Title Objective Results
Yang J Sudden cardiac To describe the specific pathologic- History of CVD, CHD, CHD (2013) death among anatomic causes of on-duty sudden equivalent or valvular disease: [57] firefighters <=45
years of age in the cardiac death, compare the prevalence and severity of
OR= 6.89, 95% CI= 2.87-16.5
U.S. cardiovascular disease risk factors in Irregular rhythm: OR= 0.13, 95%
sudden cardiac death fatalities with CI= 0.02-1.06
those in healthy, occupationally Abnormal findings on ECG: OR=
active firefighter controls, and 0.50, 95% CI= 0.16-1.59
compare the cardiac findings from Chest pain or shortness of breath:
the sudden cardiac death cases at OR=1.92, 95% CI= 0.46-8.01
autopsy with those of firefighters who died of on-duty on-cardiac causes.
Respiratory Disease
Firefighters may experience occupational exposure to many chemicals, gases and other substances
with negative health effects on the respiratory system. These risks are well known and fire
departments across Canada recognize the importance of breathing apparatus use and protective
equipment to minimize exposure to harmful inhalants. Examples of respiratory diseases that
firefighters are at risk for include bronchitis, pneumonia, tuberculosis, asthma, chronic obstructive
lung disease, lung cancer and mesothelioma13. Many of these diseases have latent effects and do not
manifest until many years after initial exposure.
Respiratory disease contributed to 1.8% of all fatality claims by firefighters in Canada between 2006
and 201514, at a rate of 1.4 fatalities per 100,000 Canadian firefighter population15 annually. Among
time-loss claims by Canadian firefighters, 0.2% of claims between 2006 and 2015 were due to
respiratory disease. Yearly time-loss claims for respiratory disease among firefighters occurred at a
rate of 3.0 per 100,000 firefighter population.
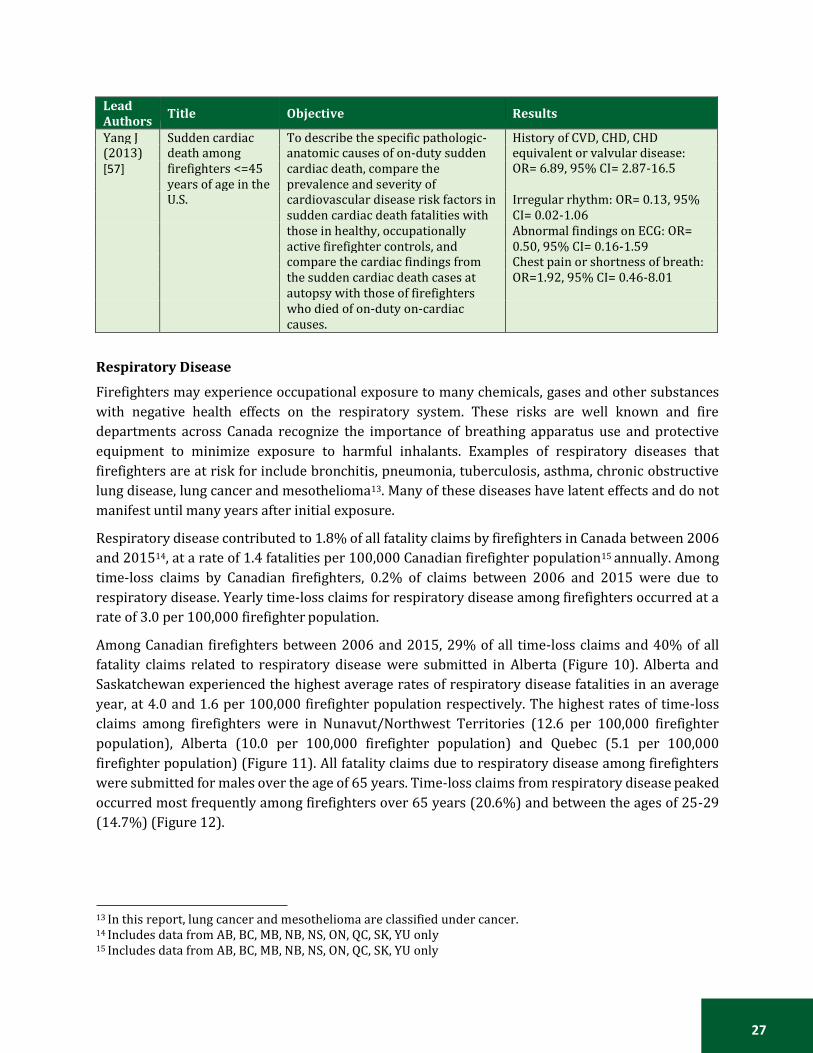
Among Canadian firefighters between 2006 and 2015, 29% of all time-loss claims and 40% of all
fatality claims related to respiratory disease were submitted in Alberta (Figure 10). Alberta and
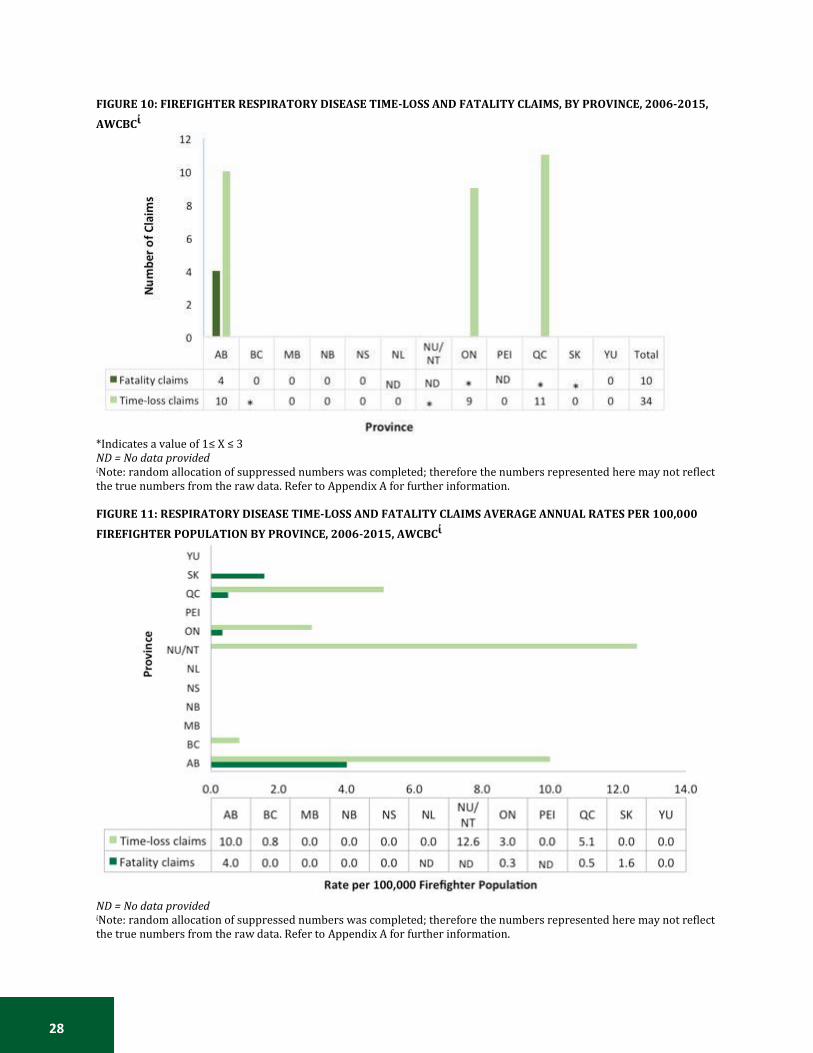
Saskatchewan experienced the highest average rates of respiratory disease fatalities in an average
year, at 4.0 and 1.6 per 100,000 firefighter population respectively. The highest rates of time-loss
claims among firefighters were in Nunavut/Northwest Territories (12.6 per 100,000 firefighter
population), Alberta (10.0 per 100,000 firefighter population) and Quebec (5.1 per 100,000
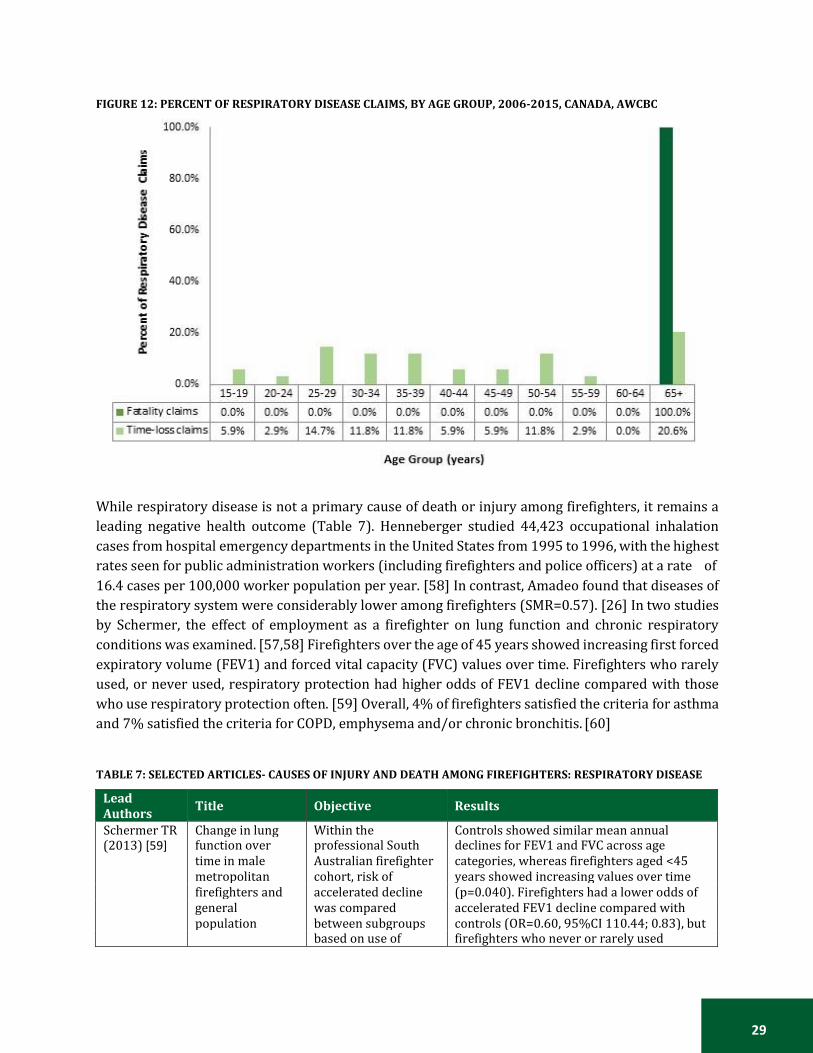
firefighter population) (Figure 11). All fatality claims due to respiratory disease among firefighters
were submitted for males over the age of 65 years. Time-loss claims from respiratory disease peaked
occurred most frequently among firefighters over 65 years (20.6%) and between the ages of 25-29
(14.7%) (Figure 12).
13 In this report, lung cancer and mesothelioma are classified under cancer. 14 Includes data from AB, BC, MB, NB, NS, ON, QC, SK, YU only 15 Includes data from AB, BC, MB, NB, NS, ON, QC, SK, YU only
28
FIGURE 10: FIREFIGHTER RESPIRATORY DISEASE TIME-LOSS AND FATALITY CLAIMS, BY PROVINCE, 2006-2015,
AWCBCἰ
*Indicates a value of 1≤ X ≤ 3 ND = No data provided ἰNote: random allocation of suppressed numbers was completed; therefore the numbers represented here may not reflect the true numbers from the raw data. Refer to Appendix A for further information. FIGURE 11: RESPIRATORY DISEASE TIME-LOSS AND FATALITY CLAIMS AVERAGE ANNUAL RATES PER 100,000
FIREFIGHTER POPULATION BY PROVINCE, 2006-2015, AWCBCἰ
ND = No data provided ἰNote: random allocation of suppressed numbers was completed; therefore the numbers represented here may not reflect the true numbers from the raw data. Refer to Appendix A for further information.
29
FIGURE 12: PERCENT OF RESPIRATORY DISEASE CLAIMS, BY AGE GROUP, 2006-2015, CANADA, AWCBC
While respiratory disease is not a primary cause of death or injury among firefighters, it remains a
leading negative health outcome (Table 7). Henneberger studied 44,423 occupational inhalation
cases from hospital emergency departments in the United States from 1995 to 1996, with the highest
rates seen for public administration workers (including firefighters and police officers) at a rate of
16.4 cases per 100,000 worker population per year. [58] In contrast, Amadeo found that diseases of
the respiratory system were considerably lower among firefighters (SMR=0.57). [26] In two studies
by Schermer, the effect of employment as a firefighter on lung function and chronic respiratory
conditions was examined. [57,58] Firefighters over the age of 45 years showed increasing first forced
expiratory volume (FEV1) and forced vital capacity (FVC) values over time. Firefighters who rarely
used, or never used, respiratory protection had higher odds of FEV1 decline compared with those
who use respiratory protection often. [59] Overall, 4% of firefighters satisfied the criteria for asthma
and 7% satisfied the criteria for COPD, emphysema and/or chronic bronchitis. [60]
TABLE 7: SELECTED ARTICLES- CAUSES OF INJURY AND DEATH AMONG FIREFIGHTERS: RESPIRATORY DISEASE
Lead Authors
Title Objective Results
Schermer TR Change in lung Within the Controls showed similar mean annual (2013) [59] function over
time in male professional South Australian firefighter
declines for FEV1 and FVC across age categories, whereas firefighters aged <45
metropolitan cohort, risk of years showed increasing values over time
firefighters and accelerated decline (p=0.040). Firefighters had a lower odds of
general was compared accelerated FEV1 decline compared with
population between subgroups controls (OR=0.60, 95%CI 110.44; 0.83), but
based on use of firefighters who never or rarely used
30
Lead Authors
Title Objective Results
controls: a 3-year follow-up study.
respiratory protection devices.
respiratory protection during fire knockdown had a higher odds of accelerated FEV1 decline compared with those who used it often or frequently (OR=2.20, 95%CI 1.02; 4.74).
Schermer TR (2014) [60]
Chronic respiratory conditions in a cohort of metropolitan firefighters: associations with occupational exposure and quality of life.
To provide a cross- sectional cohort analysis on respiratory symptoms, medical conditions, occupational tasks and exposures and consistency of using respiratory protection among South Australian professional firefighters.
24 (4%) fulfilled the criteria for asthma, 39 (7%) for COPD/emphysema/chronic bronchitis. Firefighters with asthma were older than those in the other two subgroups and had been employed in the fire service longer. Respiratory subgroups did not differ in their involvement in fire-fighting tasks. Ninety-one percent of firefighters reported relevant occupational exposure in the past year. Mean PCS-12 scores for firefighters with no chronic respiratory conditions, asthma and COPD/emphysema/bronchitis were 52.0 (SD 6.9), 47.0 (8.5) and 48.1 (9.4). For PCS-12 (but not for MCS-12), interaction between having a chronic respiratory condition and inconsistent use of respiratory protection during fire knockdown was observed (p < 0.001).
Henneberger PK (2000) [58]
Nonfatal work- related inhalations: surveillance data from hospital emergency departments, 1995-1996.
To analyze data from the National Electronic Injury Surveillance System (NEISS) on all work- related injuries and illnesses, regardless of product involvement, in the U.S.
There were an estimated 44,423 occupational inhalation cases nationwide, with an annual rate of 3.6 cases/10(4) workers/year. The rate for men (4.4 cases/10(4)) was greater than that observed for women (2.6 cases/10(4)), and the rates tended to decline with increasing age. An estimated 4.6% of the cases were hospitalized for further treatment. The highest rate by industry was 16.4 cases/10(4) for public administration (which included fire and police departments). Among non-firefighters, there were an estimated 6,470 cases nationwide in which respiratory symptoms or conditions were noted, which yielded an annual rate of 0.5 cases/10(4) (95% CI 0.3, 0.7). Chlorine compounds were a common agent for the cases with adverse respiratory outcomes.
Amadeo B (2015) [26]
French firefighter mortality: analysis over a 30-year period.
Standardized mortality ratios were calculated for 10,829 French professional male firefighters employed in 1979 and compared with the French male population between 1979-2008.
One thousand six hundred forty two deaths were identified, representing significantly lower all-cause mortality than in the general population (SMR=0.81; 95%CI: 0.77-0.85). We observed lower all and leading-cause mortality likely due to the healthy worker effect in this cohort, with diseases of the respiratory system considerably lower (SMR=0.57).
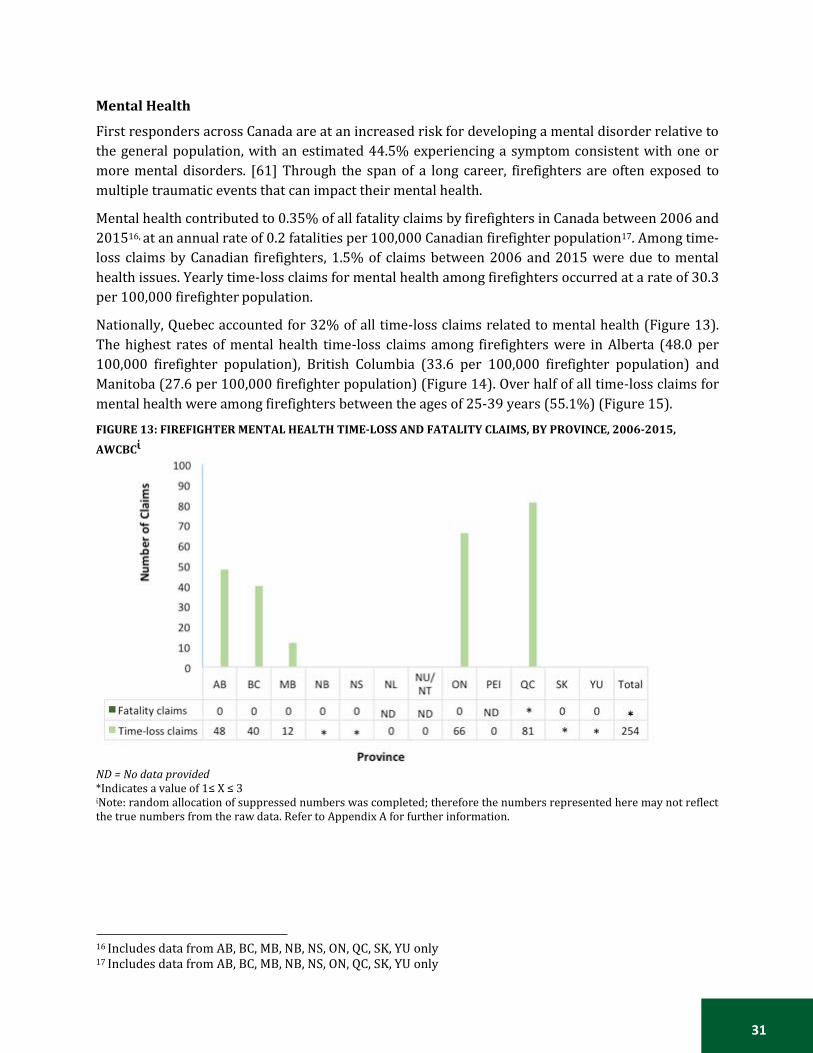
31
Mental Health
First responders across Canada are at an increased risk for developing a mental disorder relative to
the general population, with an estimated 44.5% experiencing a symptom consistent with one or
more mental disorders. [61] Through the span of a long career, firefighters are often exposed to
multiple traumatic events that can impact their mental health.
Mental health contributed to 0.35% of all fatality claims by firefighters in Canada between 2006 and
201516, at an annual rate of 0.2 fatalities per 100,000 Canadian firefighter population17. Among time-
loss claims by Canadian firefighters, 1.5% of claims between 2006 and 2015 were due to mental
health issues. Yearly time-loss claims for mental health among firefighters occurred at a rate of 30.3
per 100,000 firefighter population.
Nationally, Quebec accounted for 32% of all time-loss claims related to mental health (Figure 13).
The highest rates of mental health time-loss claims among firefighters were in Alberta (48.0 per
100,000 firefighter population), British Columbia (33.6 per 100,000 firefighter population) and
Manitoba (27.6 per 100,000 firefighter population) (Figure 14). Over half of all time-loss claims for
mental health were among firefighters between the ages of 25-39 years (55.1%) (Figure 15).
FIGURE 13: FIREFIGHTER MENTAL HEALTH TIME-LOSS AND FATALITY CLAIMS, BY PROVINCE, 2006-2015,
AWCBCἰ
ND = No data provided *Indicates a value of 1≤ X ≤ 3 ἰNote: random allocation of suppressed numbers was completed; therefore the numbers represented here may not reflect the true numbers from the raw data. Refer to Appendix A for further information.
16 Includes data from AB, BC, MB, NB, NS, ON, QC, SK, YU only 17 Includes data from AB, BC, MB, NB, NS, ON, QC, SK, YU only
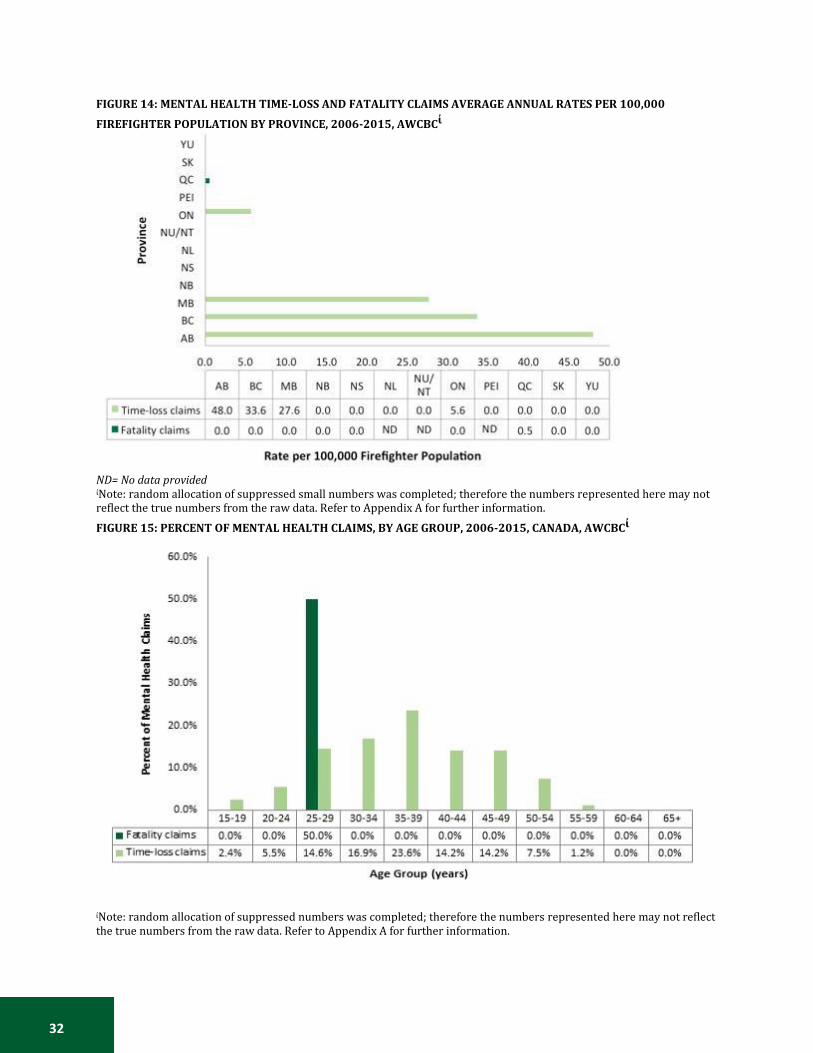
32
FIGURE 14: MENTAL HEALTH TIME-LOSS AND FATALITY CLAIMS AVERAGE ANNUAL RATES PER 100,000
FIREFIGHTER POPULATION BY PROVINCE, 2006-2015, AWCBCἰ
ND= No data provided ἰNote: random allocation of suppressed small numbers was completed; therefore the numbers represented here may not reflect the true numbers from the raw data. Refer to Appendix A for further information.
FIGURE 15: PERCENT OF MENTAL HEALTH CLAIMS, BY AGE GROUP, 2006-2015, CANADA, AWCBCἰ
ἰNote: random allocation of suppressed numbers was completed; therefore the numbers represented here may not reflect the true numbers from the raw data. Refer to Appendix A for further information.

33
Mental health is an emerging issue within the field of emergency responders, resulting in a
substantial amount of time off work (Table 8). It is quickly becoming a leading cause of time-loss
claims among firefighters due to issues such as anxiety, post-traumatic stress disorder (PTSD) and
depression. A study of 3,289 firefighters found that 13% of participants met the diagnostic criteria
for PTSD symptoms and 20% met Maslach’s criteria, which are comprised of three dimensions of
burnout: emotional exhaustion, depersonalization and personal accomplishment. [13] Qualitative
survey questions revealed that the top traumatic events among firefighters involved the death or
rescue of a child. The top internal stress factors resulting in PTSD were a pre-existing health condition
and prior personal trauma, while the top external stress factors were pressure from others and
insufficient technique. [13] In a sample of male firefighters from Brazil, 5.5% reported symptoms of
depression, with depression being more common among firefighters who reported post-traumatic
stress symptoms (OR = 12.47) and alcohol abuse (OR = 5.30). [62]
TABLE 8: SELECTED ARTICLES- CAUSES OF INJURY AND DEATH AMONG FIREFIGHTERS: MENTAL HEALTH
Lead Authors
Title Objective Results
Carey MG (2011) [63]
Sleep problems, depression, substance use, social bonding, and quality of life in professional firefighters.
Measures assessing sleep, depression, substance use, social bonding, and quality of life were examined in 112 U.S. professional firefighters.
Sleep deprivation: 59% Binge drinking behaviour: 58% Poor mental well-being: 21% Current nicotine use: 20% Hazardous drinking behaviour: 14% Depression: 11% Poor physical well-being: 8% Caffeine overuse: 5% Poor social bonding: 4%
Katsavouni F (2016) [13]
The relationship between burnout, PTSD symptoms and injuries in firefighters.
To examine the correlation between work-related injuries, burnout and post-traumatic stress disorder symptoms in firefighters.
PTSD: 13% Burnout: 20%
Kaufmann CN (2013) [64]
Mental health of protective services workers: results from the national epidemiologic survey on alcohol and related conditions.
To determine the prevalence of mental disorders in a nationally representative sample of U.S. protective services workers (PSW), compare it to that of adults in other occupations, and determine if an association exists between trauma exposure and 3-year incident psychiatric disorders in PSWs.
Alcohol abuse and dependence: 37% Depressive episodes: 15%
Stanley IH (2016) [65]
Suicide mortality among firefighters: results from a large, urban fire department.
This study aimed to describe suicide rates within the Philadelphia Fire Department (U.S.) fire department and compare firefighter suicide rates with demographically adjusted general population suicide rates.
Overall, 272 deaths were recorded; 11 (4.0%) were certified as suicides. The overall suicide rate among firefighter affiliates of the PFD between 1993 and 2014 was 11.61 per 100,000 person-years. The suicide rate among firefighters appears comparable to, and perhaps lower than,
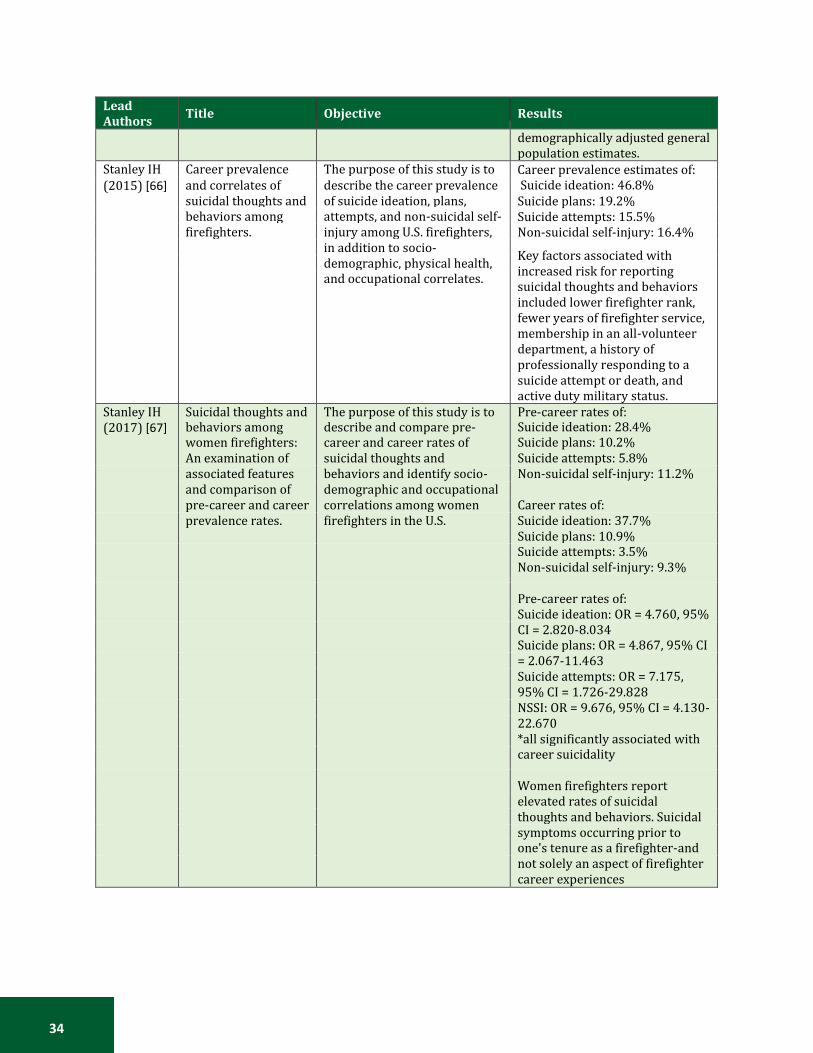
34
Lead Authors
Title Objective Results
demographically adjusted general population estimates.
Stanley IH Career prevalence The purpose of this study is to Career prevalence estimates of: Suicide ideation: 46.8% Suicide plans: 19.2% Suicide attempts: 15.5% Non-suicidal self-injury: 16.4%
Key factors associated with increased risk for reporting suicidal thoughts and behaviors included lower firefighter rank, fewer years of firefighter service, membership in an all-volunteer department, a history of professionally responding to a suicide attempt or death, and active duty military status.
(2015) [66] and correlates of suicidal thoughts and
describe the career prevalence of suicide ideation, plans,
behaviors among attempts, and non-suicidal self-
firefighters. injury among U.S. firefighters,
in addition to socio-
demographic, physical health,
and occupational correlates.
Stanley IH Suicidal thoughts and The purpose of this study is to Pre-career rates of: (2017) [67] behaviors among
women firefighters: describe and compare pre- career and career rates of
Suicide ideation: 28.4% Suicide plans: 10.2%
An examination of suicidal thoughts and Suicide attempts: 5.8%
associated features behaviors and identify socio- Non-suicidal self-injury: 11.2%
and comparison of demographic and occupational pre-career and career correlations among women Career rates of:
prevalence rates. firefighters in the U.S. Suicide ideation: 37.7%
Suicide plans: 10.9%
Suicide attempts: 3.5%
Non-suicidal self-injury: 9.3%
Pre-career rates of:
Suicide ideation: OR = 4.760, 95%
CI = 2.820-8.034
Suicide plans: OR = 4.867, 95% CI
= 2.067-11.463
Suicide attempts: OR = 7.175,
95% CI = 1.726-29.828
NSSI: OR = 9.676, 95% CI = 4.130-
22.670
*all significantly associated with
career suicidality
Women firefighters report
elevated rates of suicidal
thoughts and behaviors. Suicidal
symptoms occurring prior to
one's tenure as a firefighter-and
not solely an aspect of firefighter
career experiences

35
Volunteer Status
The AWCBC data received for analysis did not include a variable for status of employment of
firefighters; therefore it was not possible to differentiate the determinants of injury and death
between volunteer, part-time professional and full-time professional firefighters on a national scale.
The WorkSafeBC data were further analyzed to complement the national dataset and provide
information on employment status of firefighters in relation to cause of injury and death.
Among British Columbian firefighters, 21.3% of all claims related to cancer were submitted by
volunteer firefighters. Among volunteer firefighters who submitted occupational claims related to
cancer, 70% were fatality claims (Figure 16). The rate of traumatic injury among volunteer
firefighters in British Columbia was 204.9 per 100,000 firefighter population, which was lower than
the rate among professional firefighters (7,065.8 per 100,000 firefighter population). For other
primary causes of injury and death among firefighters in British Columbia, rates of injury and disease
were higher among professional firefighters than among volunteer firefighters (Figure 17).
FIGURE 16: PROPORTION OF VOLUNTEER FIREFIGHTERS, PROFESSIONAL FIREFIGHTERS AND FATAL CLAIMS, BY CAUSE, 2006-2015, BRITISH COLUMBIA, WORKSAFEBC
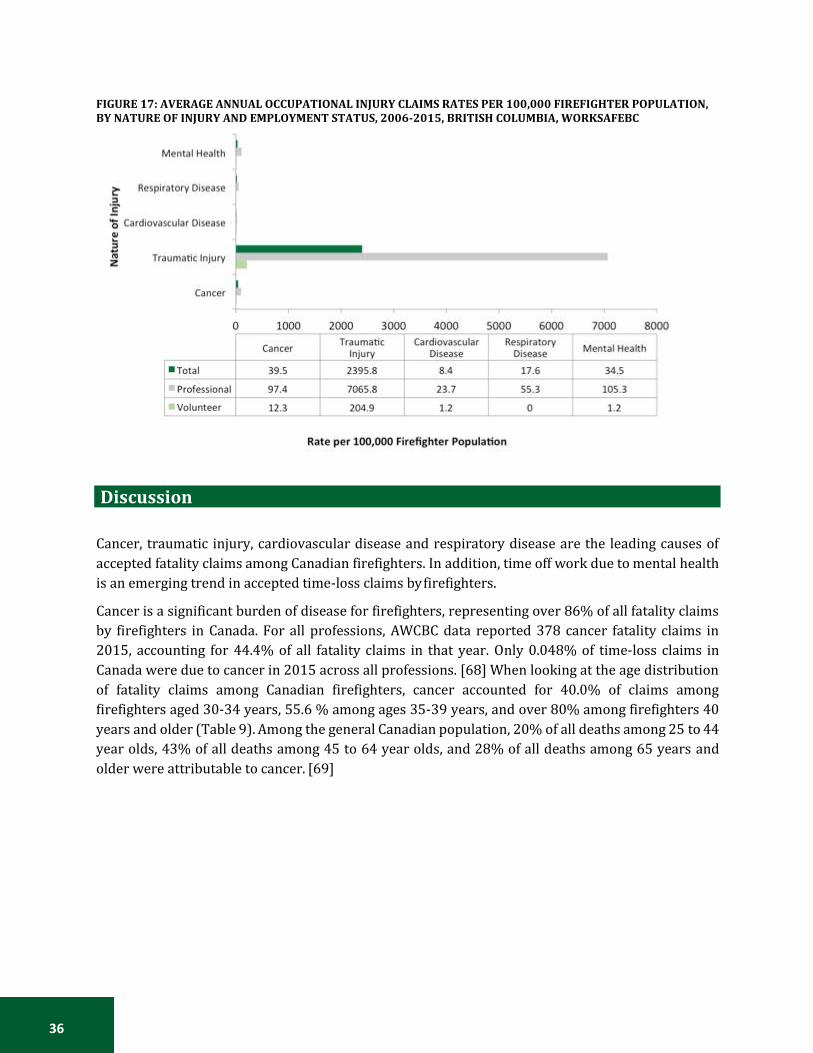
36
FIGURE 17: AVERAGE ANNUAL OCCUPATIONAL INJURY CLAIMS RATES PER 100,000 FIREFIGHTER POPULATION, BY NATURE OF INJURY AND EMPLOYMENT STATUS, 2006-2015, BRITISH COLUMBIA, WORKSAFEBC
Discussion
Cancer, traumatic injury, cardiovascular disease and respiratory disease are the leading causes of
accepted fatality claims among Canadian firefighters. In addition, time off work due to mental health
is an emerging trend in accepted time-loss claims by firefighters.
Cancer is a significant burden of disease for firefighters, representing over 86% of all fatality claims
by firefighters in Canada. For all professions, AWCBC data reported 378 cancer fatality claims in
2015, accounting for 44.4% of all fatality claims in that year. Only 0.048% of time-loss claims in
Canada were due to cancer in 2015 across all professions. [68] When looking at the age distribution
of fatality claims among Canadian firefighters, cancer accounted for 40.0% of claims among
firefighters aged 30-34 years, 55.6 % among ages 35-39 years, and over 80% among firefighters 40
years and older (Table 9). Among the general Canadian population, 20% of all deaths among 25 to 44
year olds, 43% of all deaths among 45 to 64 year olds, and 28% of all deaths among 65 years and
older were attributable to cancer. [69]
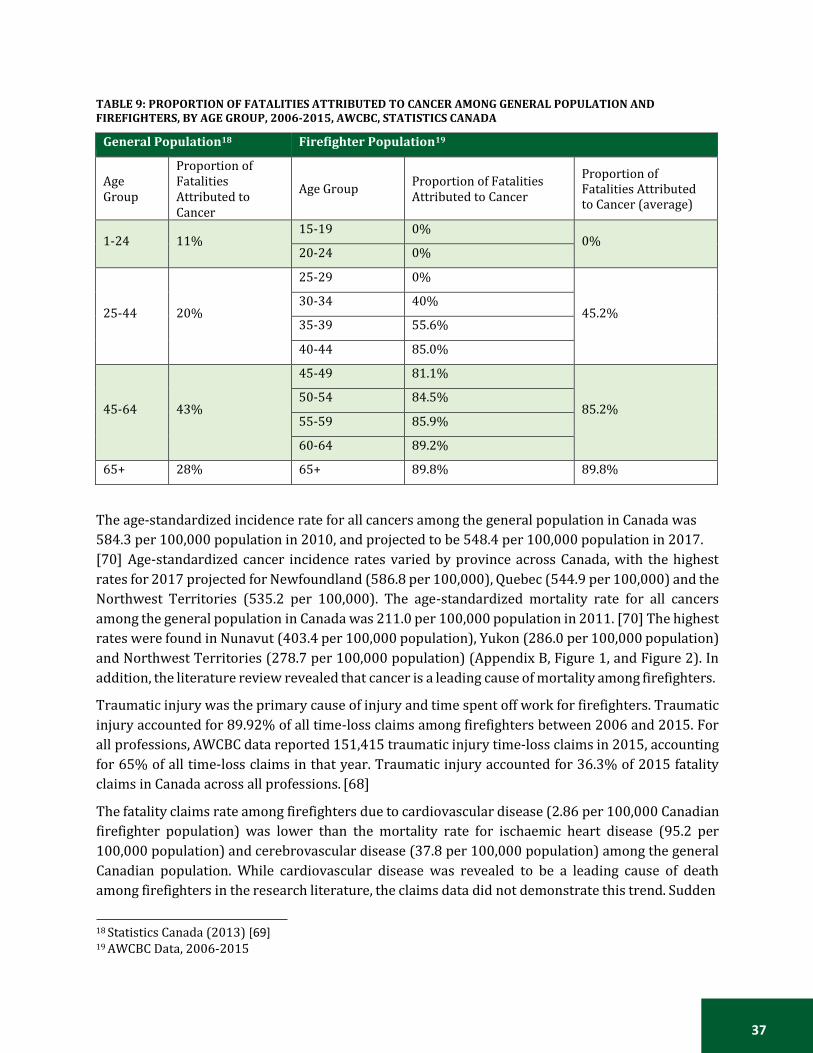
37
TABLE 9: PROPORTION OF FATALITIES ATTRIBUTED TO CANCER AMONG GENERAL POPULATION AND FIREFIGHTERS, BY AGE GROUP, 2006-2015, AWCBC, STATISTICS CANADA
General Population18 Firefighter Population19
Age Group
Proportion of Fatalities Attributed to Cancer
Age Group
Proportion of Fatalities Attributed to Cancer
Proportion of Fatalities Attributed to Cancer (average)
1-24 11% 15-19 0%
0% 20-24 0%
25-44
20%
25-29 0%
45.2% 30-34 40%
35-39 55.6%
40-44 85.0%
45-64
43%
45-49 81.1%
85.2% 50-54 84.5%
55-59 85.9%
60-64 89.2%
65+ 28% 65+ 89.8% 89.8%
The age-standardized incidence rate for all cancers among the general population in Canada was
584.3 per 100,000 population in 2010, and projected to be 548.4 per 100,000 population in 2017.
[70] Age-standardized cancer incidence rates varied by province across Canada, with the highest
rates for 2017 projected for Newfoundland (586.8 per 100,000), Quebec (544.9 per 100,000) and the
Northwest Territories (535.2 per 100,000). The age-standardized mortality rate for all cancers
among the general population in Canada was 211.0 per 100,000 population in 2011. [70] The highest
rates were found in Nunavut (403.4 per 100,000 population), Yukon (286.0 per 100,000 population)
and Northwest Territories (278.7 per 100,000 population) (Appendix B, Figure 1, and Figure 2). In
addition, the literature review revealed that cancer is a leading cause of mortality among firefighters.
Traumatic injury was the primary cause of injury and time spent off work for firefighters. Traumatic
injury accounted for 89.92% of all time-loss claims among firefighters between 2006 and 2015. For
all professions, AWCBC data reported 151,415 traumatic injury time-loss claims in 2015, accounting
for 65% of all time-loss claims in that year. Traumatic injury accounted for 36.3% of 2015 fatality
claims in Canada across all professions. [68]
The fatality claims rate among firefighters due to cardiovascular disease (2.86 per 100,000 Canadian
firefighter population) was lower than the mortality rate for ischaemic heart disease (95.2 per
100,000 population) and cerebrovascular disease (37.8 per 100,000 population) among the general
Canadian population. While cardiovascular disease was revealed to be a leading cause of death
among firefighters in the research literature, the claims data did not demonstrate this trend. Sudden
18 Statistics Canada (2013) [69] 19 AWCBC Data, 2006-2015

38
cardiac death was shown to be a primary cause of on-the-job mortality, however the claims data take
the entire life span of firefighters into account, including causes of death from aging. In 2014, the rate
of ischaemic heart disease in the general Canadian population was 95.2 per 100,000 population and
the rate for cerebrovascular disease was 37.8 per 100,000 population. [71] In addition, 29% of all
deaths in Canada result from heart disease. [72, 73] According to the Public Health Agency of Canada,
all cardiovascular disease causes occurred at an incidence rate of 1,202.2 per 100,000 population in
2005/2006. [72]
For all professions, AWCBC data reported 143 fatality claims for systemic diseases and disorders in
2015, accounting for 16.8% of all time-loss claims in that year. Systemic disease and disorders
accounted for 14,133 time-loss claims in 2015 in Canada, accounting for 6.9% of all time-loss claims
that year. The mortality rate from respiratory disease in Canada is 63.1 per 100,000 population,
compared to 1.43 per 100,000 Canadian firefighter population. For the general population between
2009 and 2011, there was an average of 63.1 deaths per 100,000 population from respiratory disease
in Canada. [74]
Mental health challenges contribute to approximately 30% of short and long-term disability claims
across all professions in Canada each year. AWCBC data showed that 1.65% of all time-loss claims
among Canadian firefighters were due to mental health reasons. While this proportion appears to be
below that of many other professions, provinces such as British Columbia and Alberta are reporting
rates of time-loss claims of 48.0 and 33.6 per 100,000 firefighter population, respectively. Mental
health factors can be attributed to an increasing number of time-loss claims among Canadian
firefighters in some provinces, which may still be underreported on a national scale. This emerging
trend should be taken seriously as mental health accounts for more than six billion dollars in lost
productivity for employers across all professions. [75]
Previous research has suggested that lower rates than the general population for particular diseases
may be a result of the healthy worker effect among firefighters. [26,32,77] The high levels of fitness
and health that are mandated for all entry-level firefighters may reduce the onset of lifestyle diseases
such as cancer, cardiovascular disease and respiratory disease. In addition, the health and fitness
requirements would also be expected to lower the risk of death from these diseases. [77] A 2003
study found that there is no convincing evidence that employment as a firefighter is associated with
increased all-cause, coronary heart disease, cancer, or respiratory disease mortality. [76] In 2015,
Amadeo observed lower all-cause mortality among firefighters, relative to the general population,
due to the healthy worker effect. [26] While an Australian study found a significant increase in overall
risk of cancer, the risk for mortality was found to be decreased as a result of the healthy worker effect
and lower smoking rates among the Australian firefighter population. [31] Firefighters may also
exhibit lower rates of cancer mortality, suggesting a healthy worker survivor effect due to increased
medical screening in the firefighter population. [32] These studies observed lower all-cause and
leading-cause mortality among firefighters, likely due to a healthy worker effect in the firefighter
population relative to the general population.
While research has shown that a healthy worker effect may exist among firefighters, AWCBC data
provides evidence for increased mortality from cancer among firefighters compared to the general
population and does not suggest that lifestyle factors of firefighters play a preventative role in
relation to cancer mortality. The data presented in this report may support a healthy worker effect,

39
particularly for respiratory and cardiovascular disease. These diseases may not appear at higher
rates within the firefighter population, however firefighters are known to be at a high risk for
stressful situations that lead to an increased risk for traumatic injury and mental health issues.
Limitations
Firefighter populations in Canada are made up of volunteer and professional firefighters in the field.
Many communities rely on volunteer firefighters to respond to emergency situations, as they do not
have their own municipal fire force. The AWCBC data does not identify the status of employment of
firefighters as a variable. Therefore, it is not possible to differentiate between volunteer, part-time
professional and full-time professional firefighters within this dataset. Volunteer firefighters are
more likely to be injured performing firefighter duties due to less training and experience. [42]
However, volunteer firefighters often perform fewer hours of firefighting duties than a professional
firefighter, resulting in less risk of injury over the life span. A limitation to this study is the inability
to separate volunteer, part-time professional and full-time professional firefighters within the data,
preventing the calculation of mortality rates by firefighter job status. Further investigation is needed
to determine the difference in time-loss and fatality claims between volunteer and professional
firefighters.
The population of firefighters used to calculate mortality and time-loss rates was the total population
of volunteer and professional firefighters. However, as explained previously, the AWCBC data do not
identify employment status of the firefighter. The assumption was made that the total population of
firefighters, volunteer and professional, encompasses the total population of firefighters who would
be eligible to submit a claim under their Workers' Compensation Board, regardless of employment
status.
Another limitation to this study is the different methods by wich each province and territory collects
and stores injury data. The national data assembled by the Association of Workers’ Compensation
Board of Canada were collected by each province and territory’s respective Workers’ Compensation
Board. Once collected, the AWCBC created a national dataset. This methodology of compiling a
national dataset allows room for error, as each province and territory may not record or collect
information the same way. In addition, some variables are not available in certain provinces (e.g.,
fatality claims data in Newfoundland).
Work-related time-loss and fatality claims data were retrieved from the AWCBC, which only includes
claims accepted by the governing Workers' Compensation Board. The results presented in this report
may underreport the number of occupational fatalities or injuries among firefighters in Canada. A
limitation of using claims data is that injuries or fatalities that were not reported to or accepted by a
provincial or territorial Workers' Compensation Board are not accounted for. Therefore, results
presented in this report may be under representative of the firefighter population. In addition,
missing values existed within the AWCBC data due to non-reporting from some provinces. The claims
data suppressed small numbers and a random assignment of values to suppressed values was
performed to complete an analysis of the data. A limitation of this process is the variability of these
values from the true data and unknown values, particularly among very specific variables and less
populous provinces.

40
Injury Surveillance Systems
Occupational surveillance serves as the foundation for improving worker safety in any occupation.
This paper shows that, firefighters are exposed to occupational hazards that increase their risk of
injury. Occupational injury and fatality surveillance methods are essential to successfully tracking
the incidence of occupational injury, analyzing trends, and determining risk for injury and death
among firefighters. Surveillance data can be used to characterize and describe the magnitude and
rate of a problem, identify situations that may cause high rates, and guide prevention efforts. [78]
It is difficult to get a complete and accurate picture of occupational injuries in Canada due to
limitations of the available surveillance systems. Currently, there is no provincial or federal database
that collects information related to all injuries or deaths that occur in the workplace. In order to
analyze data related to occupational injury and death, occupational claims data is often used.
Workers’ compensation boards and commissions across Canada collect information about accepted
time-loss injuries and fatalities. However, these data do not include all workplace injuries – only
those claims that have been accepted.
The Association of Workers' Compensation Boards of Canada helps to facilitate the exchange of
information and data between provincial and territorial Workers’ Compensation Boards and
Commissions. When an employee in Canada is injured, including firefighters, they will submit a claim
to their provincial or territorial Worker’s Compensation Board. For this reason, access to national
statistics on occupational injury and death is only available through a compilation of accepted claims
received from each province and territory. The Canadian Hospitals Injury Reporting and Prevention
Program (CHIRPP) is Canada’s principal injury surveillance program. CHIRPP collects and analyzes
data as patients are admitted into the emergency rooms of 11 pediatric and 6 general hospitals in
Canada. This surveillance system collects pre-event injury information but it does not include
information about occupation or if the injury occurred on the job. A review of surveillance tools used
to collect data on injuries in Canada is presented in Table 10. Recently, Surrey Fire Services, located
in British Columbia, implemented a Health Monitoring Organization Chart into their firefighting
workforce, which provides an example of a model for firefighter wellness. (Appendix C)

41
TABLE 10: OVERVIEW OF NATIONAL SURVEILLANCE DATA SOURCES [77]
In the United States, four primary surveillance methods are used to collect information on injury. A
2011 study looked at four surveillance systems characterizing firefighter fatalities and informing
prevention measures. [78] The Bureau of Labor Statistics’ Census of Fatal Occupational Injuries
(CFOI), the systems maintained by the United States Fire Administration (USFA) and the National
Fire Protection Association (NFPA) were three population-based surveillance systems reviewed in
this study. In addition, one case-based system, the National Institute for Occupational Safety and
Health Fire Fighter Fatality Investigation and Prevention Program (FFFIPP), was analyzed. The study
recommended that data from multiple surveillance systems improve the understanding of the risks
to firefighters.
The CFOI data system is comprised of population-based surveillance of traumatic occupational
fatalities for all occupations. However, this system does not include data on medical-related fatalities
that occur on the job. The USFA data system uses population-based data on traumatic and medical
on-duty firefighter fatalities. USFA receives a voluntary notification as soon as an occupational-
related fatality occurs. The final population-based surveillance system, NFPA, collects data on
traumatic and medical on-duty firefighter fatalities. The NFPA has restrictive inclusion criteria, in
comparison to the USFA, which follows the Hometown Heroes Act, resulting in decreased reporting
on heart attack and stroke cases among firefighters. Finally, the FFFIPP data system is a case-based
surveillance system on firefighter fatalities, using on-site investigations of selective firefighter on-
duty deaths. [79]
The World Health Organization has developed tools to collect data on injuries. The Injuries and
Violence Prevention Department has collaborated with agencies across the world and collaborated
to create the International Classification for External Causes of Injuries, a classification system for

42
injuries that adds to the existing International Classification of Diseases. This system provides
guidance on how to classify and code injury data based on international standards, and set up
systems for collecting, coding and processing data. The goal of this program is to provide better
information about injuries and create prevention programs to reduce the incidence of death and
disability due to injuries. [80]
Conclusion
The findings in this report present further evidence for the risks involved with the occupation of
firefighting. Between 2006 and 2015, cancer was the leading cause of fatality claims among Canadian
firefighters, while traumatic injury was the leading cause of time-loss claims among firefighters
during this time period. Mental health was also a leading cause of time-loss claims in BC, Alberta and
Manitoba, and represents an emerging trend towards a growing number of lost days of work among
emergency responders. Future studies that continue to explore the relationship between the
firefighter profession and injury should seek to improve our understanding of injury risks in the fire
service by employment status.
The results of this report also provide further evidence of the need for a national firefighter injury
surveillance model. Many limitations exist to using claims data to accurately assess the injury status
of an entire profession. In order to accurately describe the causes of occupational injury and death
among firefighters and improve injury prevention mechanisms, a surveillance model must be
implemented to track each injury and fatality that occurs on the job as a firefighter.
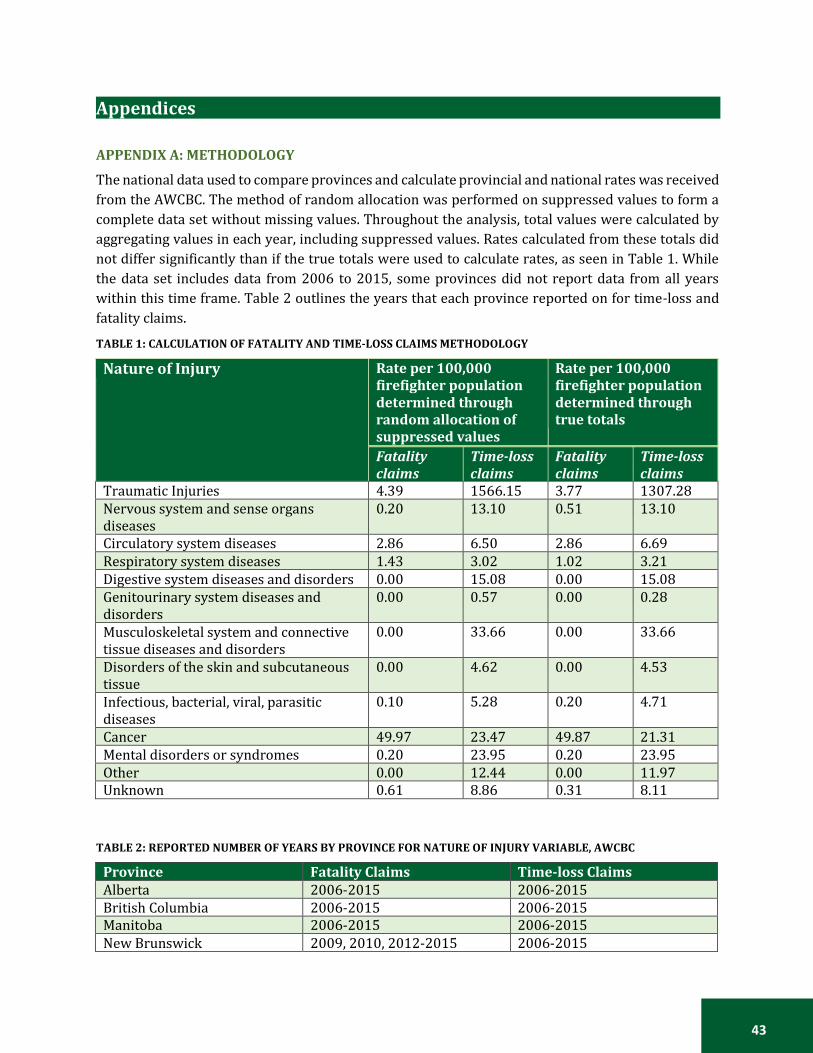
43
Appendices
APPENDIX A: METHODOLOGY
The national data used to compare provinces and calculate provincial and national rates was received
from the AWCBC. The method of random allocation was performed on suppressed values to form a
complete data set without missing values. Throughout the analysis, total values were calculated by
aggregating values in each year, including suppressed values. Rates calculated from these totals did
not differ significantly than if the true totals were used to calculate rates, as seen in Table 1. While
the data set includes data from 2006 to 2015, some provinces did not report data from all years
within this time frame. Table 2 outlines the years that each province reported on for time-loss and
fatality claims.
TABLE 1: CALCULATION OF FATALITY AND TIME-LOSS CLAIMS METHODOLOGY
Nature of Injury Rate per 100,000 firefighter population determined through random allocation of suppressed values
Rate per 100,000 firefighter population determined through true totals
Fatality claims
Time-loss claims
Fatality claims
Time-loss claims
Traumatic Injuries 4.39 1566.15 3.77 1307.28 Nervous system and sense organs diseases
0.20 13.10 0.51 13.10
Circulatory system diseases 2.86 6.50 2.86 6.69 Respiratory system diseases 1.43 3.02 1.02 3.21 Digestive system diseases and disorders 0.00 15.08 0.00 15.08 Genitourinary system diseases and disorders
0.00 0.57 0.00 0.28
Musculoskeletal system and connective tissue diseases and disorders
0.00 33.66 0.00 33.66
Disorders of the skin and subcutaneous tissue
0.00 4.62 0.00 4.53
Infectious, bacterial, viral, parasitic diseases
0.10 5.28 0.20 4.71
Cancer 49.97 23.47 49.87 21.31 Mental disorders or syndromes 0.20 23.95 0.20 23.95 Other 0.00 12.44 0.00 11.97 Unknown 0.61 8.86 0.31 8.11
TABLE 2: REPORTED NUMBER OF YEARS BY PROVINCE FOR NATURE OF INJURY VARIABLE, AWCBC
Province Fatality Claims Time-loss Claims Alberta 2006-2015 2006-2015 British Columbia 2006-2015 2006-2015 Manitoba 2006-2015 2006-2015 New Brunswick 2009, 2010, 2012-2015 2006-2015

44
Newfoundland No data 2006-2015 Nova Scotia 2008, 2012-2015 2006-2015 Northwest Territories/ Nunavut
No data 2006-2015
Ontario 2006-2015 2006-2015 Prince Edward Island No data 2006-2011, 2013-2015 Quebec 2006-2012, 2014, 2015 2006-2015 Saskatchewan 2006-2008, 2010-2015 2006-2015 Yukon 2012 2006-2009, 2011-2015
TABLE 3: DATA ANALYSIS GROUPING BASED ON AWCBC CODING FOR NATURE OF INJURY
Analysis Grouping AWCBC Coding
Cancer
30- Neoplasms, tumors, and cancer, unspecified 31- Malignant neoplasms and tumors (cancers, carcinomas, sarcomas) 32- Benign neoplasms and tumors 33- Neoplasms and tumors of unknown properties 39- Neoplasms, tumors, and cancer, not elsewhere classified (n.e.c.)
Cardiovascular system diseases
13- Circulatory system diseases
Digestive system diseases 15- Digestive system diseases and disorders Genitourinary system diseases
16- Genitourinary system diseases and disorders
Infectious, bacterial, viral, parasitic diseases
20- Infectious and parasitic diseases, unspecified 21- Bacterial diseases 22- Viral diseases 23- Other arthropod-borne diseases 26- Infectious diseases peculiar to the intestines 29- Other infectious and parasitic diseases
Mental health 52- Mental disorders or syndromes Musculoskeletal system and connective tissue disease
17- Musculoskeletal system and connective tissue diseases and disorders
Nervous system diseases 12- Nervous system and sense organs diseases
Other
41- Symptoms 49- Other symptoms, signs and ill-defined conditions, n.e.c. 59- Other diseases, conditions and disorders, n.e.c. 80- Multiple diseases, conditions, and disorders NC- Not coded
Respiratory system diseases
14- Respiratory system diseases
Skin and subcutaneous tissue diseases
18- Disorders of the skin and subcutaneous tissue
Traumatic injuries
00- Traumatic injuries and disorders, unspecified 01- Traumatic injuries to bones, nerves, spinal cord 02- Traumatic injuries to muscles, tendons, ligaments, joints, etc. 03- Open wounds 04- Surface wounds and bruises 05- Burns 6- Intracranial injuries 7- Effects of environmental conditions 8- Multiple traumatic injuries and disorders 09- Other traumatic injuries and disorders

45
Analysis Grouping AWCBC Coding Unknown 99- Unknown
TABLE 4: DATA ANALYSIS GROUPING BASED ON WORKSAFEBC CODING FOR NATURE OF INJURY
Analysis Grouping WorkSafe BC Coding
Traumatic Injuries and Disorders
0000- Traumatic Injuries & Disorders, uns. 0100- Traumatic Injury-Bones, Nerves, Spinal cord, uns. 01100- Dislocations 01200- Fractures 01300- Traumatic Injury to Spinal cord 01400- Traumatic Injury-Nerves, except Spinal cord 01800- Multiple Traumatic Injury-Bones, Nerves, Spinal cord 01900- Traumatic Injury-Bones, Nerves, Spinal cord, n.e.c. 02000- Traumatic Injury to Muscles, Joints, etc. uns. 02100- Sprains, Strains, Tears 02101- Rotatorcuff Tear, Traumatic 02190- Sprains, Strains, Tears, n.e.c. 02190- Injury to Muscles, Tendons, Joints, etc, n.e.c. 02901- Traumatic Bursitis 02902- Traumatic Tendonitis 02903- Traumatic Epidondylitis 02904- Traumatic Capsulitis 02905- Traumatic Ganglion 02906- Traumatic Synovitis 02907- Traumatic Tenosynovitis 02908- Traumatic Myositis 02909- Traumatic Injury to Muscles, Joints, n.e.c. 03000- Open Wounds 03100- Amputation, uns. 03110- Amputation, Fingertip 03190- Amputations, n.e.c. 03200- Animal or Insect Bites 03300- Avulsions 03400- Cuts, Lacerations 03500- Enucleations 03600- Gunshot wounds 03700- Punctures, except Bites 03800- Multiple open Wounds 03900- Open Wounds, n.e.c. 04000- Surface Wounds and Bruises, uns. 04100- Abrasions, Scratches 04200- Blisters 04300- Bruises, Contusions 04400- Foreign Bodies-Superficial Splinters, Chips 04500- Friction Burns 04800- Multiple Surface Wounds And Bruises 04900- Surface Wounds And Bruises, n.e.c. 05000- Burns, uns. 05100- Chemical Burns, uns. 05101- First-Degree Chemical Burns 05102- Second-Degree Chemical Burns 05103- Third-Degree Chemical Burns 05190- Chemical Burns, n.e.c. 05200- Electrical Burns, uns. 05201- First-Degree Electrical Burns
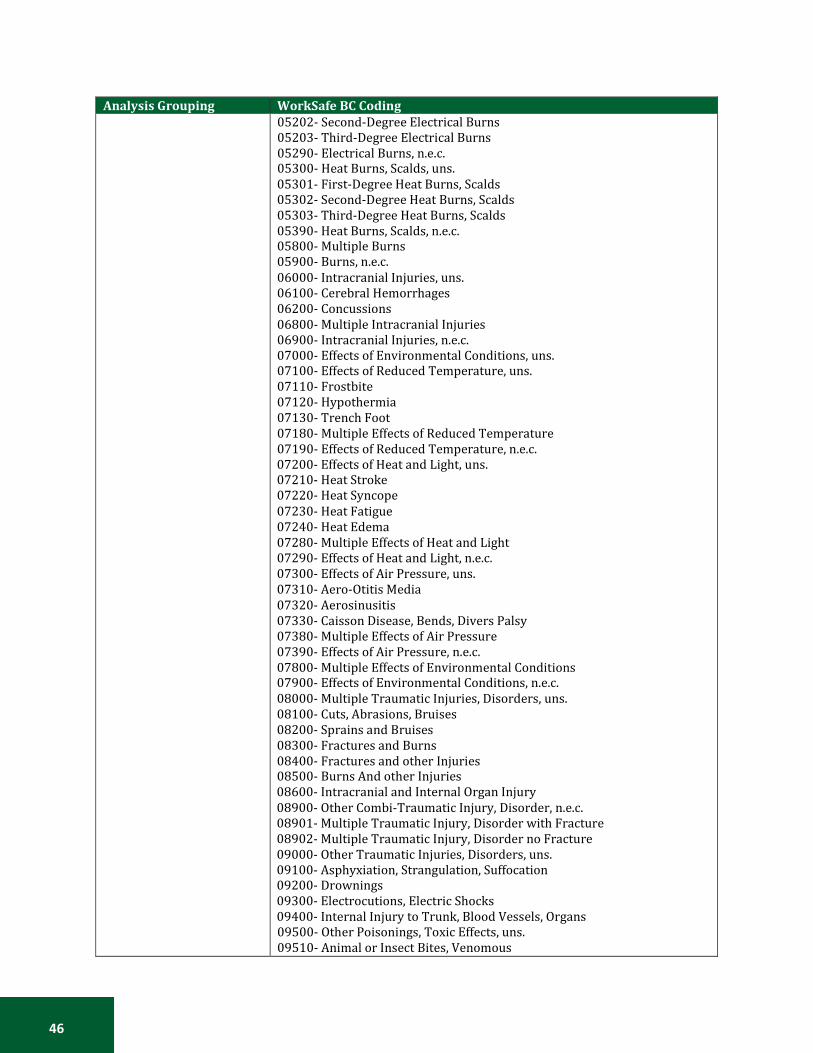
46
Analysis Grouping WorkSafe BC Coding
05202- Second-Degree Electrical Burns 05203- Third-Degree Electrical Burns 05290- Electrical Burns, n.e.c. 05300- Heat Burns, Scalds, uns. 05301- First-Degree Heat Burns, Scalds 05302- Second-Degree Heat Burns, Scalds 05303- Third-Degree Heat Burns, Scalds 05390- Heat Burns, Scalds, n.e.c. 05800- Multiple Burns 05900- Burns, n.e.c. 06000- Intracranial Injuries, uns. 06100- Cerebral Hemorrhages 06200- Concussions 06800- Multiple Intracranial Injuries 06900- Intracranial Injuries, n.e.c. 07000- Effects of Environmental Conditions, uns. 07100- Effects of Reduced Temperature, uns. 07110- Frostbite 07120- Hypothermia 07130- Trench Foot 07180- Multiple Effects of Reduced Temperature 07190- Effects of Reduced Temperature, n.e.c. 07200- Effects of Heat and Light, uns. 07210- Heat Stroke 07220- Heat Syncope 07230- Heat Fatigue 07240- Heat Edema 07280- Multiple Effects of Heat and Light 07290- Effects of Heat and Light, n.e.c. 07300- Effects of Air Pressure, uns. 07310- Aero-Otitis Media 07320- Aerosinusitis 07330- Caisson Disease, Bends, Divers Palsy 07380- Multiple Effects of Air Pressure 07390- Effects of Air Pressure, n.e.c. 07800- Multiple Effects of Environmental Conditions 07900- Effects of Environmental Conditions, n.e.c. 08000- Multiple Traumatic Injuries, Disorders, uns. 08100- Cuts, Abrasions, Bruises 08200- Sprains and Bruises 08300- Fractures and Burns 08400- Fractures and other Injuries 08500- Burns And other Injuries 08600- Intracranial and Internal Organ Injury 08900- Other Combi-Traumatic Injury, Disorder, n.e.c. 08901- Multiple Traumatic Injury, Disorder with Fracture 08902- Multiple Traumatic Injury, Disorder no Fracture 09000- Other Traumatic Injuries, Disorders, uns. 09100- Asphyxiation, Strangulation, Suffocation 09200- Drownings 09300- Electrocutions, Electric Shocks 09400- Internal Injury to Trunk, Blood Vessels, Organs 09500- Other Poisonings, Toxic Effects, uns. 09510- Animal or Insect Bites, Venomous
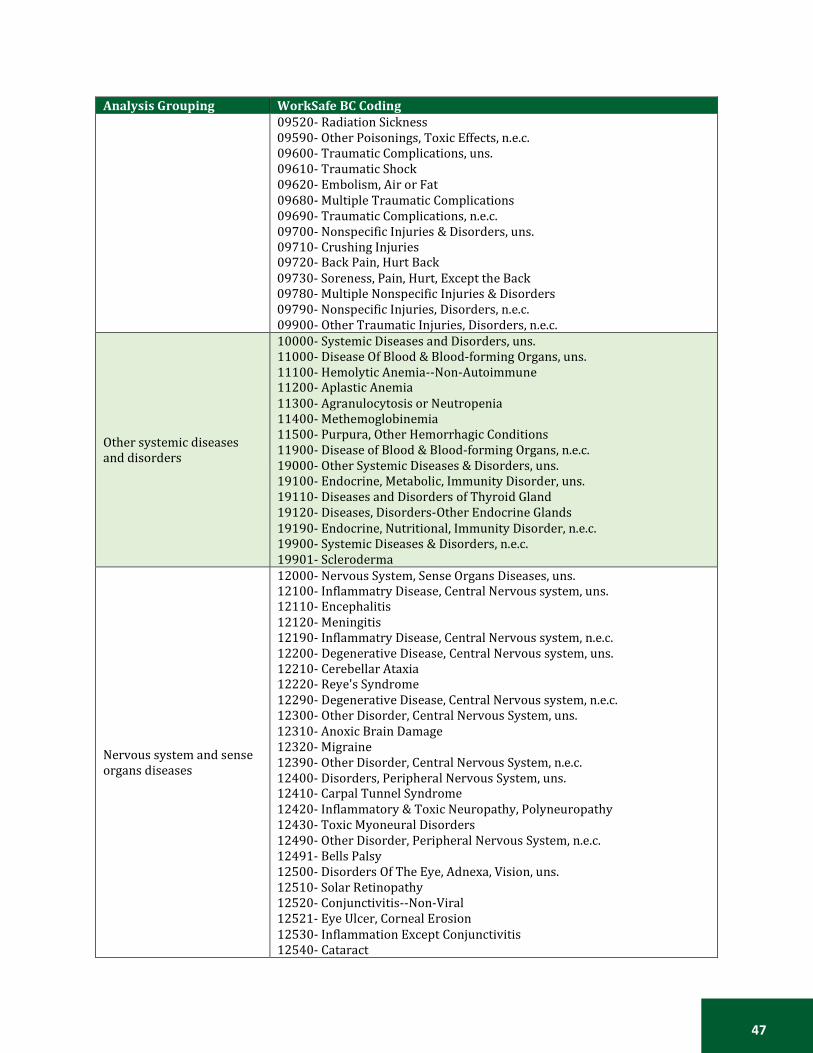
47
Analysis Grouping WorkSafe BC Coding
09520- Radiation Sickness 09590- Other Poisonings, Toxic Effects, n.e.c. 09600- Traumatic Complications, uns. 09610- Traumatic Shock 09620- Embolism, Air or Fat 09680- Multiple Traumatic Complications 09690- Traumatic Complications, n.e.c. 09700- Nonspecific Injuries & Disorders, uns. 09710- Crushing Injuries 09720- Back Pain, Hurt Back 09730- Soreness, Pain, Hurt, Except the Back 09780- Multiple Nonspecific Injuries & Disorders 09790- Nonspecific Injuries, Disorders, n.e.c. 09900- Other Traumatic Injuries, Disorders, n.e.c.
Other systemic diseases and disorders
10000- Systemic Diseases and Disorders, uns. 11000- Disease Of Blood & Blood-forming Organs, uns. 11100- Hemolytic Anemia--Non-Autoimmune 11200- Aplastic Anemia 11300- Agranulocytosis or Neutropenia 11400- Methemoglobinemia 11500- Purpura, Other Hemorrhagic Conditions 11900- Disease of Blood & Blood-forming Organs, n.e.c. 19000- Other Systemic Diseases & Disorders, uns. 19100- Endocrine, Metabolic, Immunity Disorder, uns. 19110- Diseases and Disorders of Thyroid Gland 19120- Diseases, Disorders-Other Endocrine Glands 19190- Endocrine, Nutritional, Immunity Disorder, n.e.c. 19900- Systemic Diseases & Disorders, n.e.c. 19901- Scleroderma
Nervous system and sense organs diseases
12000- Nervous System, Sense Organs Diseases, uns. 12100- Inflammatry Disease, Central Nervous system, uns. 12110- Encephalitis 12120- Meningitis 12190- Inflammatry Disease, Central Nervous system, n.e.c. 12200- Degenerative Disease, Central Nervous system, uns. 12210- Cerebellar Ataxia 12220- Reye's Syndrome 12290- Degenerative Disease, Central Nervous system, n.e.c. 12300- Other Disorder, Central Nervous System, uns. 12310- Anoxic Brain Damage 12320- Migraine 12390- Other Disorder, Central Nervous System, n.e.c. 12400- Disorders, Peripheral Nervous System, uns. 12410- Carpal Tunnel Syndrome 12420- Inflammatory & Toxic Neuropathy, Polyneuropathy 12430- Toxic Myoneural Disorders 12490- Other Disorder, Peripheral Nervous System, n.e.c. 12491- Bells Palsy 12500- Disorders Of The Eye, Adnexa, Vision, uns. 12510- Solar Retinopathy 12520- Conjunctivitis--Non-Viral 12521- Eye Ulcer, Corneal Erosion 12530- Inflammation Except Conjunctivitis 12540- Cataract

48
Analysis Grouping WorkSafe BC Coding
12550- Blindness, Low Vision 12560- Welder's Flash 12570- Glaucoma 12580- Visual Disturbances 12590- Disorders Of The Eye, Adnexa, Vision, n.e.c. 12600- Disorders: Ear, Mastoid Process, Hearing, uns. 12610- Deafness, Hearing Loss Or Impairment 12620- Tinnitis 12630- Otalgia 12640- Mastoiditis 12650- Otitis Media (Except Aero-) 12690- Disorder: Ear, Mastoid Process, Hearing, n.e.c. 12900- Nervous System, Sense Organs Disease, n.e.c.
Circulatory system diseases
13000- Circulatory System Diseases, uns. 13100- Rheumatic Fever with Heart Involvement 13200- Hypertensive Disease 13300- Ischemic Heart Disease, uns. 13310- Myocardial Infarction (Heart Attack) 13320- Angina 13390- Ischemic Heart Disease, n.e.c. 13400- Diseases of Pulmonary Circulation, uns. 13410- Pulmonary Heart Disease 13490- Diseases of Pulmonary Circulation, n.e.c 13500- Other Forms of Heart Disease, uns. 13510- Toxic Myocarditis 13520- Heart Failure 13530- Ill-Defined & Complication of Heart Disease 13590- Other Forms of Heart Disease, n.e.c. 13600- Cerebrovascular Disease, uns. 13610- Stroke 13620- Transient Ischemic Attacks 13690- Cerebrovascular Disease, n.e.c. 13700- Disease-Artery, Arteriole, Capillary, uns. 13710- Raynauds Syndrome, Phenomenon: White Finger 13720- Aneurysm--Nontraumatic 13790- Disease- Artery, Arteriole, Capillary, n.e.c 13800- Diseases Of The Veins, Lymphatics, uns. 13810- Varicose Veins 13820- Hemorrhoids 13830- Phlebitis 13890- Diseases of the Veins, Lymphatics, n.e.c 13900- Circulatory System Diseases, n.e.c. 13901- Telangiectasis (Aluminum Workers)
Respiratory system diseases
14000- Respiratory System Diseases, uns. 14100- Acute Respiratory Infection, Including Common Cold 14200- Other Disease, Upper Respiratory Tract, uns. 14210- Allergic Rhinitis 14220- Chronic Condition, Upper Respiratory Tract 14290- Other Disease, Upper Respiratory Tract, n.e.c. 14300- Pneumonia, Influenza, uns. 14310- Pneumonia 14320- Influenza 14330- Legionnaires Disease 14340- Severe Acute Respiratory Syndrome (SARS)

49
Analysis Grouping WorkSafe BC Coding
14390- Pneumonia, Influenza, n.e.c. 14400- Chronic Obstructive Pulmonary Disease, uns. 14410- Bronchitis 14420- Emphysema 14430- Extrinsic Asthma 14440- Extrinsic Allergic Alveolitis, Pneumonitis 14490- Chronic Obstructive Pulmonary Disease, n.e.c. 14491- Chronic Obstructive Lung Disease(C.O.L.D.) 14500- Pneumoconioses, uns. 14510- Coal Workers' Pneumoconiosis 14520- Asbestosis 14530- Silicosis 14540- Talcosis 14550- Aluminosis 14560- Berylliosis 14570- Siderosis 14580- Pneumoconiosis with Tuberculosis 14590- Pneumoconioses, n.e.c. 14600- Pneumonopathy, uns. 14610- Byssinosis, Mill Fever 14620- Metal Fume Fever 14690- Pneumonopathy, n.e.c. 14900- Other Respiratory Diseases, uns. 14910- Humidifier Fever 14920- Pneumonitis, n.e.c. 14930- Pulmonary Edema 14940- Pulmonary Fibrosis, n.e.c. 14950- Atelectasis, Collapsed Lung 14990- Other Respiratory System Diseases, n.e.c 14991- Reactive Airway Dysfunction Syndrome (R.A.D.S.)
Digestive and Genitourinary system diseases and disorders
15000- Digestive System Diseases, Disorders, uns. 15100- Disease: Oral Cavity, Salivary Glands, Jaws 15200- Diseases of Esophagus, Stomach, Duodenum 15300- Hernia, uns. 15310- Inguinal Hernia 15320- Hiatal Hernia 15330- Ventral Hernia 15390- Hernia, n.e.c. 15400- Noninfectious Enteritis & Colitis 15500- Other Diseases of Intestines, Peritoneum 15600- Toxic Hepatitis--Noninfective 15900- Digestive System Disease, Disorder, n.e.c, 16000- Genitourinary System Disease, Disorder, uns. 16100- Nephritis, Nephrotic Syndrome, Nephrosis, uns. 16110- Nephritis 16120- Nephrotic Syndrome 16130- Nephrosis 16190- Nephritis/Nephrotic Syndrome & Nephrosis, n.e.c. 16200- Other Diseases of Urinary System, uns. 16210- Cystitis 16230- Renal Failure 16290- Other Diseases of Urinary System, n.e.c. 16300- Diseases and Disorders-Genital Tract,uns. 16310- Infertility

50
Analysis Grouping WorkSafe BC Coding
16320- Spontaneous Abortion, Miscarriage 16390- Diseases, Disorders-Genital Tract, n.e.c. 16400- Disorders of Breast 16900- Genitourinary System Disease, Disorder, n.e.c.
Musculoskeletal system and connective tissue disease and disorders
17000- Muskuloskelsys, Connect. Tissue Disease, uns. 17100- Arthropathies, Reltd Disorders(Arthritis) 17200- Dorsopathies, uns. 17201- Dorsalgia 17202- Cervicalgia 17210- Sciatica 17220- Lumbago 17230- Disc Disorders 17231- Disloctd, Herniatd, Slippd, Rupturd Disc 17232- Intervertebral Disc Syndrome 17233- Diskarthrosis 17239- Disc Disorders, n.e.c. 17290- Dorsopathies, n.e.c. 17291- Minor Intervertebral Disorders (Mid) 17292- Facett Syndrome 17293- Radiculitis 17300- Inflam. Irritatn Of Joint/Muscle Etc uns. 17310- Bursitis (For Traumatic Use Code 02901) 17320- Synovitis 17330- Tendinitis (For Traumatic Use 02902) 17340- Tenosynovitis 17350- Ganglion/Cystic Tumor 17360- Myositis 17390- Other Inflam/Irrtn of Joint/Muscle/Tendn 17391- Rotator Cuff Syndrome 17392- Duprytren S Contracture 17393- Epicondylitis 17394- Capsulitis 17395- Trigger Finger(Excludes Traumatic 02909) 17400- Osteopthy, Chondropt, Acquird Deformts, uns. 17410- Curvature of Spine 17490- Osteopthy, Chondropt, Acquird Deform, n.e.c. 17900- Muskuloskelsys, Connect Tissue Dis, n.e.c. 17901- Fibromyalgia, Fibrositis, Myofasciitis
Disorders of the skin and subcutaneous tissue
18000- Disorders: Skin, Subcutaneous Tissue, uns. 18100- Infections: Skin, Subcutaneous Tissue, uns. 18110- Carbuncle and Furuncle 18120- Cellulitis and Abscess 18130- Acute Lymphadenitis 18140- Impetigo 18150- Pilonidal Cyst 18160- Pyoderma 18190- Infection: Skin, Subcutaneous Tissue, n.e.c. 18200- Dermatitis, uns. 18210- Atopic Dermatitis and Related Conditions 18220- Contact Dermatitis and Other Eczema 18230- Allergic Dermatitis 18240- Irritant Dermatitis 18250- Other Contact Dermatitis 18260- Dermat Due to Substance Taken Internally

51
Analysis Grouping WorkSafe BC Coding
18290- Dermatitis, n.e.c. 18300- Other Inflammatory Condition of Skin, uns. 18310- Erythematosquamous Dermatosis 18320- Bullous Dermatoses 18330- Rosacea 18340- Other Erythematous Conditions 18350- Psoriasis and Similar Disorders 18360- Lichen 18370- Pruritus and Related Conditions 18390- Other Inflammatory Conditions, n.e.c. 18400- Diseases of Sebaceous Glands, uns. 18410- Acne 18420- Sebaceous Cyst 18490- Diseases of Sebaceous Glands, n.e.c. 18900- Other Diseases, Disorders-Skin, Subcut. Tissue, uns. 18910- Corns, Callosities (Incl Callus, Clavus) 18920- Other Hypertrophic, Atrophic Conditions 18930- Diseases of Nail (Incl Ingrowing Nail) 18940- Diseases of Hair and Hair Follicles 18950- Disorder: Sweat Glands(Incl Prickly Heat) 18960- Vitiligo 18970- Chronic Skin Ulcers 18980- Urticaria, Hives 18990- Other Diseases, Diso: Skin, Subcut. Tissue, n.e.c.
Infectious and parasitic diseases
20000- Infectious & Parasitic Diseases, uns. 21000- Bacterial Diseases, uns. 21100- Tuberculoses, uns. 21110- Primary Tuberculous Infection 21120- Pulmonary Tuberculosis 21130- Miliary Tuberculosis 21190- Tuberculoses, n.e.c. 21200- Zoonotic Bacterial Diseases, uns. 21210- Plague 21220- Tularemia 21230- Anthrax 21240- Brucellosis 21250- Glanders 21260- Melioidosis 21270- Rat-Bite Fever 21290- Zoonotic Bacterial Diseases, n.e.c.. 21300- Syphilis and Other Venereal Diseases, uns. 21310- Early Syphilis 21320- Cardiovascular Syphilis 21330- Neurosyphilis 21340- Gonorrhea and Other Gonococcal Infections 21390- Syphilis & Other Venereal Diseases, n.e.c.. 21400- Other Spirochetal Diseases, uns. 21410- Leptospirosis 21420- Vincent's Angina 21430- Yaws 21440- Pinta 21490- Other Spirochetal Diseases, n.e.c.. 21900- Other Bacterial Diseases, uns. 21910- Leprosy

52
Analysis Grouping WorkSafe BC Coding
21920- Diphtheria, Whooping Cough 21930- Streptococcal Sore Throat And Scarlatina 21940- Erysipelas 21950- Meningococcal Infection 21960- Tetanus 21970- Septicemia 21980- Actinomycotic Infections 21990- Other Bacterial Diseases, n.e.c. 21991- Necrotizing Fasciitis 22000- Viral Diseases, uns. 22100- Human Immunodeficiency Virus(Hiv) Infection, uns. 22110- Acquired Immune Deficiency Syndrome(Aids) 22120- Aids-Like Syndrome, Aids-Related Complex(Arc) 22190- HIV Infection, n.e.c. 22191- Contact: Bioliquid(Body Fluid)Contamd(HIV) 22192- Contact: HIV Caused By Aggression 22193- Asymptmtc HIV + Not Otherwise Specified, Unconfirmed 22200- Non-Arthrpd-Borne Viraldis. Cnervsyst, uns. 22210- Acute Poliomyelitis 22220- Slow Virus Infection-Centrl Nerv.System 22230- Meningitis Due To Enterovirus 22240- Other Enterovirus Diseases 22290- Non-Arthrpd-Borne Viraldis. C Nervsys, n.e.c. 22300- Viral Diseas Accompanied By Exanthem, uns. 22310- Smallpox 22320- Cowpox And Paravaccinia 22330- Chickenpox 22340- Herpes Zoster 22350- Herpes Simplex 22360- Measles 22370- Rubella/German Measles 22390- Viral Disease Accompanied by Exanthem, n.e.c. 22400- Arthropod-Borne Viral Diseases, uns. 22410- Yellow Fever 22420- Dengue 22430- Viral Encephalitis 22440- Hemorrhagic Fever 22450- West Nile Viral Disease 22490- Arthropod-Borne Viral Diseases, n.e.c. 22500- Viral Hepatitis, uns. 22510- Type A Viral Hepatitis(Infectious Hepat) 22520- Type B Viral Hepatitis (Serum Hepatitis) 22530- Hepatitis C 22590- Non Type A or Type B Viral Hepatitis 22600- Viral Diseases of the Conjunctiva, uns. 22610- Trachoma 22620- Viral Conjunctivitis (Ophthalmia) 22690- Viral Diseases of the Conjunctiva, n.e.c 22900- Other Disease due to Viruses, Chlamydiae, uns. 22910- Rabies 22920- Mumps 22930- Ornithosis, Including Parrot Fever, Psittacosis 22940- Specific Diseases due to Coxsackie Virus 22950- Infectious Mononucleosis

53
Analysis Grouping WorkSafe BC Coding
22960- Cat Scratch Disease 22970- Foot and Mouth Disease 22990- Other Disease due to Virus, Chlamydiae, n.e.c 22991- Wart 23000- Other Arthropod-Borne Diseases 23100- Rickettsioses Diseases, uns. 23110- Spotted Fevers 23120- Q Fever 23130- Tick Typhus 23140- Trench Fever 23190- Rickettsioses Diseases, n.e.c. 23200- Typhus 23300- Malaria 23400- Leishmaniasis 23500- Trypanosomiasis (Including Chagas Disease) 23600- Relapsing Fever 23700- Lyme Disease 23900- Other Arthropod-Borne Diseases, n.e.c. 24000- Mycoses, uns. 24100- Dermatophytosis (Including Athletes Foot, Tinea) 24200- Dermatomycosis 24300- Candidiasis 24400- Coccidioidomycosis 24500- Histoplasmosis 24600- Blastomycotic Infection 24900- Mycoses, n.e.c. 25000- Helminthiases, uns. 25100- Schistosomiasis (Including Bilharziasis) 25200- Other Trematode Infection (Including Fluke) 25300- Echinococcosis 25400- Other Cestode Infection (Including Tapeworm) 25500- Trichinosis 25600- Filarial Infection and Dracontiasis 25700- Ancylostomiasis and Necatoriasis 25800- Unspecified Intestinal Parasitism 25900- Helminthiases, n.e.c. 26000- Infects Disease Peculiar to Intestine, uns. 26100- Cholera 26200- Typhoid and Paratyphoid Fevers 26300- Other Salmonella Infections 26400- Shigellosis 26500- Other Bacterial Food Poisoning 26600- Amebiasis 26700- Colitis 26800- Dysentery 26900- Infects Disease Peculiar To Intestine, n.e.c. 29000- Other Infectious, Parasitic Diseases, uns. 29100- Toxoplasmosis 29200- Trichomoniasis 29300- Pediculosis, Phthirus Infestation (Lice) 29400- Acariasis (Including Scabies, Chiggers, Mites) 29500- Other Infestation Including Maggots, Jigger Disease 29600- Sarcoidosis 29900- Other Infectious, Parasitic Diseases, n.e.c.
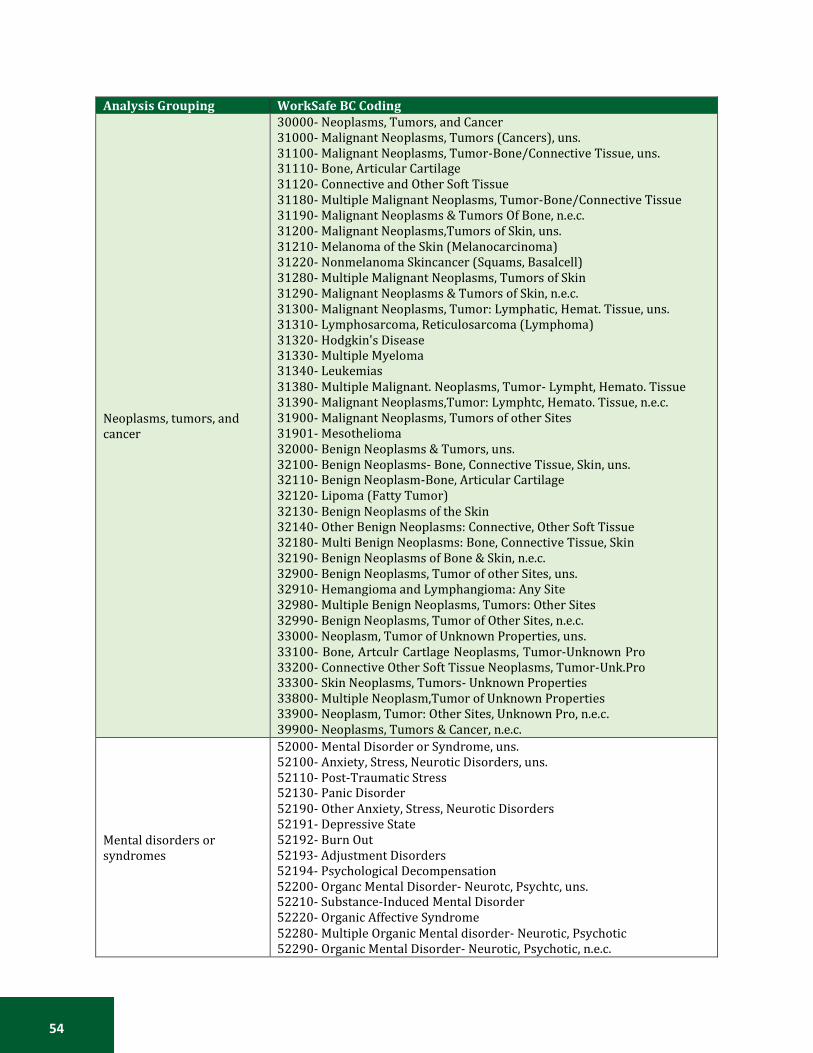
54
Analysis Grouping WorkSafe BC Coding
Neoplasms, tumors, and cancer
30000- Neoplasms, Tumors, and Cancer 31000- Malignant Neoplasms, Tumors (Cancers), uns. 31100- Malignant Neoplasms, Tumor-Bone/Connective Tissue, uns. 31110- Bone, Articular Cartilage 31120- Connective and Other Soft Tissue 31180- Multiple Malignant Neoplasms, Tumor-Bone/Connective Tissue 31190- Malignant Neoplasms & Tumors Of Bone, n.e.c. 31200- Malignant Neoplasms,Tumors of Skin, uns. 31210- Melanoma of the Skin (Melanocarcinoma) 31220- Nonmelanoma Skincancer (Squams, Basalcell) 31280- Multiple Malignant Neoplasms, Tumors of Skin 31290- Malignant Neoplasms & Tumors of Skin, n.e.c. 31300- Malignant Neoplasms, Tumor: Lymphatic, Hemat. Tissue, uns. 31310- Lymphosarcoma, Reticulosarcoma (Lymphoma) 31320- Hodgkin's Disease 31330- Multiple Myeloma 31340- Leukemias 31380- Multiple Malignant. Neoplasms, Tumor- Lympht, Hemato. Tissue 31390- Malignant Neoplasms,Tumor: Lymphtc, Hemato. Tissue, n.e.c. 31900- Malignant Neoplasms, Tumors of other Sites 31901- Mesothelioma 32000- Benign Neoplasms & Tumors, uns. 32100- Benign Neoplasms- Bone, Connective Tissue, Skin, uns. 32110- Benign Neoplasm-Bone, Articular Cartilage 32120- Lipoma (Fatty Tumor) 32130- Benign Neoplasms of the Skin 32140- Other Benign Neoplasms: Connective, Other Soft Tissue 32180- Multi Benign Neoplasms: Bone, Connective Tissue, Skin 32190- Benign Neoplasms of Bone & Skin, n.e.c. 32900- Benign Neoplasms, Tumor of other Sites, uns. 32910- Hemangioma and Lymphangioma: Any Site 32980- Multiple Benign Neoplasms, Tumors: Other Sites 32990- Benign Neoplasms, Tumor of Other Sites, n.e.c. 33000- Neoplasm, Tumor of Unknown Properties, uns. 33100- Bone, Artculr Cartlage Neoplasms, Tumor-Unknown Pro 33200- Connective Other Soft Tissue Neoplasms, Tumor-Unk.Pro 33300- Skin Neoplasms, Tumors- Unknown Properties 33800- Multiple Neoplasm,Tumor of Unknown Properties 33900- Neoplasm, Tumor: Other Sites, Unknown Pro, n.e.c. 39900- Neoplasms, Tumors & Cancer, n.e.c.
Mental disorders or syndromes
52000- Mental Disorder or Syndrome, uns. 52100- Anxiety, Stress, Neurotic Disorders, uns. 52110- Post-Traumatic Stress 52130- Panic Disorder 52190- Other Anxiety, Stress, Neurotic Disorders 52191- Depressive State 52192- Burn Out 52193- Adjustment Disorders 52194- Psychological Decompensation 52200- Organc Mental Disorder- Neurotc, Psychtc, uns. 52210- Substance-Induced Mental Disorder 52220- Organic Affective Syndrome 52280- Multiple Organic Mental disorder- Neurotic, Psychotic 52290- Organic Mental Disorder- Neurotic, Psychotic, n.e.c.
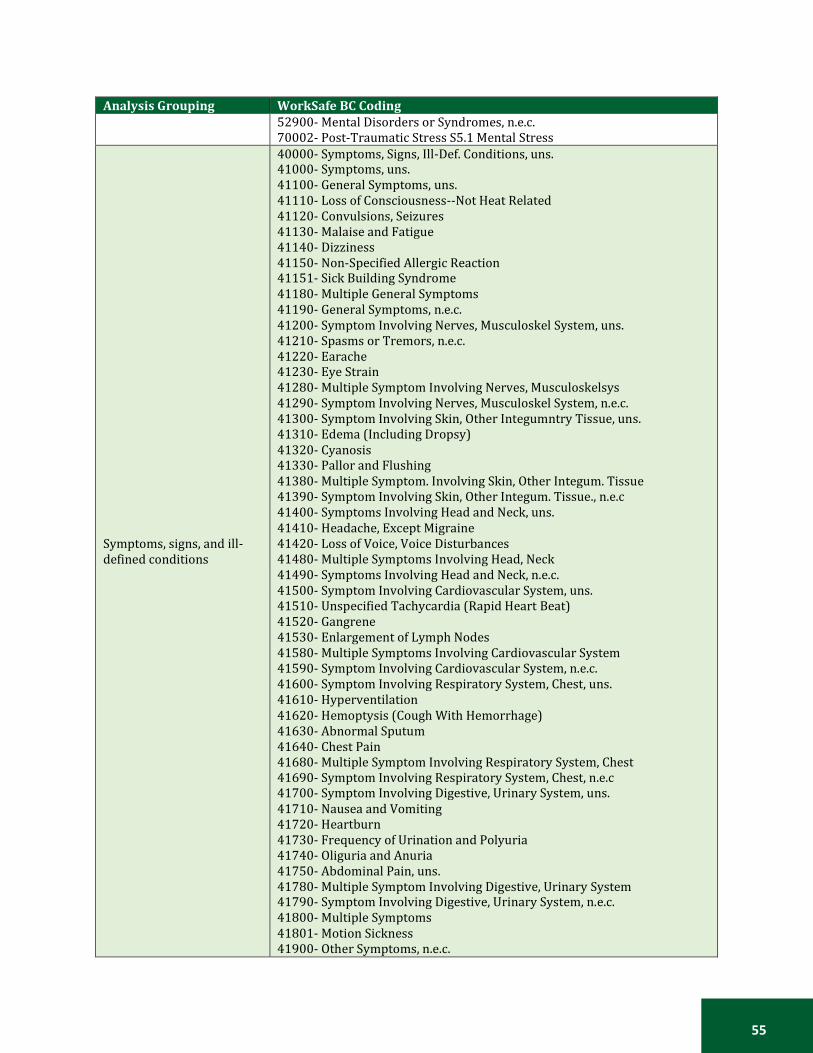
55
Analysis Grouping WorkSafe BC Coding
52900- Mental Disorders or Syndromes, n.e.c. 70002- Post-Traumatic Stress S5.1 Mental Stress
Symptoms, signs, and ill- defined conditions
40000- Symptoms, Signs, Ill-Def. Conditions, uns. 41000- Symptoms, uns. 41100- General Symptoms, uns. 41110- Loss of Consciousness--Not Heat Related 41120- Convulsions, Seizures 41130- Malaise and Fatigue 41140- Dizziness 41150- Non-Specified Allergic Reaction 41151- Sick Building Syndrome 41180- Multiple General Symptoms 41190- General Symptoms, n.e.c. 41200- Symptom Involving Nerves, Musculoskel System, uns. 41210- Spasms or Tremors, n.e.c. 41220- Earache 41230- Eye Strain 41280- Multiple Symptom Involving Nerves, Musculoskelsys 41290- Symptom Involving Nerves, Musculoskel System, n.e.c. 41300- Symptom Involving Skin, Other Integumntry Tissue, uns. 41310- Edema (Including Dropsy) 41320- Cyanosis 41330- Pallor and Flushing 41380- Multiple Symptom. Involving Skin, Other Integum. Tissue 41390- Symptom Involving Skin, Other Integum. Tissue., n.e.c 41400- Symptoms Involving Head and Neck, uns. 41410- Headache, Except Migraine 41420- Loss of Voice, Voice Disturbances 41480- Multiple Symptoms Involving Head, Neck 41490- Symptoms Involving Head and Neck, n.e.c. 41500- Symptom Involving Cardiovascular System, uns. 41510- Unspecified Tachycardia (Rapid Heart Beat) 41520- Gangrene 41530- Enlargement of Lymph Nodes 41580- Multiple Symptoms Involving Cardiovascular System 41590- Symptom Involving Cardiovascular System, n.e.c. 41600- Symptom Involving Respiratory System, Chest, uns. 41610- Hyperventilation 41620- Hemoptysis (Cough With Hemorrhage) 41630- Abnormal Sputum 41640- Chest Pain 41680- Multiple Symptom Involving Respiratory System, Chest 41690- Symptom Involving Respiratory System, Chest, n.e.c 41700- Symptom Involving Digestive, Urinary System, uns. 41710- Nausea and Vomiting 41720- Heartburn 41730- Frequency of Urination and Polyuria 41740- Oliguria and Anuria 41750- Abdominal Pain, uns. 41780- Multiple Symptom Involving Digestive, Urinary System 41790- Symptom Involving Digestive, Urinary System, n.e.c. 41800- Multiple Symptoms 41801- Motion Sickness 41900- Other Symptoms, n.e.c.
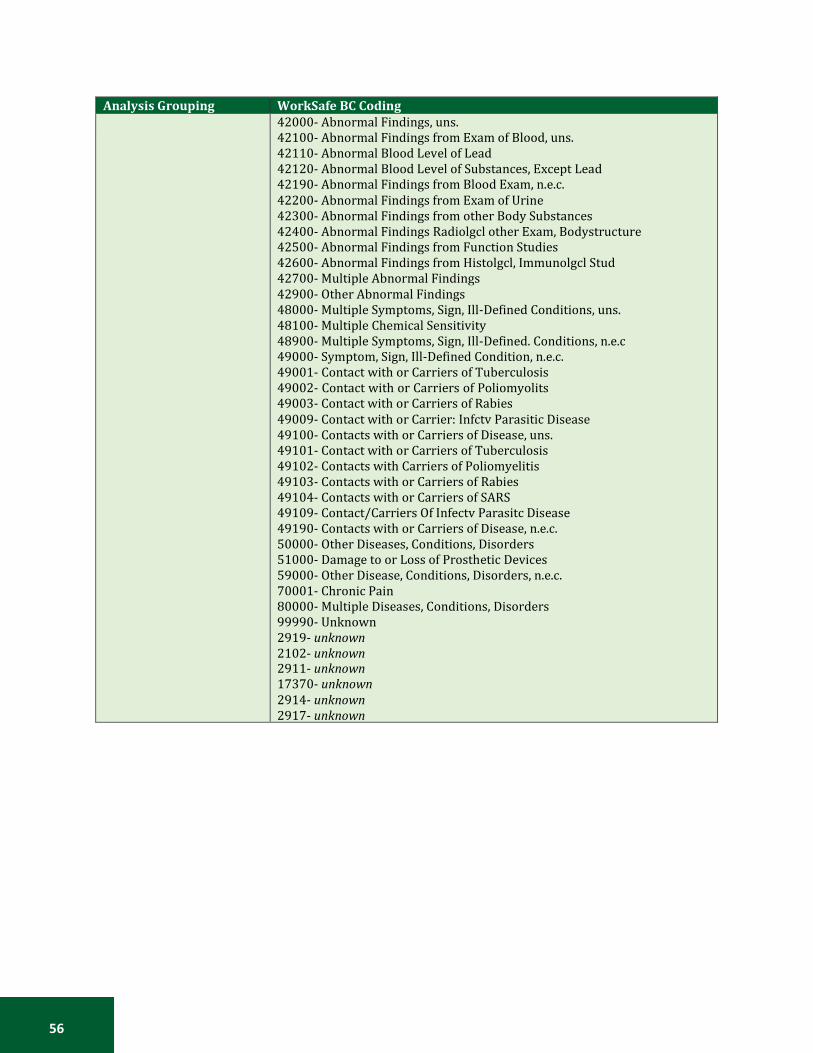
56
Analysis Grouping WorkSafe BC Coding
42000- Abnormal Findings, uns. 42100- Abnormal Findings from Exam of Blood, uns. 42110- Abnormal Blood Level of Lead 42120- Abnormal Blood Level of Substances, Except Lead 42190- Abnormal Findings from Blood Exam, n.e.c. 42200- Abnormal Findings from Exam of Urine 42300- Abnormal Findings from other Body Substances 42400- Abnormal Findings Radiolgcl other Exam, Bodystructure 42500- Abnormal Findings from Function Studies 42600- Abnormal Findings from Histolgcl, Immunolgcl Stud 42700- Multiple Abnormal Findings 42900- Other Abnormal Findings 48000- Multiple Symptoms, Sign, Ill-Defined Conditions, uns. 48100- Multiple Chemical Sensitivity 48900- Multiple Symptoms, Sign, Ill-Defined. Conditions, n.e.c 49000- Symptom, Sign, Ill-Defined Condition, n.e.c. 49001- Contact with or Carriers of Tuberculosis 49002- Contact with or Carriers of Poliomyolits 49003- Contact with or Carriers of Rabies 49009- Contact with or Carrier: Infctv Parasitic Disease 49100- Contacts with or Carriers of Disease, uns. 49101- Contact with or Carriers of Tuberculosis 49102- Contacts with Carriers of Poliomyelitis 49103- Contacts with or Carriers of Rabies 49104- Contacts with or Carriers of SARS 49109- Contact/Carriers Of Infectv Parasitc Disease 49190- Contacts with or Carriers of Disease, n.e.c. 50000- Other Diseases, Conditions, Disorders 51000- Damage to or Loss of Prosthetic Devices 59000- Other Disease, Conditions, Disorders, n.e.c. 70001- Chronic Pain 80000- Multiple Diseases, Conditions, Disorders 99990- Unknown 2919- unknown 2102- unknown 2911- unknown 17370- unknown 2914- unknown 2917- unknown
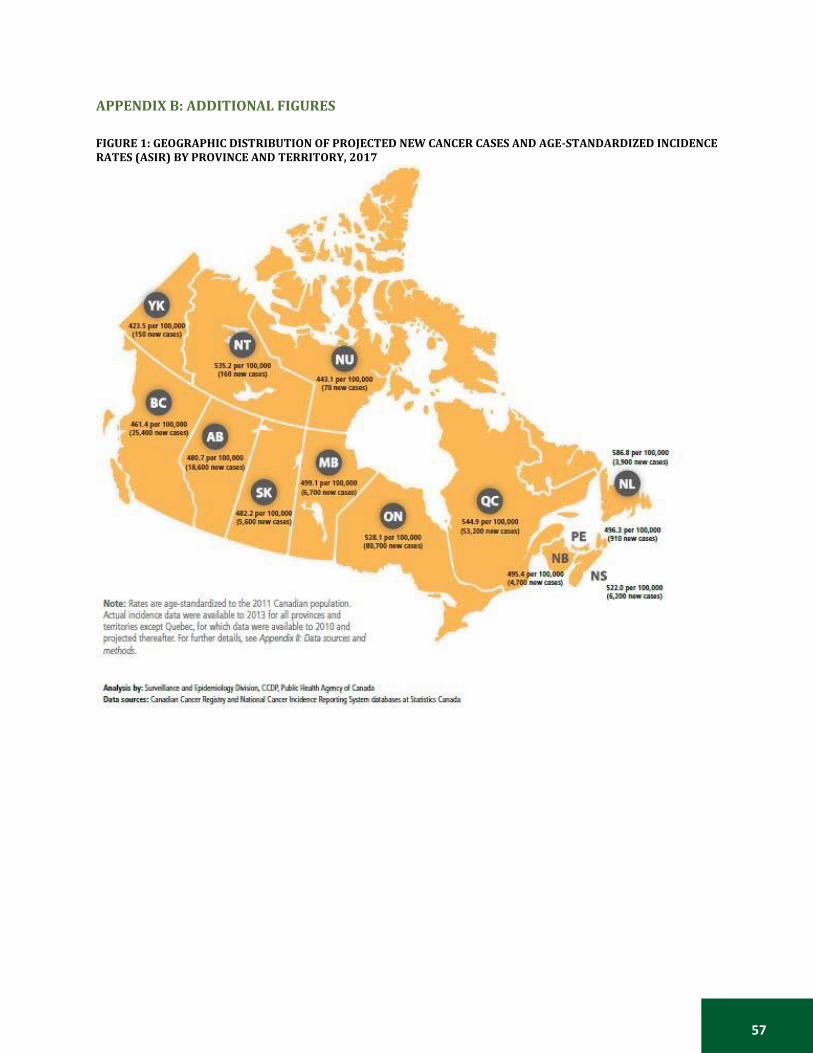
57
APPENDIX B: ADDITIONAL FIGURES
FIGURE 1: GEOGRAPHIC DISTRIBUTION OF PROJECTED NEW CANCER CASES AND AGE-STANDARDIZED INCIDENCE RATES (ASIR) BY PROVINCE AND TERRITORY, 2017

58
FIGURE 2: GEOGRAPHIC DISTRIBUTION OF PROJECTED DEATHS AND AGE-STANDARDIZED MORTALITY RATES (ASIR) BY PROVINCE AND TERRITORY, 2017
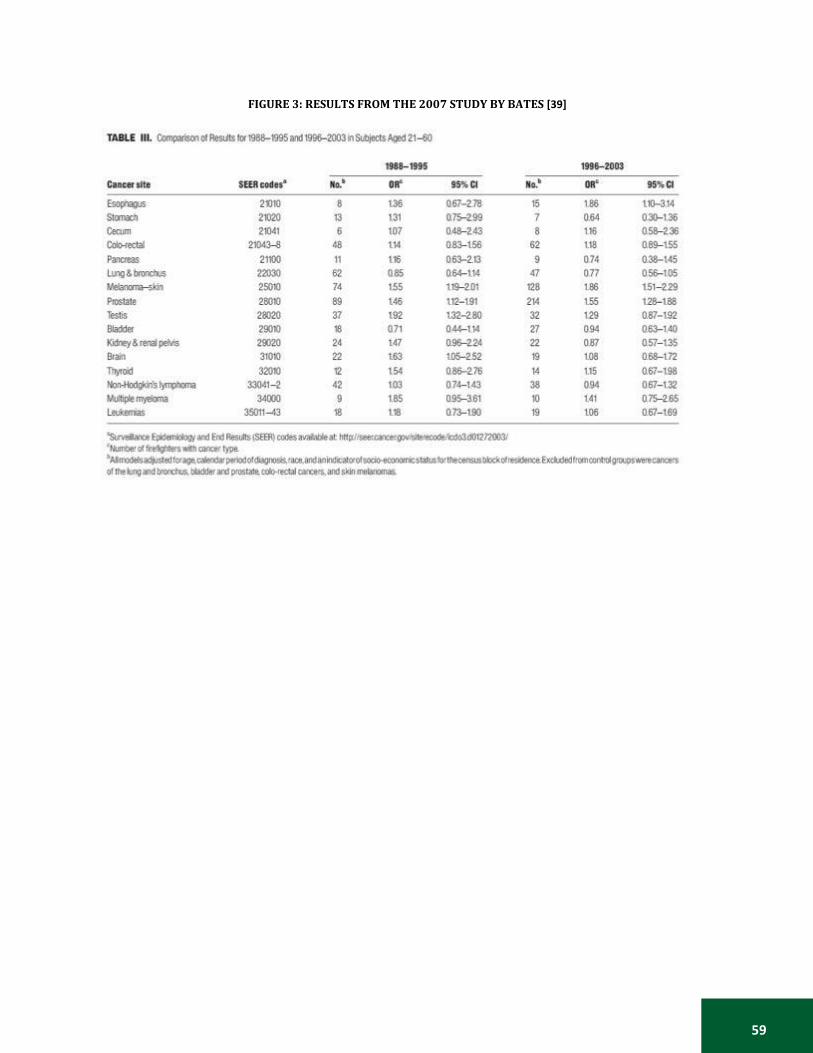
59
FIGURE 3: RESULTS FROM THE 2007 STUDY BY BATES [39]
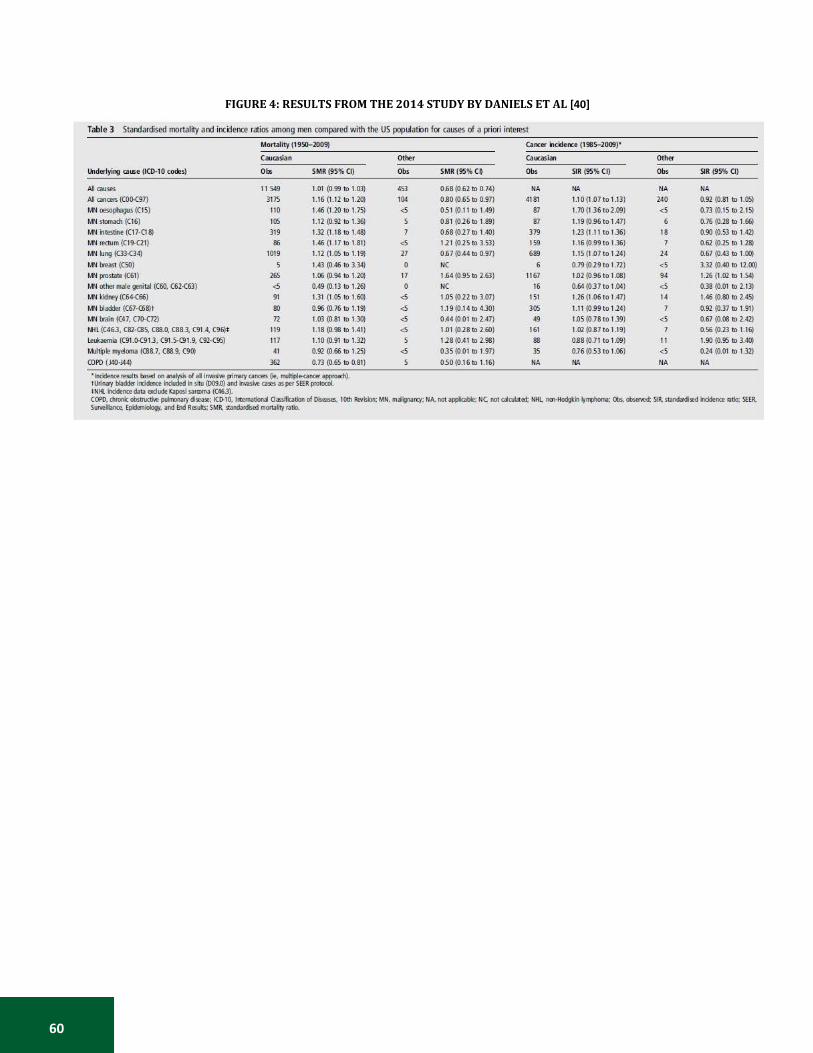
60
FIGURE 4: RESULTS FROM THE 2014 STUDY BY DANIELS ET AL [40]
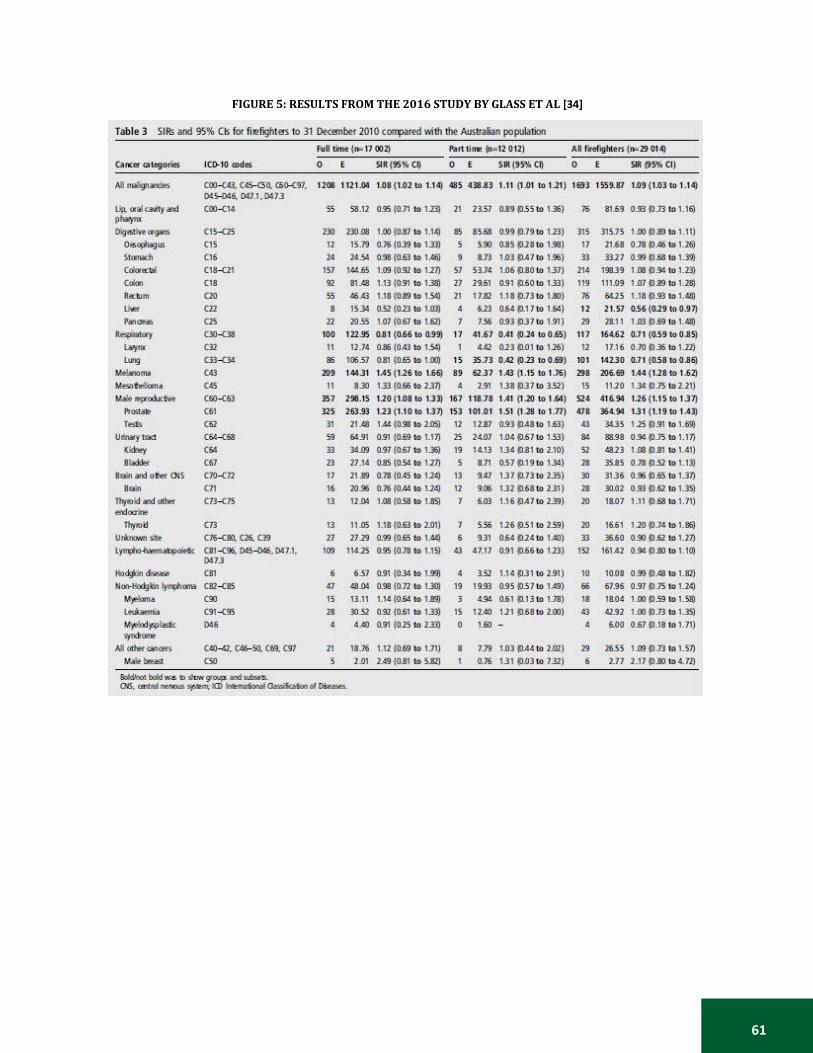
61
FIGURE 5: RESULTS FROM THE 2016 STUDY BY GLASS ET AL [34]
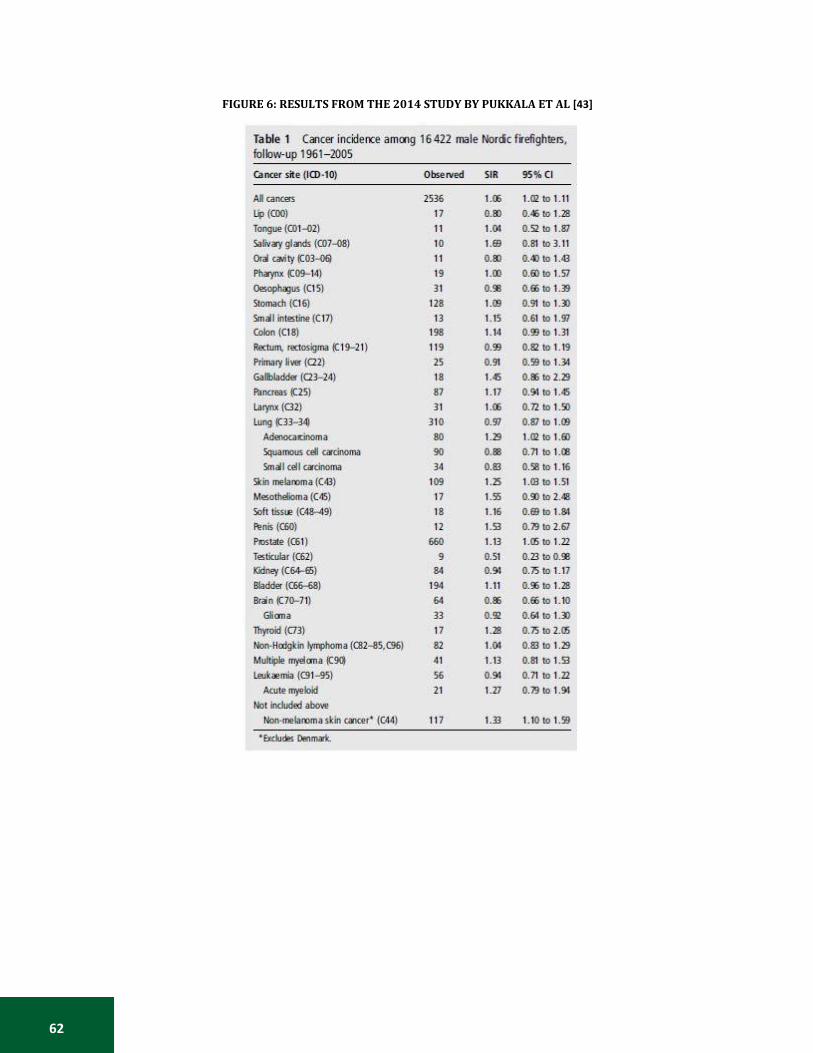
62
FIGURE 6: RESULTS FROM THE 2014 STUDY BY PUKKALA ET AL [43]
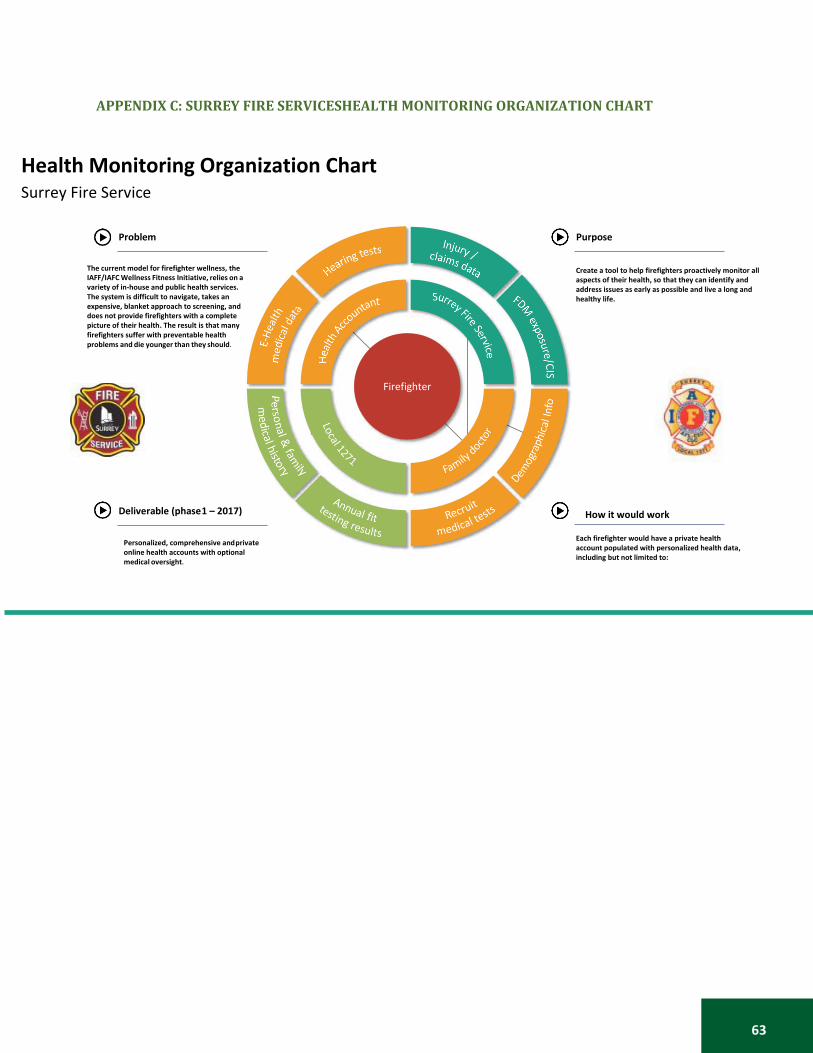
63
APPENDIX C: SURREY FIRE SERVICESHEALTH MONITORING ORGANIZATION CHART
Health Monitoring Organization Chart Surrey Fire Service
Problem Purpose
The current model for firefighter wellness, the IAFF/IAFC Wellness Fitness Initiative, relies on a variety of in-house and public health services. The system is difficult to navigate, takes an expensive, blanket approach to screening, and does not provide firefighters with a complete picture of their health. The result is that many firefighters suffer with preventable health problems and die younger than they should.
Create a tool to help firefighters proactively monitor all aspects of their health, so that they can identify and address issues as early as possible and live a long and healthy life.
Firefighter
Deliverable (phase 1 – 2017)
Personalized, comprehensive and private online health accounts with optional medical oversight.
How it would work
Each firefighter would have a private health account populated with personalized health data, including but not limited to:

64
References
[1] Government of Canada. CCOHS: Canadian Centre for Occupational Health and Safety. Available
from: http://www.ccohs.ca/ (accessed 11 November 2017).
[2] World Health Organization. Global strategy on occupational health for all: The way to health at work. Available from: http://www.who.int/occupational_health/publications/globstrategy/en/index1.html (accessed 14 November 2017).
[3] Statistics Canada. Highlights. Available from: https://www.statcan.gc.ca/pub/89-647- x/2011001/hl-fs-eng.htm#a1 (accessed 11 November 2017).
[4] The Organisation for Economic Co-operation and Development. Better Life Index. Available from: http://www.oecdbetterlifeindex.org/countries/canada/ (accessed 14 November 2017).
[5] Statistics Canada. Work injuries: Findings. Available from: http://www.statcan.gc.ca/pub/82- 003-x/2006007/article/injuries-blessures/4149017-eng.htm (accessed 11 November 2017)
[6] Government of Canada. Canadian Centre for Occupational Health and Safety. Fire Fighter : OSH Answers. Available from: http://www.ccohs.ca/ (2017, accessed 11 November 2017).
[7] WorkSafeBC. OHS Regulation: Part 31- Firefighting. Available from: https://www.worksafebc.com/en/law-policy/occupational-health-safety/searchable-ohs- regulation/ohs-regulation/part-31-firefighting (accessed 11 November 2017).
[8] Downs SH, Black N. The feasibility of creating a checklist for the assessment of the methodological quality both of randomised and non-randomised studies of health care interventions. J Epidemiol Community Health 1998; 52: 377–384.
[9] Reichard AA, Jackson LL. Occupational injuries among emergency responders. Am J Ind Med 2010; 53: 1–11.
[10] Taylor NAS, Dodd MJ, Taylor EA, et al. A Retrospective Evaluation of Injuries to Australian Urban Firefighters (2003 to 2012): Injury Types, Locations, and Causal Mechanisms. J Occup Environ Med 2015; 57: 757–764.
[11] Yoon JH, Kim YK, Kim KS, et al. Characteristics of Workplace Injuries among Nineteen Thousand Korean Firefighters. J Korean Med Sci 2016; 31: 1546–1552.
[12] Jahnke SA, Poston WSC, Haddock CK, et al. Injury among a population based sample of career firefighters in the central USA. Inj Prev 2013; 19: 393–398.
[13] Katsavouni F, Bebetsos E, Malliou P, et al. The relationship between burnout, PTSD symptoms and injuries in firefighters. Occup Med 2016; 66: 32–37.
[14] Suyama J, Rittenberger JC, Patterson PD, et al. Comparison of public safety provider injury rates. Prehospital Emerg Care Off J Natl Assoc EMS Physicians Natl Assoc State EMS Dir 2009; 13: 451–455.
65
[15] Ahn Y-S, Jeong KS. Mortality Due to Malignant and Non-Malignant Diseases in Korean Professional Emergency Responders. PLOS ONE 2015; 10: e0120305.
[16] Bos J, Mol E, Visser B, et al. Risk of health complaints and disabilities among Dutch firefighters. Int Arch Occup Environ Health; 77. Epub ahead of print August 2004. DOI: 10.1007/s00420- 004-0537-y.
[17] Hong O, Chin DL, Phelps S, et al. Occupational Injuries, Duty Status, and Factors Associated With Injuries Among Firefighters. Workplace Health Saf 2012; 60: 517–523.
[18] Britton C, Ramirez M, Lynch CF, et al. Risk of injury by job assignment among federal wildland firefighters, United States, 2003–2007. Int J Occup Environ Health 2013; 19: 77–84.
[19] Vaulerin J, d’Arripe-Longueville F, Emile M, et al. Physical exercise and burnout facets predict injuries in a population-based sample of French career firefighters. Appl Ergon 2016; 54: 131– 135.
[20] Baarts C, Mikkelsen KL, Hannerz H, et al. Use of a national hospitalization register to identify industrial sectors carrying high risk of severe injuries: a three-year cohort study of more than 900,000 Danish men. Am J Ind Med 2000; 38: 619–627.
[21] Baris D, Garrity TJ, Telles JL, et al. Cohort mortality study of Philadelphia firefighters. Am J Ind Med 2001; 39: 463–476.
[22] Mechem CC, Dickinson ET, Shofer FS, et al. Injuries from assaults on paramedics and firefighters in an urban emergency medical services system. Prehospital Emerg Care Off J Natl Assoc EMS Physicians Natl Assoc State EMS Dir 2002; 6: 396–401.
[23] Kahn SA, Woods J, Rae L. Line of Duty Firefighter Fatalities: An Evolving Trend Over Time. J Burn Care Res 2015; 36: 218–224.
[24] Ma F, Fleming LE, Lee DJ, et al. Mortality in Florida professional firefighters, 1972 to 1999. Am J Ind Med 2005; 47: 509–517.
[25] Hodous TK. Fire fighter fatalities 1998-2001: overview with an emphasis on structure related traumatic fatalities. Inj Prev 2004; 10: 222–226.
[26] Amadeo B, Marchand J-L, Moisan F, et al. French firefighter mortality: Analysis over a 30-year period. Am J Ind Med 2015; 58: 437–443.
[27] Wagner NL, Berger J, Flesch-Janys D, et al. Mortality and life expectancy of professional fire fighters in Hamburg, Germany: a cohort study 1950-2000. Environ Health Glob Access Sci Source 2006; 5: 27.
[28] Martha Dow, Kenneth Kunz, Len Garis and Larry Thomas, Firefighters and Cancer: Understanding Risk Factors in an Environment of Change, University of the Fraser Valley, Centre for Public Safety & Criminal Justice Research, 2015. (available online: https://www.ufv.ca/media/assets/criminal-justice-research/Firefighters-and-Cancer.pdf)
[29] Steenland K, Burnett C, Lalich N, et al. Dying for work: The magnitude of US mortality from selected causes of death associated with occupation. Am J Ind Med 2003; 43: 461–482.

66
[30] Straif K, Baan R, Grosse Y, et al. Carcinogenicity of shift-work, painting, and fire-fighting. Lancet Oncol 2007; 8: 1065–1066.
[31] Glass DC, Pircher S, Del Monaco A, et al. Mortality and cancer incidence in a cohort of male paid Australian firefighters. Occup Environ Med 2016; 73: 761–771.
[32] Daniels RD, Bertke S, Dahm MM, et al. Exposure-response relationships for select cancer and non-cancer health outcomes in a cohort of U.S. firefighters from San Francisco, Chicago and Philadelphia (1950-2009). Occup Environ Med 2015; 72: 699–706.
[33] Bigert C, Gustavsson P, Straif K, et al. P025 Lung cancer risk among firefighters when accounting for tobacco smoking – preliminary results from a pooled analysis of case-control studies from europe, canada, new zealand and china. Occup Env Med 2016; 73: A128–A128.
[34] Ide CW. Cancer incidence and mortality in serving whole-time Scottish firefighters 1894-2005. Occup Med 2014; 64; 421-427
[35] Ahn Y-S, Jeong K-S, Kim K-S. Cancer morbidity of professional emergency responders in Korea.
Am J Ind Med 2012; 55: 768–778.
[36] Bates MN. Registry-based case–control study of cancer in California firefighters. Am J Ind Med 2007; 50: 339–344.
[37] Daniels RD, Kubale TL, Yiin JH, et al. Mortality and cancer incidence in a pooled cohort of US firefighters from San Francisco, Chicago and Philadelphia (1950–2009). Occup Env Med 2014; 71: 388–397.
[38] LeMasters GK, Genaidy AM, Succop P, et al. Cancer Risk Among Firefighters: A Review and Meta-analysis of 32 Studies. J Occup Environ Med 2006; 48: 1189–1202.
[39] Paget-Bailly S, Guida F, Carton M, et al. Occupation and head and neck cancer risk in men: results from the ICARE study, a French population-based case-control study. J Occup Environ Med 2013; 55: 1065–1073.
[40] Pukkala E, Martinsen JI, Weiderpass E, et al. Cancer incidence among firefighters: 45 years of follow-up in five Nordic countries. Occup Environ Med 2014; 71: 398-404
[41] Tsai RJ, Luckhaupt SE, Schumacher P, et al. Risk of cancer among firefighters in California, 1988-2007. Am J Ind Med 2015; 58: 715–729.
[42] Hylton J.G. Haynes and Joseph L. Molis, United States Firefighter Injuries – 2016, October 2017, Quincy: National Fire Protection Association, Research, Data and Analytics Division. (accessed 10 December 2017).
[43] Britton C, Lynch CF, Ramirez M, et al. Epidemiology of injuries to wildland firefighters. Am J Emerg Med 2013; 31: 339–345.
[44] Clark WW, Bohl CD. Hearing levels of firefighters: risk of occupational noise–induced hearing loss assessed by cross-sectional and longitudinal data. Ear Hear 2005; 26: 327–340.
67
[45] Hong O, Samo DG. Hearing loss and use of hearing protection among career firefighters in the United States. J Occup Environ Med 2013; 55: 960–965.
[46] Public Health Agency of Canada (ed). 2009 tracking heart disease and stroke in Canada. Ottawa: Public Health Agency of Canada, 2009.
[47] Soteriades ES, Smith DL, Tsismenakis AJ, et al. Cardiovascular disease in US firefighters: a systematic review. Cardiol Rev 2011; 19: 202–215.
[48] Kales SN, Smith DL. Firefighting and the Heart: Implications for Prevention. Circulation 2017; 135: 1296–1299.
[49] Fahy RF. US Firefighter Fatalties Due to Sudden Cardiac Death, 1995-2004. Quincy MA Natl Fire Prot Assoc.
[50] Sen S, Palmieri T, Greenhalgh D. Cardiac Fatalities in Firefighters: An Analysis of the U.S. Fire Administration Database. J Burn Care Res Off Publ Am Burn Assoc 2016; 37: 191–195.
[51] Farioli A, Yang J, Teehan D, et al. Duty-related risk of sudden cardiac death among young US firefighters. Occup Med 2014; 64: 428–435.
[52] Kales SN, Soteriades ES, Christophi CA, et al. Emergency duties and deaths from heart disease among firefighters in the United States. N Engl J Med 2007; 356: 1207–1215.
[53] Drew-Nord DC, Hong O, Froelicher ES. Cardiovascular risk factors among career firefighters. AAOHN J Off J Am Assoc Occup Health Nurses 2009; 57: 415–422.
[54] Farioli A, Christophi CA, Quarta CC, et al. Incidence of Sudden Cardiac Death in a Young Active Population. J Am Heart Assoc 2015; 4: e001818.
[55] Kales SN, Soteriades ES, Christoudias SG, et al. Firefighters and on-duty deaths from coronary heart disease: a case control study. Environ Health 2003; 2: 14.
[56] Wolkow A, Netto K, Langridge P, et al. Coronary Heart Disease Risk in Volunteer Firefighters in Victoria, Australia. Arch Environ Occup Health 2014; 69: 112–120.
[57] Yang J, Teehan D, Farioli A, et al. Sudden cardiac death among firefighters ≤45 years of age in the United States. Am J Cardiol 2013; 112: 1962–1967.
[58] Henneberger P, Metayer C, Layne L, et al. Nonfatal work-related inhalations: surveillance data from hospital emergency departments, 1995-1996. Am J Ind Med 2000; 28: 140-148.
[59] Schermer TR, Malbon W, Adams R, et al. Change in lung function over time in male
metropolitan firefighters and general population controls: a 3-year follow-up study. J Occup Health 2013; 55: 267–275.
[60] Schermer TR, Malbon W, Morgan M, et al. Chronic respiratory conditions in a cohort of metropolitan fire-fighters: associations with occupational exposure and quality of life. Int Arch Occup Environ Health 2014; 87: 919–928.

68
[61] Crawford A. Researchers find significantly higher rate of mental disorders among first responders. CBC News. 2017 Aug 30 (accessed 10 December 2017)¨. Available from: http://www.cbc.ca/news/politics/police-fire-fighters-ptsd-paramedis-1.4266720.
[62] Lima Ede P,, Assuncao AA, Barreto SM. Prevalence of depression among firefighters. Cad Saude Publica 2015; 31: 733-343
[63] Carey MG, Al-Zaiti SS, Dean GE, et al. Sleep problems, depression, substance use, social
bonding, and quality of life in professional firefighters. J Occup Environ Med Coll Occup Environ Med 2011; 53: 928.
[64] Kaufmann CN, Rutkow L, Spira AP, et al. Mental Health of Protective Services Workers: Results From the National Epidemiologic Survey on Alcohol and Related Conditions. Disaster Med Public Health Prep 2013; 7: 36–45.
[65] Stanley IH, Hom MA, Joiner TE. Suicide mortality among firefighters: Results from a large, urban fire department. Am J Ind Med 2016; 59: 942–947.
[66] Stanley IH, Hom MA, Hagan CR, et al. Career prevalence and correlates of suicidal thoughts and behaviors among firefighters. J Affect Disord 2015; 187: 163–171.
[67] Stanley IH, Hom MA, Spencer-Thomas S, et al. Suicidal thoughts and behaviors among women firefighters: An examination of associated features and comparison of pre-career and career prevalence rates. J Affect Disord 2017; 221: 107–114.
[68] Association of Workers’ Compensation Boards of Canada. 2015 Injury Statistics Across Canada. Available from: http://awcbc.org/?page_id=14 (accessed 10 December 2017).
[69] Government of Canada. The 10 leading causes of death, 2013. Available from: https://www.statcan.gc.ca/pub/82-625-x/2017001/article/14776-eng.htm (accessed 20 January 2018).
[70] Canadian Cancer Society. Canadian Cancer Statistics 2017. Available from: http://www.cancer.ca/en/cancer-information/cancer-101/canadian-cancer-statistics- publication/?region=on (accessed 10 December 2017).
[71] Government of Canada. Health Status of Canadians 2016: Report of the Chief Public Health Officer - How are we unhealthy? - Cardiovascular disease. Available from:https://www.canada.ca/en/public-health/corporate/publications/chief-public-health- officer-reports-state-public-health-canada/2016-health-status-canadians/page-17-how-are- we-unhealthy-cardiovascular-disease.html (2016, accessed 10 December 2017).
[72] Government of Canada. Heart disease – heart health. Available from: https://www.canada.ca/en/public-health/services/diseases/heart-disease-heart-health.html (2013, accessed 10 December 2017).
[73] The Heart Research Institute. Facts about Heart Disease. Available from: http://www.hricanada.org/about-heart-disease/facts-about-heart-disease (accessed 10 December 2017).

69
[74] How Canada Perfoms, Mortality Due to Respiratory Diseases - Health Provincial Ranking[with data from Statistics Canada; the Conference Board of Canada]. Available from: http://www.conferenceboard.ca/hcp/provincial/health/resp.aspx (accessed 10 December 2017).
[75] Mental Health Commission of Canada. The Facts: Mental Health. Available from:vhttp://strategy.mentalhealthcommission.ca/the-facts/ (accessed 11 November 2017).
[76] Rosenstock L, Olsen J. Firefighting and death from cardiovascular causes. N Engl J Med 2007; 356: 1261–1263.
[77] Haas NS, Gochfeld M, Robson MG, et al. Latent Health Effects in Firefighters. Int J Occup Environ Health 2003; 9: 95–103.
[78] Estes CR, Marsh SM, Castillo DN. Surveillance of Traumatic Firefighter Fatalities: An Assessment of Four Systems. Public Health Rep 2011; 126: 540–551.
[79] Health Canada. Injury Surveillance in Canada: Current Realities and Challenges (2003) Available from: http://www.injuryresearch.bc.ca/docs/3_20090910_100541Report%20HC%20Inj%20Survei llance%20in%20Can%20Aug%202003.pdf (accessed 12 December 2017).
[80] World Health Organization. Injury surveillance guidelines. Available from: http://www.who.int/violence_injury_prevention/publications/surveillance/surveillance_guid elines/en/ (accessed 12 December 2017).
70
Author Biographical Information
Rachel Ramsden is a research assistant with the BC Injury Research and Prevention Unit, focusing on the research areas of public health, injury prevention and knowledge translation. She also works on community social development, evaluation and municipal policy projects with the City of Richmond. Rachel holds a Master of Public Health from the University of British Columbia. Contact her at [email protected]
Jennifer Smith is a Research Coordinator at the BC Injury Research and Prevention Unit, and Senior Program Manager for Preventable. Prior to joining Preventable in 2016, Jennifer worked with the BCIRPU on projects relating to young worker injuries, as well as road safety for child occupants and young drivers. Contact her at [email protected]
Kate Turcotte holds an MSc in Epidemiology and has been a Researcher with the BC Injury Research and Prevention Unit since 1999. Contact her at [email protected]
Len Garis is the Fire Chief for the City of Surrey, British Columbia, an Adjunct Professor in the School of Criminology and Criminal Justice & Associate to the Centre for Social Research at the University of the Fraser Valley (UFV), a member of the Affiliated Research Faculty at John Jay College of Criminal Justice in New York, and a faculty member of the Institute of Canadian Urban Research Studies at Simon Fraser University. Contact him at [email protected]
Dr. Kenneth R. Kunz has trained as a medical oncologist and holds a Ph.D. degree in molecular pharmacology as it applies to the design, synthesis and biological evaluation of new drugs to treat cancer. He is interested in educating the public and the fire service on how awareness, lifestyle factors, and screening & prevention can reduce the incidence and mortality of cancer. Contact him at [email protected]
Paul Maxim obtained his MA in criminology at the University of Ottawa and his PhD in sociology at the University of Pennsylvania where he specialized in criminology and research methods. He is currently a professor in the Department of Economics and the Balsillie School of International Affairs at Wilfrid Laurier University in Waterloo, Ontario. His primary areas of research interest are population and labour economics. Contact him at [email protected]
Larry Thomas is a Deputy Fire Chief for the City of Surrey, BC, and is a Chartered Manager, C. Mgr with 28 years’ experience. He is currently responsible for Human Resources, Labour Relations and Communications. He has a background in Science from Simon Fraser University and Economics from Douglas College. Contact him at [email protected]
Dr. Ian Pike is Professor of Pediatrics at UBC; Investigator and Co-Lead of the Evidence to Innovation Research Theme at the Research Institute at BC Children’s Hospital; Director of the BC Injury Research and Prevention Unit, and Co-executive Director, The Community Against Preventable Injuries. Contact him at [email protected]

71
Acknowledgements
The authors wish to thank the following organizations and individuals for their contributions:
The Motorola Solutions Foundation for their generous support.
International Association of Fire Fighters, Sixth District for their encouragement in the ongoing efforts to make firefighting a safer profession.
Deputy Fire Chief John Lehmann and Deputy Fire Chief Mark Griffioen for their attention to implementing and maintaining a wellness environment within the Surrey Fire Service.