Embed Size (px)
Citation preview

8/8/2019 Determinants of Population Growth in Rajasthan: An Analysis, by Prof. V.V. Singh, Dr. Alka Mittal, Dr. Neetish Sharm…
http://slidepdf.com/reader/full/determinants-of-population-growth-in-rajasthan-an-analysis-by-prof-vv 1/12
Determinants of Population Growth in Rajasthan: An Analysis
Prof. V.V. Singh1
Dr. Alka Mittal2
Dr. Neetish Sharma3
Prof. F. Smarandache4
Abstract
Rajasthan is the biggest State of India and is currently in the second phase of demographic
transition and is moving towards the third phase of demographic transition with very slow
pace. However, state’s population will continue to grow for a time period. Rajasthan’s
performance in the social and economic sector has been poor in past. The poor performance
is the outcome of poverty, illiteracy and poor development, which co-exist and reinforce each
other. There are many demographic and socio-economic factors responsible for population
growth. This paper attempts to identify the demographic and socio-economic variables, which
are responsible for population growth in Rajasthan with the help of multivariate analysis.
1. Introduction:
Prof. Stephan Hawking (Cambridge University) was on Larry King Live. Larry King called him the
“most intelligent person in the world”. King asked some very key questions, one of them was: “what
worries you the most?” Hawking said, “My biggest worry is population growth, and if it continues at
the current rate, we will be standing shoulder to shoulder in 2600. Something has to happen, and I
don’t want it to be a disaster”.
The importance of population studies in India has been recognized since very ancient times. The
‘Arthashastra’ of Kautilya gives a detailed description of how to conduct a population, economic and
agricultural census. During the reign of Akbar, Abul Fazal compiled the Ain-E-Akbari containing
comprehensive data on population, industry, wealth and characteristics of population. During the
British period, system of decennial census started with the first census in 1872.
The population growth of a region and its economic development are closely linked. India has been a
victim of population growth. Although the country has achieved progress in the economic field, the
population growth has wrinkled the growth potential. The need to check the population growth was
realized by a section of the intellectual elite even before independence. Birth control was accepted by
this group but implementation was restricted to the westernized minority in the cities. When the
country attained independence and planning was launched, population control became one of the
important items on the agenda of development. The draft outline of the First Five Year Plan said, “the
increasing pressure of population on natural resources retards economic progress and limits seriously
the rate of extension of social services, so essential to civilized existence.”
India was one of the pioneers in health service planning with a focus on primary health care.
Improvement in the health status of the population has been one of the major thrust areas for the
social development programs of the country in the five year plans. India is a signatory to the Alma
1Prof. V.V. Singh isProfressor & Head, Deptt. of Economics, University of Rajasthan, Jaipur.
2 Dr. Alka Mittal is Lecturer of Economics in S.S. Jain Subodh PG Mahila Mahavidhyalaya, Jaipur.3 Dr. Neetish Sharma is Assistant Director (Plan-Finance) in Planning Department, Govt. of Rajasthan, Jaipur.
4 Prof. F. Smarandache, University of New Mexico, Gallup, NM 87301, USA
Views expressed here are personal views of above, not concerned to their organizations.

8/8/2019 Determinants of Population Growth in Rajasthan: An Analysis, by Prof. V.V. Singh, Dr. Alka Mittal, Dr. Neetish Sharm…
http://slidepdf.com/reader/full/determinants-of-population-growth-in-rajasthan-an-analysis-by-prof-vv 2/12
2
Ata Declaration (1978) whereby a commitment was made to achieve ‘Health for All’ by 2000 AD.
We are in the end of the first decade of the 21 st century but still have to go a long way to achieve this
target. Rajasthan is lagging behind the all India average in the key parameters i.e. CBR, CDR, IMR,
TFR & CPR. The state has made consistent efforts to improve quality of its people through
improvement in coverage & quality of health care and implementation of disease control programs
but the goals remain elusive due to high levels of fertility and mortality. According to the Report of
the Technical Group on Population Projections, India will achieve the target of TFR = 2.1 (Net
Reproduction Rate = 1) in 2026. Kerala & Tamilnadu had already achieved it in 1988 & 1993
respectively but Rajasthan will achieve it in 2048 & Uttar Pradesh in 2100.
Rajasthan is the largest state of the country with its area of 342239 sq. kms., which constitutes about
10.41% of the total area of the country. According to 2001 census, its population is 56.51 million. It
consist 5.5 % population and ranks eighth in the country. In 1901, population of Rajasthan was 10.29
millions. In 1951, it reached to 15.97 millions with its slow growth during 1901-1951. Figure 1 shows
that it increased rapidly after 1951. It reached to 34.26 million in 1981 and to 56.51 million in 2001. It
has multiplied 5.5 times since 1901 and 3.5 times since 1951. Figure 2 shows decennial growth in
population of the state. Before 1951, it increased by less than 20% growth per decade. In 1971-81, it
shows the maximum growth rate of 32.97%. In 1981-91, it decreased by 4.53 percentage points and
grew by 28.44%. The decade of 1991-2001 shows growth of 28.41%.
Fig. 1 : POPULATION - RAJASTHAN
1 0
. 2 9
1 0
. 9 8
1 0
. 2 9
1 1
. 7 5
1 3
. 8 6
1 5
. 9 7
2 0
. 1 6
2 5
. 7 7
3 4
. 2 6 4
4 . 0
1 5 6
. 5 1
0
10
20
30
40
50
60
1 9 0 1
1 9 1 1
1 9 2 1
1 9 3 1
1 9 4 1
1 9 5 1
1 9 6 1
1 9 7 1
1 9 8 1
1 9 9 1
2 0 0 1
( M i l l i o n s )
Source: Government of India, Registrar General, India, see the website www.censusindia.net
Fig. 2 : POPULATION GROWTH (Decennial)
2 8 . 4
1
2 8 .
4 4
3 2 . 9
7
2 7 .
8 3
2 6 . 2
0 1 5 . 2
0
1 8 .
0 1
1 4 .
1 4
- 6 .
2 9
6 . 7
0
-10.00
-5.00
0.00
5.00
10.00
15.00
20.00
25.00
30.00
35.00
Source: Government of India, Registrar General, India, see the website www.censusindia.net
The rapid population growth in a already populated state like Rajasthan could lead to many problems
i.e. pressure on land, environmental deterioration, fragmentation of land holding, shrinking forests,
rising temperatures, pressure on health & educational infrastructure, on availability of food grains &
on employment. Figure 3 shows the decennial growth of district-wise population during 1991-2001.
Jaisalmer shows the maximum growth of 47.45% followed by Bikaner (38.18%), Barmer (36.83%),
Jaipur (35.10%) and Jodhpur (33.77%). Rajasamand shows minimum growth of 19.88% followed by
Jhunjhunu (20.90%), Chittorgarh (21.46%), Pali (22.39%) and Jhalawar (23.34%).

8/8/2019 Determinants of Population Growth in Rajasthan: An Analysis, by Prof. V.V. Singh, Dr. Alka Mittal, Dr. Neetish Sharm…
http://slidepdf.com/reader/full/determinants-of-population-growth-in-rajasthan-an-analysis-by-prof-vv 3/12
3
Fig. 3 : POPULATION GROWTH (1991-2001)
0.00
10.00
20.00
30.00
40.00
50.00
Source: Government of India, Registrar General, India, see the website www.censusindia.net
Rajasthan is currently in the second phase and is moving towards the third phase of demographic
transition with very slow pace. The changes in the population growth rates in Rajasthan have been
relatively slow, but the change has been steady and sustained. We are aware of the need for birth
control, but too many remain ignorant of contraception methods or are unwilling to discuss them.
There is considerable pressure to produce a son. However, the state’s population will continue to grow
for a time period.
Rajasthan is the second state in the country to formulate and adopt its own Population Policy in
January 2000. State Population Policy5 has envisaged strategies for population stabilization and
improving health conditions of people specially women and children. The policy document has
clearly presented role and responsibilities of different departments actively contributing in
implementation of population policy. Family Welfare Program was linked with other sectors and
demands intervention and efficient policies in these sectors so that changes can be brought in the
social, economic, cultural & political environment. The State Population Policy envisages time bound
objectives as mentioned in table 1:
Table 1: Objectives of Population Policy of Rajasthan
Indicators 1997 2001 2004 2007 2011 2013 2016
Total Fertility Rate 4.11 3.74 3.41 3.09 2.65 2.43 2.10
Birth Rate 32.1 29.2 27.5 25.6 22.6 20.9 18.4Contraceptive Prevalence Rate 38.5 42.2 48.2 52.7 58.8 61.8 68.0
Death Rate 8.9 8.7 8.4 7.9 7.5 7.2 7.0
Infant Mortality Rate 85.0 77.4 72.7 68.1 62.2 60.1 56.8
Rajasthan’s performance in the social and economic sector has been poor in past. The poor
performance is the outcome of poverty, illiteracy and poor development which co-exist and reinforce
each other. State Government has taken energetic steps in last few years to assess and fully meet the
unmet needs for maternal & child health care and contraception through improvement in availability
and access to family welfare services but still remains a long path. The progress in these indicators
would determine the year and size of the population at which the state achieves population
stabilization.
2. Objectives and Methodology:
There is a major data difficulty regarding availability of annual statistics, calculations & comparisons
of Crude Birth Rate (CBR), Total Fertility Rate (TFR) and Females’ Mean Age at Gauna (FMAG)
over time for district level study of any state and which is applied to Rajasthan also. This data
problem distorts the calculations and negates the usefulness of making comparisons over time. Due to
this data information problem, we use the information for different years (as per the availability of
latest data, taking 2000-01 as base year) in this paper. This data problem at district level is a constraint
5 Government of Rajsthan (1999), “Population Policy of Rajasthan”, Department of Family Welfare, Jaipur.

8/8/2019 Determinants of Population Growth in Rajasthan: An Analysis, by Prof. V.V. Singh, Dr. Alka Mittal, Dr. Neetish Sharm…
http://slidepdf.com/reader/full/determinants-of-population-growth-in-rajasthan-an-analysis-by-prof-vv 4/12
4
that creates a limitation in the selection of study objectives and hypotheses. This paper attempts to
identify the demographic and socio-economic variables, which are responsible for population growth
in Rajasthan. The main objectives of the study are:
To observe the characteristics of indicators of population growth in Rajasthan.
To identify the various demographic & socio-economic variables which have causal
relationship with population growth.
To analyze the inter-relationship between the indicators of population growth and
demographic & socio-economic variables.
For achieving the above objectives, the a priori hypotheses are as follows:
Positive impact of infant mortality & total fertility rate and negative impact of income
equality on population growth.
Positive impact of infant mortality and negative impact of female’s age at gauna and female
literacy on crude birth rate.
Negative impact of couple protection rate, income equality, female literacy and positive
impact of infant mortality on total fertility rate.
Positive impact of female literacy & income equality on female’s age at gauna.
Positive impact of female literacy, females age at gauna and income equality on couple
protection rate.
To rummage the inter-relationship between indicators of population growth and demographic &
socio-economic variables, a social sector model is proposed. The model is estimated by the use of
Multiple Regression Analysis (Method of Ordinary Least Squares). The general form of the Multiple
Regression Equation Model is as follows:
Yi = β1 + β2 X2i + β3 X3i + · ·· + βk Xki + ui
where i = 1, 2, 3, … , n.
In this multiple regression equation model, Yi is dependent variable and X2, X3, … , Xk are
independent explanatory variables. β1 is the intercept, shows the average value of Y, when X2, X3, … ,
Xk are set equal to zero; β2, β3, …, βk are partial regression/slope coefficients; ui is the stochasticdisturbance term; i is the ith observation and n is the size of population.
The model is estimated by using cross-sectional data of all 32 districts of the state (at that time, the no.
of districts was 32). In this paper, we also calculated the Mean, Standard Deviation and Coefficient of
Variation of the variables. The variables used in this paper, their reference year and
abbreviations/identification code are given in the Appendix I (Table 9). Firstly, we regress the
dependent variables with all the variables, which have theoretical relationship and then choose the
appropriate variables for multiple regressions. The dependent and independent variables for the model
are as follows:
Table 2: Functional Form of the Model
Dependent Variable Independent Variables
POPGWR CBR, TFR, FMAG, CDR, CPR, IMR, CIMM, MRANC, PWRSAP, PWETVR, MIPLP,
BPGH, PCEMPH, LIT, LITm, LITf , PCEEE, PCNDDP, PPBPL, ROADSK, PHDW, PCEWS
CBR POPGWR, FMR, FMR(0-6), PURPOP, FMAG, CPR, IMR, PWETVR, PCEMPH, PCEFW,
LIT, LITm, LITf , PCEEE, PCNDDP, PPBPL
TFR PURPOP, FMAG, CPR, CDR, IMR, MRANC, PWRSAP, PWETVR, PCEMPH, LIT, LITm,
LITf , PCEEE, PCNDDP, PPBPL, PCESCS
FMAG PURPOP, PWETVR, LIT, LITm, LITf , PSER, PSERm PSERf , DORPS, DORPSm, DORPSf ,
PCEEE, PCNDDP, PPBPL

8/8/2019 Determinants of Population Growth in Rajasthan: An Analysis, by Prof. V.V. Singh, Dr. Alka Mittal, Dr. Neetish Sharm…
http://slidepdf.com/reader/full/determinants-of-population-growth-in-rajasthan-an-analysis-by-prof-vv 5/12
5
Dependent Variable Independent Variables
CPR PURPOP, FMAG, IMR, PWETVR, MIPLP, PCEMPH, PCEFW, LIT, LITm, LITf , PCEEE,
PCNDDP, PPBPL, IDI, PCESCS
In this paper, we have taken 32 variables (appendix-I). All the 32 variables are relating to Population;
Fertility, Reproductive Health and Mortality; Public Health and Health Infrastructure; Education and
Educational Infrastructure; and Economic Growth and Infrastructure. Data used in this paper havetaken from website of Census Department, State Human Development Report (Rajasthan), Various
Administrative Reports of Medical, Health & Family Welfare Department, Government of Rajasthan
and Plan Documents of Planning Department, Government of Rajasthan.
3. Multivariate Analysis
3.1 Mean, Standard Deviation & Coefficient of Variation
Mean, standard deviation and coefficient of variation of all the 32 variables for all 32 districts along
with the figures of all Rajasthan are at appendix I (table 9). The Mean, measures the average value of
the variables for all 32 districts. The Standard Deviation, measures the absolute variation in the mean
and the Coefficient of Variation, measures the percentage variation in mean. The variables are divided
in to five categories according to the range of Coefficient of Variation for the analysis of StandardDeviation and Coefficient of Variation.
Table 3: Range-wise Variables according to the Coefficient of Variation
Range Variables
Less than 25% POPGWR (19.92), FMR (5.28), FMR(0-6)(3.26), CBR (7.02), TFR (10.20), FMAG (3.66), CPR(14.73), CDR (10.44), IMR (20.60), MIPLP (18.59), LIT (12.64), LIT m (8.31), LITf (21.19),
PSER (9.39), PSERm (11.17), PSERf (14.27), DORPS (12.94), DORPSm (12.89), DORPSf
(17.01), PCNDDP (24.34), PHDW (21.33)
25% to 50% MRANC (38.95), BPGH (30.61), PCEFW (38.55), PCEEE (44.54), PPBPL (46.88), PCESCS
(48.75)
50% to 75% PURPOP (53.79), PWETVR (66.94), PCEMPH (58.63), IDI (55.05)
75% to 100% -
More than 100% PCEWS (158.62)
Table 3 shows that variability is higher in the variables of public health & health infrastructure and
economic growth & infrastructure head. There is need to reduce disparities on this front.
3.2 Regression analysis
To rummage the interrelationship between indicators of population growth and various demographic
and socio-economic variables, we regress the dependent variable with the independent variables
individually (independent variables are those variable which have causal relationship with dependent
variable in theoretical and behavioral terms) and then pick the most influential variables and regress
with the help of step-wise method and get best fitted multiple regression equation of them. Some
variables with insignificant coefficients have also been kept in the model because theoretically their
importance has been proved. Figures below the coefficients are ‘t’ values. Significance of variableswith the level of significance is denoted as follows:
* Significant at 1% level of significance
** Significant at 2% level of significance
*** Significant at 5% level of significance
**** Significant at 10% level of significance

8/8/2019 Determinants of Population Growth in Rajasthan: An Analysis, by Prof. V.V. Singh, Dr. Alka Mittal, Dr. Neetish Sharm…
http://slidepdf.com/reader/full/determinants-of-population-growth-in-rajasthan-an-analysis-by-prof-vv 6/12
6
Efforts have been made to avoid the problem of multicollinearity (as it presents commonly in the
analysis of cross-sectional data) but at some places, it is difficult to avoid it.
3.2.1 Population Growth (Decennial)
Population Growth (POPGWR) is regressed with different variables such as CBR, TFR, FMAG,
CDR, CPR, IMR, CIMM, MRANC, PWRSAP, PWETVR, MIPLP, BPGH, PCEMPH, LIT, LITm,
LITf , PCNDDP, PPBPL, ROADSK, PHDW, PCEWS.
Table 4: Regression Equations of Population Growth (Decennial)
S.No. Intercept Coefficient R2 d. f.
1. 10.0934 + 0.5643 CBR 0.0514 31
1.2745
2. 8.1549 + 4.1092 TFR*** 0.1325 31
2.1408
3. 49.0047 - 1.1555 FMAG 0.0156 31
0.6903
4. 50.0223 - 0.5750 CPR* 0.3245 31
3.7963
5. 46.2904 - 2.0212 CDR**** 0.1119 31
1.9442
6. 36.6587 - 0.0979 IMR**** 0.0946 31
1.7709
7. 34.4649 - 0.1670 CIMM*** 0.1413 31
2.2217
8. 278632 + 0.0061 MRANC 0.0007 31
0.1473
9. 13.8825 + 0.1462 PWRSAP 0.0497 31
1.2532
10. 30.8793 - 0.1961 PWETVR**** 0.097 31
1.8019
11. 24.9574 + 0.1171 MIPLP 0.0118 31
0.5995
12. 21.9702 + 0.0768 BPGH**** 0.1167 31
1.9906
13. 29.1035 - 0.0453 PCEMPH 0.0079 31
0.4881
14. 32.8303 - 0.0768 LIT 0.0106 31
0.5664
15. 40.5194 - 0.1629 LITm 0.0328 31
1.0084
16. 31.2097 - 0.0696 LITf 0.0124 31
0.6137
17. 26.7674 + 0.0346 PCEEE 0.0138 31
0.6478
18. 32.6477 - 0.0003 PCNDDP 0.0361 31
1.0604
19. 27.1559 + 0.0285 PPBPL 0.0057 31
0.4138
20. 35.2376 - 0.2308 ROADSK*** 0.1539 31
2.3363
21. 31.0646 - 0.0465 PHDW 0.0114 31
0.5872
22. 28.6427 - 0.0134 PCEWS 0.0122 31
0.6075
Fit of the equations is with the expected signs. TFR, CPR, CDR, IMR, CIMM, PWETVR, BPGH and
ROADSK have significant coefficients. PCEEE appears with opposite sign as of expected sign. In the
step-wise regression, PPBPL is found more relevant in spite of PCNDDP for multiple regression.
POPGWR = 12.5485 + 5.6405 TFR* - 0.1477 IMR* + 0.0246 PPBPL
(3.0425) (2.7565) (0.4075)
R2
= 0.3196 d.f. = 29

8/8/2019 Determinants of Population Growth in Rajasthan: An Analysis, by Prof. V.V. Singh, Dr. Alka Mittal, Dr. Neetish Sharm…
http://slidepdf.com/reader/full/determinants-of-population-growth-in-rajasthan-an-analysis-by-prof-vv 7/12
8/8/2019 Determinants of Population Growth in Rajasthan: An Analysis, by Prof. V.V. Singh, Dr. Alka Mittal, Dr. Neetish Sharm…
http://slidepdf.com/reader/full/determinants-of-population-growth-in-rajasthan-an-analysis-by-prof-vv 8/12
8
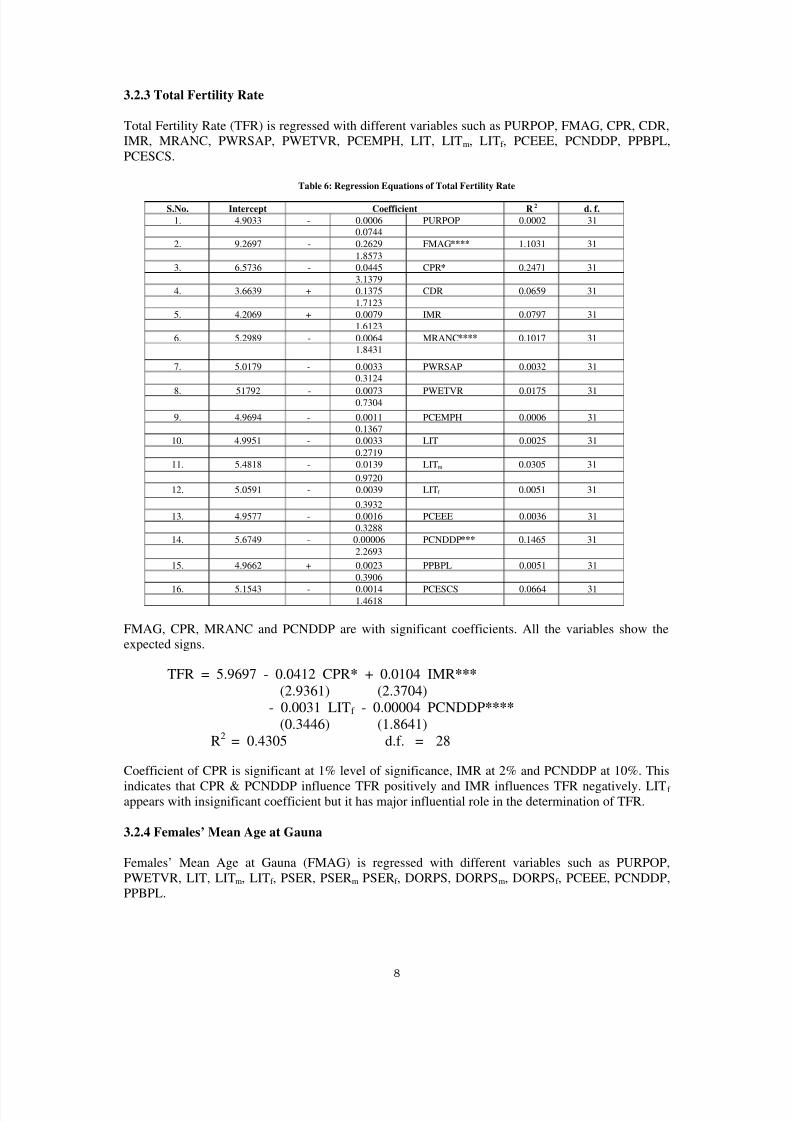
3.2.3 Total Fertility Rate
Total Fertility Rate (TFR) is regressed with different variables such as PURPOP, FMAG, CPR, CDR,
IMR, MRANC, PWRSAP, PWETVR, PCEMPH, LIT, LITm, LITf , PCEEE, PCNDDP, PPBPL,
PCESCS.
Table 6: Regression Equations of Total Fertility Rate
S.No. Intercept Coefficient R2 d. f.
1. 4.9033 - 0.0006 PURPOP 0.0002 31
0.0744
2. 9.2697 - 0.2629 FMAG**** 1.1031 31
1.8573
3. 6.5736 - 0.0445 CPR* 0.2471 31
3.1379
4. 3.6639 + 0.1375 CDR 0.0659 31
1.7123
5. 4.2069 + 0.0079 IMR 0.0797 31
1.6123
6. 5.2989 - 0.0064 MRANC**** 0.1017 31
1.8431
7. 5.0179 - 0.0033 PWRSAP 0.0032 31
0.3124
8. 51792 - 0.0073 PWETVR 0.0175 310.7304
9. 4.9694 - 0.0011 PCEMPH 0.0006 31
0.1367
10. 4.9951 - 0.0033 LIT 0.0025 31
0.2719
11. 5.4818 - 0.0139 LITm 0.0305 31
0.9720
12. 5.0591 - 0.0039 LITf 0.0051 31
0.3932
13. 4.9577 - 0.0016 PCEEE 0.0036 31
0.3288
14. 5.6749 - 0.00006 PCNDDP*** 0.1465 31
2.2693
15. 4.9662 + 0.0023 PPBPL 0.0051 31
0.3906
16. 5.1543 - 0.0014 PCESCS 0.0664 311.4618
FMAG, CPR, MRANC and PCNDDP are with significant coefficients. All the variables show the
expected signs.
TFR = 5.9697 - 0.0412 CPR* + 0.0104 IMR***
(2.9361) (2.3704)
- 0.0031 LITf - 0.00004 PCNDDP****
(0.3446) (1.8641)
R2
= 0.4305 d.f. = 28
Coefficient of CPR is significant at 1% level of significance, IMR at 2% and PCNDDP at 10%. This
indicates that CPR & PCNDDP influence TFR positively and IMR influences TFR negatively. LITf appears with insignificant coefficient but it has major influential role in the determination of TFR.
3.2.4 Females’ Mean Age at Gauna
Females’ Mean Age at Gauna (FMAG) is regressed with different variables such as PURPOP,
PWETVR, LIT, LITm, LITf , PSER, PSERm PSERf , DORPS, DORPSm, DORPSf , PCEEE, PCNDDP,
PPBPL.

8/8/2019 Determinants of Population Growth in Rajasthan: An Analysis, by Prof. V.V. Singh, Dr. Alka Mittal, Dr. Neetish Sharm…
http://slidepdf.com/reader/full/determinants-of-population-growth-in-rajasthan-an-analysis-by-prof-vv 9/12
9
Table 7: Regression Equations of Females’ Mean Age at Gauna
S.No. Intercept Coefficient R2 d. f.
1. 16.1794 + 0.0060 PURPOP 0.0118 31
0.5994
2. 15.0223 + 0.0273 PWETVR*** 0.1619 31
2.4070
3. 15.7873 + 0.0190 LIT 0.051 31
1.3231
4. 14.9522 + 0.0305 LITm**** 0.0981 31
1.8061
5. 151910 + 0.0126 LITf 0.0346 31
1.0371
6. 16.0412 + 0.0160 PSER 0.0456 31
1.1974
7. 16.9408 - 0.0028 PSERm 0.0027 31
0.2861
8. 15.8440 + 0.0166 PSERf 0.0775 31
1.5871
9. 17.3288 - 0.0225 DORPS 0.0796 31
1.6104
10. 18.1252 - 0.0268 DORPSm**** 0.1050 31
1.8765
11. 17.2214 - 0.0099 DORPSf 0.0147 310.6701
12. 16.7143 + 0.0014 PCEEE 0.0018 31
0.2328
13. 16.4417 + 0.00002 PCNDDP 0.0074 31
0.4713
14. 16.6888 - 0.0010 PPBPL 0.0006 31
0.1374
PWETVR, LITm and DORPSm are with significant coefficients. Except PSERm, coefficients of all are
with expected Signs.
FMAG=13.7224 +0.0279 PWETVR*** +0.0039 LITf **** +0.00003 PCNDDP
(2.1774) (1.8126) (1.0034)
R2
= 0.1912 d.f. = 29
All the variables are with expected signs. Coefficient of PWETVR is significant at 5% level of
significance & coefficient of LITf is significant at 10% level of significance. This indicates that
PWETVR & LITf influence FMAG positively. Coefficient of PCNDDP is insignificant means the
variable PCNDDP does not affect FMAG significantly.
3.2.5 Couple Protection Rate
Couple Protection Rate (CPR) is regressed on different variables such as PURPOP, FMAG, IMR,
PWETVR, MIPLP, PCEMPH, PCEFW, LIT, LITm, LITf , PCEEE, PCNDDP, PPBPL, IDI, PCESCS.
Table 8: Regression Equations of Couple Protection Rate
S.No. Intercept Coefficient R2 d. f.
1. 40.2031 - 0.1133 PURPOP 0.0511 31
1.2713
2. 18.8647 + 1.1404 FMAG 0.0155 31
0.6876
3. 34.1252 + 0.0435 IMR 0.0190 31
0.7628
4. 35.2834 + 0.1922 PWETVR**** 0.0956 31
1.7811
5. 35.3518 + 0.0892 MIPLP 0.0069 31

8/8/2019 Determinants of Population Growth in Rajasthan: An Analysis, by Prof. V.V. Singh, Dr. Alka Mittal, Dr. Neetish Sharm…
http://slidepdf.com/reader/full/determinants-of-population-growth-in-rajasthan-an-analysis-by-prof-vv 10/12
10
S.No. Intercept Coefficient R2 d. f.
0.4596
6. 36.7349 + 0.0597 PCEMPH 0.0139 31
0.6522
7. 33.9617 + 3.4369 PCEFW 0.0726 31
1.5325
8. 35.5692 + 0.1294 LIT 0.0306 31
0.9726
9. 29.9513 + 0.1606 LITm 0.0325 31
1.003210. 36.5518 + 0.0869 LITf 0.0197 31
0.7762
11. 39.5813 + 0.0402 PCEEE**** 0.0189 31
1.7607
12. 31.0288 + 0.0005 PCNDDP**** 0.0889 31
1.7108
13. 39.0037 - 0.1215 PPBPL**** 0.1051 31
1.8769
14. 38.5776 + 0.0077 IDI 0.0050 31
0.3894
15. 36.6705 + 0.0093 PCESCS 0.0250 31
0.8785
PWETVR, PCEEE, PCNDDP and PPBPL are with significant coefficients and expected signs. Sign
of coefficient of PURPOP is opposite of the expected.
CPR = 20.6541 + 0.4813 FMAG + 0.1388 LITf **** + 0.0006 PCNDDP****
(0.2922) (1.8065) (1.9266)
R2
= 0.1433 d.f. = 29
All the variables are with expected signs of coefficients. Coefficients of LIT f and PCNDDP are
significant at 10% level of significance. This indicates that LITf and PCNDDP influence CPR
positively. Coefficient of FMAG is insignificant means the variable FMAG does not affect CPR
significantly.
4. Conclusion
The model is fit good with the expected signs. Estimated equations confirm the a priori hypotheses of positive impact of infant mortality & total fertility rate and negative impact of income equality on
population growth; positive impact of female literacy & income equality on female’s age at gauna;
positive impact of infant mortality and negative impact of female’s age at gauna and female literacy
on crude birth rate; negative impact of couple protection rate, income equality, female literacy and
positive impact of infant mortality on total fertility rate, positive impact of female literacy, females
age at gauna and income equality on couple protection rate. Literacy, especially female literacy and
per-capita income appeared as most influential variables to attack the poor status of socio-economic &
demographic variables. There is need to emphasize on the improvement of these two variables.
Rapid population growth retards the economic, social and human development. Enhancement of
women’s status and autonomy has been conclusively established to have a direct bearing on fertility
and mortality decline, which indirectly affects the population growth. More specifically, inter-
relationships between women’s characteristics and access to resources are the mechanisms throughwhich human fertility is determined. Education is highly correlated with age at the marriage of the
females and thus helps in the reduction of the reproductive life, on an average, and helps in the
conscious efforts to limit the family size. The early marriage of the daughter in rural areas is an
expected rational behavior, as long as there is mass illiteracy and poverty. The age at marriage for
females cannot be raised by mere, legislation unless the socio-economic conditions of the rural people
is improved and better educational facilities and occupational alternatives for the teenage girls are
provided near their homes.

8/8/2019 Determinants of Population Growth in Rajasthan: An Analysis, by Prof. V.V. Singh, Dr. Alka Mittal, Dr. Neetish Sharm…
http://slidepdf.com/reader/full/determinants-of-population-growth-in-rajasthan-an-analysis-by-prof-vv 11/12
11
Reproductive and public health have their importance in determination of population stabilization.
National Rural Health Mission (NRHM) and Rajasthan Health System Development Project
(RHSDP) are ongoing programs which can improve the situation. There is need of effective
monitoring of activities under these programs. Effective implementation of family welfare program
will create opportunities for better education and improvement in nutritional status of family through
check on population growth, which will turn in better health of mother and child and there will be less
infant and maternal mortality.
References
• Government of Rajasthan (2005), “District-wise Performance of Family Welfare Programme-2004”, Directorate of Family
Welfare, Jaipur.
• Government of Rajasthan, “Various Plan Documents”, Planning Department, Jaipur.
• Government of Rajsthan (1999), “Population Policy of Rajasthan”, Department of Family Welfare, Jaipur.
• Kulkarni, Sumati and Minja Kim Choe (1997), “State-level Variations in Wanted and Unwanted Fertility Provide a Guide
for India’s Family Planning Programmes”, NFHS Bulletion, IIPS, Mumbai.
• Mittal, Alka (2004), “Billion Plus Population: Challenges Ahead”, Paper submitted to Academic Staff College, University
of Rajasthan, Jaipur during 57th Orientation Course.
• Mohanty, Sanjay K. and Moulasha K. (1996), “Women’s Status, Proximate Determinants and Fertility Behaviour in
Rajasthan”, Paper Presented at National Seminar on Population and Development in Rajasthan at HCM-RIPA, Jaipur.
• Murthy, M.N. (1996), “Reasons for Low Contraceptive Use in Rajasthan”, Paper Presented at National Seminar on
Population and Development in Rajasthan at HCM-RIPA, Jaipur.
•
Radhakrishan, S., S. Sureender and R. Acharya (1996), “Child Marriage: Determinants and Attitudes Examined inRajasthan”, Paper Presented at National Seminar on Population and Development in Rajasthan at HCM-RIPA, Jaipur.
• Ramesh, B.M., S.C. Gulati and Robert D. Retherford (1996), “Contraceptive Use in India”, NFHS Subject Report, IIPS,
Mumbai.
• Retherford, Robert D. and Vinod Mishra (1997), “Media Exposure Increases Contraceptive Use”, NFHS Bulletin, IIPS,
Mumbai.
• Retherford, Robert D., M.M. Gandotra, Arvind Pandey, Norman Y. Luther, and Vinod K. Mishra (1998), “Fertility in
India”, NFHS Subject Report, IIPS, Mumbai.
• Retherford, Robert D., P.S. Nair, Griffith Feeney and Vinod K. Mishra (1999), “Factors Affecting Source of Family
Planning Services in India”, NFHS Subject Report, IIPS, Mumbai.
• Roy, T.K., R. Mutharayappa, Minja Kim choe and Fred Arnold (1997), “Son Preference and its Effect on Fertility in India”,
NFHS Subject Report, IIPS, Mumbai.
• Shariff, Abusaleh (1996), “Poverty and Fertility Differentials in Indian States: New Evidence from Cross-Sectional Data”,
Margin, October-December, Vol. 29, No.1, pp. 49-67.
• Sinha, Narain and Assakaf Ali (1999), “Econometric Analysis of Socio-Economic Determinants of Fertility: A Case Study
of Yemen”, Paper Presented at the Conference of the India Econometric Society, Jaipur.
• Society for International Development (1999), “Human Development Report: Rajasthan”, Rajasthan Chapter, Jaipur.
• Visaraia, Pravin and Leela Visaria (1995), “India’s Population in Transition”, Population Bulletin, 50(3), Population
Reference Bureau, Washington, D.C.
• website www.censusindia.net

8/8/2019 Determinants of Population Growth in Rajasthan: An Analysis, by Prof. V.V. Singh, Dr. Alka Mittal, Dr. Neetish Sharm…
http://slidepdf.com/reader/full/determinants-of-population-growth-in-rajasthan-an-analysis-by-prof-vv 12/12
12
Appendix - I
Table 9: All Rajasthan Figures, Mean, Standard Deviation & Coefficient of Variation of Variables
S. No. Variable & Year Code Unit AllRajasthan
Mean S. D. CoV
1. Population Growth (Decennial) 1991-2001 POPGWR Per cent 28.33 28.25 5.63 19.92
2. Female-Male Ratio 2001 FMR Nos. 921 922.03 48.65 5.28
3. Female-Male Ratio (0-6 years) 2001 FMR(0-6) Nos. 909 909.00 29.59 3.26
4. Percentage of Urban Population to Total
Population 2001
PURPOP Per cent 23.38 20.69 11.13 53.79
5. Crude Birth Rate 1997 CBR Per ‘000 32.90 32.18 2.26 7.02
6. Total Fertility Rate 1997 TFR Nos. 4.9 4.89 0.50 10.20
7. Females Mean Age at Gauna1996-97 FMAG Years 17.7 16.66 0.61 3.66
8. Couple Protection Rate 2001 CPR Per cent 37.00 37.86 5.58 14.73
9. Crude Death Rate 1997 CDR Per ‘000 8.9 8.93 0.93 10.44
10. Infant Mortality Rate 1997 IMR Per ‘000 87 85.81 17.67 20.60
11. Percentage of Mothers Receiving Total Ante-
Natal Care 1996-97
MRANC Per cent 72.3 63.38 24.69 38.95
12. Percentage of Women having Exposure to TV
& Radio 1996-97
PWETVR Per cent 13.1 13.40 8.97 66.94
13. Medical Institutions Per-Lakh of Population
1997-98
MIPLP Nos. 27 28.13 5.23 18.59
14. Beds Per-Lakh Population in Govt. Hospitals
1997-98
BPGH Nos. 85 81.81 25.04 30.61
15. Per-Capita Expenditure on Medical & Public
Health 2000-01
PCEMPH ` 19.00 18.82 11.04 58.63
16. Per-Capita Expenditure on Family Welfare2000-01
PCEFW`
0.97 1.13 0.44 38.55
17. Literacy Rate 2001 LIT Per cent 60.41 59.58 7.53 12.64
18. Literacy Rate (Male) 2001 LITm Per cent 75.70 75.31 6.26 8.31
19. Literacy Rate (Female) 2001 LITf Per cent 43.85 42.51 9.01 21.19
20. Primary School Enrolment Ratio 1997-98 PSER Per cent 86.50 86.75 8.15 9.39
21. Primary School Enrolment Ratio (Male) 1997-98
PSERm Per cent 99.78 100.51 11.22 11.17
22. Primary School Enrolment Ratio (Female)1997-98
PSERf Per cent 71.91 71.65 10.22 14.27
23. Drop-Out Rates at Primary Level 1996-97 DORPS Per cent 56.60 59.13 7.65 12.94
24. Drop-Out Rates at Primary Level (Male) 1996-
97
DORPSm Per cent 54.72 57.07 7.36 12.89
25. Drop-Out Rates at Primary Level (Female)
1996-97
DORPSf Per cent 56.96 62.68 10.66 17.01
26. Per-Capita Expenditure on Elementary
Education 2000-01
PCEPEE ` 47.00 42.86 19.09 44.54
27.
Per-Capita Net District Domestic Product1999-2000 PCNDDP`
12752 12831.88 3122.80 24.34
28. Population Below Poverty Line 1999-2000 PPBPL Per cent 30.99 31.74 14.88 46.88
29. Infrastructure Development Index 1994-95 IDI Nos. 100.00 93.46 51.45 55.05
30. Percentage of Villages with Safe Drinking
Water 1998-99
PHDW Per cent 64.30 60.54 12.91 21.33
31. Per-Capita Expenditure on Social &
Community Services 2000-01
PCESCS ` 245.62 194.69 94.92 48.75
32. Per-Capita Expenditure on Water Supply2000-01
PCEWS ` 39.95 29.19 46.30 158.62