Embed Size (px)
Citation preview
Journal of Policy Research, 6(1), 94-122
http://rfh.org.pk/jur/magazine-category/jpr
1M. Sc. Student, COMSATS University Islamabad, Vehari Campus 94
Determinants of Revealed Comparative Advantage and China Pakistan Economic
Corridor
Maham Ramzan1
Abstract
In the study we have find determinants of RCA and its impact on CPEC. The objective of the study
is to find determinants of Revealed Comparative Advantage. With the help of these determinants
we can improve the sectors of Pakistan from which Pakistan can gain more from the project of
CPEC. It can maximize our gains of trade with China and other nearby countries. We have
calculated RCA for Pakistan and China by using the commodity wise data of Pakistan and China
and total merchandise trade of these countries and World as a whole. We have made framework
of export demand function. In which dependent variable is RCA and independent variables include
Inflation, FDI, World GDP, GDP, Trade openness and Exchange rate for each sector. The data is
collected for the years 1984 to 2015 for sectoral exports. The data is divided into two samples.
One sample is from the year 1984 to 2015. The sectors covered in the sample period include
Agriculture, Fuel and mining, Food, Manufacturing and Office and telecom. Second sample is
from the years 1990 to 2015. The sectors covered in the sample period include Agriculture,
Automotives, Chemicals, Clothing, Fuel and Mining, Food, Iron and Steel, manufacturing,
machinery, Office and Telecom and textile. The results of this study indicate that Pakistan can get
a lot of advantages from CPEC and ONE ROAD ONE BELT policy of China by specializing in
food, agriculture, clothing, textile and fuel and mining because Pakistan has comparative
advantage in the exports of these products over China. The results of regression analysis indicate
that Pakistan may boost up its advantages from CPEC by introducing investment friendly policies
especially for foreign investors. Effective management of exchange rate may also be helpful for
Pakistan in improving balance of payments and earn foreign exchange earnings. The findings also
suggest that policy of trade liberalization or trade openness may be helpful in improving trade
balance if Pakistan can effectively manage specialization in the sectors in which the country has
revealed comparative advantage. Key Words: CPEC, FDI, GDP, World GDP China, Pakistan
Introduction
CPEC stands for China Pakistan economic corridor. It throws light on the social and economic
relations of both nations. Pakistan is a country of south Asia and china from East Asia. Both are
good friends and the project of China Pakistan Economic corridor makes their friendship most
unique. China was regarded as a sleeping giant in earlier decades but now it is plying a core role
not only in Asian region but also in whole world. CPEC is a development scheme .It is important
to promote connectivity across Pakistan with a network of highways, roads and pipelines. CPEC
will facilitate trade along an overland route that connects China to the Indian Ocean, linking the
Chinese city of kasghar to the Pakistan’s port of Gawader.
One belt one Road was brilliant program of China and CPEC is a crucial part of the programme.
CPEC development programmer is a part of Chinese agenda of regional economic connectivity

Ramzan…
95
THE ONE BELT ONE ROAD (OBOR).The silk road economic belt and 21st century Maritime
silk road also known as THE BELT THE ROAD (abbreviated B,R) ,One belt One road
(abbreviated OBOR ) is a development strategy proposed by Chinese leader Xi Jinping that focuses
on connectivity and cooperation among countries. Economic corridor is a combination of network
of infrastructure within a geographical area especially designed to enhance economic development
and growth. Corridor exists in Asia, Africa and other areas. CPEC provides a new model of
cooperation of china and Pakistan. Bilateral trade and commercial linkages between Pakistan and
China were established in January 1963. Chinese say that the journey of thousands miles begin
with a single step. First step was taken by Pakistan, which is to accept China as an independence
state. An agreement was signed by Pakistan and China for good neighbourly relations. Pakistan
and China has come close to each other after a long journey of smooth relations. On May 21, 1955
Pakistan and China has established formal relations. This opened a new chapter of history’s
bilateral friendly cooperation. China has always supported Pakistan in the task of development and
anti-terrorism security. China has also supported Pakistan for safeguarding its independence. Once
Prime Minister of Pakistan Nawaz Sharif said that Pakistan and China are best friends and their
relations higher than Himalaya Mountains, deeper than oceans, sweeter than honey and stronger
than steel. Pakistan and China share the common geographical border and Korakoram highway
that connect highway Kasghar to Islamabad. Korakorum Highway is known as Pak-China
friendship highway completed in 1979. Pakistan border is with Iran, China, Afghanistan, India and
Arabia Sea. Pakistan enjoys a unique landscape situated at cross road of Asia. Gwader is located
on the shores of Arabian Sea in Pakistan ‘province of Balochistan. It is about 533 kilometer
And 120 kilometer from Iranian border. The town of Gwader was purchased by government of
Pakistan from sultan of Muscat in 1958. Air operation was started in 1966. The terminal building
was inaugurated in 1984.Gwader can act as an alternative route to Indian Ocean or South China
Sea routes. It is the third international port in Pakistan after Karachi and Qasim port. Gwadar port
connect Central Asia, Sout Asia and Middle East. Gwadar provides opportunities of tax free
investment and trade which encourage foreigners to open new development project and economic
plans. In the oil and energy sector gwader will boost up cooperation of Pakistan with countries.
On 7th, September 1958 Pakistan purchased it from Sultanat of Oman and Muscat for USD $3
million. It became the part of Pakistan on December 1958, after 174 year of Oman rule. Gwadar
is a warm water sea port. India is unhappy with the development of Pakistan. It would do
everything for the failure of China Pakistan economic corridor. India is trying to develop Chabahar
port with the help of Iran to compete Pakistan. Former launch of China Pakistan Economic corridor
has done in April, 2015 by the president of Xi jinping. Once the CPEC is completed it serves as
central between China, Africa and Middle East. It also includes the mega project infrastructure
from Gwadar to khunjrab which connects China, India, Iran and Afghanistan to Karachi and
Lahore motorway and 2700 kilometer highway from kasghar to Gwadar. This network will
promote economic integration. The essence of an old Chinese proverb is that, one must first
construct road to become rich. This message of this line is quite clear. The purpose of China
Pakistan Economic Corridor is not only to develop the infrastructure of Pakistan it includes the
integral physical infrastructure for the development of the whole region. With the success of CPEC
Pakistan will prove a hub of all economic activities.
It is a rapid expansion of and it is upgrade of infrastructure of Pakistan. It’s a part of China’s 13th
five year plan. The investment of China Pakistan Economic Corridor is provided by the Exim bank
of China, China development bank, industrial and commercial bank of China. An 1100 kilometer
long motorway will be constructed between Karachi and Lahore. It is also an extention of CPEC

Ramzan…
96
project. It is also estimated that Pakistan’s railway would be extended to connect china xinjing
railway in kasgher. A network of gas pipeline between Nawabshah and Gwader to eventually
transport gas from Iran including $2.5 billion. To overcome energy crises of Pakistan, in May
2013, when Chinese premier Li-keqiang emphasized the construction of the CPEC during his visit
in Pakistan. He signed the agreement at that time. Eight agreements were signed by the Prime
Minister of Pakistan having the cost of $18 billion. For the planning of China Pakistan Economic
Corridor president of Pakistan Mamnoon Hussain visited china in February 2014. Prime minister
of Pakistan Nawaz sharif visited China same year and signed 18 different agreement of the
corridors. Its cost is about $ 46 billion is much more than the billion FDI which Pakistan has
received from years and from the aid which Pakistan has received from U-S 9-11. The construction
period of CPEC is from 2014 to 2030. The short term project will be completed by 2017, mid term
completed by 2025 and long term completed by 2030. CPEC is now moving into the
implementation phase On May 2016, there was an open ceremony held in the city of sukkar and
Pakistan’s Sindh province because construction between the highway of sukkar and Multan. It’s a
major component of CPEC’s plan for infrastructure. As soon as the corridor is complete, it would
be connected to Africa, Middle East and Europe. Corridor will provide opportunities to all
countries either to invest in Pakistan or any other country of the world. In the deep sea port of
Gwadar for developing special economic zone Pakistan signed lease with China and rented 23
years acers of land. CPEC will provide massive opportunities to both countries. The CPEC will
open door of opportunities not only for Pakistan but also connect China to its market of China. A
huge benefit of the Corridor to China is the reduction of distance between Malacca to shanghai. it
will reduce from 16000 to 5000 kilometer. For China this corriodor will provide an alternative
route to import energy. This project will provide many external and internal challenges for
Pakitan’s Government to multi dollars project. Through this project Pakistan will modernize. It
will improve trade and economy, enhance connectivity, overcome energy crises and develop infra
structure. Pakistan is now try into improve and make good ralations with other countries. In
1951, Pakistan and China became good friends. Pakistan and china has a glorious history of
journey.
It is estimated that this project will provide job opportunities about 700000 direct jobs during the
period of 2015 to 2030. CPEC has a special focus on meeting high energy demand in China and
Pakistan. More than 21000 MW has been expected to produce in Pakistan. From $ 46 billion, $ 12
billion would estimated to spent on infrastructure and $ 34 billion would estimated to spent on
producing electricity. CPEC is an ongoing mega project. It will run about 27000 kilometer from
Gwadar to Kasghar. The investment of $46 billion for the entire project is the huge investment of
China.
The corridor will prove a game changer for Pakistan and make Pakistan a richer and develop
country. This project will prove a huge one benefit for other investor. It will provide infrastructure
for Pakistan .It will prove a back bone to Pakistan economy. With the support of China in the
China Pakistan Economic Corridor project significance of Pakistan has been improved in the
whole world. China has steadily appeared as Pakistan largest trading partner equally in terms of
trade. Its aim is to create linkage and communication between Pakistan and china by develop trade
corridors that would facilitate economic activity along the corridors. After the open ceremony of
CPEC, construction start on a part of highway between Sukkar and Multan. This network is a
major component of CPEC’s plan for infrastructure expansion, which highlights the development
of two countries. In the addition on November 13, 2016 the first large shipment of Chinese goods
traded through the port of Gwader, a flagship CPEC project in Pakistan’s South Westren province
Ramzan…
97
of Balochistan. Chinese hope that through economic development it will increase the economic
stability in Pakistan. It is not only the infrastructure but also construction of gas pipeline. Pakistan
serves as an important bridge between China, Central Asia, south Asia and Middle East. Stability
in Pakistan will improve the relations of China with other countries. It also provides China security
and stability. This is why China is going to invest a huge amount on the infrastructure of Pakistan.
China also realizes that no other country had such strong strategic relations with it as Pakistan.
With such an infrastructure Pakistan will surely move from lower level income nation to upper
level middle nation. To achieve this goal it must be increase the Foreign Direct Investment (FDI).
An element that identify or determine the nature of something or that fix or condition an outcome.
For example education level as a determinant of income. It can also be define as factor or element
that limits or define a decision or condition. Comparative Advantage can be defined as a concept
in economics that a country should specialize in producing and exporting only those goods and
services which it can produce more efficiently at lower opportunity cost than other goods and
services (which it should import). Comparative advantage results from different endowments of
the factors of production (capital, land, labour) entrepreneurial, skill, power, resources and
technology etc. it therefore follows free trade is beneficial to all countries because each can gain
if it specializes according to its comparative advantage. The theory of the comparative advantage
states if country specialize in producing goods and services where they have a lower opportunity
cost, then there will be increase in economic welfare. The law of comparative advantage was
formally developed by British political Economists David Ricardo. His idea greatly influenced the
development of economics as a science. He introduced this concept in his book, PRINCIPLE OF
POLITICAL ECONOMY AND TAXATION in 1817 although it is likely that Ricardo’s mentor
James Mill originated the analysis. RCA is an index used in international economics for calculating
the relative advantage or disadvantage of a certain country in a certain class of goods and services
as evidenced by trade flows.
Regional infrastructure also help to increase standard of living and reduce poverty by connecting
isolated places and people with major economic centers and markets and filling narrow
development gap among regions. CPEC is critically important for both countries. Pakistan needs
it to be overcome its economic development, social and energy problem with china needs it to be
expands its periphery of influence and consolidation its global presence. According to
development Economists infrastructure is considered necessary condition for industrialization.
With the help of infrastructure markets developed and access of markets become easier. It also
reduces poverty because people get a job and unemployment must decrease. Infrastructure means
buildings and roads. Physical infrastructure may be of two kinds:
1. Economic infrastructure. 2. Social infrastructure. Economic infrastructure includes roads,
2. irrigation, telecommunication and electricity. Social infrastructure includes water supply,
sewage system and hospital. Trade is known as the act or process of buying, selling or exchanging
commodities at retail price between countries. International trade has played a vital role in the
welfare and development of all countries. Due to the importance of trade it is very difficult to avoid
international trade because it is fulfilling the growing needs of all nations. Theories of absolute
and Comparative Advantage is considered beneficial and important because of its efficiency and
welfare effects. International trade has flourished over the years of due to many benefits. It is also
one of the most important source of revenue of developing countries. Trade among nations is not
a new concept but there are several instances of international trade. A rise in international trade is
necessary of growth of all countries and nations. Nations with strong international trade have
become prosperous and develop. With the help of international trade it has become more powerful
Ramzan…
98
for world economy. It has contributed mostly in the reduction of poverty and unemployment. It
can also reduce income inequalities within nations by increasing the income of unskilled labourer
in labour abundant countries. Empirical evidences shows that distributions of trade gains among
nations almost uneven. This has given birth a sort of controversy among economists regarding the
gains of trade. On the basis of above controversy kavoussi(1985) divide trade economists into two
groups. First is in favor of free trade export promotion and outward looking trade policies and this
group is known as optimists economists. Second is in favor of inward looking supports import
substitution and protection policies and this one known as pessimists. In today’s world trade
optimization is dominant. Every nation wants to maximize its gain and rather than the other nation
gains. China is a modern developing countries with good economic condition. China has superb
relations with its neighbours like Pakistan. Pakistan is one the first countries of the world to
recognize china, since then they have good relations with each other. Pakistan and China entered
into a trade agreement in January, 1963 on trade and commerce. Trade between border regions of
china and Pakistan started in 1969. Further trade protocols signed over the years. The construction
of Korakaram Highway was helped to further trade and communication. Pakistan is an important
for China. A lot of development projects are in process with the cooperation of China for the job
opportunities both China and Pakistan. Pakistan has treated China as economic partner. In the last
few years investment of more than US$1.3 billion was made by China in Pakistan. Chinese has
invested in Pakistan in telecommunication, energy, infrastructure, mining and defense related
industries. There is a high demand for Chinese good in Pakistan’s market. Their xperience of
growth in trade is positive. Bilateral trade has reached US $3.31 billion in 2009. The balance is in
favor of China due to lesser exports of China. Balance of trade has increased US$ 1.38 billion in
2005_2006 to US$ 2.0 billion in 2008_2009. Important factor of trade deficit with China is
growing exports of Chinese product to Pakistan. China has achieved considerable success in
formulating a peaceful environment. In the 1990’s during the Asian financial crises China has
provided help to neighbor countries. During the unstable international conditions China and
Pakistan ‘s friendship has remained strong and vibrant. China has become one of the top five
import sources of Pakistan. Bilateral trade has reached around seven billion between 2008 and
2010 and is on the rise. Pakistan is 66th largest export economy in the world and the 110th most
complex economy according to Economic complexity index. In 2015, Pakistan exported $ 26.2
billion and imported $ 45.5 billion resulting in negative balance of trade. Top exports of Pakistan
are house lineecns ($2.99 billion), rice ($1.91 billion), non retail pure cotton yarn ($1.75 billion),
non knit men’ suits ($ 1.49 billion), heavy pure woven cotton ($1.01 billion) using the 1992
revision of HS (harmonized system) classification. Its top imports are refined petroleum ($5.46)
billion, crude petroleum ($2.74 billion), palm oil ($1.58 billion), scarp iron ($945 million) and
cars ($807 million). China is the largest export economy in the world and the 38th most complex
economy according the economic complexity index. In 2005, China exported $ 2.37 trillion and
imported $1.2 trillion resulting a positive balance of trade of $ 1.1 trillion. In 2015, GDP of China
was $11 trillion and GDP per capita was $14.5 k. TOP exports of China are computer ($188b),
broadcasting equipment ($165b), telephone ($112b), integrated circuit ($657b), and office
machine parts ($45.5b), using the 1992 revision of HS (harmonized system) classification. Its
imports are crude petroleum ($119b), integrated circuits ($95.2b), gold (65.8b), iron ore (42.9b)
and cars (38.5b). Whenever a country has a comparative advantage in production it can take
advantage of specialization. However specialization has a positive effect on an economy. The
nations specialize in that areas in which resources are abundant and they can produce cheaply.
Nations can gain benefit of increasing return to scale. They can also achieve economies of scale
Ramzan…
99
which means average cost of producing anything is minimum. Specialization also means nations
are efficiently producing such goods and in this way nations are making better off themselves.
Another benefit is that producers produce more and prices are lower for consumers and they can
easily access. The nations who are specialized means that they have achieved fully skilled about
producing these goods and services. It also saves time and allow rapid work. When a country can
produce more of a good with a same resources that another country can, it is said to have an
absolute advantage in the production of that good. It is the second country has an absolute
advantage producing a good that the first country wants both will be better off if they specialize
and trade. We individuals are not self sufficient because we have not same natural resources, land,
infrastructure, technology and investment. Each and every nation has different scenario. For the
fulfillment of our needs and wants we have to exchange goods and services which process is known
as trade. We want to import the country who offers us at cheaper rate. The importing countries
then compete with each other and without specialization their quality of good deteriorates. And if
it happens then demand for such goods in international market falls that’ s why specialization is
most important for all nations.
Every country tries to make its maximum through trade. In 1817, a political economists David
ricardo in his book of principle of political economy and taxation proposed a theory of comparative
advantage. This theory can also be named as comparative cost theory and classical theory of
international trade. According to this theory the country has abundant resources it can fully utilized
and efficiently produce the commodities at a very low cost and after meeting the domestic demand
the surplus of that commodity import for the commodities in which this country cannot fully
utilize their resources and inefficient in producing that commodity. It can also be stated that others
things remaining the same a country can surely produce those commodities in which it have more
comparative advantage and less comparative disadvantage. Ricardo explained his theory with help
of the assumption. These are as under:
1. There are two countries and two commodities.
2. There is a perfect competition in factor market and commodities as well.
3. Labour is the only factor of production rather than natural resources.
4. Labours are identical in efficiency.
5. Full employment exist in both countries.
6. Transportation cost is zero.
7. Technology remains the same.
8. There is a constant returns to scale rather than increasing to scale.
9. Trade based on barter system.
10. There are no restrictions on trade and It indicates free trade.
11. Cost of production is measured in terms of labours per hour which is used to produce it.
According to this theory a country can maximize its per capita income by fully utilizing the
resources of its country. In earlier, firms used to perform domestically and use all its resources in
producing those commodities in which it have absolute advantage but with globalization same
firms has crossed its domestic bounderies. Now these firms had make their place in international
markets and introduced themselves as super markets. This is known as relative comparative
advantage. It is an index which is used in calculating the relative advantage in certain commodity
class of goods and services. The objective of the study to measure RCA of Pakistan with respect
to China for different sectors commodity wise with the sample period of 1985 to 2015. RCA is
equal to the country’s export that are of the sector under considerations (Eij/Eit) divided by the
proportion of world’s exports (Enj/Ent). A Comparative Advantage is revealed if RCA>1 and if
Ramzan…
100
RCA<1 it means that country has comparative disadvantage in the commodity for which you
measure revealed comparative advantage. The concept of RCA is same as economic base theory
but it uses employment rather than exports. In this study we use time series data of exports and
imports of Pakistan, china and world commodity wise and total trade from the website of world
trade organization. For export sample period is 1984 to 2015 and for import from 1985 to 1990.
The study shows revealed comparative advantage in the sectors of Pakistan, India and Bangladesh.
This study uses Balassa’s index for this analysis. The results show that Pakistan has highest
revealed comparative advantage in textile over India and Bangladesh. India has revealed
comparative disadvantage in textile relative to Pakistan and Bangladesh. For clothing Bangladesh
has a dominant revealed comparative advantage as compared to Pakistan and India. Bangladesh
has gaining a dominant revealed comparative advantage since 1980. India has very low
comparative advantage in both textile and another study explains that Turkey has a comparative
advantage in tomato, olive oil and fruit industries and how it fluctuate from 1995 to 2005 in the
UE market. Import demand is estimation is estimated for rival countries. Using regression analysis
if turkey has a competition for those countries then demand has a significantly effect on price. It
has a strong comparative advantage in it. In this study our objective is to estimate the gains from
trade in content of two countries. Named as china and Pakistan and also want to see the Revealed
Comparative Advantage of these two countries in different sectors. The sectors in which Pakistan
has more Comparative Advantage it can maximize their gain by improving these sectors. And
China Pakistan economic corridor which is the most burning issue now_ a_ days from this project
Pakistan can maximize its gain of trade because this project of development is providing more than
enough opportunities for Pakistan of employment and also reduces the distances of Pakistan with
other South Asian countries. In this study I have collected data on these variables named as
revealed comparative advantage of imports in the sectors of agriculture, food, manufacturers,
office and telecom equipment, textiles and clothing for the time period of 1985 to 2014 for China
and Pakistan. Similarly for the exports I have calculate RCA for the sectors of agriculture, fuel and
mining, food, manufacturing and office and telecom equipment for both China and Pakistan for
the time period of 1984 to 2015. for another sectors of Pakistan and china RCA during the time
period of 1990 to 2015 sectors include agriculture, food, fuel and mining, manufacture, iron and
steel, chemicals, machinery and telecom equipment, automotive products, textile and clothing. In
RCA of Imports Pakistan has revealed comparative advantage in the sectors of agriculture,
automotives, chemicals, food, fuel and after 2004 Pakistan has high revealed comparative
advantage in iron and steel. China has dominant revealed comparative advantage in office and
telecom equipment, manufacturer, clothing and machinery and telecom equipment. In case of
exports Pakistan has revealed comparative advantage in sectors of agriculture, clothing, food and
textile. On the other hand China has high RCA as compared to Pakistan in the sectors of automotive
products, chemical, iron and steel, office and telecom equipment and manufacturing. For Pakistan
I have take the some factors as independent variable such as GDP growth, GDP at market prices
(at constant 2010 Us$), GDP per capita (at constant 2011 US$), GDP per capita at growth ( annual
%), inflation at consumer prices (annual %), inflation deflator (annual %), trade % of GDP, foreign
direct investment (net balance of payment current US $), foreign direct investment net inflows (%
of GDP), real effective rate (2010=100), real interest rate (%) and official exchange rate.
Theoretical Framework, Econometric Methodology And Data Sources

Ramzan…
101
During the seventeenth and eighteenth century there was a famous concept at that time which
was known as mercantilism. It can be used for severe restrictions and to increase exports. As a
result the surplus of export supposed to enrich nation by the inflows of precious metals. Adam
smith (1776) who is known as father of Economics presented his theory of absolute advantage by
rejected the concept of mercantilism. He argued that at the same time all nations cannot be rich
according to the mercantilism’s view that one country’s exports are another county’s imports.
All nations can be rich at a same if they specialized in which they have absolute advantage and
they also practiced free trade (Yu, Cai, & Leung, 2009).
Absolute advantage
US UK
Wheat/bushel 6 1
Cloth/yards 4 5
The above table shows the concept of Smith’s Absolute Advantage quantities of wheat and cloth
produced of an hour work in two countries United States and United Kingdom. United states has
an absolute in wheat and UK has in cloth. Determination of Smith’s Absolute Advantage by a
simple comparison of both countries. The theory of Smith explains that US will only produce
wheat and UK will produce cloth. Both nations gain only if they have restricted trade in wheat and
trade. If they trade 6wheat for 6 clothes then the gain of United States is ½ hour of work, which is
required to produce 2 extra cloth that is getting through trade with UK. The UK stops wheat
production, but the 6w it get from US will have 6 hours of labour time. After exchanging 6 wheat
out of 30 Uk has 24 wheat which is equal to the 5 hours of labour time. Nations can produce more
and can gain maximum benefit from international trade. Although absolute advantage is
determined by the simple cmparison of laour productivity but it is possible for a nation that it does’
not have absolute advantage. In above table if the labour productivity in cloth in US becomes 8
instead of 4 then US have an absolute advantage in both and UK has absolute disadvantage rather
than absolute advantage. However Adam Smith has a concern with the role of foreign trade in
development of any economy and his model was essentially a dynamic one. Another classical
Economists known as David Ricardo (1817) presented the theory of comparative advantage.
Ricardo focused on labour productivity or (resourse productivity more generally) for different
products in a country. According to his theory a country should export the commodity that it can
produce at a very cost opportunity low in terms of other good that could be produced within a
country. A country will import only those products it would produce at a very high opportunity
cost Assumptions of the theory are the following:
1. There are two countries and two commodities.
2. There exists perfect competition in all markets of a country.
3. One factor input is used in production in each industry. This factor input is assumed to
be homogeneous in quality and fixed in quantity and always fully employed.
4. Factor is freely mobile between industries and immobile between countries.
5. Factor used for input has a constant cost in industry.
6. There exists no transport cost, quota and tariff. (Levich)
Ricardo have explained by the help of table of one US labour in wheat production is 1.5=(6/4) as
productive in cloth production. On the other hand UK’s labour productivity in wheat is only one
fifth of cloth. US has comparative advantage in wheat and by inversing the ratio UK has a
comparative advantage in cloth. If we raise US labour productivity in cloth from 4 to 8 then ¾
still be greater than 1/5. The ratio comes from Ricardo’s theory of value. Ricardo treated labour as

Ramzan…
102
the only source of value because capital as a factor of production also produced by labour. Thus
the price of a good is simply p equals to the wage rate times the labor used in production divided
by Q as profit is zero in comparative markets. If the labours are competitive than wage rate would
be equal in all industries. Therefore the ratio between the price of wheat and price of cloths would
be equal to average productivity of labour aw:[pw/pc] =[ac/aw]. In a competitive economy a
positive link between relative prices and relative commodity prices. If US has a comparative
advantage in wheat than it will be relatively cheaper in US rather than in UK. Theory of
comparative advantage has some criticismon its assumptions. The assumptions of the theory ars
unrealistic because it ignore the facts that all nations have different way of producing and there are
many nations producing many goods. In reality there exists no perfect competition because some
markets has market power. Countries used different technology rather than same. Comparative
advantages changes as trade in goods and capital changes and changes in factor endowment.
Ricardo’s theory of comparative advantage carries an important massage. He is first one economist
who introduced the concept of trade and specialization which is the base of modern trade theory
(Yu et al., 2009).
The idea to determine a country’s strong sector was presented by Liesner 1959. Since the produced
was refined and famous by BELA BALASSA (1965, 1989) which is known as BALASSA
INDEX. Alternatively as the actual export flow reveals, the country’s export sector it is also
defined as revealed comparative advantage. This is normalized as exports share (Bela Balassa,
1965; B. Balassa, . (1965), ; Hinloopen & Van Marrewijk, 2001, 2008).
Revealed comparative advantage is an index used in International Economics for
calculating relative advantage or disadvantage of a certain country in a certain class of goods and
services. It is based on Ricardian comparative advantage concept. It is most commonly refers to
an index introduced by BELA BALASSA. In 2010, soybeans represented 0.35% of world with
export of 42 billion. Of this total Brazil exported $11 billion and since Brazil’s total export was
140 billion of the year. The share of soybeans was 7.8 % of total from Brazil. Because 7.8/0.35
=22 %. The actual share of export of Brazil is 22 %. So we can say by this example that Brazil
has a high revealed comparative advantage in export of soybeans. (B. Balassa, . (1965), ;
Utkulu & Seymen, 2004)
In few areas of economics as the behavior of foreign trade flows over the last thirty five year are
investigated empirically. There is no difficult task to find reason of abnormal degree. First the data
base is rich one which means that statistics on export and import extended over long period of
time. Second the underlying theoretical framework for the determination of trade volume and
prices from consumer demand and prices are well-known with consumer demand and production
theory and can do relatively with few explanatory variable (Nathan Nunn, 2014).
Modeling international trade flows on several things:
1. Traded goods.
2. Use of traded good.
3. Purpose of modeling.
4. Trade policy of different countries.
Before develop a trade model a researcher should keep in mind few things.
1. Either traded goods are homogeneous primary products or it may be differentiated final
products.
2. Either the model is going to test for forecasting or hypothesis testing.
3. Either the goods are traded for consumption or input use.
4. How much liberalized trading economies.
Ramzan…
103
Here we defined two models of trade.
1. Perfect substitute of model.
2. Imperfect substitute of model.
We criticize the perfect substitute of model in literature because if both goods are perfect substitute
and produced under constant or decreasing returns to scale then it should captures the whole
foreign or domestic market. Thus a country can be exporter or importer but not both. The empirical
literature shows that traded goods are not perfect substitute of domestic goods. Because both
coexist in same market. The increasing trade among the nations and existence of intra industry
trade also put a question mark on the validity of hypothesis of perfect substitutes (Chani &
Chaudhary, 2012). Basic export demand model is expressed as:
1 2 3 4 5 6 7 8 ,
1984,1985,1986,.., 2015
t t t t t t t t tRCAA INF ER IR TRADE WGDP GDP FDI
t
where
RCAA is the dependent variable and it is denoted as the RCA of agriculture sector of china. INF
is denoted as inflation deflator, ER is of official exchange rate, IR is of real exchange rate, TRADE
as measured as a percentage of GDP, WGDP denoted as world Gross Domestic Product. GDP
measured as current US dollar and FDI is Foreign Direct investment net inflows (BOP current
USD $) and is the error term for the time period of 1984 to 2015
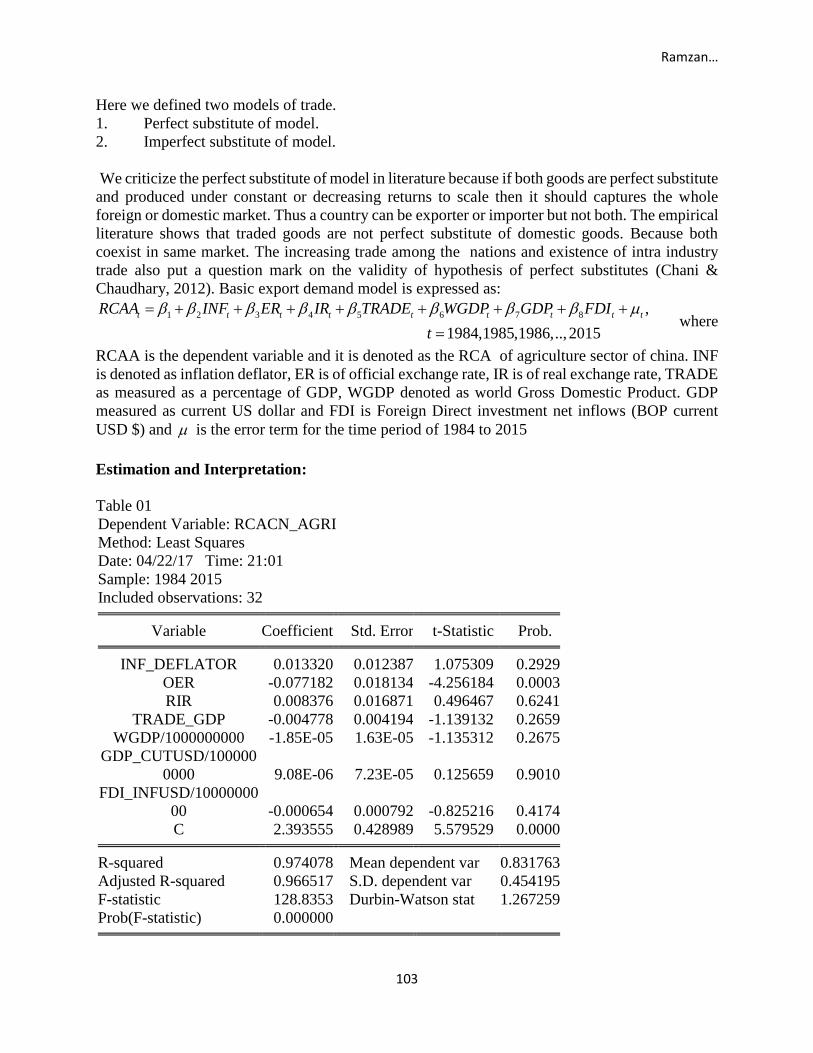
Estimation and Interpretation:
Table 01
Dependent Variable: RCACN_AGRI
Method: Least Squares
Date: 04/22/17 Time: 21:01
Sample: 1984 2015
Included observations: 32
Variable Coefficient Std. Error t-Statistic Prob.
INF_DEFLATOR 0.013320 0.012387 1.075309 0.2929
OER -0.077182 0.018134 -4.256184 0.0003
RIR 0.008376 0.016871 0.496467 0.6241
TRADE_GDP -0.004778 0.004194 -1.139132 0.2659
WGDP/1000000000 -1.85E-05 1.63E-05 -1.135312 0.2675
GDP_CUTUSD/100000
0000 9.08E-06 7.23E-05 0.125659 0.9010
FDI_INFUSD/10000000
00 -0.000654 0.000792 -0.825216 0.4174
C 2.393555 0.428989 5.579529 0.0000
R-squared 0.974078 Mean dependent var 0.831763
Adjusted R-squared 0.966517 S.D. dependent var 0.454195
F-statistic 128.8353 Durbin-Watson stat 1.267259
Prob(F-statistic) 0.000000
Ramzan…
104
From this table we have analyzed that here revealed comparative advantage of agriculture sector
is a dependent variable and independent variables include inflation, exchange rate, interest rate,
trade, world GDP, GDP and FDI. There is a positive relationship between inflation deflator and
RCA agriculture indicate that any increase in the inflation deflator cause an increase in RCA
agriculture. Probability value of inflation deflator is greater than alpha which is 10 % which
indicate that it is insignificant. Exchange rate has a negative relationship with RCA of agriculture
and it is significant because P. value is less than level of significance. Interest rate has a positive
relationship but it is insignificant. Trade has a negative relationship and it is also insignificant.
There is a negative relationship between RCA of agriculture and World GDP and here it is also
insignificant. There is a positive relationship between GDP and RCA of agriculture and it is
insignificant also. Finally, FDI has a negative relationship and it is insignificant as well. R square
explains the explanatory power of the model which is (97 %) and remaining 3 % is explained by
the other variable which we not include in the model. The reported F-stat (128.8353) and its
corresponding p. value is (0.000000) indicate that our overall regression model is significant at 5
% level of significance. As P. value is less than 5 % so we will reject the null hypothesis of
insignificant. (CHINA…exports)
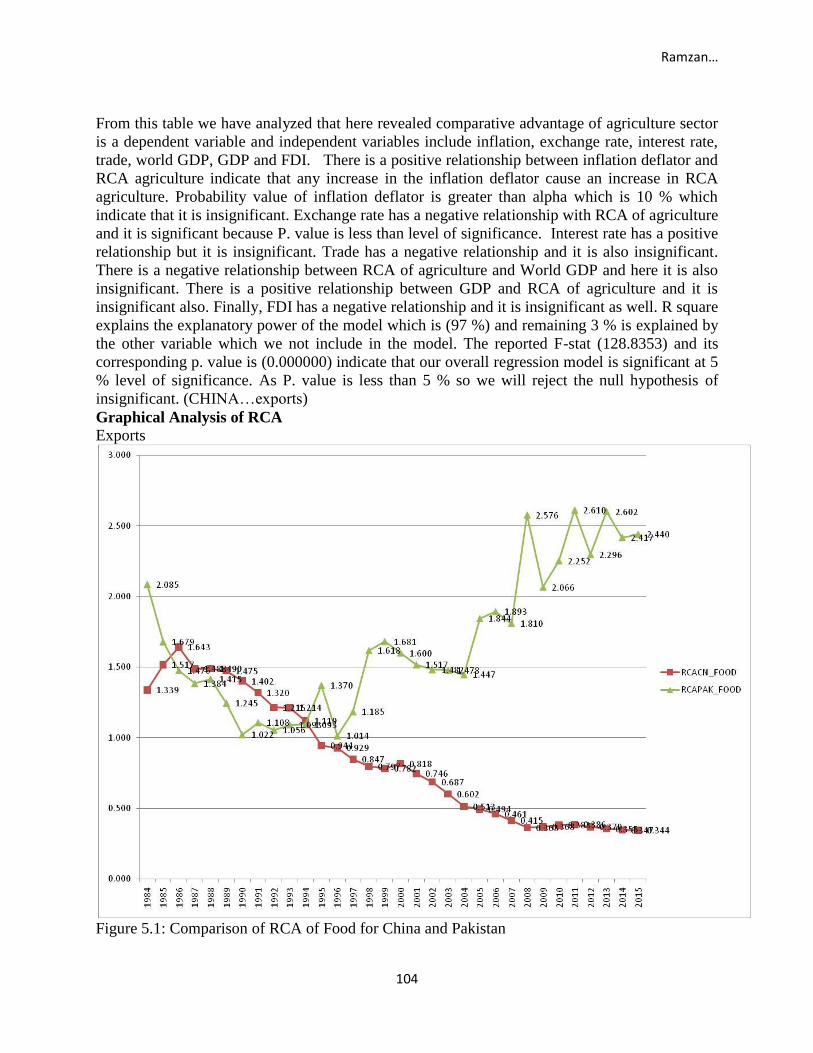
Graphical Analysis of RCA
Exports
Figure 5.1: Comparison of RCA of Food for China and Pakistan
Ramzan…
105
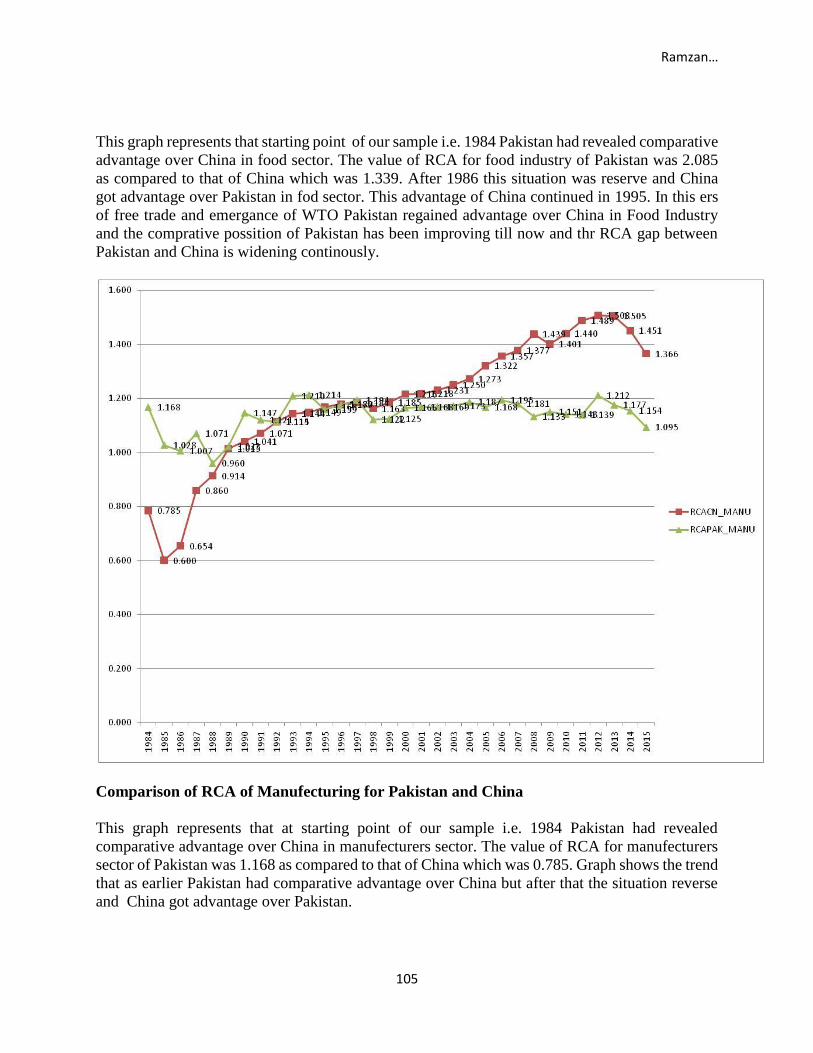
This graph represents that starting point of our sample i.e. 1984 Pakistan had revealed comparative
advantage over China in food sector. The value of RCA for food industry of Pakistan was 2.085
as compared to that of China which was 1.339. After 1986 this situation was reserve and China
got advantage over Pakistan in fod sector. This advantage of China continued in 1995. In this ers
of free trade and emergance of WTO Pakistan regained advantage over China in Food Industry
and the comprative possition of Pakistan has been improving till now and thr RCA gap between
Pakistan and China is widening continously.
Comparison of RCA of Manufecturing for Pakistan and China
This graph represents that at starting point of our sample i.e. 1984 Pakistan had revealed
comparative advantage over China in manufecturers sector. The value of RCA for manufecturers
sector of Pakistan was 1.168 as compared to that of China which was 0.785. Graph shows the trend
that as earlier Pakistan had comparative advantage over China but after that the situation reverse
and China got advantage over Pakistan.
Ramzan…
106
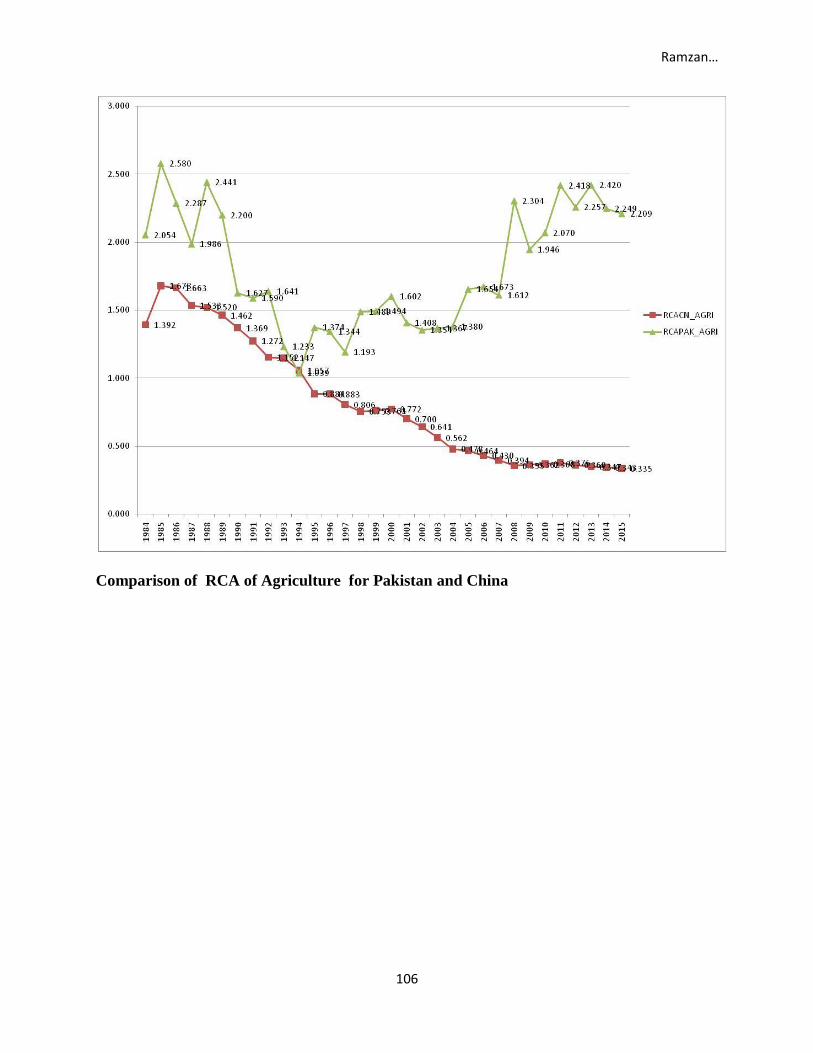
Comparison of RCA of Agriculture for Pakistan and China
Ramzan…
107
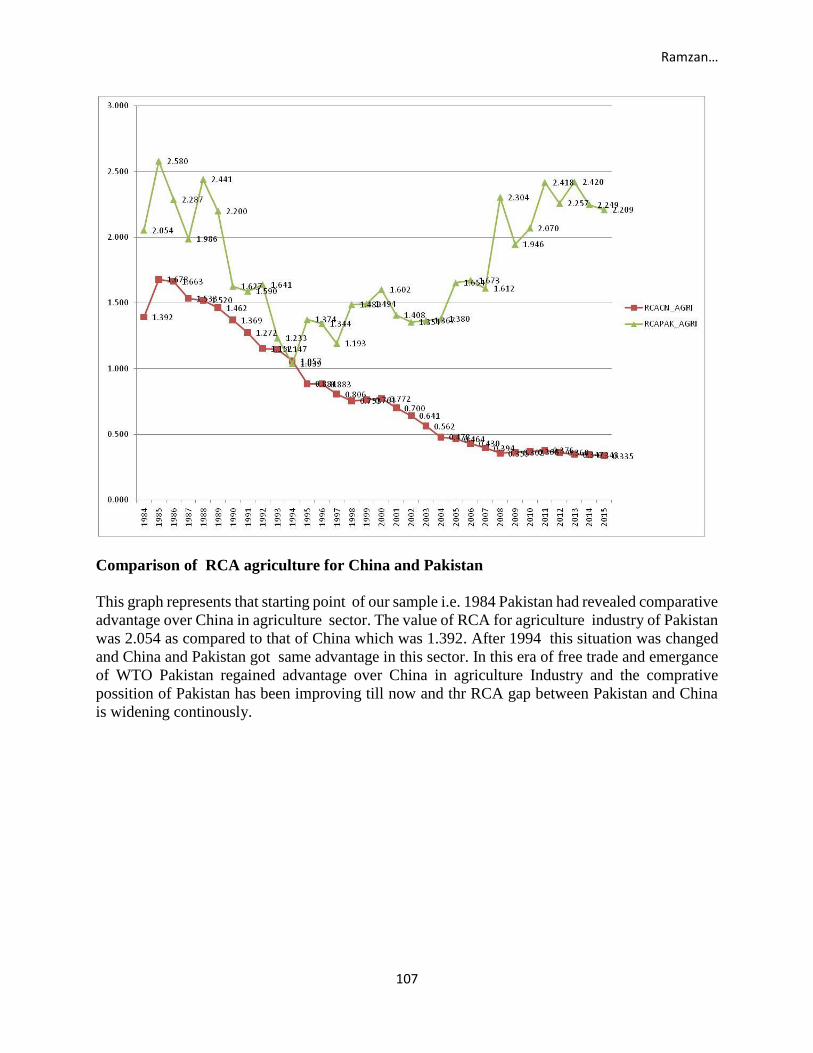
Comparison of RCA agriculture for China and Pakistan
This graph represents that starting point of our sample i.e. 1984 Pakistan had revealed comparative
advantage over China in agriculture sector. The value of RCA for agriculture industry of Pakistan
was 2.054 as compared to that of China which was 1.392. After 1994 this situation was changed
and China and Pakistan got same advantage in this sector. In this era of free trade and emergance
of WTO Pakistan regained advantage over China in agriculture Industry and the comprative
possition of Pakistan has been improving till now and thr RCA gap between Pakistan and China
is widening continously.

Ramzan…
108
Comparison of RCA of Office and Telecom of Pakistan and China
This graph represents that starting point of our sample i.e. 1984 Pakistan had revealed comparative
advantage over China in Office and Telecom sector. The value of RCA for Office and Telecom
of Pakistan was 0.032 as compared to that of China which was 0.026. In 1985 the value of this
sector of China becme approximately equal to that of China. From 1996 China got advantage in
this sector which is increasing one. For Pakistan the value had the same trend as before.

Ramzan…
109
Comparison of RCA of agriculture of Pakitan and China
This graph represents that starting point of our sample i.e. 1990 Pakistan had revealed comparative
advantage over China in agriculture sector. The value of RCA for food industry of Pakistan was
2.085 as compared to that of China which was 1.339. After 1986 this situation was reserve and
China got advantage over Pakistan in fod sector. This advantage of China continued in 1995. In
this ers of free trade and emergance of WTO Pakistan regained advantage over China in Food
Industry and the comprative possition of Pakistan has been improving till now and thr RCA gap
between Pakistan and China is widening continously.
Ramzan…
110
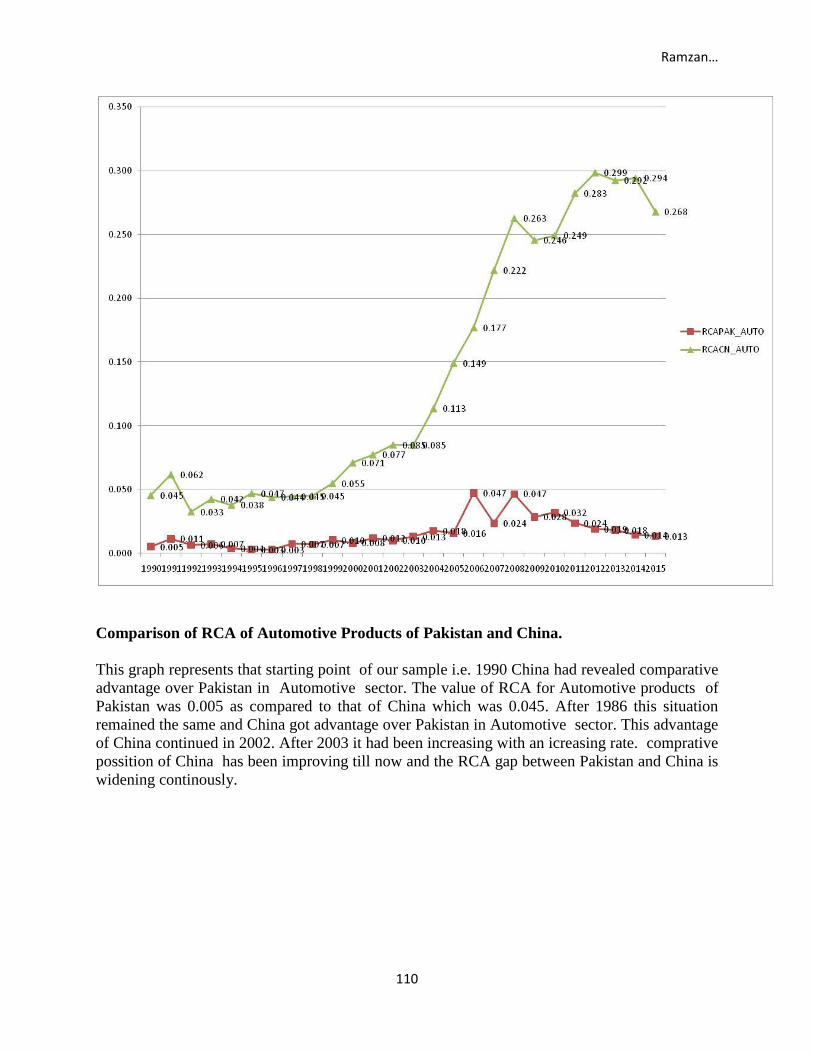
Comparison of RCA of Automotive Products of Pakistan and China.
This graph represents that starting point of our sample i.e. 1990 China had revealed comparative
advantage over Pakistan in Automotive sector. The value of RCA for Automotive products of
Pakistan was 0.005 as compared to that of China which was 0.045. After 1986 this situation
remained the same and China got advantage over Pakistan in Automotive sector. This advantage
of China continued in 2002. After 2003 it had been increasing with an icreasing rate. comprative
possition of China has been improving till now and the RCA gap between Pakistan and China is
widening continously.
Ramzan…
111
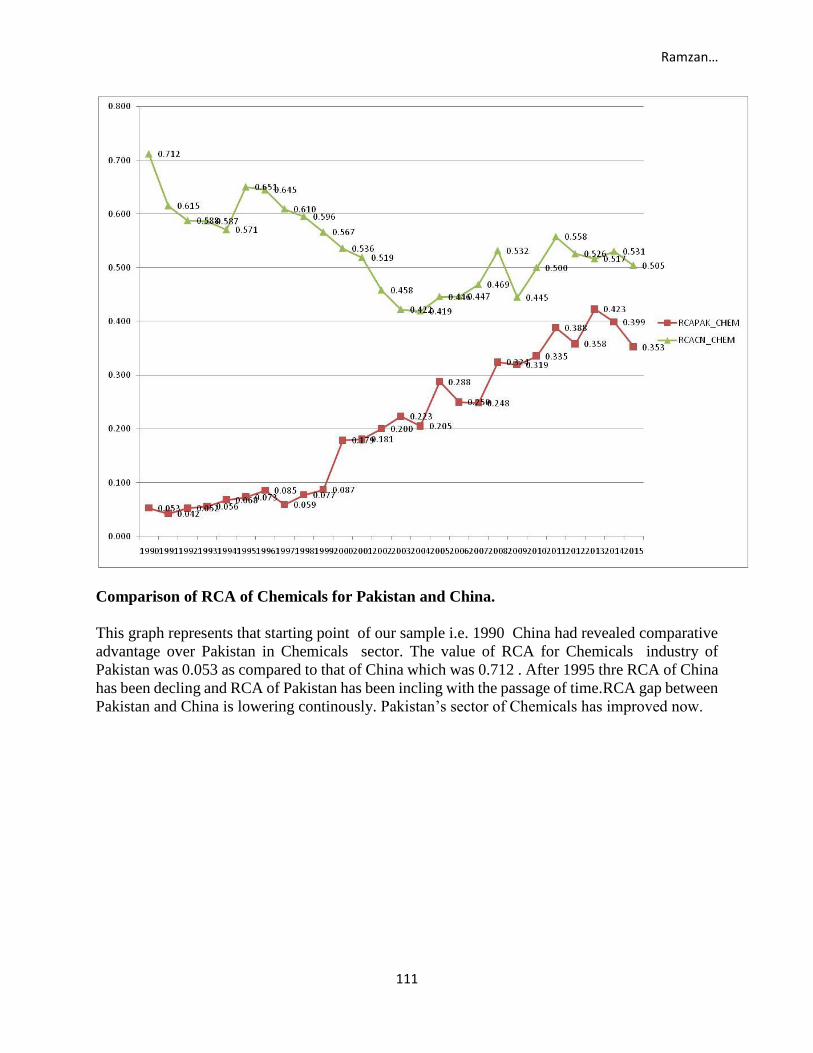
Comparison of RCA of Chemicals for Pakistan and China.
This graph represents that starting point of our sample i.e. 1990 China had revealed comparative
advantage over Pakistan in Chemicals sector. The value of RCA for Chemicals industry of
Pakistan was 0.053 as compared to that of China which was 0.712 . After 1995 thre RCA of China
has been decling and RCA of Pakistan has been incling with the passage of time.RCA gap between
Pakistan and China is lowering continously. Pakistan’s sector of Chemicals has improved now.
Ramzan…
112
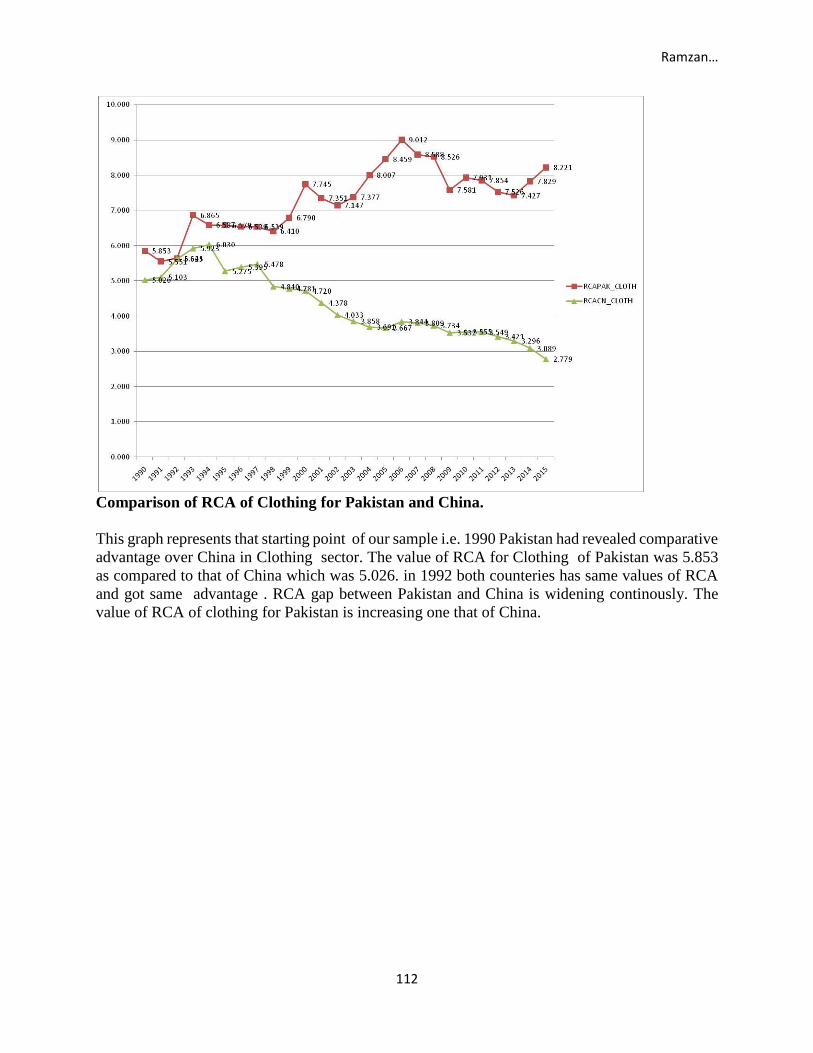
Comparison of RCA of Clothing for Pakistan and China.
This graph represents that starting point of our sample i.e. 1990 Pakistan had revealed comparative
advantage over China in Clothing sector. The value of RCA for Clothing of Pakistan was 5.853
as compared to that of China which was 5.026. in 1992 both counteries has same values of RCA
and got same advantage . RCA gap between Pakistan and China is widening continously. The
value of RCA of clothing for Pakistan is increasing one that of China.
Ramzan…
113
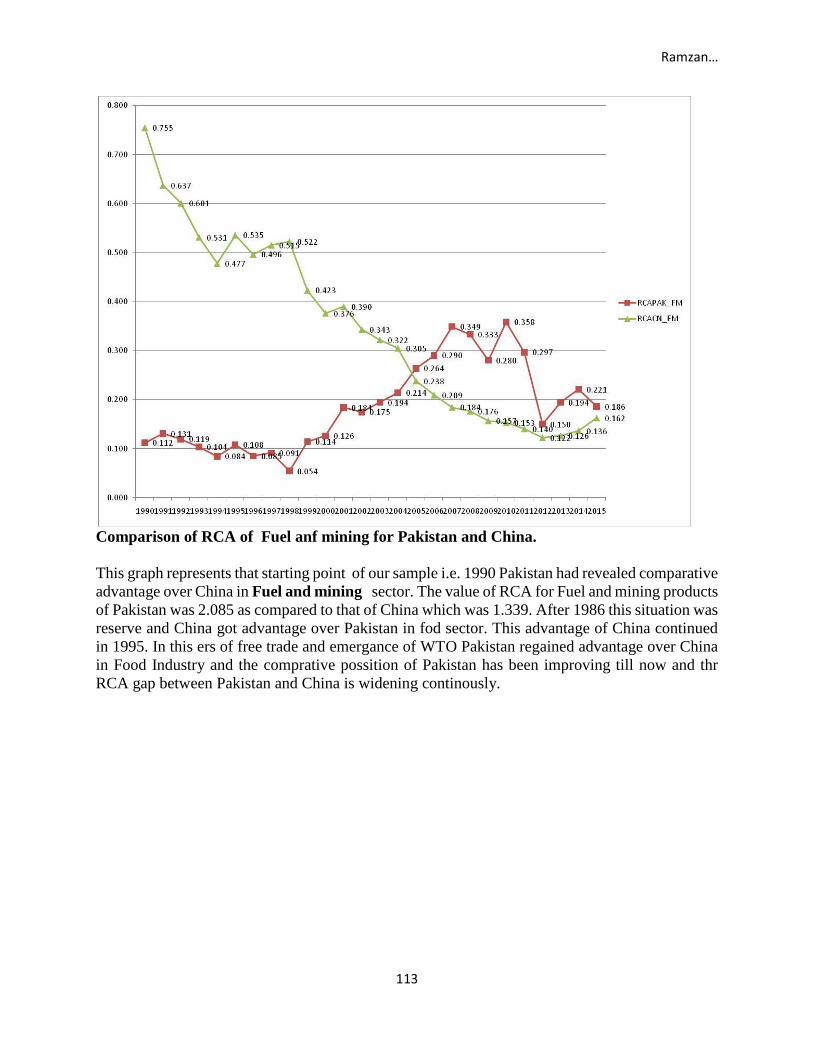
Comparison of RCA of Fuel anf mining for Pakistan and China.
This graph represents that starting point of our sample i.e. 1990 Pakistan had revealed comparative
advantage over China in Fuel and mining sector. The value of RCA for Fuel and mining products
of Pakistan was 2.085 as compared to that of China which was 1.339. After 1986 this situation was
reserve and China got advantage over Pakistan in fod sector. This advantage of China continued
in 1995. In this ers of free trade and emergance of WTO Pakistan regained advantage over China
in Food Industry and the comprative possition of Pakistan has been improving till now and thr
RCA gap between Pakistan and China is widening continously.

Ramzan…
114
Comparison of RCA of food for Pakistan and China
This graph represents that starting point of our sample i.e. 1990 China had revealed comparative
advantage over Pakistan Food sector. The value of RCA for food industry of Pakistan was 1.022
as compared to that of China which was 1.401. After 1994 this situation was reverse and Pakistan
got advantage over China in this sector. In this era of free trade and emergance of WTO Pakistan
improved this sector and got more advantage as compared to that of China and the comprative
possition of Pakistan has been improving till now and thr RCA gap between Pakistan and China
is widening continously.
Ramzan…
115
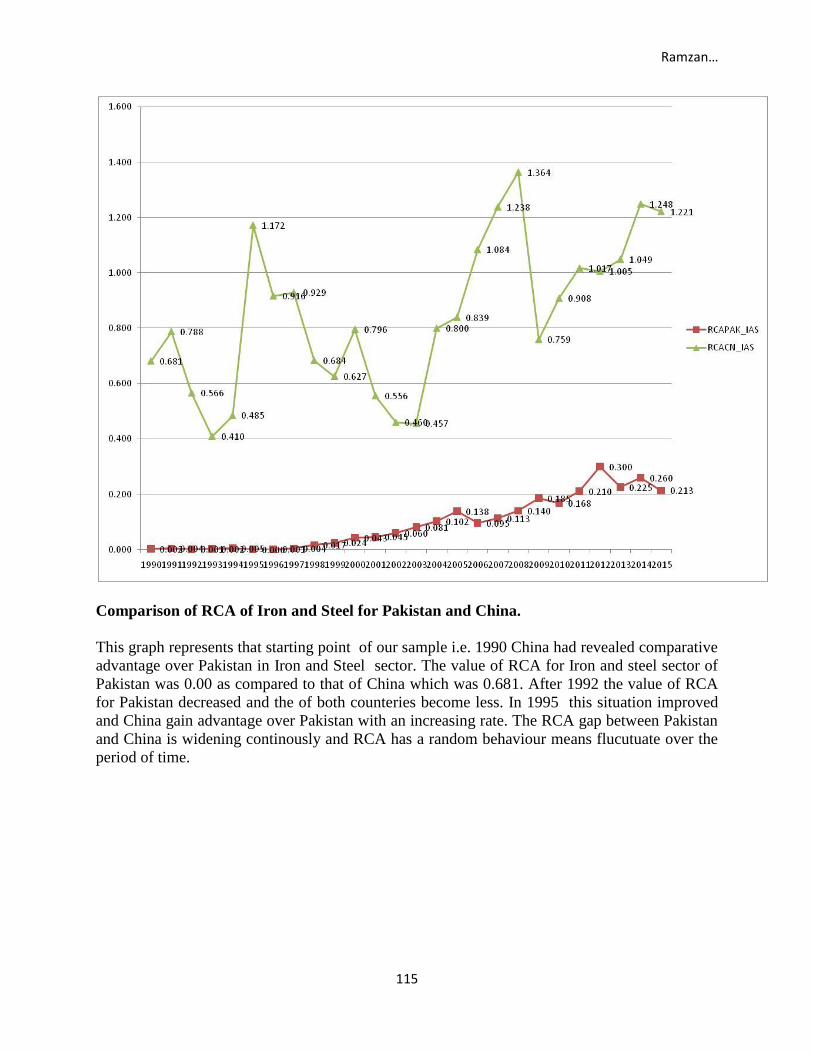
Comparison of RCA of Iron and Steel for Pakistan and China.
This graph represents that starting point of our sample i.e. 1990 China had revealed comparative
advantage over Pakistan in Iron and Steel sector. The value of RCA for Iron and steel sector of
Pakistan was 0.00 as compared to that of China which was 0.681. After 1992 the value of RCA
for Pakistan decreased and the of both counteries become less. In 1995 this situation improved
and China gain advantage over Pakistan with an increasing rate. The RCA gap between Pakistan
and China is widening continously and RCA has a random behaviour means flucutuate over the
period of time.
Ramzan…
116
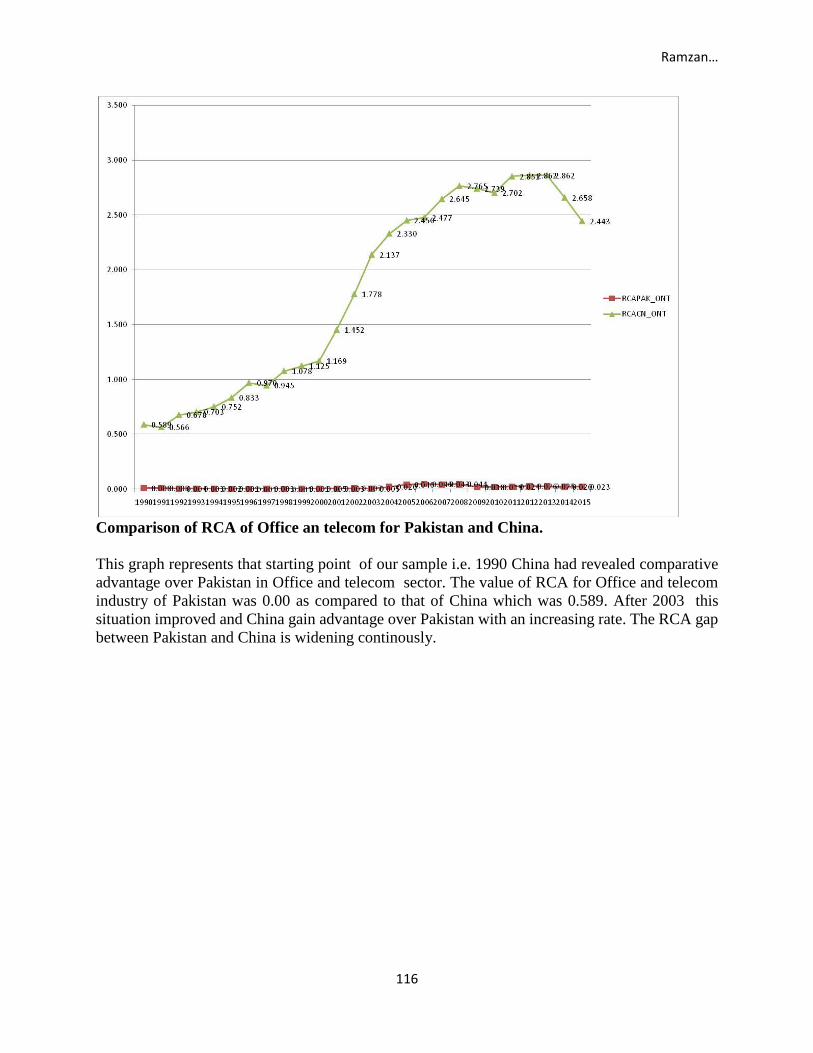
Comparison of RCA of Office an telecom for Pakistan and China.
This graph represents that starting point of our sample i.e. 1990 China had revealed comparative
advantage over Pakistan in Office and telecom sector. The value of RCA for Office and telecom
industry of Pakistan was 0.00 as compared to that of China which was 0.589. After 2003 this
situation improved and China gain advantage over Pakistan with an increasing rate. The RCA gap
between Pakistan and China is widening continously.

Ramzan…
117
Comparison of RCA of Textile For Pakistan and China.
This graph represents that starting point of our sample i.e. 1990 Pakistan had revealed comparative
advantage over China in Textile sector. The value of RCA for Textile industry of Pakistan was
15.93 as compared to that of China which was 3.889. In this era of free trade and emergance of
WTO Pakistan gained advantage over China in textile Industry and the comprative possition of
Pakistan has been improving till now and thr RCA gap between Pakistan and China is widening
continously.

Ramzan…
118
Comparison of RCA of Manufecturing for Pakistan and China.
This graph represents that starting point of our sample i.e. 1990 Pakistan had revealed comparative
advantage over China in manufecturing sector. The value of RCA for manufecturing sector of
Pakistan was 1.147 as compared to that of China which was 1.042 . After 1997 this situation was
changed and China had more advantage over Pakistan in this sector. China had improved this
sector and gained more advantage as compared to that of China.

Ramzan…
119
Comparison of RCA of machinery for Pakistan and China.
The graph represents that at starting point of our sample i.e. 1990 China has more revealed
comparative advantage over pakistan in manufecturing. The value of RCA for manufecturing
sector of Pakistan was 0.02 as compared to that of China which was 0.502. China ‘s RCA was
increasing one with the time period. In 2003 RCA of Pakistan was increased but relatively low as
China. The gap between China and Pakistan is increasing widely.
Conlusion:
In the study we have find determinats of RCA and its impact on CPEC. The objective of the study
is to find determinants of Revealed Comparative Advantage. With the help of these determinants
we can improve the sectors of Pakistan from wich pakistan can gain more from the project of
CPEC. It can maximize our gains of trade with China and other nearbying counteries.
There is a lot of literature on determinants of revealed comparative Advantage. Some studies
suggest one list of determinants and the others suggest different list. It is observed that each
country has different determinants of RCA according to its Economic and geographical situation
but there is no agreed upon list of determinants which can explain RCA of each country. Due to
this controversy and literature the current study has found the determinants of RCA for China and
Pakistan in the context of CPEC.

Ramzan…
120
We have calculated RCA for Pakistan and China by using the commodity wise data of Pakistan
and China and total merchandise trade of these counteries and World as a whole. We have made
framework of export demand function. In which dependent variable is RCA and independent
variables include Inflation, FDI, World GDP, GDP, Trade openness and Exchange rate for each
sector. The data is collected for the years 1984 to 2015 for sectoral exports. The data is divided
into two samples. One sample is from the year 1984 to 2015. The sectors covered in the sample
period include Agriculture, Fuel and mining, Food, Manufecturing and Office and telecom. Second
sample is from the years 1990 to 2015. The sectors covered in the sample period include
Agriculture, Automotives, Chemicals, Clothing, Fuel and Mining, Food, Iron and Steel,
manufecturing, machinery, Office and Telecom and textile.
The findings of regression analysis for the sample period 1984 to 2015 for Office and Telecom
Equipments sector show that there is positive role of GDP and negative relationship WGDP, FDI,
INF, Exchange Rate and Trade openness in determination of Revealed Comparative Advantage
in this sector.
The results of regression analysis for the sample period 1984 to 2015 for Manufecturers sector
show that there is
positive role of Trade Openness, Exchange Rate, Inflation and WGDP and negative relationship
GDP and FDI in determination of Revealed Comparative Advantage in this sector.
The estimates of regression analysis for the sample period 1984 to 2015 for Food sector show that
there is positive role of GDP and Exchange Rate and negative relationship WGDP, FDI, INF and
Trade openness in determination of Revealed Comparative Advantage in this sector.
The outcomes of regression analysis for the sample period 1984 to 2015 for Fuel and mining sector
show that there is positive role of WGDP and Inflation and negative relationship GDP, FDI,
Exchange Rate and Trade openness in determination of Revealed Comparative Advantage in this
sector.
The inferences of regression analysis for the sample period 1984 to 2015 for Agriculture sector
show that there is positive role of WGDP, Trade Openness, Inflation and FDI and negative
relationship GDP and Exchane Rate in determination of Revealed Comparative Advantage in this
sector.
The results of regression analysis for the sample period 1990 to 2015 for Textile sector show that
there is positive role of World GDP, Exchange Rate and Inflation and negative relationship GDP,
FDI and Trade openness in determination of Revealed Comparative Advantage in this sector.
The estimates of regression analysis for the sample period 1990 to 2015 for Office and Telecom
Equipments sector show that there is positive role of Inflation, World GDP and Trade openess
and negative relationship GDP, FDI and Exchange Rates in determination of Revealed
Comparative Advantage in this sector.
The outcomes of regression analysis for the sample period 1990 to 2015 for Machinery and
Transport Equipment sector show that there is positive role of Inflation, World GDP and FDI and
negative relationship GDP, Trade openness and Exchange Rates in determination of Revealed
Comparative Advantage in this sector.
The inferences of regression analysis for the sample period 1990 to 2015 for Manufactures sector
show that there is positive Trade Openness and Exchange Rate and negative relationship FDI,
GDP,INF and WGDP in determination of Revealed Comparative Advantage in this sector.
Ramzan…
121
The results of regression analysis for the sample period 1990 to 2015 for Iron and Steel sector
show that there is positive Trade Openness, Exchange Rate, WGDP, FDI, GDP and negative
relationship INF in determination of Revealed Comparative Advantage in this sector.
The findings of regression analysis for the sample period 1990 to 2015 for Food sector show that
there is positive Inflation, Exchange Rate and GDP and negative relationship FDI, WGDP and
Trade Openness in determination of Revealed Comparative Advantage in this sector.
The outcomes of regression analysis for the sample period 1990 to 2015 for Fuels and mining
products sector show that there is positive FDI, WGDP and Inflation and negative relationship
Trade openness, Exchange Rate and GDP in determination of Revealed Comparative Advantage
in this sector.
The inferences of regression analysis for the sample period 1990 to 2015 for Clothing sector show
that there is positive WGDP and Inflation and negative relationship Trade openness, Exchange
Rate, FDI and GDP in determination of Revealed Comparative Advantage in this sector.
The findings of regression analysis for the sample period 1990 to 2015 for Chemicals sector show
that there is positive FDI, WGDP and Trade Openness and negative relationship GDP, Exchange
Rate and Inflation and GDP in determination of Revealed Comparative Advantage in this sector.
The results of regression analysis for the sample period 1990 to 2015 for Automotive products
sector show that there is positive Inflation and WGDP and negative relationship FDI, Exchange
Rate, Trade Openness and GDP in determination of Revealed Comparative Advantage in this
sector.
The estimates of regression analysis for the sample period 1990 to 2015 for Agricultural products
sector show that there is positive Inflation and WGDP, Exchange Rate, FDI and Trade Openness
and negative relationship GDP in determination of Revealed Comparative Advantage in this
sector.
According to the graphical analysis Pakistan has comparative advantage over China in the exports
of food, agriculture, clothing, fuel and mining and textile products.
Policy Implications:
The results of this study indicate that Pakistan can get a lot of advantages from CPEC and ONE
ROAD ONE BELT policy of China by specializing in food,agriculture,clothing, textile and fuel
and mining because Pakistan has comparative advantage in the exports of these products over
China. The results of regression analysis indicate that Pakistan may boost up its advantages from
CPEC by introducing investment friendly policies especially for foreign investors. Effective
management of exchange rate may also be helpful for Pakistan in improving balanace of payments
and earn foreign exchange earnings. The findings also suggest that policy of trade liberalization or
trade openness may be helpful in improving trade balance if Pakistan can effectively manage
specialization in the sectors in which the country has revealed comparative advantage.
References
Balassa, B. (1965). Trade liberalisation and “revealed” comparative advantage. The Manchester
School, 33(2), 99-123.
Balassa, B. (. (1965), ). , Trade Liberalisation and Revealed Comparative Advantage, . The
Manchester School, 33, 99-123.
Ramzan…
122
Chani, M., & Chaudhary, A. R. (2012). The role of expenditure components in determination of
import demand: Empirical evidence from Pakistan. Pakistan Journal of Commerce Social
Science, 6(1), 35-52.
Hinloopen, J., & Van Marrewijk, C. (2001). On the empirical distribution of the Balassa index.
Weltwirtschaftliches Archiv, 137(1), 1-35.
Hinloopen, J., & van Marrewijk, C. (2008). Empirical relevance of the Hillman condition for
revealed comparative advantage: 10 stylized facts. Applied Economics, 40(18), 2313-2328.
Levich, P., Economics of IB.
Nathan Nunn, D. T. (2014). Domestic Institutions as a Source of Comparative Advantage
In E. H. a. K. R. Gita Gopinath (Ed.), Handbook of International Economics. London, UK: Elsevier
B.V.
Utkulu, U., & Seymen, D. (2004). Revealed Comparative Advantage and Competitiveness:
Evidence for Turkey vis-à-vis the EU/15. Paper presented at the European trade study group
6th annual conference, ETSG.
Yu, R., Cai, J., & Leung, P. (2009). The normalized revealed comparative advantage index. The
Annals of Regional Science, 43(1), 267-282.