Embed Size (px)
Citation preview
1
Determinants of sovereign borrowing choices in
Sub-Saharan Africa
A dissertation
presented to
The Development Finance Centre (DEFIC)
Graduate School of Business
University of Cape Town
In partial fulfilment
of the requirements for the Degree of
Master of Commerce in Development Finance
by
Mecha, Lehasa
LHSMEC001–UCT GSB
March, 2021
Supervisor: Dr Mundia Kabinga
Univers
ity of
Cap
e Tow
n
The copyright of this thesis vests in the author. No quotation from it or information derived from it is to be published without full acknowledgement of the source. The thesis is to be used for private study or non-commercial research purposes only.
Published by the University of Cape Town (UCT) in terms of the non-exclusive license granted to UCT by the author.
Univers
ity of
Cap
e Tow
n
2
Abstract
There is a growing and legitimate concern about sovereign debt increasing to unsustainable
levels among the Sub-Saharan African (SSA) countries. Understanding the determinants of
external debt to these countries influenced the direction of this study. The existing literature that
was examined shed light mostly on the qualitative determinants of sovereign borrowing. In
addition to existing empirical literature, there is a complimentary need to examine further the
quantitative determinants of external debt. The researcher seeks to establish the extent to which
the cost of borrowing (proxied by interest rate) explains the changes in the borrowing behaviour
(proxied by external debt) among SSA countries. To achieve this objective, data from 36 SSA
countries for the period 2009–2017 was used. The data were collected from International Debt
Statistics compiled by the World Bank. External debt has been regressed against interest rate and
other predictor variables. Hausman tests, robustness tests and collinearity tests were carried out
to ascertain the validity of results. Interest rate is found to have a positive determining impact on
external debt for all SSA countries aggregated: SSA countries excluding South Africa (SA); SSA
excluding Nigeria; SSA excluding Nigeria and SA; SSA excluding debt-distressed countries,
middle income and oil-exporting countries. It does not have predictive power over changes in
external debt for SSA excluding countries at high risk of distress; countries with low to moderate
risk of distress; heavily indebted poor countries (HIPC) initiative post-implementation recipient
countries; low income, other resource intensive and non-resource-intensive countries. External
debt is also found to respond to changes in: gross national income (GNI); exports-to-imports
ratio; primary income on foreign direct investment (FDI); reserves-to-imports ratio; FDI-to-GNI
ratio; debt service-to-GNI ratio; interest arrears on long-term debt; short-term-to-total-debt ratio;
and reserves-to-debt ratio for different country groupings. Different country groupings are found
to have unique combinations of external debt determinants.
Key words: sovereign debt, debt management, debt restructuring, sustainability, borrowing
behaviour.
3
Table of contents
Abstract ........................................................................................................................................... 2
Table of contents ............................................................................................................................. 3
List of tables and figures ................................................................................................................. 5
List of abbreviations and accronyms .............................................................................................. 6
1. Introduction ................................................................................................................................. 7
1.1 Study area ...................................................................................................................................... 7
1.2 Background of the study ............................................................................................................. 10
1.3 Problem definition ...................................................................................................................... 12
1.4 Research question and scope....................................................................................................... 13
1.5 Research assumptions and limitations ........................................................................................ 14
1.6 Rationale and justification of the study ....................................................................................... 15
1.7 Statement of research objectives ................................................................................................. 18
2. Literature review .................................................................................................................... 19
2.1 Introduction ................................................................................................................................. 19
2.2 Alternative financing anatomy .................................................................................................... 19
2.3 Need for external financing and international financial markets ................................................ 23
2.4 Development finance institutions, lending criteria, borrowing architecture ............................... 31
2.5 Sovereign borrowing and debt management ............................................................................... 35
2.6 Debt situation in Sub-Saharan African countries ........................................................................ 40
2.7 Empirical comparative analysis: SSA and peer regions ............................................................. 43
2.8 SSA’s unsustainable borrowing, financial distress and debt restructuring ................................. 51
2.9 SSA and sovereign debt crisis ..................................................................................................... 54
2.10 Qualitative sovereign borrowing determinants and cost of debt ................................................. 59
2.11 Capital flows: summary .............................................................................................................. 61
2.12 Macro-economic determinants .................................................................................................... 64
2.13 Conclusion .................................................................................................................................. 71
3. Methodology .......................................................................................................................... 74
3.1 Research approach and strategy .................................................................................................. 74
3.2 Model specification ..................................................................................................................... 74
3.3 Variable specification ................................................................................................................. 75
3.4 Sampling and data collection ...................................................................................................... 78
3.5 Data analysis ............................................................................................................................... 79
4
3.6 Research criteria and limitations ................................................................................................. 80
4. Results and findings............................................................................................................... 81
4.1 Contextual background of SSA and debt management ............................................................... 81
4.2 Data summary and description .................................................................................................... 82
4.3 Results ......................................................................................................................................... 89
5 Conclusions and recommendations ..................................................................................... 113
References ................................................................................................................................... 116
Appendices .................................................................................................................................. 131
Appendix 1 – List of SSA countries sampled ....................................................................................... 131
Appendix 2 – Descriptive statistics: SSA countries (2009 – 2017) ...................................................... 132
Descriptive statistics ......................................................................................................................... 132
Appendix 3 – Trends: SSA countries (2009 – 2017) ............................................................................ 132
Appendix 4 – Regional debt ratios for 2010 – 2018 period .................................................................. 146
Appendix 5 – Regional tend analysis graphs (2010 – 2018 debt ratios): SSA & peers ........................ 147
Appendix 6 – Regional correlations (2010 – 2018 debt ratios): SSA & peers ..................................... 148
Appendix 7 – Regional regressions (2010 – 2018 debt ratios): SSA & peers ...................................... 149
Footnotes ..................................................................................................................................... 150
5
List of tables and figures
Figure 2.1: SSA debt ratios (2010 – 2018) ................................................................................... 44
Figure 2.2: LA&C ratios (2010 – 2018) ....................................................................................... 44
Figure 2.4: EA&P debt ratios (2010 – 2018) ................................................................................ 45
Figure 2.5: Debt and its determinants in SSA countries ............................................................... 70
Table 2.1: The rating scale ............................................................................................................ 28
Table 2.2: S&P's SSA sovereign rating ........................................................................................ 29
Table 2.3: SSA sovereign bond from 2004 ................................................................................... 30
Table 2.4: Some documented reasons for sovereign debt............................................................. 38
Table 2.5: SSA countries in debt distress or at high risk of debt distress ..................................... 41
Table 2.6: SSA countries’ distributions:– debt and economic characteristics ............................. 41
Table 2.7: Possible signals of debt distress ................................................................................... 55
Table 2.8: SSA sovereign defaults for 1990 – 2013 ..................................................................... 58
Table 2.9: Summary: determinants of sovereign borrowing ........................................................ 61
Table 2.10: Overview of external debt determinants .................................................................... 64
Table 2.11: Variable description and data sources ....................................................................... 70
Table 3.1: Variables definition and data sources .......................................................................... 75
Table 4.1: Key to variables used ................................................................................................... 82
Table 4.2: SSA countries’ external debt data ................................................................................ 83
Table 4.3: Hausman test for model specification.......................................................................... 90
Table 4.4: Hausman test results .................................................................................................... 90
Table 4.5: Unit Root Testing - SSA Panel .................................................................................... 91
Table 4.6: Regressions results – dynamic ..................................................................................... 92
Table 4.7: Robustness checks on independent variables .............................................................. 93
Table 4.8: Correlation coefficients (SSA countries) ..................................................................... 94
Table 4.9: Adjusted variables correlation ..................................................................................... 96
Table 4.10: Model summary ......................................................................................................... 97
Table 4.11: Model coefficients: SSA countries ............................................................................ 98
Table 4.12: Findings summary – SSA countries ........................................................................ 100
Table 4.13: SSA countries debt-based clusters ........................................................................... 101
Table 4.14: Economic classes – coefficients .............................................................................. 104
6
List of abbreviations and accronyms
ADB Asian Development Bank
AfDB African Development Bank
AIIB Asian Infrastructure Investment Bank
BNDES Banco Nacional de Desenvolvimento Economico é Social – Brazil
BRICS Brazil, Russia, India, China, South Africa
CAR Central African Republic
CDB China Development Bank
CIA Central Intelligence Agency
CRA Credit Rating Agency
DFI Development Finance Institution
FDI Foreign Direct Investment
FNO First National Operator
GDP Gross Domestic Product
GNI Gross National Income
GNP Gross National Product
HIPC Heavily Indebted Poor Country
IADB Inter-American Development Bank
IBRD International Bank for Reconstruction and Development
IDB Islamic Development Bank
IDS International Debt Statistics
IEC Interbank for Economic Coöperation
IMF International Monetary Fund
KfW Kreditanstalt für Wiederaufbau (Credit Institute for Reconstruction) – German
MDB Multilateral Development Bank
MDR Multilateral Debt Relief
MDRI Multilateral Debt Relief Initiative
ODA Official Development Assistance
OECD Organisation for Economic Cooperation and Development
SOE State-owned Enterprise
SSA Sub-Saharan Africa
UNCTAD United Nations Conference on Trade and Development
US United States
WB The World Bank
WW II Second World War
7
1. Introduction
1.1 Study area
The Sub-Saharan Africa (SSA) region largely consists of emerging societies. The least
developed region, it is experiencing development financing deficiency (especially infrastructure,
health and education finance) (Alagidede, 2012; Rao, 2003). The gap can be filled by
borrowing—domestically and from beyond national borders. Apart from the private sector’s
crowding it out, the former’s adequacy is constrained by less-developed domestic capital markets
(Kodongo, 2011). However, SSA countries’ domestic debt markets are largely under-developed
for sustainable development finance raising, making external debt an inevitable option. The
study seeks to examine the existence of a relationship between external debt and the cost of
borrowing, and to test for other determinants of debt across SSA, for the period 2009–2017.
In SSA, external debt is vital, primarily for its long-term development project financing
character, which addresses requirements and lending mismatches characteristic of commercial
bank-dominated domestic markets (Senadza & Fiagbe, 2017; Kapoor, Kararach, Odour, Odero,
Sennoga & Coulibaly, 2019). Conversely, external financing exposes sovereigns to exchange-
rate volatility, among its shortcomings. However, increased access to capital markets propelled
the popularity of external borrowing among the SSA countries, though with less investment
efficiency relative to peers, namely emerging and developing Asia, Latin America and Caribbean
(Barhoumi, Ha Vu & Towfighian, 2018). Overall, sovereign debt, being historically the first-ever
asset traded, continues to enjoy the lion’s share of global financial assets (Oosterlinck, 2013).
The situation is not unique to SSA countries—they do not have the luxury of being able to raise
enough funding elsewhere within their borders, and their access to capital markets continues to
be limited by low creditworthiness.
Existing literature on economic determinants of external debt in SSA, particularly the nexus
between external debt and cost of debt (debt burden), has gaps for research contributions.
Currently, some literature with different geographical contexts, is emerging (Waheed, 2017), but
the pointed effect of the cost of borrowing via external debt, among many other determinants, is
still missing. There is also limited and less pointed research investigating the external debt and
interest rates nexus in the sovereign borrowing context. In the absence of this understanding,
8
policy makers may be tempted to maintain the debt management practices status quo and fail to
save the worrying debt situation in the SSA region (Mustapha & Prizzon, 2018).
This study sought to close this research gap by investigating the relationship between external
debt and interest rates for SSA countries, using panel data of 36 countries for the period 2009–
2017. This research also set out to examine the effect of other potential economic determinants,
in addition to the cost of debt. Attention has also been given to the peculiarities of different
countries’ debt and economic characteristics, leading to the grouping of these countries. That
served to account for particulars and nuances in SSA public finance, and the debt-management
context in particular. Policy makers are expected to draw useful insights from the understanding
of relevant debt and economic situations.
For this study, the cost of borrowing is represented by interest rates, and borrowing behaviour by
the amounts of debt issued. Theoretically, demand for money decreases with increasing interest
rate (Mishkin, 2016). Understanding the borrowing behaviour—cost of borrowing nexus among
the SSA countries (aggregated and different clusters)—forms the objective of this study.
Sovereign borrowing character has an important bearing on debt management and sustainability
(Akanbi, 2016). Establishing it for SSA countries in their respective clusters is important for
policy formulation and execution.
SSA region sovereign borrowing has had mixed successes since the 1970s, when debt crisis was
rife (Oosterlinck, 2013). In later years, the situation was harnessed through debt relief
programmes driven by the International Monetary Fund (IMF) and World Bank (WB). A debt-
relief programme (which started in 1996 and expanded in 1999 and 2005), improved the
countries’ eligibility to borrow externally. Economic growth was realised in the region, until at
least 2012, when levels of debt started showing signs of increasing unsustainability (Mustapha &
Prizzon, 2018). Challenges related to investment efficiencies further fuelled worries about debt-
management abilities matching the increasing indebtedness. SSA was also reportedly lagging in
investment behind its peers (Barhoumi, Ha Vu & Towfighian, 2018).
Sovereign governments take on additional debt for various reasons, including developmental
projects, often cited as important (Blankenburg & Kozul-Wright, 2016). Incurring debt, however,
happens against the backdrop of a country’s elevated balance sheet vulnerabilities (Eichengreen,
9
El-Ganainy, Esteves & Mitchener, 2019). These vulnerabilities emanate from uncontrollable,
beyond-border, economic factors—for example interest rate and exchange rate volatilities.
Another reason lies in the limited time taken to raise huge amounts for intended obligations,
rendering amortised repayment borrowing the sound alternative. The amortised repayment
instalments incentivise raising long-term debt, through the affordability of the amounts to be
paid.
With national budgets constrained to service delivery and either maintaining or increasing
domestic consumption, contracting loans for development financing becomes the viable option
(Spilioti, 2015). Loans passing a cost-benefit analysis test, and yielding net positive gains,
usually get the green light. This is often due to their feasibility, reflective of prudence-driven
borrowing (United Nations Conference on Trade and Development [UNCTAD], 2012a). Specific
benefits of sovereign debt have attracted the attention and discussion of scholars over time. For
example, contracting loans helps in increasing or maintaining economic activity, and the overall
socio-economic wellbeing.
Political reasons underpinning debt raising by policymakers are discussed in Adonia Chiminya
(2012); Bittencourt (2019); Bowdler and Esteves (2013); Fatás, Ghosh, Panizza and Presbitero
(2019). Raising external debt to unsustainable levels attracts the sentiment that political over
economic reasons could be the determining factors in Sub-Saharan Africa (SSA). Inclination
towards concessional loans is indicative of debt cost awareness on the part of the borrower. The
sentiment that these loans are used partially as political currencies is, therefore, not far-fetched.
Indeed, a number of political parties and leaders in the region remain in power for quite extended
periods—regime changes in these democratic dispensations are very unlikely—with the
exception of few countries.
The International Monetary Fund (IMF) assesses debt sustainability, often together with the
World Bank, on both domestic and external public sector (Hakura, 2020). In the same manner, it
further offers technical assistance and tools for the same. In countries where it extends loans, it
enforces austerity measures with the aim of ensuring sustainability. It remains the countries’ best
interest that debt statistics are shared with lenders to encourage responsible lending (Hakura,
2020:61). Avoidance of IMF-induced sustainability scrutiny and approaching capital markets
10
despite high interest, due to low creditworthiness, are both indicative of caring less about debt
sustainability.
In this study, attention is paid to borrowing behaviour—particularly whether the cost of debt, and
other macroeconomic fundamentals, influence amounts of external debt incurred among SSA
countries, in aggregate and cluster forms. Apart from the cost of borrowing, other determinants
are examined for different country groupings. Sections following this introduction are: the
background of the study; problem definition; statements of research objectives and hypotheses;
literature review; methodology; and justification of the study—in that order. The document’s
final content comprises data analysis; discussion; findings; and conclusion.
1.2 Background of the study
When confronting budget deficit challenges, which potentially limit expenditure, and desired
positive externalities, governments often tend to seek alternative funding sources. This situation
inevitably culminates in resorting to borrowing—in addition to other borrowing to fund other
projects. However, contracting debt comes at the cost of borrowing (interest) determining the
eventual debt burden. This calls for sound debt-management practices, particularly on the
borrower side, reflected in the negative relationship between debt and interest rate. Apart from
cost of borrowing, prudently incurring debt calls for careful consideration of other service
capacity determinants, such as reserves, exports, economic growth and national income.
Raising money outside the government’s conventional revenue streams, in the form of debt to
carry out developmental projects, is inevitable (Hunt, 2014). This is premised on the direct
economic impetus that such financing brings, rendering debt for positive investments financially
sensible. Developmental projects take a long time to pay off the debt (Annamalai, 2013), so
patient loans are strategic for long-term projects with net positive impact—economic and social
(Annamalai, 2013). The level of prudence at which external liabilities are contracted remains a
debt-management imperative (Holler, 2012).
However, it is equally important to take note of salient impediments to sovereign debts. Debt is
the future generations’ liability and limits future fiscal expenditure, since revenue is allocated to
debt service. Further, raising debt in hard currencies exposes the state to exchange-rate risk
(Mpapalika & Malikane, 2019). Severe exchange-rate volatility may lead to financial distress
11
and, in the worst cases, to default. Debt restructuring is costly to both the borrower and the
lender (Cruces & Trebesch, 2013), rendering high financial prudence non-negotiable.
It is against this background—the worst case of which sometimes leads to financial and
economic crisis—that the United Nations Conference on Trade and Development (UNCTAD)
pervasively advocates the adoption of Principles on Promoting Responsible Sovereign Lending
and Borrowing. In 2009, the United Nations Conference on Trade and Development (UNCTAD)
launched a project to promote responsible sovereign lending and borrowing. The set of principles
is documented in the publication entitled Principles on Promoting Responsible Sovereign
Lending and Borrowing (Gulati, 2010; UNCTAD, 2012). The publication deliberates on the
responsibilities of lenders and borrowers. Issues of agency and immoral behaviour from both
sides are highlighted. For sovereigns, public officials are agents, and their counterparts are lender
employees.
In both state-owned entities and state governments, bureaucrats’ fiduciary duty of loyalty is to
serve the public as primary shareholders. The electorate entrusts its strategy to the elected public
officials for execution. The extent to which this happens, as envisaged, has a potential to attract
scrutiny. Sizable agency literature and scholarship suggest that agents do not always act in the
best interest of the principals (Alagidede, 2012; Fabozzi, 2010; Rao, 2003). The analogy is
carefully drawn for both public officers and taxpayers.
Research and a growing body of literature revealed substantial evidence of existing agency
problems associated with public officers pursuing their own interests at the expense of taxpayers,
(Mankiw, 2012). Manifestation of this has been realised in a myriad conduct issues—particularly
related to state machinery funding. Often, bureaucrats desire to keep the government bloated, and
hence maintain their budget at the same or increased level (McConnell & Brue, 2008; Campbell,
McConnell, Stanley & Brue, 2012). Whether relevant financing decisions may fall within the
ambit of good debt-management practices, this invites research.
SSA countries’ increasingly unsustainable debt levels in Sub-Saharan Africa grabbed the
attention of this study, particularly because some of them received debt-burden reprieves from
relief programmes, Highly Indebted Poor Countries (HIPC) and Multilateral Debt Relief
Initiative (MDRI), in 1995 and 2005 respectively. While HIPC was championed and
12
implemented by the IMF and WB, the duo was joined by multilateral agencies in MDRI. Indeed,
beneficiary countries’ balance sheets became worthy of extended credit, albeit at prudent levels,
to manage the risk of unsustainability and distress. Because not all countries benefitted from the
programmes separate analyses of recipient countries are conducted after the completion of the
HIPC initiative. While countries in the region continued taking on external debt, concerns
emerged after 2012 when the debt levels were becoming seemingly unsustainable (Eichengreen,
El-Ganainy, Esteves & Mitchener, 2019) . Evidence of this is the growing number of countries in
debt crisis and in high risk of debt distress (Akanbi, 2016; Eichengreen et al., (2012)
Against the background that shed light on these situations, interest developed in investigating the
extent to which raising external credit reflects sound debt-management practices, mainly by
showing how the changing cost of debt influences borrowing behaviour. And, this is important
when following the principles of responsible borrowing and lending, advocated by UNCTAD
(Gulati, 2010a). In the light of debt management practices, the study’s focus is on the extent to
which cost of debt can explain borrowing behaviour. The borrowing behaviour is observed on
the debt levels from one period to another.
Sovereign choice of lenders may be limited by a number of factors related to creditors’ different
mandates, in addition to many other reasons pertinent to risks inherent in the project or the
debtor country. Creditworthiness is critical for access to capital markets, and consequently bears
the interest-cost-limiting factor. Sovereign relationships play a central role in bilateral loans.
Global development agendas and good governance are both instrumental in multilateral lending
and grants (UNEP Finance Initiative & United Nations Global Compact, 2017).
1.3 Problem definition
Investigating the explanatory power of interest rate on external debt, and not the other way
around, for Sub-Saharan Africa created a research gap. This study seeks to fill the identified gap,
focusing on the external debt–cost of borrowing nexus, in the presence of other control variables.
The region has a history of indebtedness prior to the relief initiatives, which improved the
economic status of affected countries. However, there are looming debt sustainability concerns
arising from the heavy indebtedness of some countries in the region from 2012. This has the
potential to reverse gains from relief efforts (Mustapha & Prizzon, 2018). Apart from other select
13
control variables, the study seeks to establish the relationship between sovereign borrowing (also
external debt) and cost of borrowing in SSA for 2009–2017.
1.4 Research question and scope
Is there a relationship between external sovereign debt and the cost of borrowing to Sub-Saharan
African (SSA) countries? Can the control variables also explain the behaviour of external debt?
What differences if any exists between various country groups? The main research question
attempts to establish the relationship between external debt and the cost of borrowing. The nature
of this relationship is particularly important as it sheds light on the direction of the relationship if
there is any.
The second sub-question aims to establish whether, apart from the variable of interest (cost of
borrowing), other variables can explain the dependent variable (debt). This is established from
regressing external debt against other economic variables with predictive potential. The third
question attempts to unearth any similarities and dissimilarities between different country
groupings. Countries are grouped according to their debt situation and economic characteristics.
Identified categories comprise: all SSA countries; SSA countries excluding South Africa (SA);
SSA excluding Nigeria; SSA excluding Nigeria and SA; SSA excluding debt-distressed
countries; SSA excluding countries at high risk of distress; countries with low to moderate risk
of distress; Heavily Indebted Poor Country (HIPC) Initiative post-completion point recipient
countries; low-income countries; middle-income countries; oil-exporting countries; other
resource-intensive countries and non-resource-intensive countries.
SSA countries’ debt situations caught the attention of this study particularly, given the increasing
unsustainability concerns. This has been due to the indebtedness of a plethora of countries after
the debt relief initiatives (Mustapha & Prizzon, 2018). Coupled with investment inefficiency,
relative to peers, the situation calls for competent levels of sovereign debt-management and
complementing prudence. It is worthwhile to investigate the extent to which the cost of
sovereign debt influences borrowing behaviour. The findings were expected to reveal whether
cost of debt can influence external borrowing. The findings were expected to inform a deduction
of the effect of the cost of borrowing on the debt appetite of SSA countries.
14
Understanding the external debt-cost of borrowing serves to inform sovereign borrowing
framework policy formulation and guidance. The trade-off between the cost of borrowing and
debt appetite can well be regulated in the light of known behaviour across the region. In
particular, policymakers’ conflicts of interest and other agency issues may comprehensively be
covered in the laws and regulations. Debt-management policy frameworks should also benefit
from information regarding the association between external debt and select macroeconomic
variables. Inevitably, debt management can also draw lessons about possible antecedents of
unsustainable debt burdens and apply them in the development of external borrowing policies.
1.5 Research assumptions and limitations
The sub-section starts with set of assumptions. The cost of borrowing is proxied by the World
Bank’s documented interest rate in the data, labelled “interest rate to all creditors”. Another
assumption is that data quality is the same across all countries in the sample, in spite of their self-
reported nature and the institutional deficiencies in some countries. Furthermore, countries had
equal access to external debt and costs of transactions. And, any undocumented differences are
not substantial enough to affect the results of analysis.
Both quantitative and qualitative variables could have influenced the borrowing behaviour, but
the interest is on the former, with focus on the cost of borrowing. Similarly, while a quantitative
approach is adopted for this study, a qualitative approach can also be used. All countries had an
equal chance of being picked, though data limitation constrained inclusion. Ordinary least
squares (OLS) is used without discrediting or limiting the adoption of other quantitative
techniques. The age of a country’s independence does not substantially limit external credit
access; and outcomes of analysis may not exhaust all possibilities but give an indication of the
situation.
Study scope has been limited to quantitative method, due to relative advantage in the panel data.
Other qualitative methods—observation, interviews, surveys—using panel data approach could
face futility challenges. Some countries had substantial data missing, and had to be dropped out
of the data set, inevitably limiting the population of analysis. Not all countries benefitted from
HIPC and MDRI programmes, reducing clustering to disaggregate analyses of recipients against
15
non-recipients. Furthermore, some of the beneficiaries have not yet reached completion point and
had to be left out of the data set.
The scope of the research might have been extended to examining the impact of colonial masters
on official credit access and amounts, had extension of scope and resources been possible.
Official loans may have been influenced by other factors, such as international politics, mineral
resources and oil, regional relations and domestic politics, among others. However, investigating
these was beyond the scope of this study. The study was also deliberately limited to panel-
instead of time-series, and cross-sectional for individual countries. That is because the latter was
limited by time and document level scope, in addition to panel data relative advantages.
Insufficient data points further limited the ability to conduct meaningful country level analysis
and hence the need for aggregation.
1.6 Rationale and justification of the study
The study contributes to the body of knowledge in the development finance field and public
finance in particular, by enhancing the understanding of the external-debt to cost-of- borrowing
nexus in the Sub-Saharan African (SSA) region. It is extended by grouping countries in various
clusters to observe significant differences in the relationship. The approach has not been used
before, and control variables are introduced to observe their influence on the model. To the best
of my knowledge, among the known publications this is the only study investigating the
relationship of sovereign external debt to cost of borrowing in the SSA context. Panel data
regression has been used to establish the relationship, capturing both time-series and cross-
sectional aspects of data.
The cost of borrowing is instrumental in determining debt service payments—ultimately
affecting cash flow. It is, therefore, imperative that policy makers comprehend the kind of
association between external debt and cost of borrowing. The issue of competence has, over
time, called for the attention of international credit providers. Increased debt burden hinders
provision of services to poor masses, leaving a legacy of unacceptable levels of socio-economic
development. For policy makers, the situation leading to high, unsustainable debt burdens should
never be left to chance.
16
In the absence of a clear policy guiding the optimal exploitation of development funding options,
officials may be tempted to act in ways not in the best interest of the public. If the existing policy
lacks completeness and contains loopholes, then there may be rampant cases of officials pursuing
their own ends at the expense of taxpayers. In this case, securing a loan may not necessarily
reflect the broader national interest, with respect to cost effectiveness. This is one key
manifestation of the agency problem. It is not explicit if individual sovereign finance policy
guidelines subscribe to lower cost of borrowing as a key determinant to contracting debt. It is
one of the aims of this study to establish whether that can be extrapolated from borrower actions.
Some SSA countries experienced debt crises in the 1970s. In the 1990s, the debt distress in the
region triggered the Heavily Indebted Poor Country (HIPC) Initiative and the Multilateral Debt
Relief Initiative (MDRI) in 1995 and 2005 respectively. The repeat of the debt relief initiatives
may be unlikely or extremely complicated, given the increased creditor mix and access to
international capital markets. Repeat of debt distress and crises will leave a bitter legacy of
liability mismanagement, with the price to be paid by future generations. Litigation and
diminished access to capital markets, due to defaults, represent the most unwanted situation for
SSA, which makes capable debt management invaluable, now more than at any other time.
Research contribution to the relevant body of literature is not confined to knowledge of how the
cost of borrowing influences debt-incurring behaviour in the SSA. It will also catalytically
inform other research directions towards understanding the dynamics and dilemmas faced in the
borrower spaces. International lenders stand to exploit the relationship through more informed
credit policies. Borrower governments’ public-finance policy formulation will be better informed
in strengthening agency issue laws. The key premise will be factors influencing or informing
external borrowing and complications brought by increased creditor bases by non-Paris Club
members like China.
There is existing evidence of over-indebtedness and increasing distress leading to financial
instability in Sub-Saharan countries. Studies examining the economic determinants of borrowing
in the region need debt and cost-of-debt nexus input. No study has zoomed in on the explanatory
relationship between cost of borrowing and borrowing behaviour. Changes in the debt amount
17
are used as proxies for borrowing behaviour. When changes in the amount of debt raised are
statistically explained by changes in the interest rate, the relationship exists.
The determinants of risk premium (in SSA) are investigated in Mpapalika and Malikane (2019).
However, the impact of risk premium on (or relationship with) the amount borrowed is not
investigated, even though indebtedness of countries in the region is noted, together with other
risk impediments. Hence, the specific gap that this study seeks to fill is defined by an absence of
studies focusing on the economic determinants of sovereign borrowing. Specifically, the study
anticipates paving the way for investigating individual determinants’ relationship with sovereign
borrowing behaviour: the cost of borrowing is chosen in this study. Selected macroeconomic
fundamentals are included as control variables, to discern their nature predictive of borrowing
behaviour.
Findings should help in responding to the question: Does the cost of borrowing determine
sovereign borrowing behaviour? In other words, is there a connection between external debt and
cost of borrowing, and what is the nature of such a relationship, if any? Further, how are the
control variables associated to sovereign borrowing behaviour? Established relationships can
help understanding the borrowing appetite and debt-management situation among the SSA
countries. Perceptions of agency-driven adverse selection and moral hazard may be either be
rejected or not, based on the results.
Extensive use of a debt sustainability framework by the World Bank (WB) and International
Monetary Fund (IMF) should bolster the research-informed debt management initiative. In
particular, policymakers should benefit from the link between macroeconomic debt determinants
and debt burden indicators, namely the solvency and liquidity proxied by
debt-stock and debt-service ratios respectively (Cassimon, Verbeke & Essers, 2017).
Sustainability-driven debt management should give coherent consideration to the extent of
budget deficit, domestic resources mobilisation, the cost of debt and debt-servicing capacity, as
widely discussed in Cassimon et al. (2017) and Cyrus (2018). Debt-servicing capacity should be
underpinned by: affordable cost of borrowing; healthy reserve accumulation; export growth;
economic growth; and healthy, growing national income. Therefore, governments stand to
benefit if consideration is given to improving gross domestic product (GDP), exports and public
18
sector revenue (particularly increasing domestic resources mobilisation) as more debt is
accumulated.
1.7 Statement of research objectives
Key objectives of the proposed study are formulated as follows:
▪ Examining the relationship between external debt and borrowing costs proxied by interest
rate, by all creditors (IDS, 2019) for Sub-Saharan African countries over the period 2009–
2017. Choice of this period is informed by data availability and the fact that a global
financial crisis had just passed, in which the severity of impact was limited by the low
integration of the region in the global financial system (Bruno Bonizzi, 2017).
▪ Examining the relationship between external debt and other selected predictor variables,
namely gross national income (GNI); imports; exports; international reserves; foreign direct
investment (FDI); primary income on FDI; debt service to GNI ratio; interest arrears on long-
term debt; short-term to external debt stocks ratio; and reserves to external debt stocks ratio.
These variables were chosen as control variables for this study.
▪ Examining unique differences across country groupings: all SSA countries; SSA countries
excluding South Africa (SA); SSA excluding Nigeria; SSA excluding Nigeria and SA; SSA
excluding debt-distressed countries; SSA excluding countries at high risk of distress;
countries with low to moderate risk of distress; Heavily Indebted Poor Country (HIPC)
Initiative post-completion point recipient countries; low income countries; middle income
countries; oil-exporting countries; other resource-intensive countries and non-resource-
intensive countries.
19
2. Literature review
2.1 Introduction
Governments incur debt in the business of service delivery and development programming
activities. Budget deficits are sometimes the cause of debt-contracting, apart from development
projects. Countries borrow money for investments in specific projects too, often matching
expected proceeds with debt-repayment amounts. Short-term loans are often a function of budget
deficits, while project financing is matched with long-term debt. Loans can be secured from
different creditors in the domestic and foreign markets.
Sovereign borrowing is an old concept dating centuries back (Eichengreen et al., 2019). As
noted, the borrowing can be either domestic or external. The latter captured the interest of this
study. Raised through various vehicles, external debt remains unique, owing to its distinct
differences to corporate debt. While recourse exists for corporate debt, the same is not true for
sovereign debt. A defaulter’s impediment, manifested in impaired investor sentiment, leads to
difficulty in future loan raising (Megliani, 2015).
2.2 Alternative financing anatomy
In the pursuit of operating public management machinery, modern governments collect revenues
through taxation. These revenues are put to use through expenditure programmes. The
programmes include public service administration, health and education, infrastructure, and other
development projects. Comprehensive collection and expenditure programmes are carried out
through the national budget. In an ideal world, the expenditure and revenue should be equal, but
this is rarely the case.
In the event that revenue falls short of expenditure, borrowing becomes the alternative. In
domestic markets, loans can be raised through short- and long-term instruments, namely treasury
bills, treasury notes and bonds. For example, the United States government issues US savings
bonds—long-term, nonmarketable securities (Mankiw, 2012). Debt instruments can be sold to
individuals, commercial banks and institutional investors (Mbu, 2016). These instruments are
promises to lenders that their money will be paid back with interest.
20
Debt can be raised in either local or foreign currency. Foreign debt may be secured from
international capital markets, official creditors and the donor community. Official creditors
include bilateral and multilateral lenders. Both official and donor fund sources have concession
and grant elements, which are useful for eligible countries (Haile, 2018). Poor countries with
substantial hurdles to overcome, to take their citizens out of poverty, have historically been
eligible.
The majority of Sub-Saharan African countries are poor and only developing, with very few
emerging economies, some benefitting from official loans and donations (Ocran, 2012:39-43).
Access to debt markets gives these countries the wanted opportunity to finance poverty-reduction
and development programmes. However, it is noted that external debt sources have advantages
and disadvantages (Haile, 2018:169–170). The latter calls for investigation into how potential
debt burdens are taken care of, during loan-raising transactions. The external debt–cost of
borrowing nexus partly helps in the investigation of this phenomenon.
Generally, sovereign bonds have no conditions attached: monitoring by the lender and the
interest rate (coupon) is fixed throughout the loan period. They are also transparent, and act as
benchmarks for corporate bonds. However, bonds generally have refinancing and rollover risks.
These usually ensue at maturity when the full amount must be paid. The risk of falling market
sentiment exposes the borrower to an inability to raise enough funds, leading to default (Haile,
2018:169).
Local sovereign bonds guard against exchange-risk exposure and are instrumental for the
development of domestic financial markets. One key disadvantage of these bonds is their high
interest rate, relative to international markets. Government bonds in the domestic markets also
have a potential for crowding out private investment and reducing productivity (Haile, 2018;
Mankiw, 2012). A trade-off between domestic financial market development and crowding out
private investment remains tricky if a balance becomes difficult to strike. There needs to be an
optimal balance of domestic and international debt, to take advantage of low interest rates,
exchange-rate hedging and local financial market development.
External debt stocks increase investor bases and foster lender diversification. They further
enhance access to competitive markets and efficient pricing. They also foster greater
21
transparency, due to market discipline factors, e.g. covenants, due diligence and market scrutiny.
High transaction costs and long preparation periods are salient disadvantages of raising funds
from international capital markets. Eurobonds also expose the sovereign to exchange rate risk
and capital flight (Haile, 2018:170), as well as macroeconomic risk, due to large capital inflows,
volatility, credit booms and inflation (Willem, 2014).
Official loans, on the other hand, are not driven by market sentiment, presenting an indispensable
advantage for less credit-worthy poor countries. Countries may not need to pay for credit-
worthiness risk-rating as a precondition for favourable capital market access. These official loans
also facilitate crowding in of private investment (Haile, 2018; Karangizi, 2019; Mbu, 2016).
Conditionality and limited financing terms remain fundamental caveats to official loans. Some of
their conditions effectively wipe out positive externalities due to competition with local
enterprises, thus limiting the economy’s productive potential. (Haile, 2012)
Donations are known for low debt-service payments and greater transparency. Regardless of
controversies around its effectiveness, foreign aid plays a reprieve role to poor countries.
Through these donations, poor countries’ budgets could be extended to do more in delivering
basic services to their people (Ocran, 2012). Donations, however, have a limited contribution to
domestic financial sector development (Haile, 2018:170). Apart from the ineffectiveness of
foreign aid cited in the literature, dependency syndrome affecting recipient countries goes a long
way in retarding innovation and overall development.
Apart from the traditional sources of funding discussed above, developing countries have
increasing innovative alternative funding options to consider. They include project financing;
domestic resource mobilisation; privatisation or sale of state-owned assets; diaspora bonds;
dividends from sovereign and sinking funds; resource exploitation partnerships with private
corporates; remittances; virtual currency and broad-based project fees from different sources.
Public-private partnership (PPP) is a common form of project financing that stands to exploit
private sector expertise, owing to profit-driven business models (Cruz, 2018; Nahlik, 2012). The
partnership between state and private investors serves to execute projects with public benefit as
their end goal (Abu-Hijleh, 2017). PPP success stories are documented in substantial literature
(including the works of Abu-Hijleh, 2017; Liang & Jia, 2018; Oyedele, 2013; Zou et al., 2008).
22
SSA countries have the potential to exploit other revenue sources, such as taking advantage of
concession windows and grants. The advantages of soft loans are premised on their very low or
zero interest rates. Official loans are also popular for being less market-sentiment-response
driven: lenders consider other factors beyond risk and return (Haile, 2018). Other opportunities
emerge from donations in various forms, popularly known as official development assistance or
foreign aid.
Other funding options can be based on domestic resource mobilization (DRM) efforts, increasing
revenues from both tax and nontax sources as articulated in Group (2017); Matovu (2010);
Junquera-Varela, Verhoeven, Shukla, Haven & Awasthi 2017; Sy & Sow 2016). Advantages and
various ways of implementing DRM are discussed extensively by these scholars. Taxation can be
extended by tapping informal sectors and tax areas not taxed before, though they are eligible.
This calls for focussed investment in the capacity-building of the tax administration, policy
reforms and combating illicit financial flows (Junquera-Varela et al., 2017).
Investment in good governance can also attract official development assistance (ODA) and
positively influence mobilisation of domestic resources (Sy & Sow, 2016). Apart from taxation
and closely related levying revenue mobilisation, sovereigns can derive benefits from the use of
other more innovative financing options. Sovereigns can issue diaspora bonds, targeting their
citizens in the diaspora, clearly spelling out the message of domestic development (Alagidede,
2012). Another closely similar approach is taking advantage of remittances—levying them at a
certain rate and channelling the funds to development projects. Levying online gambling and
virtual currencies within domestic borders is another option for developing countries, and SSA in
particular.
Another opportunity for raising revenue that can be exercised lies in state-owned enterprises
(SOEs). Sale of SOEs or outright privatisation can improve a revenue base for investment in
other development projects. Research advises, however, that instead of selling SOEs to private
investors, policy makers should first remove mismanagement, corruption, political and external
influences to improve profitability (Quartey, 2019). In another study of SOEs in SSA,
telecommunications SOEs were found to be more profitable, and power SOEs below average
23
(Mbo, 2017). It becomes imperative, therefore, that SOEs get catalysed to become competitive,
instead of selling them.
Sovereign wealth funds (SWFs) and sinking funds (SFs) comprise another revenue expansion
avenue for development, primarily through yields and dividends. A second role of SWFs,
particularly in SSA, is to invest in the domestic infrastructure development and desist from the
usual tendency of politically influenced investing (Diallo, Tchana Tchana, & Zeufack, 2016).
The importance of SWF investment in infrastructure development is corroborated by the
proposal to form a global infrastructure investment platform (GIIP). Formed through
coordination of all institutional investors alike, the GIIP should be mandated to pool funds from
SWFs and invest them in infrastructure (Peters, 2017).
Tapping debt markets, offering interest-bearing credit, underpins the motivation behind this
study. Since repayment of debt and interest represents a burden to the borrower state, the extent
to which prudence applies during debt structuring calls for investigation. This prudence can
manifest in many forms, but the study’s interest is on the loan-raising response to the cost of
borrowing. The relationship between external debt and cost of borrowing helps in establishing
this response function. The model similarities or differences across different SSA country
clusters help in further driving the point home in understanding determinants of external
borrowing in the region.
2.3 Need for external financing and international financial markets
While there are open recourse alternatives to creditors for non-paying corporate borrowers, the
same cannot be exactly true for sovereign borrowers (Mustapha & Prizzon, 2018; Kapoor et al.,
2019). The inability of sovereigns to either tax their country’s wealth or raise tax revenues
exposes them to the risk of debt distress. A country’s access to capital markets affords it the
ability to expand domestic investments while not cutting its consumption (Mishkin, 2016).
Raising finance from external sources becomes inevitable to expand productivity in the absence
of domestic alternatives.
Financing capital projects and managing cash flow are reasons behind raising funds from credit
markets, as cited in Bunte (2013). Apart from capital needs, countries have been observed, for
example, borrowing against future revenue streams (Robbins & Simonsen, 2019). Fatás, Ghosh,
24
Panizza and Presbitero (2019) cite cyclical stabilisation as another motivation for raising debt.
Distinctive differences in the requirements for sovereign debt, between developed and
developing countries, lie in the use of funds. Developed countries use sovereign debt to finance
their budget deficit, and developing countries use it to develop (Gulati, 2010).
External development beyond official development assistance (ODA) is another important
financing alternative. This is premised on the increasing importance of alternative external
financing sources. There is increasing evidence of their importance outweighing traditional
financing (Prizzon, Greenhill, 2017). External financing is instrumental in complementing the
sovereign budgets or executing strategic national projects. Development-oriented funding is
imperative for economic development of individual countries.
In ancient times, sovereigns borrowed “to secure borders and fight military campaigns”
(Eichengreen et al., 2019). While this continued beyond the eighteenth century, the succeeding
century became more transitional, characteristically marked by sovereigns’ borrowing for
infrastructure development and education investment. Increases in debt burdens during the
twentieth century were due to major wars, recessions, banking panics and financial crises, and
“the public-policy responses to these events” (Eichengreen et al., 2019). While wars and
financial crises partly underpinned increasing debt-to-GDP ratios at the end of the last century,
other factors also emerged. Such factors comprised pensions, healthcare and “other, often-
underfunded, social services” (Eichengreen et al., 2019).
Lower interest rates in advanced economies, increased appetite for risk, and borrowers’ positive
growth prospects continue to “fuel high and steady demand from international investors”
(Mustapha & Prizzon, 2018). This came in the face of recipient countries’ “huge financing needs
and relative decline in concessional financing from traditional creditors” (Mustapha & Prizzon,
2018). However, there is an observation of debt-issuing even when terms and conditions are
comparatively less generous than those of loans from bilateral and multilateral loans (Prizzon,
Greenhill, & Mustapha, 2016). Another cited reason for issuing international bonds is the desire
to diversify funding. Besides re-financing previous obligations, governments are noticed issuing
bonds to send a clear signal that they can access international financial markets (Prizzon et al.,
2016).
25
Similar observation regarding International Monetary Fund (IMF) loans has been cited in Bunte
(2013). Literature citation appears of IMF loans raised, not for monetary reasons, but as a “seal
of approval” signal to potential investors. Bunte (2013) also notes a tendency by governments to
take advantage of IMF austerity measures to pass unpopular policies. Growing sentiment that
IMF becomes an external ally against domestic resistance is not unfounded. The sentiment is,
however, outdated in the modern literature of political economy. The existence of non-financial
reasons for borrowing forms the premise for assessing their importance over financial
counterparts such as interest rates.
The capital markets provide platforms for trading long-term debt and equity instruments. They
differ from money markets, which facilitate the trading of short-term instruments. Maturity for
money market instruments is one year or less, while long-term instruments mature in over one
year. It is not unusual to find another classification associating short-term with one year or
shorter, long-term with ten years or more, and intermediate term with between one and ten years.
Short-term instruments are characteristically more liquid because they trade more widely than
their long-term counterparts, making them popular for use by corporations and banks to earn
interest on their temporary surpluses (Mishkin, 2016:25).
Both money markets and capital markets form part of organised exchanges, together with many
other financial intermediation instrument traders. While corporations can issue both debt and
equity, sovereigns issue debt exclusively. With increasingly internationalised financial markets,
sovereigns can issue bonds in foreign capital markets to foster economic growth (Mishkin,
2016:29–30). Debt is issued as either foreign bonds or Eurobonds, with the former historically
common (Mishkin, 2016:29). Lenders usually demand repayments in hard currencies, for
example US dollars, thus popularising Eurobonds over bonds denominated in domestic
currencies that are regarded as less stable.
Issuing credit is an activity with relational characteristics. It has social and institutional
dimensions building on trust and shared information, “expectations and objectives between
debtors and creditors” (Blankenburg & Kozul-Wright, 2016). Therefore, information symmetry
between creditors and debtors is critical. Other economic factors become instrumental only as
transactional complements. Capital market access is a function of meeting certain minimum
26
benchmarks regarding transparency and repayment ability reflected in the economic
performance.
Issuing credit to an individual, company or sovereign entity is dependent on credit-worthiness.
The borrower is subjected to assessment of repayment ability, reflected in the credit profile. For
sovereigns, both the ability and willingness to pay are key determinants. The former is reflective
of economic health while the latter is gauged by character reflected in past defaults. The
assessment exercise is aimed at mitigating creditor exposures.
Sovereigns issue debt through capital markets, whose access determinants have been widely
explored and discussed in literature, such as in Gevorkyan and Kvangraven (2016) and Pham
(2015). Cost of borrowing and risk phenomena are discussed in Groot, Holm-Hadulla and
Leiner-Killinger (2015), Nyambuu and Semmler (2017), Olabisi and Stein (2015). Lending is
facilitated by the borrower’s litmus testing to determine suitability, gauged by repayment
certainty, risk and credit pricing. A bond-issuer credit-worthiness exercise is carried out by
credible independent credit rating agencies (CRAs). To properly profile debt issue or issuer,
CRAs base their assessment on a number of economic fundamentals.
CRAs, as information intermediaries, are critical market participants. To rate a sovereign issue,
they summarily assess the country’s economic and institutional strength. For example, Standard
and Poor use the institutional and economic, flexibility and performance profiles to issue
indicative ratingi. Institutional and economic profiles come from the assessment of a country’s
institutions and economic performance. Flexibility and performance profiles come from external,
fiscal and monetary assessments.
CRAs assess political stability and economic prospects (structure, growth). They also assess
fiscal flexibility, monetary stability and external flexibility. Fiscal flexibility is gauged by
revenue, expenditures; the balance of performance; debt and interest burdens; off-budget and
contingent liabilities. External flexibility is defined by liquidity; public sector net external debt;
bank and private sector net external debt. These determinants of credit-worthiness are important
for explaining the market sentiment.
27
More factors from literature are fiscal and public sector balance-sheet management (Abedian,
2016), and economic growth (Chee, Fah, & Nassir, 2015; Williams, Alsakka, & Gwilym, 2013).
The impact of information asymmetry and rating quality are discussed in Fischer, (2015). Impact
of corruption and political (in)stability are documented in Teixeira, Silva, Ferreira and Vieira
(2018). General rating biases are discussed in Cai, Gan and Kim (2018); Hill, Brooks and Faff
(2010); Luitel, Vanpée and Moor (2016); and CRAs and issuers’ opportunistic behaviours in
Park and Lee (2018). Low credit rating negatively affects access to international capital markets
and has a tendency to inflate both sovereign risk and cost of borrowing (Luitel et al., 2016).
This further reduces the ability to attract foreign direct investment (FDI) (Cai et al., 2018). The
situation potentially spirals the country into a downward path of “policy sovereignty loss” to
alternative funders (Abedian, 2016). The impact of external exposure is discussed in Cantor
(2015). Current account adjustment and economic policy (un)certainty are discussed in
Boumparis, Milas and Panagiotidis (2017). Credit ratings are useful in determining the cost of
debt to the issuer (Cantor, 2015).
In this study, the explanatory power of the cost of debt on the external debt is examined. The cost
of debt is proxied by interest rates charged by all creditors, as reported in the IDS compiled by
the World Bank. Data is also captured for other macroeconomic variables, to investigate their
power over external debt. These independent variables are: gross national income (GNI);
exports; imports; foreign direct investments (FDI); primary income on FDI; international
reserves; debt service to GNI ratio; interest arrears on long-term debt; short-term to external-debt
ratio and reserves to external-debt-stocks ratio. They, together with interest rates, are expected to
be associated with external debt, albeit at differing degrees of significance.
CRAs rate both sovereign and corporate issues, drawing from comprehensive risk assessment:
measuring the likelihood of an issuer’s defaulting on obligations. At the end of valuation, letter
grades (e.g. AA, Aa1) are released as proxies for default risk assessment. All the three CRAs use
alphabetical letter grades, although with a slight presentation difference to Moody’s. The latter
uses combinations of letters and numbers, while S&P and Fitch use similar presentation—letters
only. Issuers pay CRAs to have their bonds rated (Haile, 2018).
28
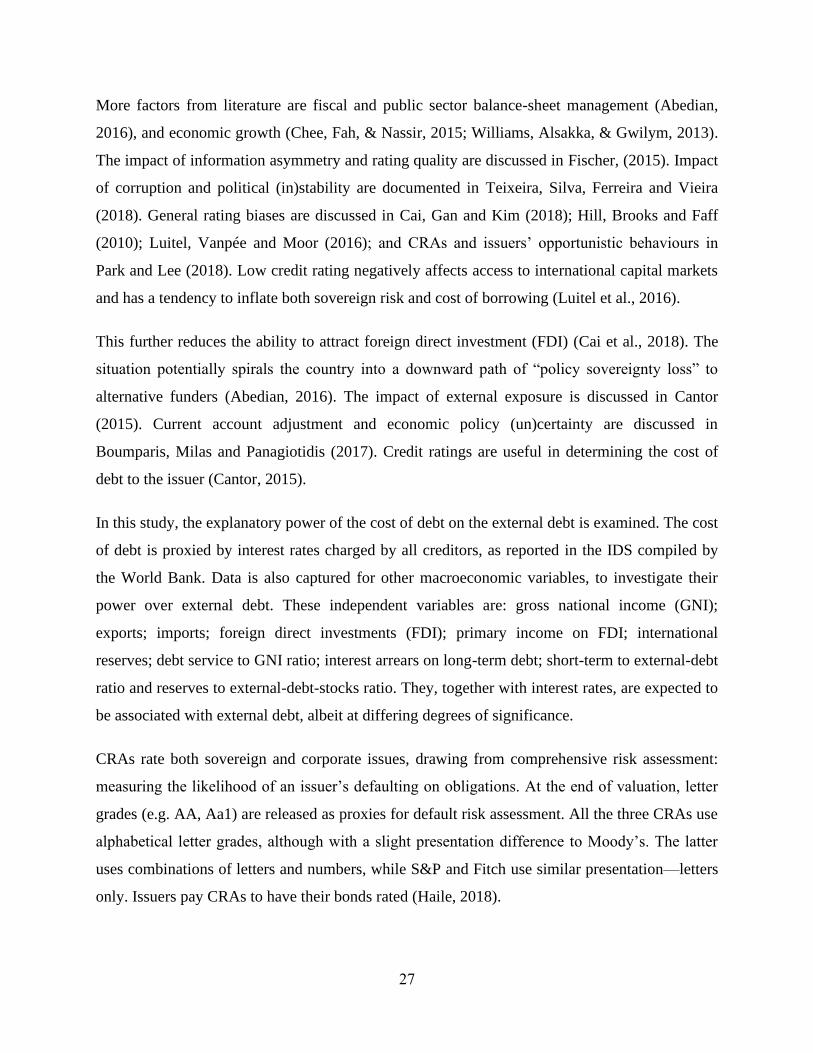
The letter grades change with varying degrees of issue risk from investment to sub-investment
bonds. They range from prime (the highest), representing obligation-honouring certainty, to
default (absolute inability to honour obligations). CRAs are the rating services for both long-term
and short-term issues. The ratings are offered for both local currency and foreign currency. In
addition to ratings, CRAs offer the outlook for government and corporations, which runs from
negative to stable to positive (Haile, 2018). The three agencies’ ratings are as given in table 2.1
as follows.
Table 2.1: The rating scale
Moody's S&P Fitch Credit Risk Rating Implication Grade
Aaa AAA AAA Prime Most likely debt obligations will be honoured Investment
Aa1 AA+ AA+ Excellent High likelihood debt obligations will be
honoured Aa2 AA AA
A1 A+ A+ Upper medium Reasonable likelihood of honouring debt
obligations A2 A A
A3 A- A-
Baa1 BBB+ BBB+ Lower medium Diminishing likelihood of honouring debt
obligations Baa2 BBB BBB
Baa3 BBB- BBB-
Ba1 BB+ BB+ Speculative Future but not current repayment likely
problematic
Sub-
investment Ba2 BB BB
Ba3 BB- BB-
B1 B+ B+ Very speculative Weak probability of repayment, cause for
concern B2 B B
B3 B- B-
Caa1 CCC+ CCC Extremely speculative Repayment uncertain, danger of default
possibility Caa2 CCC CCC
Caa3 CCC- CCC
Ca CC CC Default vulnerable High likelihood of default on debt obligations
C C C
SD/D RD/D In default Defaulting on debt obligations
Sources: Lecture notes, UCT GSB, MCom Development Finance, Public Sector Finance 2018; Tadesse Haile, p.3
In summary, Haile documented that the number of SSA countries rated by global credit rating
agencies increased from four in 2003 to 17 in 2017. As at 2017, out of 17 countries rated by
Standard and Poor’s, only two were categorised as of investment grade. With the exception of
Mozambique (graded CC), all other speculative-grades are in the single ‘B’ category (Haile,
2018). Ten sovereigns have stable, six negative and one positive outlook.
To entice the market, with this risk rating level, the yields must be high enough to compensate
for perceived risk. This has debt burden implications, especially the interest payments, further
29
constraining repayment ability. This is especially true if proceeds from the loan were not used for
income generating assets to contribute to the repayment. The advantage of lower interest rates,
often found in the international capital markets relative to domestic markets, can be eroded by
adverse currency valuations against the borrowed currency (Willem, 2014). Unwavering
willingness and untimely bond issuance, in the face of high yield market expectations, is a
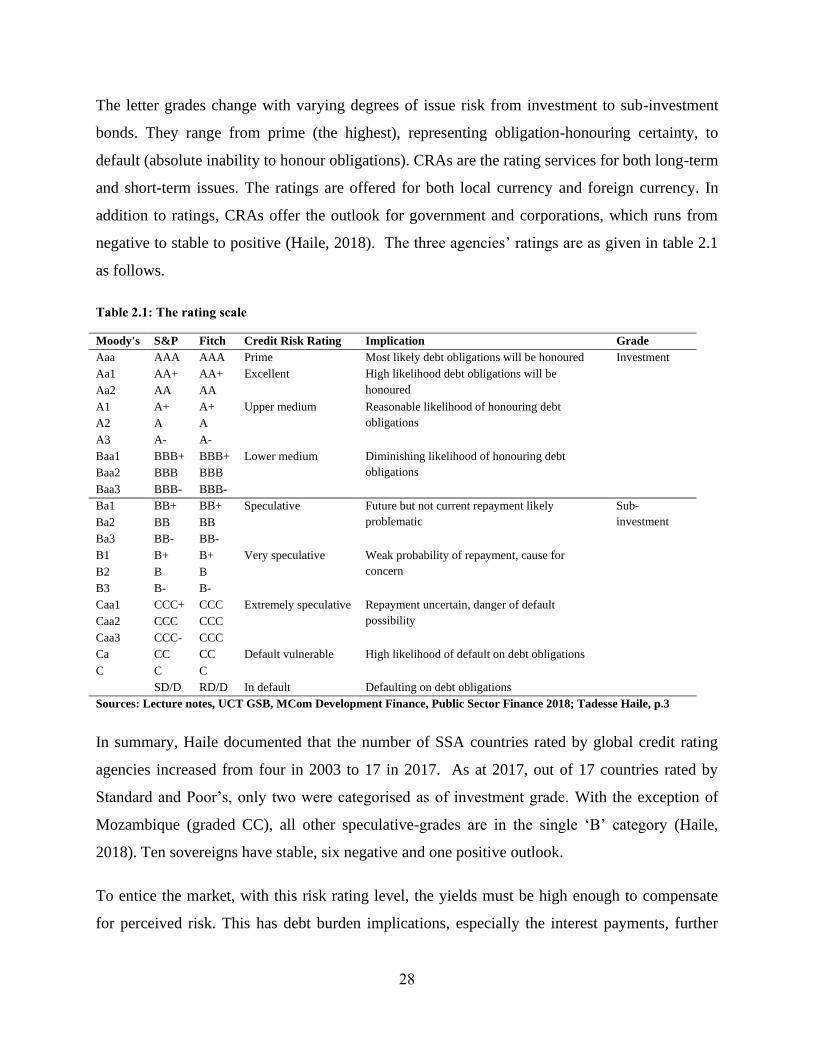
manifestation of adverse selection (Mishkin ( 2016).
Table 2.2: S&P's SSA sovereign rating
Country Long-term grade Outlook Short-term grade
Angola B Negative B
Botswana A- Negative A-2
Burkina Faso B- Positive B
Cameroon B Stable B
Cape Verde B Stable B
Congo-Brazzaville B- Stable B
Congo – DRC B- Negative B
Ethiopia B Stable B
Ghana B- Stable B
Kenya B+ Stable B
Mozambique CC Negative C
Nigeria B Stable B
Rwanda B Stable B
Senegal B+ Stable B
South Africa BBB- Negative A-3
Uganda B Stable B
Zambia B Negative B
Source: Haile (2018:174)
Despite the low grading (mostly sub-investment), SSA countries acquired more debt at higher
yields, to compensate investors for increased risk. This rendered Africa as having “the highest
sovereign Eurobond yields in the world”, even surpassing the developing nations in the Asia-
Pacific region (Haile, 2018:176). Total debt stock of SSA countries increased from under $1
billion in 2008 to $18 billion by 2014. In 2017, African sovereigns sold $18 billion worth of
stock—well above the 2016 issue. This has largely been due to attractive yields offered by these
issues, averaging six percent, compared with emerging markets’ 5.5% and 4% for Asia-Pacific
developing countries.
30
Haile (2018:176) reports that Africa lost $50 billion annually through illicit fund flows during
the period 2000–2008. This was in addition to the already challenged domestic resources
mobilisation, particularly taxation (Junquera-Varela et al., 2017). Capital flight is suspected to
have association with the region’s lack of political stability; ineffective institutions (e.g. law and
order); lack of democratic accountability; lack of proper regulatory institution supervision; and
corruption (Haile, 2018:177). This, together with low debt-management capacities in the region,
potentially exposes the funds raised to mismanagement. The vicious cycle of increased sovereign
borrowing begins, leading to unsustainable debt levels.
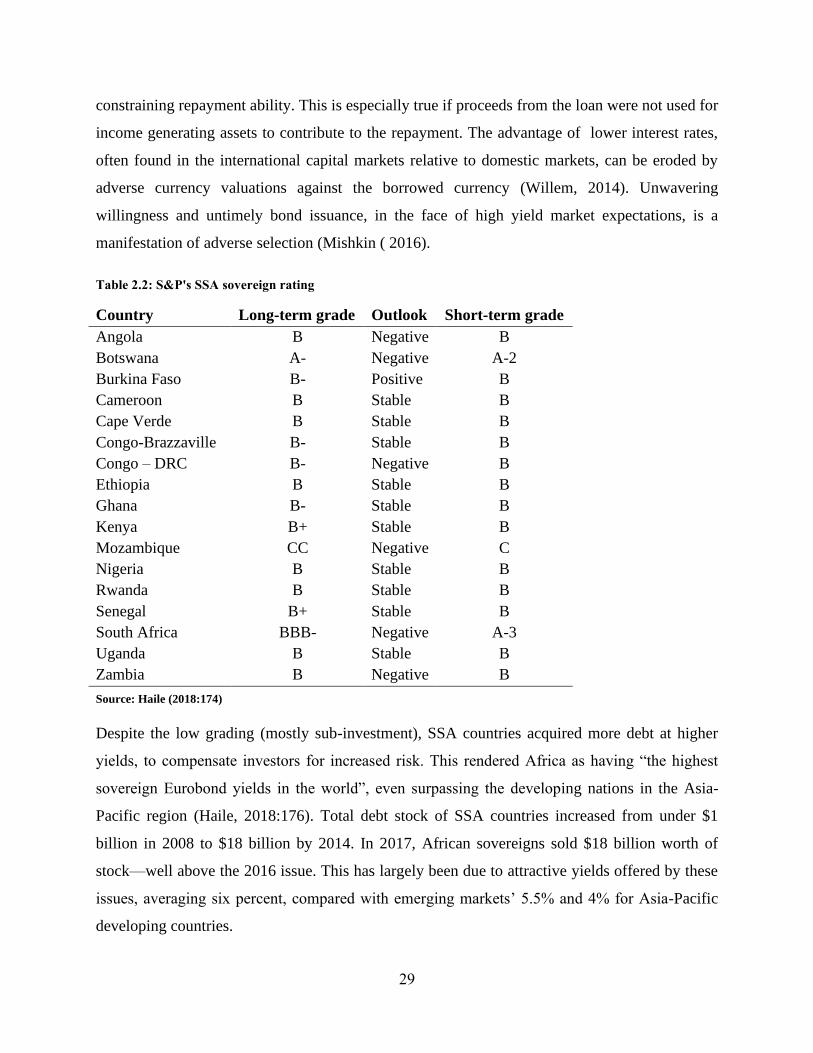
Between 2004 and 2017, there was a total of 49 sovereign bonds issued by SSA countries, with
arithmetic cumulative of about four issues per country (Van der Wansem, Jessen, & Rivetti,
2019). Most issuing was done in 2013, following a “beauty contest” style (Willem, 2014),
closely followed by 2015. In both years there was a high frequency of issues totalling ten and
eight issues respectively, from six countries in each year. Apart from South Africa, Seychelles
led the way by issuing its US$200 million Eurobond (Mbu, 2016). Positive market sentiment
must have complemented the issuing spree that saw the highest number of issues between
2011and 2015 (31 issues in total).
Table 2.3: SSA sovereign bond from 2004
Country 2004 2005 2006 2007 2008 2009 2010 2011 2012 2013 2014 2015 2016 2017 Total
Angola 1 2 3
Cameroon 1 1
Cote d'Ivoire 1 2 2 5
Ghana 1 1 1 1 1 5
Kenya 4 4
Namibia 1 1 2
Nigeria 1 2 1 4
Rwanda 1 1
Senegal 1 1 1 1 4
South Africa 1 1 1 2 2 2 1 1 2 3 16
Tanzania 1 1
Zambia 1 1 1 3
Totals 1 0 1 2 0 3 3 5 2 10 6 8 4 4 49
Source: van der Wansem, Jessen & Rivetti (2019:51)
Twelve SSA countries issued sovereign bonds within the period 2004–2017, with at least one
country issuing in all years except 2005 and 2008. Increased appetite for SSA bonds enticed
more countries to issue, as evidenced by more issues after 2009. This year marks the end of a
global financial crisis that started with the U.S. sub-prime mortgage crisis in 2007. With very
31
low interest rates in the developed markets, the search for high yields saw portfolio flows into
SSA. Improving political stability and macroeconomic ‘pull’ factors attracted the flow of money
to SSA (Senga, 2019; Senga, Cassimon, & Essers, 2018).
Most SSA bonds were oversubscribed, clearly indicating commendable investor appetite (Mbu,
2016). This was driven by overall lower interest rates in the advanced economies after the major
global financial crisis, offered in a bid to stimulate ailing economies. Meanwhile, SSA’s
insignificant integration in the international financial system mitigated the impact. Quantitative
easing, by advanced economies and regional central banks, was met by SSA’s decade of growth
and macroeconomic stability. SSA bonds immediately became attractive as profitable
investments (Mbu, 2016).
2.4 Development finance institutions, lending criteria, borrowing architecture
Strategic and general developmental needs of societies render traditional commercial banking
less useful, owing to business model fundamentals. While the development needs require long-
term patient financing, commercial banking is primarily short-term (Alagidede, 2012; Ocran,
2012). The inevitable mismatches between funding supply and demand period requirements
mean that an alternative must be created. It goes without saying that this long-term financing
increases creditor exposure due to the duration, and potentially scares away private investment.
The public got to the cross-roads and eventually deliberated on the kind of long-term financing-
model-driven institution required—and the development finance institution was born.
Development financing is an old concept, sometimes referred to as patient or long-term
financing. Many development finance institutions were established after the Second World War.
Their founding mandate was the development of countries after the wartime destructions, to
grow economies and improve livelihoods. It underpinned industrial expansion in the now-
developed world, especially Britain and continental Europe. The industrial expansion and
economic growth strategic imperatives wouldn’t fit the commercial banking business models
(Sagasti et al., 2004). Since development finance institutions principally provide financial
intermediation for a country to achieve strategic economic development (and hence take the
banking format), they are also referred to as development banks.
32
Main activities of development finance institutions include: providing financial resources and
technical assistance; creating financial markets; providing de-risking instruments; lengthening
maturities in the financial sector and promoting standards (Kingombe, Massa, & Willem, 2011;
Sagasti et al., 2004). The catalytic character of development finance institutions is manifested in
the financial additionality and commercial mobilisations. Both serve to mitigate excessive costs
of offering a service or the risk of serving in untraversed territory, (Husakova, 2018). As such,
DFIs invest in a variety of sectors, including financial, infrastructural and agribusiness.
Investment in finance is mainly for stimulation, and the latter two for additionality purposes,
(Kingombe et al., 2011).
Owing to the myriad differences in the funding models of commercial and development banks,
the latter’s establishment legislation is specialised. Caution is taken not to crowd out private
investment, since historic ownership of development banks has been in the hands of national
governments (which already have the upper hand in balance sheet and budget support). Main
instruments used by DFIs include: guarantees; equity and quasi-equity; equity funds and loans.
Operational mandates are evidently driven by shareholder targets or regulations; interests of
home country firms; sectoral comparative advantages; sectoral economic impact; and lack of
capital or a market failure in specific sectors (Kingombe et al., 2011). Operational preference is
markedly in the smaller firms and larger projects with larger firms for bilateral and multilateral
DFIs respectively.
The World Bank Group has been instrumental in the formation of some large regional DFIs,
namely Inter-American Development Bank (1959), African Development Bank (1964), and
Asian Development Bank (1966). Those established without the blessing of the World Bank
Group include: Interbank for Economic Cooperation (1963); Islamic Development Bank (1975);
BRICS Bank (2014); and Asian Infrastructure Investment Bank (2015). The largest proportion of
DFIs’ ownership is in public hands; then mixed private and public, and least in private hands
(Kenny, Kalow, Leo, & Ramachandran, 2018; Kingombe et al., 2011). There are over 500 DFIs
globally, and over 140 in Africa (Ntsaluba, 2014). In terms of balance sheets, the three largest
DFIs, excluding the World Bank are China Development Bank, BNDES and KfW.
33
The role and conduct of the International Monetary Fund (IMF) in the external financing space is
discussed by Kingombe et al. (2011). Their contributions build up and further extend discussions
from earlier work, laying the groundwork and giving an account of development financing
architecture and growth over time. On the other hand, the discussion of African sovereign bond
issues and related transaction costs can be found in Olabisi and Stein (2015). And, the emerging
markets study of “resources booms and busts, borrowing and regime change” was done by
Nyambuu and Semmler (2017).
Relevance to the proposed research question can be drawn from the works of Humphrey and
Michaelowa, (2013), Kleimeier and Versteeg, (2010), Pham, (2015), Prizzon, Greenhill, 2017;
and Dancho, (2015). The first importance of project finance is given fitting backing by panel
data from 90 countries for the period 1991–2005. Project finance fans economic growth, with the
highest impact on the developing countries, where (usually) “financial development and
governance is weakest” (Kleimeier & Versteeg, 2010). So, the importance of project finance
cannot be overstated.
This subject has attracted substantial attention and interest from scholars and practitioners, trying
to develop an understanding of sovereign lending criteria. Multilateral finance institutions have
spelled out their own criteria for lending within their areas of specialisation. There are some
defined criteria in bilateral lending, apart from the effect of relationships between the states
involved. On the other hand, capital markets are informed by sovereign creditworthiness
established through creditworthiness rating exercises. Countries with better ratings win the
confidence of the investor community and can borrow cheaply.
It is important to note there are both qualitative and quantitative factors used for determining the
lending of funds by creditors. Financial institutions have credit profiling methodologies, largely
reflecting a corporate finance approach (Mishkin, 2016). This approach is largely quantitative,
but extended credit ratings (often done for large corporations and sovereigns) usually include
both quantitative and qualitative factors. Typically, qualitative factors revolve around policy
certainty, institutions, governance and public accountability, culminating in political maturity
(Afonso, Gomes, & Rother (n.d.); Binici & Hutchison, 2018; Boumparis, Milas & Panagiotidis,
34
2017; Chee, Fah & Nassir, 2015; Langohr, 2008). Further discussions on qualitative drivers of
sovereign lending are in the following paragraphs.
Interesting findings from the work of Winters (2010) shed light on the World Bank’s lending
criteria. Similarly, behaviour was closely observed for other donors, and key determinants
include rule of law, good governance and democracy, (Winters, 2010). There is cited literature
documenting an important observation regarding IMF lending criteria, which attest that it is not
uniform across sovereign debtors (Saggar, 2001). There is another documented observation that
the IMF lends to countries within which private banks of G5 countries are exposed. This
inevitably implies that loans are aimed at bailing out private sector actors of its major
shareholders (Bunte, 2013).
Other observed elements include “quality of economic policy and quality of governing
institutions”, with empirical data conclusively providing “evidence that well governed countries
receive a larger portion of their project lending as nationwide projects” (Winters, 2010).
However, contrary approaches (to good governance or other meriting factors) are also observed
where there are stronger “political incentives, particularly for bilateral donors” (Winters, 2010).
Other determinants of bank lending are discussed in Pham (2015).
Economic policy and its consistency play a vital role in ascertaining existing investment
protection. Strong institutional infrastructure instils confidence in the protection of investor
rights. Good governance is a requirement for sound economic policy and strong institutions.
Democratic dispensation is instrumental in good governance, and government leaders being held
accountable. All factors mentioned here are catalytic for strong economic fundamentals and
critical for a country’s creditworthiness.
Apart from the qualitative factors cited above, external lending is largely dependent on
quantitative factors too. It is for this reason that responsible borrowing and lending, strongly
advocated by United Nations Conference on Trade and Development (UNCTAD), calls for
prudent quantitative evaluations (UNCTAD, 2012a). Evidence of possible overconfidence in the
future economic performance, which happened in the SSA region, is discussed in Mustapha
(2014) and Zeufack (2018). Other factors facilitating flow of capital in the region include current
account surpluses (hence excess liquidity) in oil-exporting countries (Mustapha, 2014) and the
35
search for yield, driven by low interest rates in the developed world (Gevorkyan & Kvangraven,
2016). The ability to raise loans by countries in the SSA calls for robust debt management
practices (Zampolli, 2013).
In the light of the discussion above, we can assert that sovereign creditworthiness has impact on
economic growth. For example, the negative impact of credit rating on the private investor is
discussed in Chen, Chen, Chang and Yang, (2013) and Hill, Bissoondoyal-Bheenick and Faff,
(2018). Retarded private investment effectively slows economic growth. Bretton-Woods
institutions also have rating methodologies encompassing qualitative and quantitative factors,
chiefly the rule of law, strength of public institutions and good governance. Discussed below is
the list of attributes desirable for borrowing from development finance institutions (DFIs).
The borrower-side-influencing factors are given interesting attention by a number of scholars and
research studies. Insights from corporate finance capital structure theory by Miller and
Modigliani are deliberated on in Jaros and Bartosova (2015). Another firm-level insight
regarding interest burden and external finance choices is given attention by Muhamed Zulkhibri
(2015), using a 1990–2010 panel data set of 900 listed firms in Malaysia (Zulkhibri, 2015).
Corporate borrowing is a function of capital structure policy and other identified profitable
projects and/or expansion requirements. It is, however, noted that raising loans (when deemed
necessary) comes with competent prudence, manifested in the cost minimisation—particularly
through securing credit at best prices.
There is light shed on multilateral lending by Humphrey and Michaelowa (2013). Interestingly,
the idea exposes the dynamics of the market in influencing multilateral development bank
(MDB) lending. Healthy bank lending is a function of domestic conditions, and can be seriously
undermined or exposed to vulnerability by sovereign dependence on foreign capital inflows
(Pham, 2015). This inevitably points towards the importance of a country’s healthy economic
fundamentals. They are instrumental in curbing uncertainties, and thus protecting confidence on
the part of investors and consumers.
2.5 Sovereign borrowing and debt management
Generally, sovereign borrowing refers to liabilities incurred by the state for various operational
and project purposes. One example is financing the national budget and domestic monetary
36
balance. Governments take on debt when collections from conventional revenue sources are less
than projected (Bunte, 2013). Cutting spending and raising taxes are unpopular with the
electorate and can seldom be chosen. One option open to the state is to raise financial resources
using debt instruments—from both domestic and external creditors.
Domestic creditors consist of commercial banks, institutional investors and individuals. External
lenders include capital markets, multilateral and bilateral creditors (International Bank for
Reconstruction and Development [IBRD], 2019). Debt portfolios for borrowing countries have
been expanded by newcomers in the new regional development bank (BRICS) and non-Paris
Clubii members such as China (Mustapha & Prizzon, 2018). Mechanisms used by countries to
raise loans include general obligation bonds, certificates of participation and revenue bonds
(Robbins & Simonsen, 2019). Raising loans from domestic markets is done mainly through
treasury bills, treasury notes, and bonds.
Raising funds from capital markets is through the issuance of long-term bonds. Loan contracts
are used to raise loans from official creditors (bilateral and multilateral). The mechanism is
common with newcomers. Whatever the vehicle, loan raising is authenticated by agreement in
the form of contract, backed by the lender’s faith in the borrower. Access to capital markets is
facilitated by sovereign credit-worthiness which is established through an exercise carried out by
independent credit-worthiness rating agencies (Alagidede, 2012; Ntsalaze, Boako & Alagidede,
2017; Ocran, 2012).
The three major global credit raters are Moody’s, Fitch Ratings, and Standard and Poor’s.
Ratings given to debt instruments are categorised into two main groups—investment and sub-
investment grades. Both have varying degrees of ratings from most stable to slightly speculative.
Varying degrees correspond to varying interest rates set by the market. Most stable prime-class
issues pay the lowest yield but ascertain the payment of par value of the bond with principal at
stipulated times.
Ratings influence the interest rates demanded by investors to compensate for risk. Countries with
higher ratings raise loan funds at lower interest rates, and the reverse is true for those with lower
ratings. Borrowing cost-effectively has debt-servicing sustainability benefits. Countries
struggling to honour their debt obligations are also confronted with high interest rates. Interesting
37
discussions about credit ratings are found in Ballester and González-Urteaga, (2017); Bedendo,
Cathcart and El-Jahel, (2018); Boumparis et al., (2017); Chee et al., (2015); Hemraj, (2015);
Kruck, (2011); Mattarocci, (2014); Paudyn, (2014); Cantor, (2015); Stiglitz, (2010).
Conditions for loans from multilateral and bilateral lenders are centred on the borrower’s good
governance and rule of law. However, literature has since asserted that bilateral relationships can
have political reasoning outweighing a debtor’s economic and institutional strength (Megliani,
2015). Other conditions are institutional-mandate driven. For example, the IMF is primarily
mandated to help alleviate sovereign deficit problems. The IMF is also popular for pushing
austerity measures onto its debtors, mainly for reasons related to repayment abilities. New
creditors are seemingly positioned to exploit gaps left by traditional official lenders.
Raising loans emerges from developmental and economic premises—from budget deficit to
mega-infrastructure projects. When financing capital expenditure, using debt enhances the
“improving of equity and efficiency, preservation of tax base, and avoidance of dramatic
fluctuations in tax rates” (Yan, 2013). Global goals and national strategies benefit from
borrowing as one of the options left to sovereigns. This option appears before the backdrop of
low tax-revenue growth or “only limited space for further expansion”, coupled with “low equity
investment inflows and flat-lining aid budgets” (Mustapha & Prizzon, 2018). Debt is also
instrumental in the “mobilization of resources in the modern economies” (Blankenburg & Kozul-
Wright, 2016).
Other reasons include fiscal stimulus (especially during recessions), exceptional events such as
war, natural disasters, unexpected price increases of imported commodities such as oil or corn,
and large investment projects (Fatás, Ghosh, Panizza, & Presbitero, (2019); Makhlouf, 2014).
Development of the financial and stock markets can also be facilitated by raising debt to launch
them and support sustained growth by raising the domestic debt, instilling confidence in the
market participants. Dynamic inefficiency is cited as instrumental for creating government debt,
and it constrains optimal transfer of wealth across generations (Fatás et al., 2019). A breeding
ground for dynamic inefficiency is the economy’s rate of return being below its growth rate.
Interest rates on government debt also falls below GDP growth rates (Fatás et al., 2019).
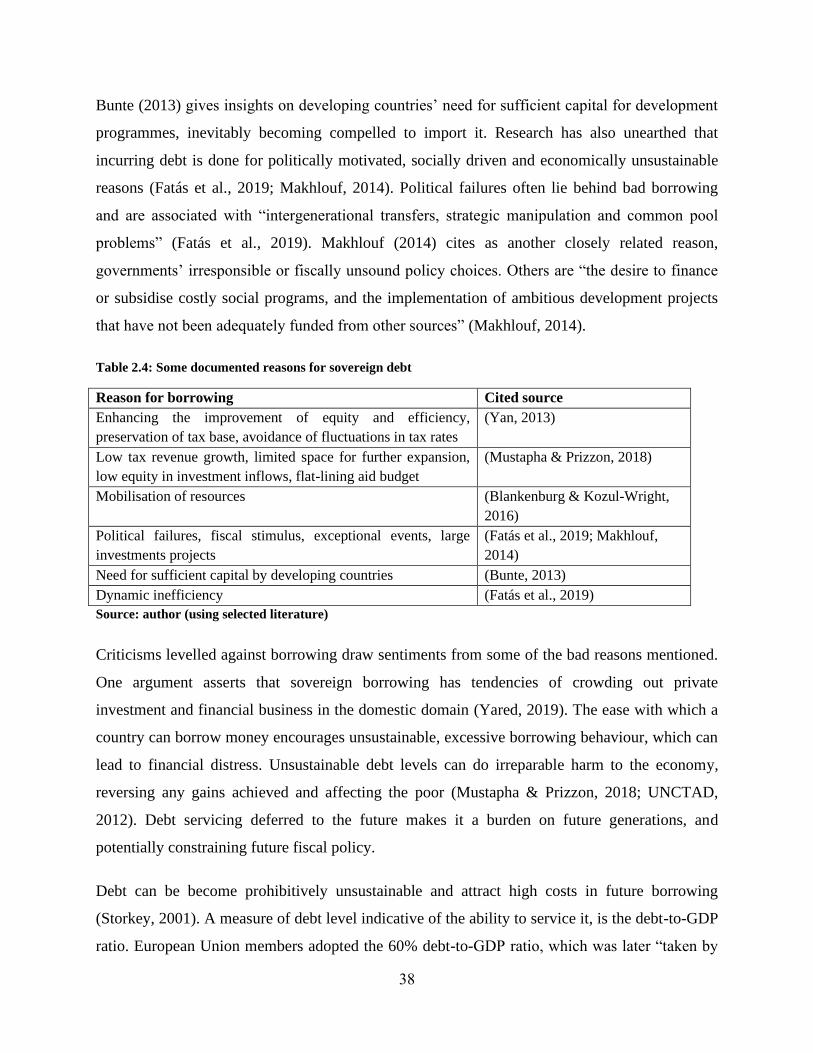
38
Bunte (2013) gives insights on developing countries’ need for sufficient capital for development
programmes, inevitably becoming compelled to import it. Research has also unearthed that
incurring debt is done for politically motivated, socially driven and economically unsustainable
reasons (Fatás et al., 2019; Makhlouf, 2014). Political failures often lie behind bad borrowing
and are associated with “intergenerational transfers, strategic manipulation and common pool
problems” (Fatás et al., 2019). Makhlouf (2014) cites as another closely related reason,
governments’ irresponsible or fiscally unsound policy choices. Others are “the desire to finance
or subsidise costly social programs, and the implementation of ambitious development projects
that have not been adequately funded from other sources” (Makhlouf, 2014).
Table 2.4: Some documented reasons for sovereign debt
Reason for borrowing Cited source
Enhancing the improvement of equity and efficiency,
preservation of tax base, avoidance of fluctuations in tax rates
(Yan, 2013)
Low tax revenue growth, limited space for further expansion,
low equity in investment inflows, flat-lining aid budget
(Mustapha & Prizzon, 2018)
Mobilisation of resources (Blankenburg & Kozul-Wright,
2016)
Political failures, fiscal stimulus, exceptional events, large
investments projects
(Fatás et al., 2019; Makhlouf,
2014)
Need for sufficient capital by developing countries (Bunte, 2013)
Dynamic inefficiency (Fatás et al., 2019)
Source: author (using selected literature)
Criticisms levelled against borrowing draw sentiments from some of the bad reasons mentioned.
One argument asserts that sovereign borrowing has tendencies of crowding out private
investment and financial business in the domestic domain (Yared, 2019). The ease with which a
country can borrow money encourages unsustainable, excessive borrowing behaviour, which can
lead to financial distress. Unsustainable debt levels can do irreparable harm to the economy,
reversing any gains achieved and affecting the poor (Mustapha & Prizzon, 2018; UNCTAD,
2012). Debt servicing deferred to the future makes it a burden on future generations, and
potentially constraining future fiscal policy.
Debt can be become prohibitively unsustainable and attract high costs in future borrowing
(Storkey, 2001). A measure of debt level indicative of the ability to service it, is the debt-to-GDP
ratio. European Union members adopted the 60% debt-to-GDP ratio, which was later “taken by
39
many countries as a guide, not a mandate” (Makhlouf, 2014). However, this ratio has often been
exceeded by a number of countries in the developed and low-income countries alike. The
situation becomes critical when high debt repayments lead to financial distress, restructuring,
repudiation or outright default in the worst cases.
Debt limit discussion is found in Bastos, (2013); Martins-da-rocha and Vailakis (2016); Robbins
and Simonsen (2019). Pierre Yared (2019) documented that for the period 1990–2015, a number
of countries with fiscal rules in place increased from seven to 92. This was despite the cited
evidence of gross misconduct, by policy makers, of depleting fiscal space once in power in
pursuit of political mileage (Makhlouf, 2014). Limited evidence linking public debt
accumulation and surges in public investment, found in Fatás et al. (2019), attracts public
perceptions of imprudence on the part of policy makers. Apart from bad reasons for borrowing,
misbehaviour on the part of debtors or creditors are partly to blame for sovereign debt limited
impact (Gulati, 2010b; Mustapha & Prizzon, 2018; UNCTAD, 2012a).
Sovereign debt management entails the process of looking after government debt activities from
loan planning to servicing it fully, carefully managing all risks while maximizing benefits. The
funding details required, possible sources of funding, currency, costs of borrowing, repayment
ability, maturity profile and specific lender conditions comprise debt management (Zampolli,
2013). It is the function of debt management to ensure that country’s credibility and image is
enhanced in the creditor markets. This is achieved through ascertaining debt repayment with the
lowest possible cost, while optimally executing the financing objectives in place. In other words,
debt management should raise, manage and retire government debt at the lowest cost consistent
with acceptable risk exposure (Jonasson & Papaioannou, 2018; Karangizi, 2019; Willem, 2014).
Debt levels rise and fall with business cycles (Makhlouf, 2014). The advantages of sovereign
debt management are sufficiently discussed in Jonasson and Papaioannou, (2018 and Karangizi
(2019). The government’s ability to reduce market exposure, rollover or refinance, liquidity,
credit, settlement and operational risks is a function of competent sovereign debt management
(Jonasson & Papaioannou, 2018). Independence of the debt-management function from fiscal
and monetary policies makes it effective (Hoogduin et al. (2011). Cost-benefit analytical and risk
minimisation characteristic features of debt management make its importance salient. Strong
40
debt management helps maintain debt sustainability and prevents a country’s increased spending
on servicing debt being at the cost of education, health and infrastructure (Mustapha & Prizzon,
2018).
Reducing the risk that government’s own portfolio becomes a source of instability—within and
across borders—is one of debt management’s primary responsibilities. Put in place, the debt-
management strategies help reduce a country’s susceptibility to contagion and financial risks
(Hoogduin et al., 2011). Strong debt-management uses sound planning to determine the amount
to be borrowed, the best borrowing instruments, the situation after debt, and calculates the risks
in the short-, medium- and long-range horizons (Makhlouf, 2014). This underpins robust crafting
of debt-management strategy, through designing the least risky debt portfolio that also minimises
the debt-servicing cost (Makhlouf, 2014). Other debt- management strategy advantages include
setting the annual maturity debt ceiling and the average time to maturity (Makhlouf, 2014).
2.6 Debt situation in Sub-Saharan African countries
Sub-Saharan Africa is facing a number of economic hurdles to overcome to encourage economic
growth and financial development. Foreign direct investment is slower, and capital market
development is still in the infancy stage. Revenues from export markets are yet to reach the
momentum that will facilitate sound growth and take many people in the region out of poverty.
This is against the commendable efforts by a number of countries establishing stock markets.
The countries are still considered risks, so their fund-raising comes at a substantial cost (Akanbi,
2016; Coulibaly, Brahima & Gandhi, 2019; IMF, 2019).
Many countries in the region qualified for Heavily Indebted Poor Country (HIPC) and
Multilateral Debt Relief (MDR) initiatives and benefitted handsomely. This improved individual
sovereign countries’ balance sheet ratios, thus enabling them to secure more loans for
development and poverty-reduction purposes. Improved creditworthiness was coupled with a
wider choice of creditors. For example, borrowing expanded from traditional lenders to include
non-Paris Club members such as China. Increased access to international capital markets,
development of domestic markets, improved investor confidence and search for yield, improved
sovereign borrowing in the region (Prizzon & Greenhill, 2017; IBRD, 2019; Mustapha &
Prizzon, 2018).
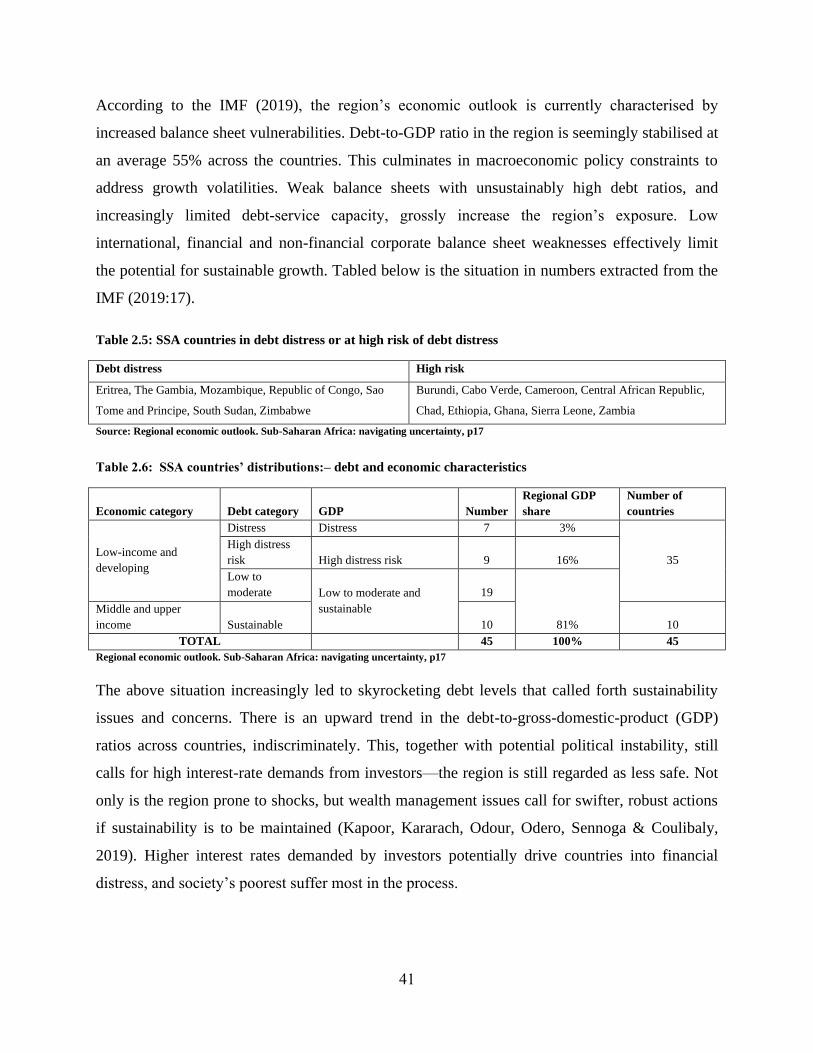
41
According to the IMF (2019), the region’s economic outlook is currently characterised by
increased balance sheet vulnerabilities. Debt-to-GDP ratio in the region is seemingly stabilised at
an average 55% across the countries. This culminates in macroeconomic policy constraints to
address growth volatilities. Weak balance sheets with unsustainably high debt ratios, and
increasingly limited debt-service capacity, grossly increase the region’s exposure. Low
international, financial and non-financial corporate balance sheet weaknesses effectively limit
the potential for sustainable growth. Tabled below is the situation in numbers extracted from the
IMF (2019:17).
Table 2.5: SSA countries in debt distress or at high risk of debt distress
Debt distress High risk
Eritrea, The Gambia, Mozambique, Republic of Congo, Sao
Tome and Principe, South Sudan, Zimbabwe
Burundi, Cabo Verde, Cameroon, Central African Republic,
Chad, Ethiopia, Ghana, Sierra Leone, Zambia
Source: Regional economic outlook. Sub-Saharan Africa: navigating uncertainty, p17
Table 2.6: SSA countries’ distributions:– debt and economic characteristics
Economic category Debt category GDP Number
Regional GDP
share
Number of
countries
Low-income and
developing
Distress Distress 7 3%
35
High distress
risk High distress risk 9 16%
Low to
moderate Low to moderate and
sustainable
19
81%
Middle and upper
income Sustainable 10 10
TOTAL 45 100% 45
Regional economic outlook. Sub-Saharan Africa: navigating uncertainty, p17
The above situation increasingly led to skyrocketing debt levels that called forth sustainability
issues and concerns. There is an upward trend in the debt-to-gross-domestic-product (GDP)
ratios across countries, indiscriminately. This, together with potential political instability, still
calls for high interest-rate demands from investors—the region is still regarded as less safe. Not
only is the region prone to shocks, but wealth management issues call for swifter, robust actions
if sustainability is to be maintained (Kapoor, Kararach, Odour, Odero, Sennoga & Coulibaly,
2019). Higher interest rates demanded by investors potentially drive countries into financial
distress, and society’s poorest suffer most in the process.
42
The International Debt Statistics report (2019) shares important empirical data about the debt
situation in the region. Average debt levels doubled in the period 2010–2017. For thirty countries
that benefitted from HIPC and MDRI, “external debt rose 11% in 2017, compared to 7% in
2016; and a 15.5% increase in external debt, to $535 billion” (IBRD, 2019). For the period
2010–2017, external debt-to-GNI ratio rose by over half, GNI in U.S. dollars rose by 23% on
average, and combined external debt rose by 90 (IBRD, 2019:10). Increases were as high as
200% and 140% for some countries, with eight countries’ ratios standing at over 60% by the end
of 2017, including six that benefitted from HIPC and MDRI. The debt-to-export-earnings ratio
average of 138% in 2017 is close to twice the 2010 70%; and 54% of countries had ratios of
150%, compared to 28 countries in 2010; while those with ratios over 200% rose from six to
fourteen countries in the period 2010–2017.
Other encompassing statistics reveal that a third of countries in the region had a debt service-to-
export ratio of over 10%, with extremes of 15% in some countries. The ratios are not expected to
go down, because of higher debt-service payments in the future (due to bullet payments falling
due on maturing international bond issues) and rising global interest rates (IBRD, 2019).
Debt-service payment projections stand at $48 billion for 2021, with expectations of a steep rise,
or remaining elevated, for many countries over the next two to five years (IBRD, 2019). Against
the rise of new creditors, most countries in the region are still dependent on “financing from
official bilateral and multilateral creditors, which together accounted for 60% of total long-term
external debt-stock at the end of 2017” (IBRD, 2019). Multilateral creditors play a bigger role,
though the share declined from 44% to 34% over the 2010–2017 period.
On the other hand, capital market development and increased access to international capital
markets further increased external borrowing, owing to the greater number of options. At the end
of 2017, bondholders were owed $105 billion, representing “29 of outstanding external long-
term debt of countries in the region, compared to 13 in 2010” (IBRD, 2019). Bond issuance rose
more than four times between 2016 and 2017, from $4 billion to $27 billion, with major
contributions coming from South Africa ($19 billion). The $8 billion contribution by other
countries represented a tenfold increase from 2016. “Private creditors and lending by commercial
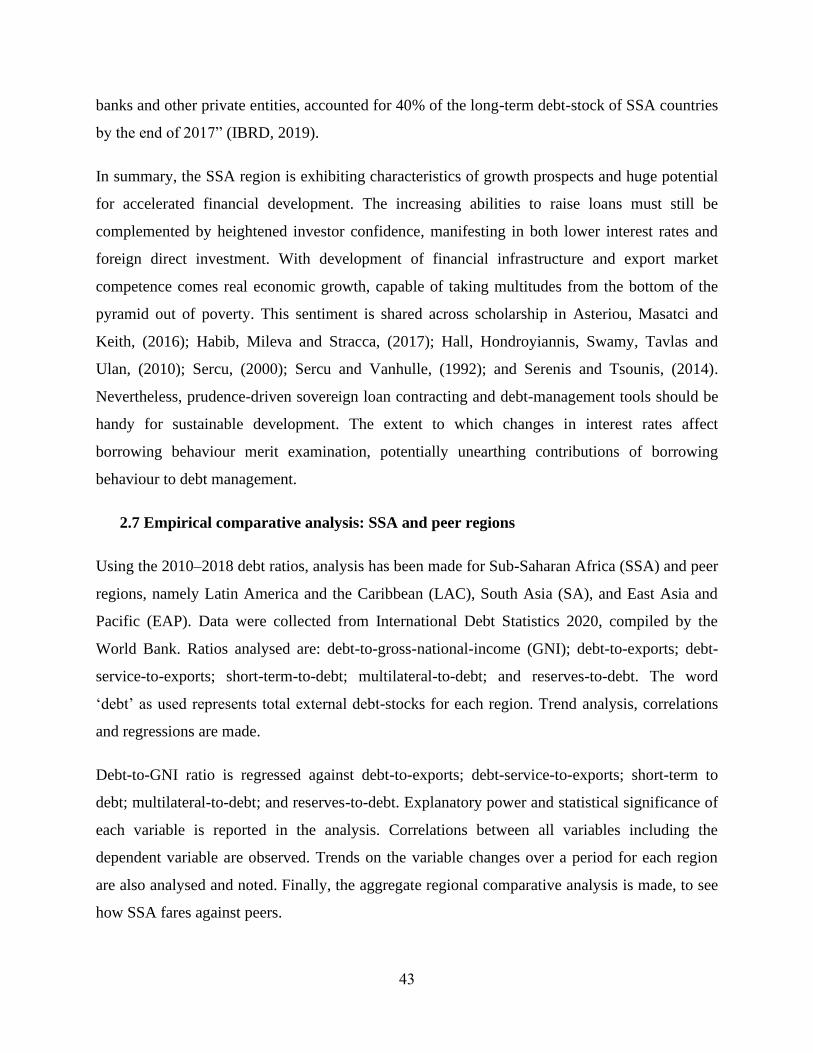
43
banks and other private entities, accounted for 40% of the long-term debt-stock of SSA countries
by the end of 2017” (IBRD, 2019).
In summary, the SSA region is exhibiting characteristics of growth prospects and huge potential
for accelerated financial development. The increasing abilities to raise loans must still be
complemented by heightened investor confidence, manifesting in both lower interest rates and
foreign direct investment. With development of financial infrastructure and export market
competence comes real economic growth, capable of taking multitudes from the bottom of the
pyramid out of poverty. This sentiment is shared across scholarship in Asteriou, Masatci and
Keith, (2016); Habib, Mileva and Stracca, (2017); Hall, Hondroyiannis, Swamy, Tavlas and
Ulan, (2010); Sercu, (2000); Sercu and Vanhulle, (1992); and Serenis and Tsounis, (2014).
Nevertheless, prudence-driven sovereign loan contracting and debt-management tools should be
handy for sustainable development. The extent to which changes in interest rates affect
borrowing behaviour merit examination, potentially unearthing contributions of borrowing
behaviour to debt management.
2.7 Empirical comparative analysis: SSA and peer regions
Using the 2010–2018 debt ratios, analysis has been made for Sub-Saharan Africa (SSA) and peer
regions, namely Latin America and the Caribbean (LAC), South Asia (SA), and East Asia and
Pacific (EAP). Data were collected from International Debt Statistics 2020, compiled by the
World Bank. Ratios analysed are: debt-to-gross-national-income (GNI); debt-to-exports; debt-
service-to-exports; short-term-to-debt; multilateral-to-debt; and reserves-to-debt. The word
‘debt’ as used represents total external debt-stocks for each region. Trend analysis, correlations
and regressions are made.
Debt-to-GNI ratio is regressed against debt-to-exports; debt-service-to-exports; short-term to
debt; multilateral-to-debt; and reserves-to-debt. Explanatory power and statistical significance of
each variable is reported in the analysis. Correlations between all variables including the
dependent variable are observed. Trends on the variable changes over a period for each region
are also analysed and noted. Finally, the aggregate regional comparative analysis is made, to see
how SSA fares against peers.
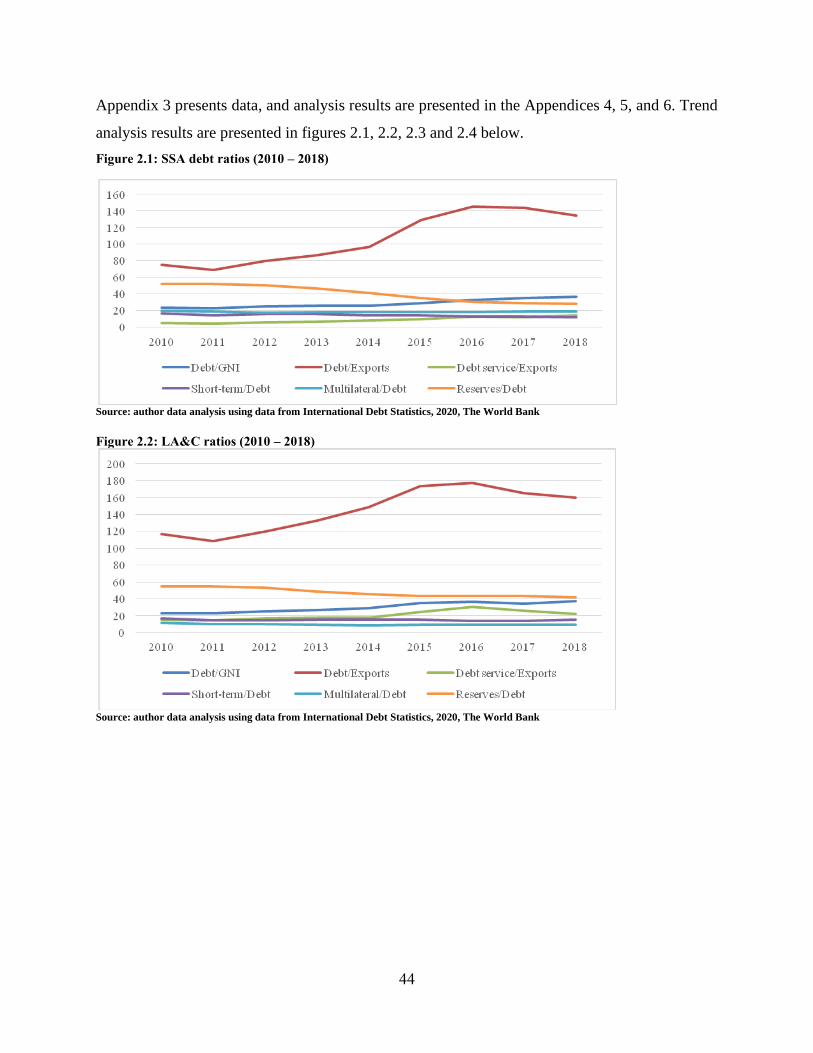
44
Appendix 3 presents data, and analysis results are presented in the Appendices 4, 5, and 6. Trend
analysis results are presented in figures 2.1, 2.2, 2.3 and 2.4 below.
Figure 2.1: SSA debt ratios (2010 – 2018)
Source: author data analysis using data from International Debt Statistics, 2020, The World Bank
Figure 2.2: LA&C ratios (2010 – 2018)
Source: author data analysis using data from International Debt Statistics, 2020, The World Bank
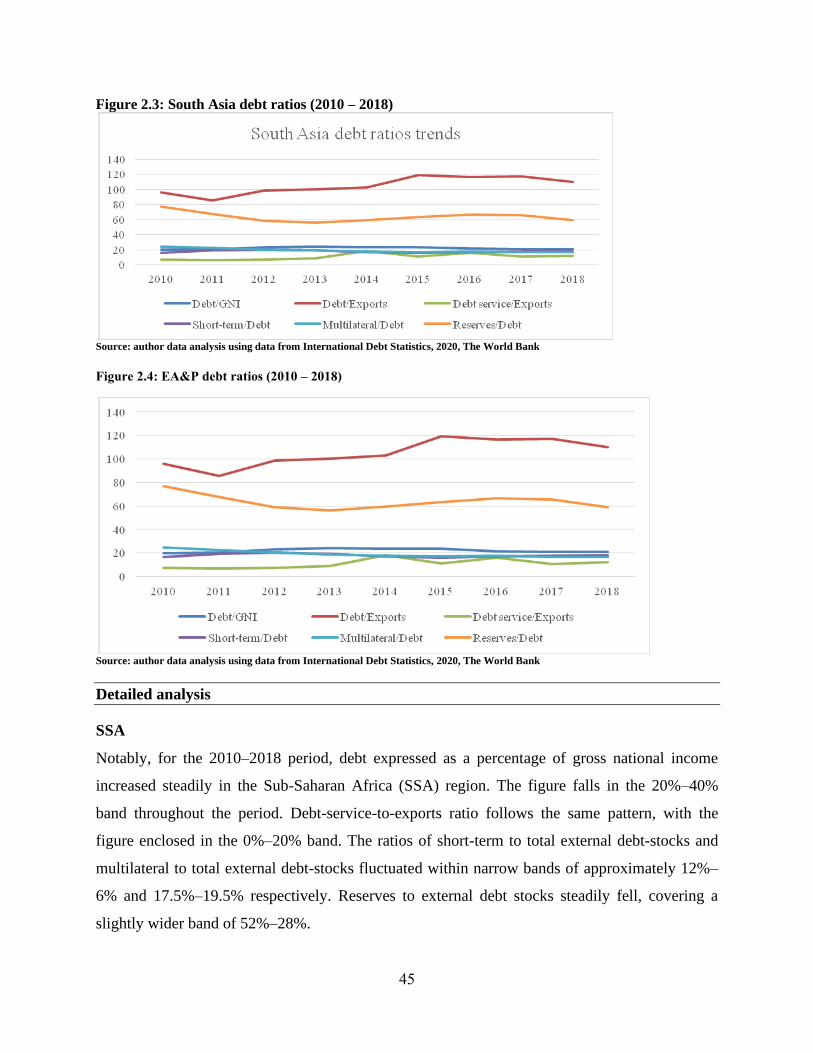
45
Figure 2.3: South Asia debt ratios (2010 – 2018)
Source: author data analysis using data from International Debt Statistics, 2020, The World Bank
Figure 2.4: EA&P debt ratios (2010 – 2018)
Source: author data analysis using data from International Debt Statistics, 2020, The World Bank
Detailed analysis
SSA
Notably, for the 2010–2018 period, debt expressed as a percentage of gross national income
increased steadily in the Sub-Saharan Africa (SSA) region. The figure falls in the 20%–40%
band throughout the period. Debt-service-to-exports ratio follows the same pattern, with the
figure enclosed in the 0%–20% band. The ratios of short-term to total external debt-stocks and
multilateral to total external debt-stocks fluctuated within narrow bands of approximately 12%–
6% and 17.5%–19.5% respectively. Reserves to external debt stocks steadily fell, covering a
slightly wider band of 52%–28%.
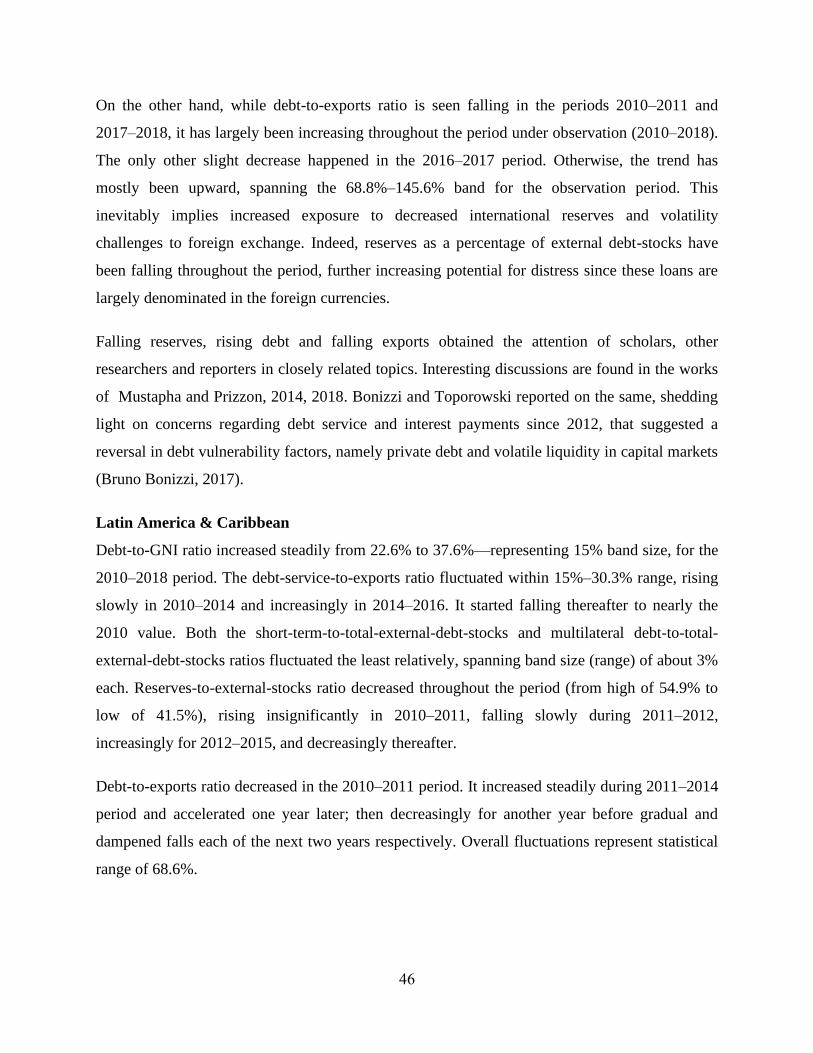
46
On the other hand, while debt-to-exports ratio is seen falling in the periods 2010–2011 and
2017–2018, it has largely been increasing throughout the period under observation (2010–2018).
The only other slight decrease happened in the 2016–2017 period. Otherwise, the trend has
mostly been upward, spanning the 68.8%–145.6% band for the observation period. This
inevitably implies increased exposure to decreased international reserves and volatility
challenges to foreign exchange. Indeed, reserves as a percentage of external debt-stocks have
been falling throughout the period, further increasing potential for distress since these loans are
largely denominated in the foreign currencies.
Falling reserves, rising debt and falling exports obtained the attention of scholars, other
researchers and reporters in closely related topics. Interesting discussions are found in the works
of Mustapha and Prizzon, 2014, 2018. Bonizzi and Toporowski reported on the same, shedding
light on concerns regarding debt service and interest payments since 2012, that suggested a
reversal in debt vulnerability factors, namely private debt and volatile liquidity in capital markets
(Bruno Bonizzi, 2017).
Latin America & Caribbean
Debt-to-GNI ratio increased steadily from 22.6% to 37.6%—representing 15% band size, for the
2010–2018 period. The debt-service-to-exports ratio fluctuated within 15%–30.3% range, rising
slowly in 2010–2014 and increasingly in 2014–2016. It started falling thereafter to nearly the
2010 value. Both the short-term-to-total-external-debt-stocks and multilateral debt-to-total-
external-debt-stocks ratios fluctuated the least relatively, spanning band size (range) of about 3%
each. Reserves-to-external-stocks ratio decreased throughout the period (from high of 54.9% to
low of 41.5%), rising insignificantly in 2010–2011, falling slowly during 2011–2012,
increasingly for 2012–2015, and decreasingly thereafter.
Debt-to-exports ratio decreased in the 2010–2011 period. It increased steadily during 2011–2014
period and accelerated one year later; then decreasingly for another year before gradual and
dampened falls each of the next two years respectively. Overall fluctuations represent statistical
range of 68.6%.
47
South Asia
South Asia’s debt-to-GNI ratio fluctuations were very narrow and smooth, ranging from a low of
19.9% in 2010 to high of 24% in 2013. Of peculiar nature is the very narrow fluctuation band
and/or extremely small changes between years: for example, 21.4%, 21.1% and 21.1% for 2016,
2017 and 2018 respectively. The same is the case with 23.4% and 23.5% for 2014 and 2015
respectively. Greatest changes from one year to the next are 2.8% for 2011–2012 and 2.1% for
2015–2016 periods. Any other change from one year to the next is less than a full percentage
point. This resulted in a smooth and close to flat trend graph.
Debt-service-to-exports ratio curve fluctuations were equal in both up and downwards directions.
Overall, band size ranged in the low and high of 6.6% and 18.1% respectively. At least for the
2010–2013 period fluctuations were moderate (both up and downwards) at less than a full
percentage point from one year to the next. The spike occurred in 2013–2014 (increase) and
2014–2015 (decrease) period. For the period 2015–2018, there occurred upward, downward, and
upward movements in that order. This gives a clear indication of inconsistency in the ratio,
possibly related to changes in any export quotas, exchange rate, or export commodity price
volatilities.
Short-term debt-to-total-external-debt-stocks ratio spanned a very narrow band, with maximum
of 2.8% for 2010–2011 period, followed by 2% decrease and 1% increase during 2011–2012 and
2015–2016, and decrease in 2012–2013 periods in that order. Otherwise, fluctuations remained
quite slim, resulting in a much flatter graph for the period. Multilateral- debt-to-total-external
debt-stocks ratio shows features like those of debt to GNI and short-term-to-total-external-debt
ratios, fluctuating only slightly but on a moderate downward trajectory. Fluctuations ranged from
a high of 24.5% in 2010 to low of 16.6%, yet moderately decreasing from one year to the next
throughout the observation period.
The reserves-to-total-external-debt-stocks ratio graph meandered smoothly incepting with a
downward but moderate trend for 2010–2013, followed by a moderate upward trend for 2013–
2017 before a moderate decrease for 2017–2018. Fluctuations ranged from maximum to
minimum of 76.9% in 2010 and 39.2% respectively, with only slight up and downward
movements, but generally going downwards. This correlates with the movement in exports as
48
one of the major sources of foreign currencies. Debt-to-exports ratio generally increased for
2010–2018, with combination of leaps and moderate increases. A major decrease was recorded
during 2010–2011, followed by 2017–2018 and 2015–2016.
East Asia & Pacific
Debt-to-GNI ratio generally but gradually increased for the 2010–2018 period, from the
beginning value of 15.6% to the ending value of 17.6%. The trend was upward for 2010–2014
period. Steep decrease during 2014–2015 was followed by a smooth upward trend throughout the
2015–2018 period. Generally, the curve is slightly flatter spanning the 15.6% to 19.7% band for
the entire observation period. Both the minimum and maximum values were largely away from
measures of central tendency, namely the mean and median values.
Debt- service-to-export ratio fluctuated (up, down and up in that order) in the four-percentage
points range (4.2%–4.7%) for the 2010–2013 period. An increase spike happened during 2015–
2016, but the trend was generally upward though gradually for the 2016–2018 period. Trend
minimum and maximum values were 4.2% and 9.1% respectively. Short-term-to-total-external-
debt-stocks ratio spanned low and high values of 43.9% and 58.3%, displaying the combination
of increasing and decreasing trajectory, but generally decreasing.
Multilateral-to-total-external-debt-stocks ratio generally decreased smoothly for the 2010– 2018
period. Greater changes happened in 2010–2011 (decrease) and 2014–2015 (increase) periods. In
all the years but 2014–2015, the trend was moderately downward albeit some spike during 2010–
2011. Reserves-to-external-debt-stocks ratio decreased in all years except for 2014–2015. This
tallies with well with the general upward debt-service-to-export ratio trend, signifying the debt
increase against the falling exports–inevitably exposing the region to difficulties of servicing
external debt, which is largely denominated in the foreign currencies.
Debt-to-exports ratio curve is generally upward sloping in all years except for 2014–2015,
though with a combination of moderate and accelerated increases. The fluctuations spanned the
band of 51% (2010) to 72.1% (2018). Interestingly, through the entire period, the debt-to-exports
ratio remained below 75%.
49
Summary
LA&C recorded the highest overall increase, average and fluctuation bands in the external debt-
stocks-to-GNI ratios, followed by SSA. SA and EA&P had equal fluctuation bands, though
EA&P’s overall increase is slightly greater. On the other hand, SA’s average ratio surpasses that
of EA&P. Both regions rate better than SSA and LA&C. SSA is generally not in either extreme:
lowest or highest. Overall increase in the debt-service-to-exports ratio was highest for SSA
followed by LA&C, which recorded higher in both the average ratio and fluctuations band.
EA&P recorded the least in all the matrices.
Moving forward, SSA recorded the greatest overall decline in the short-term–to-total-external-
debt-stocks ratio, followed by EA&P and LA&C respectively. Conversely, SA recorded an
overall increase comparable in magnitude to LA&C. EA&P recorded the highest average ratio of
short-term-to-total-external debt-stocks, followed by SA, LA&C and SSA respectively. EA&P’s
average is way out of peer regions’ values. It recorded the largest ratio fluctuations band,
followed by SSA. SA and LA&C in that order, with EA&P’s value lying way out of relative
(comparable) range. SA recorded the highest values in overall decrease, average and fluctuations
in the multilateral-to-total-external debt-stocks for the period.
While EA&P followed in the overall decrease and fluctuations, it recorded lowest in the average
ratio. SSA recorded the lowest decrease and fluctuations but second highest in the average ratio.
EA&P recorded the greatest decrease, average, and fluctuations band in the ratio of reserves-to-
external debt-stocks, followed by SSA in all but average, which is occupied by SA. LA&C
recorded the least values in all matrices. SSA recorded highest in the overall increase and
fluctuations band, but comes second to LA&C in the average ratio of debt-to-external debt-
stocks.
Otherwise, LA&C came second in the two values. EA&P recorded the least values in the average
ratio and fluctuations band, but second highest in the average ratio, after SA. Overall, there is a
noticeable declining trend in debt-to-export ratio in all regions towards 2018. It can be suspected
that debt-management practices are increasingly being put in place. With decreasing debt against
increasing exports, countries’ exposure to exchange-rate volatilities is minimised.
50
Debt-service-to-exports is, however, stubbornly either remaining constant or slightly increasing
in all regions except LA&C. Reserves-to-debt is also falling towards 2018. Rising debt-to-GNI
for SSA and LA&C is threatening debt servicing sustainability. In SA and EA&P, the ratio is
mostly constant. One possibility is that national income is not growing in SSA and LA&C.
Another possibility is that the two regions’ sovereigns are not able to tax their economies
sufficiently. Indeed, taxation is wanting in the developing countries, with many having debt-to-
GDP ratio falling short of the 15 per cent benchmark (World Bank Group, 2017).
From correlation analysis, the relationship between external debt and debt-service is positive.
Exports move in the same direction as GNI and reserves are positively correlated to short-term
debt and multilateral loans. Across the regions (except East Asia and Pacific) exports are
negatively correlated to debt and debt generally moves in opposite directions to GNI. In East
Asia and Pacific, debt is positively (but moderately) associated with GNI, implying effective use
of debt for investments, coupled with maintaining healthy debt ratios.
Debt-to-GNI ratio is the regression-dependent variable. Debt-to-exports; debt-service-to-exports;
short-term-to-debt; multilateral-to-debt; and reserves-to-debt are explanatory variables.
Explanatory power strength is determined by R-squared from the results table. Statistical
significance is assessed from the results p-values and t-statistics values. Comparison is done
across the respective areas regression results.
There is generally a strong explanatory power of independent variables over dependent variable
across SSA, LA&C, and EA&P. SA exhibited a comparatively weak explanatory power of
independent variables. Indiscriminately, the independent variables are largely not statistically
significant. Statistically significant variables are reserves-to-debt ratio for LA&C and SA—in the
increasing order. Debt-to-export ratio is statistically significant for EA&P while no explanatory
variable was found to be statistically significant in SSA regression model.
Strong positive response comes from debt-service-to-exports ratio for both SSA and LA&C, and
from multilateral-debt-to-external-debt-stocks ratio for SA and EA&P. So, GNI is influenced by
exports in the SSA and LA&C, and by debt in SA and EA&P. Strong negative responses come
from different explanatory variables across different regions: short-term-debt-to-external-debt-
51
stocks ratio for SSA; reserves-to-external-debt-stocks ratio for LA&C; and debt-service to
external debt-stocks ratio for EA&P. Weak, but worthy of a mention, reserves- to-external debt-
stocks ratio gives negative response among LA&C, SA and EA&P; but positive response in
SSA.
Overall, only a few explanatory variables are statistically significant across the regions. In SSA,
not all variables are statistically significant. In EA&P, only debt-to-export ratio is statistically
significant, with strong evidence. In SA, reserves-to-debt ratio is statistically significant, with
strong evidence. For LA&C, there is weak evidence of statistical significance of reserves-to-debt
ratio.
2.8 SSA’s unsustainable borrowing, financial distress and debt restructuring
Prior to the 1990s, Africa’s decades of snail-pace economic growth resulted from the
accumulation of unsustainable debt and serial restructurings (Karangizi, 2019:14). Reprieve was
provided by debt relief initiatives, namely Heavily Indebted Poor Country (HIPC) initiative
(1996), extended HIPC (1999) and the 2005 Multilateral Debt Relief Initiative (MDRI). HIPC
was launched by the World Bank and International Monetary Fund (IMF). MDRI was launched
by the African Development Bank, the World Bank, and the IMF. Aims of joint HIPC and
MDRI initiatives came to an end in 2011, HIPC closed to new entrants and MDRI terminated
activity ten years after launch (2015).
Initiatives brought the debt back to sustainable levels, inevitably improving Africa’s investment
appeal (Karangizi, 2019:14). New debt levels enabled Sub-Saharan African (SSA) countries to
service their external debt without a restricting burden. They managed to honour their debt
obligations without further relief, while at the same time not compromising growth. The region’s
economic growth complemented by responsible macroeconomic policies, attracted investor
interest. This partially explains the oversubscriptions of SSA sovereign bonds (Mbu, 2016).
Access to debt, in any form, enabled SSA countries to develop infrastructure, exploit their
natural resources, and improve health and education (Karangizi, 2019:13). Overall socio-
economic wellbeing was widely realised through poverty-reduction programmes, expanded by
debt-burden relief initiatives. However, the notable rapid accumulation of new debt in the SSA
region calls for attention. Some countries are getting into high risk of debt-distress and some are
52
already in distress (Karangizi, 2019:14). The World Bank and IMF estimates of January 2019
posit that thirteen SSA countries are at high risk of debt-distress and five are already in distress.
Factors contributing to SSA countries’ debt increase are documented in Karangizi, (2019:16).
They are: falling prices of export commodities in 2014–2016; failure to generate extra revenue to
service debt; migration of liabilities to public balance sheet, e.g. state-owned enterprise losses;
exchange rate depreciations; and poor institutional governance at debt- management and tax
administration levels (Karangizi, 2019:16). The manifestation of these factors indicates weaker
institutional and macroeconomic management. Swift but sustainable reversal of the situation is
warranted, to avoid a repeat of the 1970s debt crisis. The matter may be further complicated by
the current diversified, complex creditor base.
The growing over-indebtedness and risk of future debt-distress among the Sub-Saharan African
countries triggers concerns (Mustapha & Prizzon, 2018). Heavy debts come with the cost of
eventual distress. Extreme debt distress warrants restructurings to restore sustainability and avoid
default. Distress and defaults leave a sour taste in the borrower-lender relationship. This is
additional to high restructuring and post-default borrowing costs.
Political distortions underpin unsustainable borrowing and lead to “time inconsistent preferences
and bias towards present consumption” Fatás et al., (2019). The tendency of politicians to use
debt for decreasing the odds against being re-elected is noted. The presence of ‘fiscal illusion’
encourages excessive borrowing tendencies by rewarding them through re-elections, due to
present consumption bias (Fatás et al., 2019). This culminates in increasing expenditure without
increasing taxes. While this debt expansion may be necessitated by desire to boost economic
performance (e.g. getting out of recession), running surpluses during good economic
performances is evidently less popular (Fatás et al., 2019).
Documented factors impacting the debt limit are: current and projected economic growth rates;
sources of debt in a country’s portfolio (internal vs. external); intended use of debt; debt cost;
size of the economy; projected inflation rates; debt type (concessionary vs. non-concessionary);
loan conditions; political leadership and general public attitudes towards sovereign debt
(Makhlouf, 2014).
53
There are measures to address unsustainable debt levels. While restructuring provides a reprieve
to borrowers, GDP growth, fiscal austerity, inflation, financial repression and defaults can bring
down debt levels to sustainability (Makhlouf, 2014). Financial repression manifests in capping
interest rates, restricting cross-country financial transactions and tighter banking regulations
(Makhlouf, 2014). Another repression approach is borrowing from state-owned and/or controlled
funds such as employee retirement and social security funds (Makhlouf, 2014). Care must,
however, be exercised when implementing repression, since unpalatable outcomes can ensue.
The litmus test for debt sustainability is the ratio of the amount of debt to the country’s gross
domestic product (GDP). There comes, with increasing levels of debt relative to GDP, the
heightening of fiscal space strain. Fiscal space is defined as the theoretical debt limit set by
policymakers net of existing debt (Bastos, 2013). High sovereign debt level not only increases
the country’s exposure, but it also impacts the GDP negatively (Makhlouf, 2014). Caution should
be taken while squeezing fiscal space, since economic performance uncertainties can exacerbate
the problem.
The above sentiment is shared by Mustapha and Prizzon (2018). The general assertion is that
raising debt has undisputed benefits, but poorly managed debt can become the nation’s curse for
future generations. An excessive amount of debt cunningly exacerbates uncertainty and retards
innovation and further investment. Overall, these have negative impacts on economic growth
(Mustapha & Prizzon, 2018). Therefore, increasing debt against warning signals of
unsustainability is imprudent.
For SSA countries, the road to sustainable recovery from unsustainable debt situations has a
number of feasible options. Growth must be complemented by matching institutional capacity;
well-designed and implementable macroeconomic policies; and functional, robust debt
management processes (Karangizi, 2019:14). Increasing tax bases is one of the feasible options
in mobilising domestic resources. Designing the policies and systems to tax the initially difficult-
to-tax sectors of the economy is critical for this objective. Carefully monitored accumulation of
liabilities by sub-governments and state-owned entities (SOEs) should not be left to chance
(Mbu, 2016).
54
There is a trade-off between privatising SOEs and using the proceeds to reduce debts, and
keeping them for their mandates, while stomaching the transfer of losses to the public balance
sheet. Sovereign wealth funds need clear performance goals and their monitoring should be
enforced to complement sovereign financial obligations. Innovative financing, such as pre-
financing agreements with multinational trading groups to extract minerals and develop
infrastructure, is a viable option for resource-rich countries (Karangizi, 2019). Specialised
functional debt-management units should be established by governments, following the Nigerian
approach. Development of domestic financial markets is the long-term exchange-rate hedging
strategy that SSA countries should consider (Mbu, 2016).
2.9 SSA and sovereign debt crisis
This happens when the country is unable to pay creditors timely or in full, due to either lack of
funds or repudiation tendencies. Fund shortages emanate from insufficient tax collection or bad
debt management; and repudiation is a function of debt repayment. Sovereign default is
described as the non-payment of principal or scheduled interest. It is also characterised by a debt
restructuring event, the end result being terms that are less favourable than the original loan
(Mukherjee, 2015). The newer terms often worry the investment community.
Debt crisis is not an instantaneous event, but takes time to ferment and signs become visible
prior to full eruption (Amadeo, 2019). The country would have had a choice to address the
situation, though there is tendency to procrastinate. In the worst case, the country defaults in
some or all of its outstanding loans. Apparently, sovereign creditors have limited recourse apart
from loan restructuring (Gulati, 2010). Sovereigns’ only collateral is the credibility derived from
credit risk ratings by third party agencies trusted by the market (Mukherjee, 2015).
The market is unforgiving to defaulters, sentiment takes time to become positive again (Luo &
Wang, 2018). Default history is used as a key determinant of willingness to pay—an important
aspect of credit risk valuation. In the absence of domestic alternatives, inability to access
international capital markets breeds ramifications. The sovereign loses an opportunity to provide
a benchmark for domestic entities to access the market (Willem, 2014). This and other calamities
disincentivise sovereign defaults (Roos, 2019).
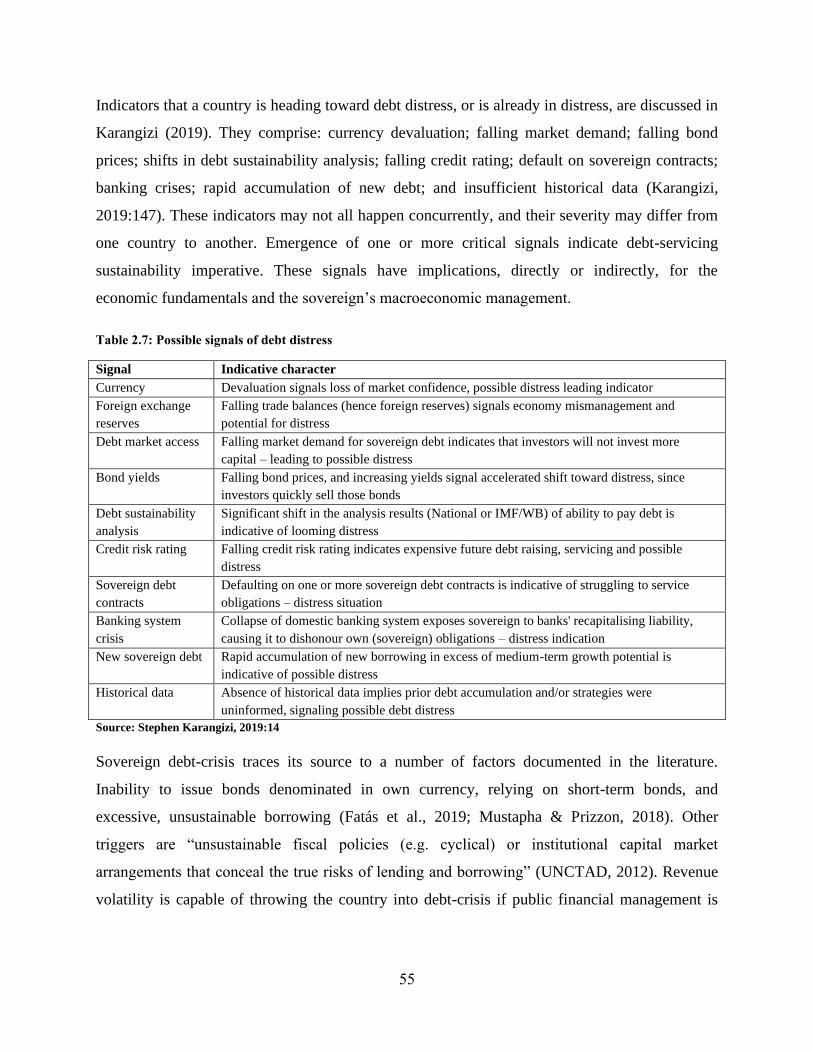
55
Indicators that a country is heading toward debt distress, or is already in distress, are discussed in
Karangizi (2019). They comprise: currency devaluation; falling market demand; falling bond
prices; shifts in debt sustainability analysis; falling credit rating; default on sovereign contracts;
banking crises; rapid accumulation of new debt; and insufficient historical data (Karangizi,
2019:147). These indicators may not all happen concurrently, and their severity may differ from
one country to another. Emergence of one or more critical signals indicate debt-servicing
sustainability imperative. These signals have implications, directly or indirectly, for the
economic fundamentals and the sovereign’s macroeconomic management.
Table 2.7: Possible signals of debt distress
Signal Indicative character
Currency Devaluation signals loss of market confidence, possible distress leading indicator
Foreign exchange
reserves
Falling trade balances (hence foreign reserves) signals economy mismanagement and
potential for distress
Debt market access Falling market demand for sovereign debt indicates that investors will not invest more
capital – leading to possible distress
Bond yields Falling bond prices, and increasing yields signal accelerated shift toward distress, since
investors quickly sell those bonds
Debt sustainability
analysis
Significant shift in the analysis results (National or IMF/WB) of ability to pay debt is
indicative of looming distress
Credit risk rating Falling credit risk rating indicates expensive future debt raising, servicing and possible
distress
Sovereign debt
contracts
Defaulting on one or more sovereign debt contracts is indicative of struggling to service
obligations – distress situation
Banking system
crisis
Collapse of domestic banking system exposes sovereign to banks' recapitalising liability,
causing it to dishonour own (sovereign) obligations – distress indication
New sovereign debt Rapid accumulation of new borrowing in excess of medium-term growth potential is
indicative of possible distress
Historical data Absence of historical data implies prior debt accumulation and/or strategies were
uninformed, signaling possible debt distress
Source: Stephen Karangizi, 2019:14
Sovereign debt-crisis traces its source to a number of factors documented in the literature.
Inability to issue bonds denominated in own currency, relying on short-term bonds, and
excessive, unsustainable borrowing (Fatás et al., 2019; Mustapha & Prizzon, 2018). Other
triggers are “unsustainable fiscal policies (e.g. cyclical) or institutional capital market
arrangements that conceal the true risks of lending and borrowing” (UNCTAD, 2012). Revenue
volatility is capable of throwing the country into debt-crisis if public financial management is
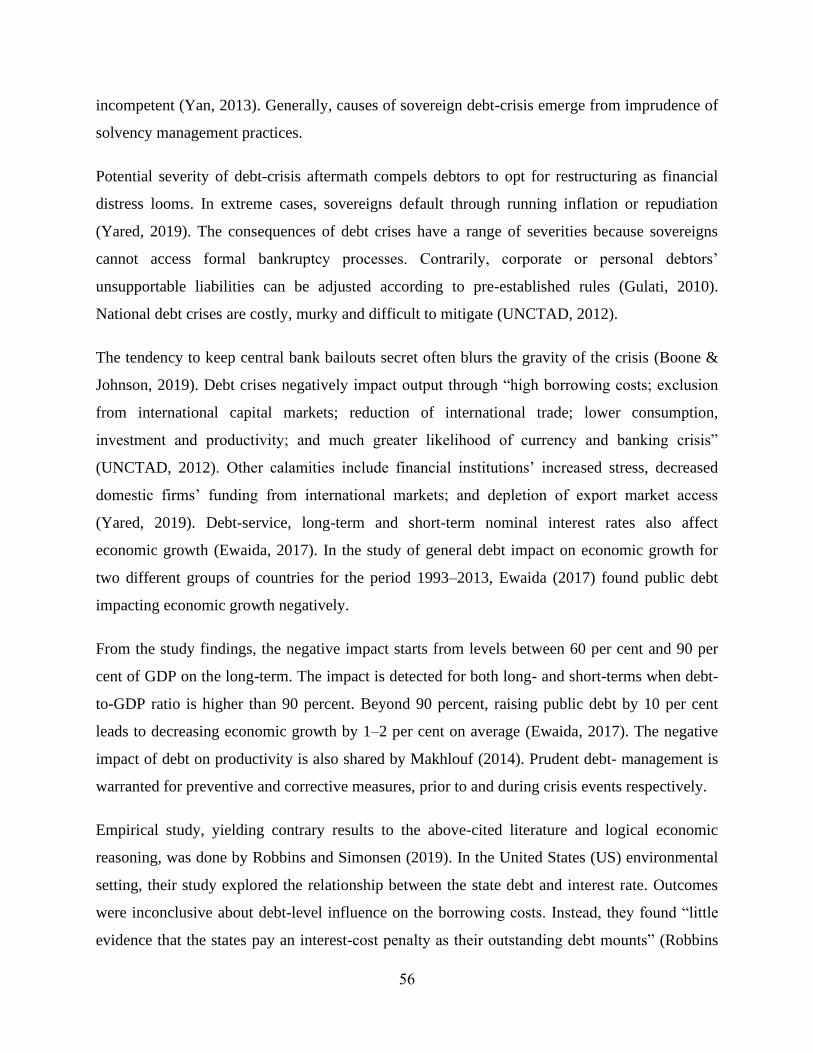
56
incompetent (Yan, 2013). Generally, causes of sovereign debt-crisis emerge from imprudence of
solvency management practices.
Potential severity of debt-crisis aftermath compels debtors to opt for restructuring as financial
distress looms. In extreme cases, sovereigns default through running inflation or repudiation
(Yared, 2019). The consequences of debt crises have a range of severities because sovereigns
cannot access formal bankruptcy processes. Contrarily, corporate or personal debtors’
unsupportable liabilities can be adjusted according to pre-established rules (Gulati, 2010).
National debt crises are costly, murky and difficult to mitigate (UNCTAD, 2012).
The tendency to keep central bank bailouts secret often blurs the gravity of the crisis (Boone &
Johnson, 2019). Debt crises negatively impact output through “high borrowing costs; exclusion
from international capital markets; reduction of international trade; lower consumption,
investment and productivity; and much greater likelihood of currency and banking crisis”
(UNCTAD, 2012). Other calamities include financial institutions’ increased stress, decreased
domestic firms’ funding from international markets; and depletion of export market access
(Yared, 2019). Debt-service, long-term and short-term nominal interest rates also affect
economic growth (Ewaida, 2017). In the study of general debt impact on economic growth for
two different groups of countries for the period 1993–2013, Ewaida (2017) found public debt
impacting economic growth negatively.
From the study findings, the negative impact starts from levels between 60 per cent and 90 per
cent of GDP on the long-term. The impact is detected for both long- and short-terms when debt-
to-GDP ratio is higher than 90 percent. Beyond 90 percent, raising public debt by 10 per cent
leads to decreasing economic growth by 1–2 per cent on average (Ewaida, 2017). The negative
impact of debt on productivity is also shared by Makhlouf (2014). Prudent debt- management is
warranted for preventive and corrective measures, prior to and during crisis events respectively.
Empirical study, yielding contrary results to the above-cited literature and logical economic
reasoning, was done by Robbins and Simonsen (2019). In the United States (US) environmental
setting, their study explored the relationship between the state debt and interest rate. Outcomes
were inconclusive about debt-level influence on the borrowing costs. Instead, they found “little
evidence that the states pay an interest-cost penalty as their outstanding debt mounts” (Robbins
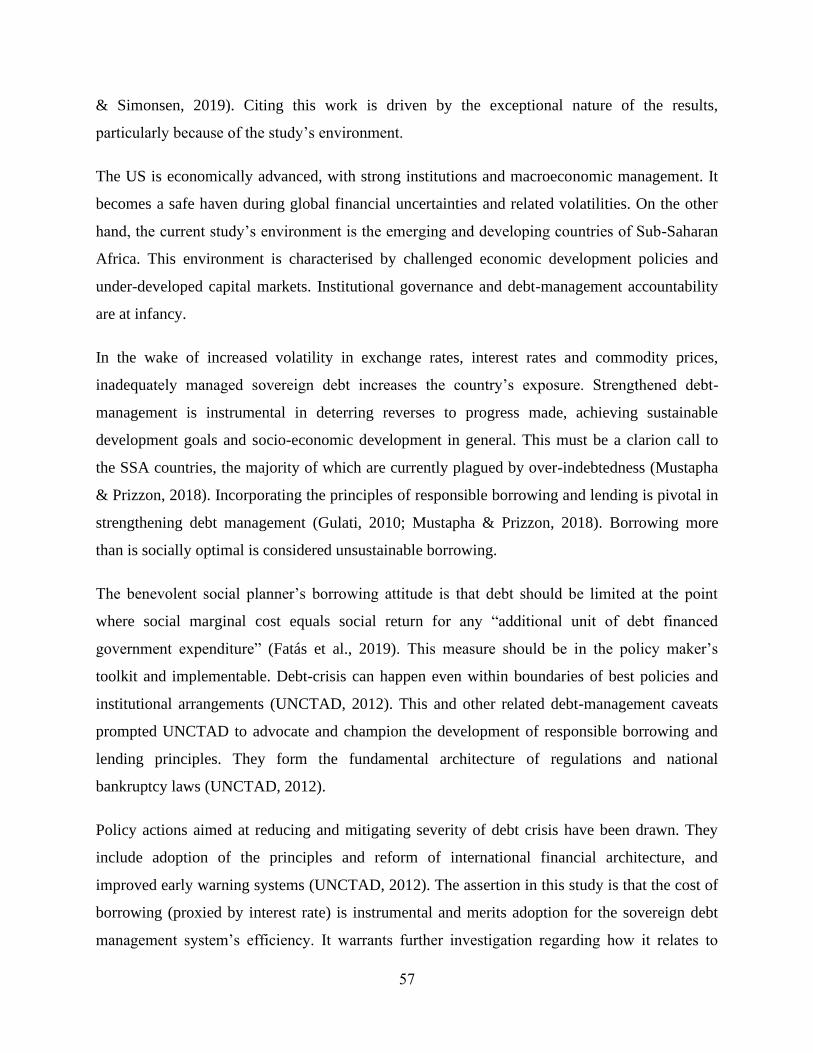
57
& Simonsen, 2019). Citing this work is driven by the exceptional nature of the results,
particularly because of the study’s environment.
The US is economically advanced, with strong institutions and macroeconomic management. It
becomes a safe haven during global financial uncertainties and related volatilities. On the other
hand, the current study’s environment is the emerging and developing countries of Sub-Saharan
Africa. This environment is characterised by challenged economic development policies and
under-developed capital markets. Institutional governance and debt-management accountability
are at infancy.
In the wake of increased volatility in exchange rates, interest rates and commodity prices,
inadequately managed sovereign debt increases the country’s exposure. Strengthened debt-
management is instrumental in deterring reverses to progress made, achieving sustainable
development goals and socio-economic development in general. This must be a clarion call to
the SSA countries, the majority of which are currently plagued by over-indebtedness (Mustapha
& Prizzon, 2018). Incorporating the principles of responsible borrowing and lending is pivotal in
strengthening debt management (Gulati, 2010; Mustapha & Prizzon, 2018). Borrowing more
than is socially optimal is considered unsustainable borrowing.
The benevolent social planner’s borrowing attitude is that debt should be limited at the point
where social marginal cost equals social return for any “additional unit of debt financed
government expenditure” (Fatás et al., 2019). This measure should be in the policy maker’s
toolkit and implementable. Debt-crisis can happen even within boundaries of best policies and
institutional arrangements (UNCTAD, 2012). This and other related debt-management caveats
prompted UNCTAD to advocate and champion the development of responsible borrowing and
lending principles. They form the fundamental architecture of regulations and national
bankruptcy laws (UNCTAD, 2012).
Policy actions aimed at reducing and mitigating severity of debt crisis have been drawn. They
include adoption of the principles and reform of international financial architecture, and
improved early warning systems (UNCTAD, 2012). The assertion in this study is that the cost of
borrowing (proxied by interest rate) is instrumental and merits adoption for the sovereign debt
management system’s efficiency. It warrants further investigation regarding how it relates to
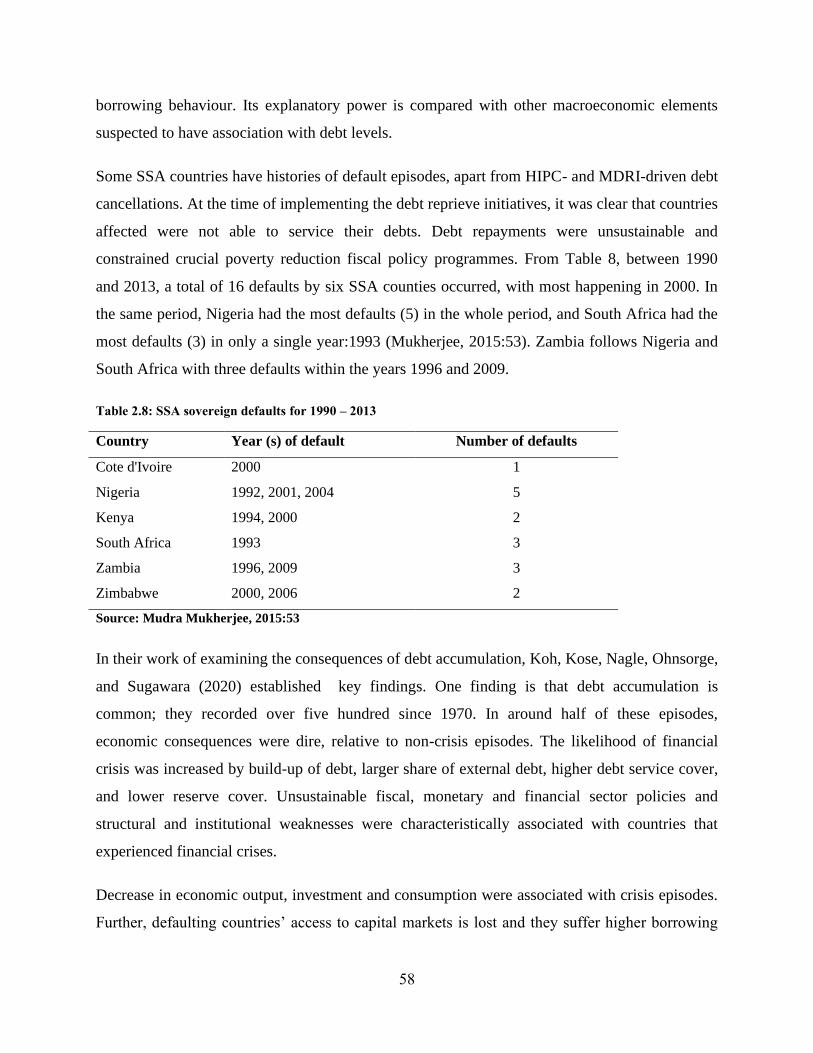
58
borrowing behaviour. Its explanatory power is compared with other macroeconomic elements
suspected to have association with debt levels.
Some SSA countries have histories of default episodes, apart from HIPC- and MDRI-driven debt
cancellations. At the time of implementing the debt reprieve initiatives, it was clear that countries
affected were not able to service their debts. Debt repayments were unsustainable and
constrained crucial poverty reduction fiscal policy programmes. From Table 8, between 1990
and 2013, a total of 16 defaults by six SSA counties occurred, with most happening in 2000. In
the same period, Nigeria had the most defaults (5) in the whole period, and South Africa had the
most defaults (3) in only a single year:1993 (Mukherjee, 2015:53). Zambia follows Nigeria and
South Africa with three defaults within the years 1996 and 2009.
Table 2.8: SSA sovereign defaults for 1990 – 2013
Country Year (s) of default Number of defaults
Cote d'Ivoire 2000 1
Nigeria 1992, 2001, 2004 5
Kenya 1994, 2000 2
South Africa 1993 3
Zambia 1996, 2009 3
Zimbabwe 2000, 2006 2
Source: Mudra Mukherjee, 2015:53
In their work of examining the consequences of debt accumulation, Koh, Kose, Nagle, Ohnsorge,
and Sugawara (2020) established key findings. One finding is that debt accumulation is
common; they recorded over five hundred since 1970. In around half of these episodes,
economic consequences were dire, relative to non-crisis episodes. The likelihood of financial
crisis was increased by build-up of debt, larger share of external debt, higher debt service cover,
and lower reserve cover. Unsustainable fiscal, monetary and financial sector policies and
structural and institutional weaknesses were characteristically associated with countries that
experienced financial crises.
Decrease in economic output, investment and consumption were associated with crisis episodes.
Further, defaulting countries’ access to capital markets is lost and they suffer higher borrowing
59
costs. Vicious cycle of indebtedness developed as they sought other means of raising debt,
including bilateral and other private lending arrangements. Typically, debtors only get
disillusioned by what seems like debt reprieve, yet the burden does not go away. Loss of national
assets is possible with aggressive lenders who have the capacity to confiscate the country’s
foreign assets.
The crisis can be avoided through renegotiation and debt restructuring, banking on good faith
from both sides of the deal. Debt restructuring is expensive due to lengthy litigation and
prolonged interest-rate revisions—apart from being unpredictable and disorderly (Gulati, 2010).
Restructuring is the government’s first reaction as repayments become unsustainable due to
shortage of funds. Debt sustainability is measured by the ratio of debt to a country’s gross
domestic product (GDP)—with higher ratios warranting policy makers’ attention. Creditors’
reaction to an unsustainably high debt-to-GDP ratio is to seek a higher interest rate, fearing the
borrower’s increased default potential.
2.10 Qualitative sovereign borrowing determinants and cost of debt
It is acknowledged in this study that sovereign borrowing choice can be determined by
quantitative and qualitative factors. Human elements are instrumental in the qualitative
determinants. The influence of these factors on decision makers does not have measurable
quantitative value. Their characteristic is subjectivity and they are seldom premised on
quantitative logic. They are included because their contribution to decision making is undeniable,
though the study’s focus is on the quantitative factors.
There is an interesting proximity to what is proposed in the works of Dancho (2015) and
Mustapha et al. (Prizzon & Greenhill, 2017). Though Dancho’s work is municipal-related
(Bulgaria, City of Burgas), it shares important insights. Financing alternatives available to the
municipality were its own resources; bank loans; bond issues; pooling and revolving schemes.
Factors found to influence choice were: costs of funding; level of financial infrastructure;
regulative conditions; debt-risk; level of decentralisation; and opportunities for generating
revenues (Dancho, 2015). No level of importance has been attached to any and their listing
follows no order.
60
There are other factors discussed in the literature, albeit scantily. They include transaction costs,
diplomatic relations with DFI home country or influential shareholder country. Others are
positive externalities and other unrelated benefits, e.g. trade relations, domestic and foreign
political reasons. Economic and finance related factors also include revenue volatility; debt-
service and financing choices; economic fundamentals and lenders’ qualifying criteria. Another
important factor to note is the lending relations (for example, repeat application, revolving loan,
successful repayment).
Borrowing from the same lender repeatedly improves the relationship and cost of borrowing
(Bharath, Dahiya, Saunders, & Srinivasan, 2011). In the Malaysian study of 900 listed firms
using 1990–2010 panel data, Zulkhibri (2015) made discoveries. Study findings show that “firm-
specific characteristics” vitally influence the financing choice (Zulkhibri, 2015). Interest rate is
also identified as playing a pivotal role in constraining firms’ access to external finance, with
premium pricing experienced by financially constrained firms.
Theoretical economic factors attesting to the cost-of-debt captured the attention of this paper.
Cost-of-debt is used for setting loan repayment instalment amounts. These amounts are usually
fixed and must be paid periodically, irrespective of state of the economy. In other words, the
sovereign borrower is compelled to keep paying the same amount to service the loan. And, the
amounts must be paid timely. Paying late categorises the country as defaulting.
During good days when the economy is doing well, and the state could tax it accordingly,
everyone gets better off. In the direct opposite situations, servicing the debt by the borrower
becomes rocky. In moderate circumstances, debt repayments impose cutting domestic
consumption (Mankiw, 2012). Decreasing domestic consumption impedes economic growth,
breeding other socio-economic ills from unemployment to insufficient service delivery and
instability.
Highly indebted states struggle to raise further debt due to less favourable market sentiment and
unsustainably high interest rates—set by lenders out of fear that the state will default. Less
moderate situations—financial distress—pushes the parties into restructurings. Debt
restructuring is costly for both creditors and borrowers. Costs can be extreme in the absence of
good faith, especially from borrowers. This may be incentivised by unfair practices and
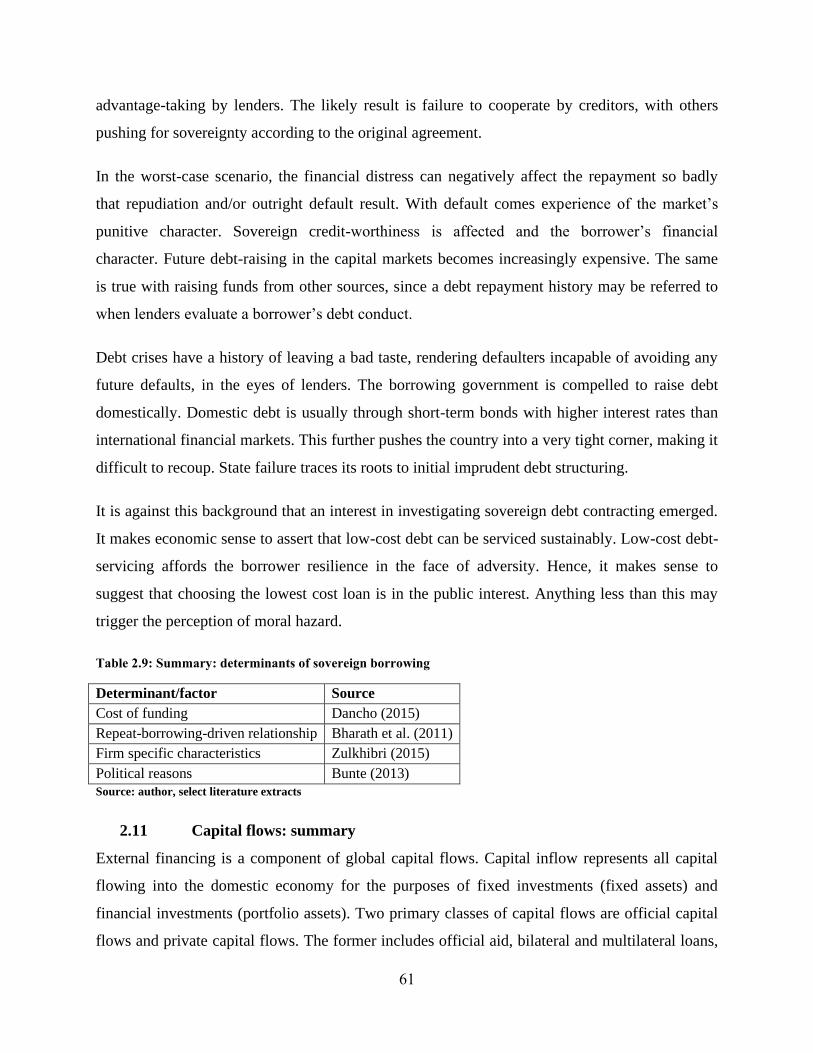
61
advantage-taking by lenders. The likely result is failure to cooperate by creditors, with others
pushing for sovereignty according to the original agreement.
In the worst-case scenario, the financial distress can negatively affect the repayment so badly
that repudiation and/or outright default result. With default comes experience of the market’s
punitive character. Sovereign credit-worthiness is affected and the borrower’s financial
character. Future debt-raising in the capital markets becomes increasingly expensive. The same
is true with raising funds from other sources, since a debt repayment history may be referred to
when lenders evaluate a borrower’s debt conduct.
Debt crises have a history of leaving a bad taste, rendering defaulters incapable of avoiding any
future defaults, in the eyes of lenders. The borrowing government is compelled to raise debt
domestically. Domestic debt is usually through short-term bonds with higher interest rates than
international financial markets. This further pushes the country into a very tight corner, making it
difficult to recoup. State failure traces its roots to initial imprudent debt structuring.
It is against this background that an interest in investigating sovereign debt contracting emerged.
It makes economic sense to assert that low-cost debt can be serviced sustainably. Low-cost debt-
servicing affords the borrower resilience in the face of adversity. Hence, it makes sense to
suggest that choosing the lowest cost loan is in the public interest. Anything less than this may
trigger the perception of moral hazard.
Table 2.9: Summary: determinants of sovereign borrowing
Determinant/factor Source
Cost of funding Dancho (2015)
Repeat-borrowing-driven relationship Bharath et al. (2011)
Firm specific characteristics Zulkhibri (2015)
Political reasons Bunte (2013) Source: author, select literature extracts
2.11 Capital flows: summary
External financing is a component of global capital flows. Capital inflow represents all capital
flowing into the domestic economy for the purposes of fixed investments (fixed assets) and
financial investments (portfolio assets). Two primary classes of capital flows are official capital
flows and private capital flows. The former includes official aid, bilateral and multilateral loans,
62
and private loans. On the other hand, private capital flows take the form of fixed and portfolio
investments (Frederick C v n Fourie, 2008: 101–104; Schiller, 1991:445–447).
While the reasoning may be slightly different for official (public), global capital flow is
influenced by owners’ desire to get highest possible rates of return on investments—real or
financial. So, differentials in the economic fundamentals are responsible for pull and push
factors. This the sentiment shared in the discussions by (Gossel & Biekpe, 2017; Kodongo,
2011). Economic fundamentals are complemented by institutions and political (therefore policy)
certainty (Fourie, 2008; Gossel, 2017). Factors influencing capital flows are documented and
modelled across research and scholarship.
Frederick C v n Fourie (2008:102) identified determinants of capital inflows. His model included
relative interest rates and relative rates of return (on financial and real investment respectively),
the exchange rate, and economic and political expectations. According to his model, interest
rates differentials and relative rates of return have positive effect on the capital inflow while
exchange rate moves in the opposite direction. While economic and political uncertainties are not
given the definitive impact from his model, Sean Joss Gossel (2017) found the negative impact
of the latter. Former’s impact is shared in the discussions about economic fundamentals such as
in (Holmes & Smyth, 1977; Jeanne, 2012; Jiang et al., 2019; Mustapha, 2017; Salahuddin &
Islam, 2008; Shibuya, 1999; Wang, Chung, & Hwang, 2010).
Shibuya (1999)’s model of international capital flows identified six basic factors capable of
triggering capital flows reversals. These determinants are expected exchange rate change,
expected productivity change, the world interest rate, exchange rate risk, productivity risk, and
the risk aversion of international investors. Arbitrage presence in the model has the effect of
rendering the interest rate differential impact on the capital flows inconsistent as initially
modelled in (Holmes & Smyth, 1977). In their two nations model, excess saving and investment
behaviour in the domestic and foreign countries are responsible for all capital flows. They
concluded that a “theoretical need for a capital flow function, in order to solve for capital flows,
is completely satisfied by the alternative procedure of explicitly stating the arbitrage equation in
securities” (Holmes & Smyth, 1977:107).
63
Democratic capital in the sub-Saharan Africa region was found to be positively correlated to
capital flows in ( Gossel, 2017). In a study of forty-two SSA countries for 1972-2014 period, for
more democratic states, foreign direct investment (FDI) responded positively to recent
accumulation of democratic capital. FDI response is the same for durable accumulation of
democratic capital in less democratic states, and political repression for more democratic
countries. Results, however, were “more susceptible to socio-cultural variation, particularly
among the European heritage SSA countries” (Gossel, 2017:1055). Nevertheless, except for five
resource rich countries, FDI flow to SSA is among the lowest globally (Gossel, 2017:1054).
Salahuddin and Islam (2008) further confirmed that traditional capital flow determinants such as
growth, domestic savings, and trade openness affect investment decisions. Effective utilization of
official aid was also found to have positive effect on the investment. On the other hand, the
effect of real interest rate on investment decision was not established. Jiang, Chen and Wang
(2019) investigated cross-border capital flows in China’s eight coastal regions. Their study
identified interest rate spread, exchange rate expectation, real estate price change, and change in
securities’ market value as determinants of cross-border capital flows.
Capital flows across nations today more than before in the face of liberalizations and increased
global trade. Theoretically, the flow should be coming from area of high concentration to that of
low concentration. This simplified assumption does not easily hold in the real world
characterized by myriad factors – economic, political, social, etc. Economic and political factors
featured prominently in the documented literature. Number of models depicting the determinants
of capital flows have also been developed as discussed above.
Summarily, economic fundamentals and political factors are found to influence capital in and
outflows in SSA countries. In the positive economic climate, the impact of sovereign loans can
be amplified by complimentary positive effect of other capital inflows. In the regime of wanting
economic performance and institutional effectiveness, borrowed funds are likely to have less
impact. In the unfortunate case, the proceeds from capitalized investment may not meet debt
service requirements. Therefore, borrowing funds should be complemented by positive, enticing,
economic fundamentals and strong institutions.
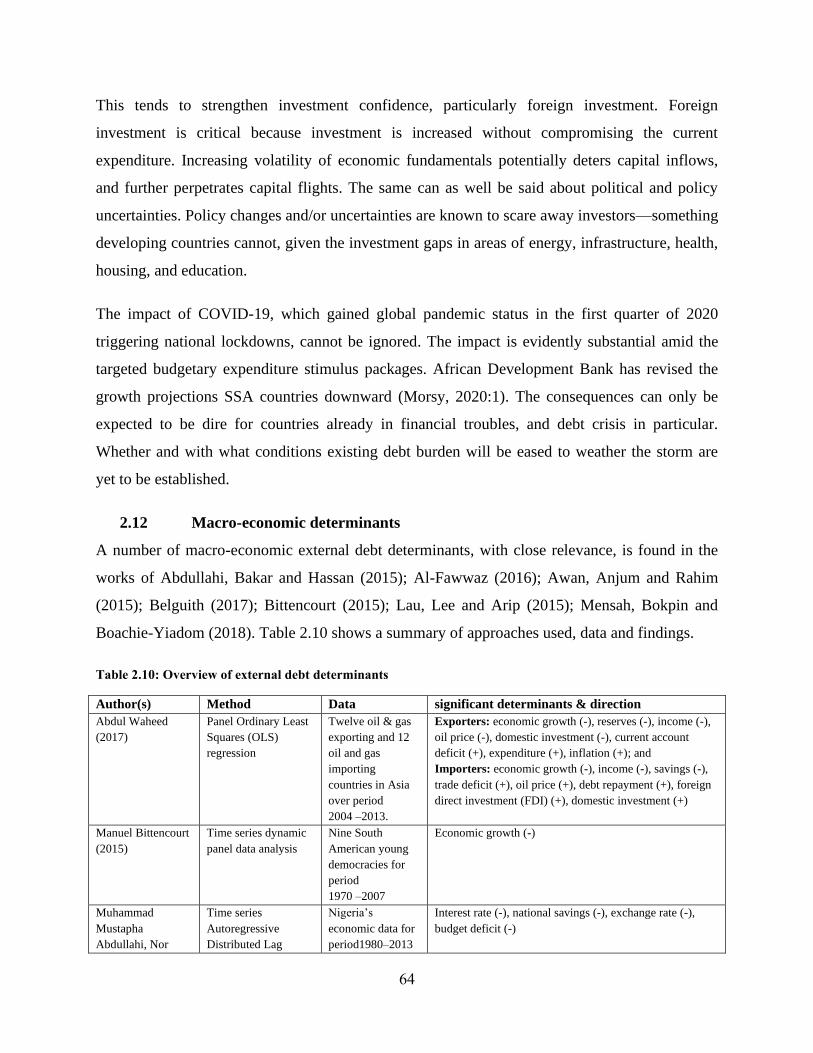
64
This tends to strengthen investment confidence, particularly foreign investment. Foreign
investment is critical because investment is increased without compromising the current
expenditure. Increasing volatility of economic fundamentals potentially deters capital inflows,
and further perpetrates capital flights. The same can as well be said about political and policy
uncertainties. Policy changes and/or uncertainties are known to scare away investors—something
developing countries cannot, given the investment gaps in areas of energy, infrastructure, health,
housing, and education.
The impact of COVID-19, which gained global pandemic status in the first quarter of 2020
triggering national lockdowns, cannot be ignored. The impact is evidently substantial amid the
targeted budgetary expenditure stimulus packages. African Development Bank has revised the
growth projections SSA countries downward (Morsy, 2020:1). The consequences can only be
expected to be dire for countries already in financial troubles, and debt crisis in particular.
Whether and with what conditions existing debt burden will be eased to weather the storm are
yet to be established.
2.12 Macro-economic determinants
A number of macro-economic external debt determinants, with close relevance, is found in the
works of Abdullahi, Bakar and Hassan (2015); Al-Fawwaz (2016); Awan, Anjum and Rahim
(2015); Belguith (2017); Bittencourt (2015); Lau, Lee and Arip (2015); Mensah, Bokpin and
Boachie-Yiadom (2018). Table 2.10 shows a summary of approaches used, data and findings.
Table 2.10: Overview of external debt determinants
Author(s) Method Data significant determinants & direction
Abdul Waheed
(2017)
Panel Ordinary Least
Squares (OLS)
regression
Twelve oil & gas
exporting and 12
oil and gas
importing
countries in Asia
over period
2004 –2013.
Exporters: economic growth (-), reserves (-), income (-),
oil price (-), domestic investment (-), current account
deficit (+), expenditure (+), inflation (+); and
Importers: economic growth (-), income (-), savings (-),
trade deficit (+), oil price (+), debt repayment (+), foreign
direct investment (FDI) (+), domestic investment (+)
Manuel Bittencourt
(2015)
Time series dynamic
panel data analysis
Nine South
American young
democracies for
period
1970 –2007
Economic growth (-)
Muhammad
Mustapha
Abdullahi, Nor
Time series
Autoregressive
Distributed Lag
Nigeria’s
economic data for
period1980–2013
Interest rate (-), national savings (-), exchange rate (-),
budget deficit (-)
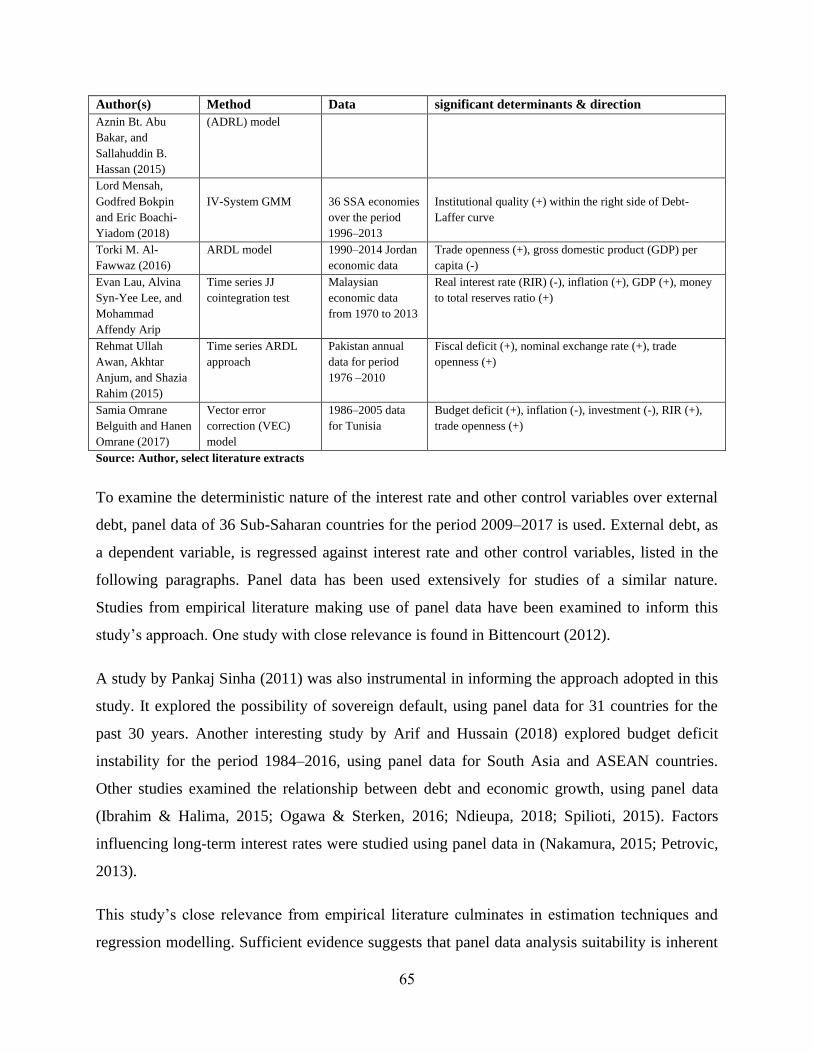
65
Author(s) Method Data significant determinants & direction
Aznin Bt. Abu
Bakar, and
Sallahuddin B.
Hassan (2015)
(ADRL) model
Lord Mensah,
Godfred Bokpin
and Eric Boachi-
Yiadom (2018)
IV-System GMM
36 SSA economies
over the period
1996–2013
Institutional quality (+) within the right side of Debt-
Laffer curve
Torki M. Al-
Fawwaz (2016)
ARDL model 1990–2014 Jordan
economic data
Trade openness (+), gross domestic product (GDP) per
capita (-)
Evan Lau, Alvina
Syn-Yee Lee, and
Mohammad
Affendy Arip
Time series JJ
cointegration test
Malaysian
economic data
from 1970 to 2013
Real interest rate (RIR) (-), inflation (+), GDP (+), money
to total reserves ratio (+)
Rehmat Ullah
Awan, Akhtar
Anjum, and Shazia
Rahim (2015)
Time series ARDL
approach
Pakistan annual
data for period
1976 –2010
Fiscal deficit (+), nominal exchange rate (+), trade
openness (+)
Samia Omrane
Belguith and Hanen
Omrane (2017)
Vector error
correction (VEC)
model
1986–2005 data
for Tunisia
Budget deficit (+), inflation (-), investment (-), RIR (+),
trade openness (+)
Source: Author, select literature extracts
To examine the deterministic nature of the interest rate and other control variables over external
debt, panel data of 36 Sub-Saharan countries for the period 2009–2017 is used. External debt, as
a dependent variable, is regressed against interest rate and other control variables, listed in the
following paragraphs. Panel data has been used extensively for studies of a similar nature.
Studies from empirical literature making use of panel data have been examined to inform this
study’s approach. One study with close relevance is found in Bittencourt (2012).
A study by Pankaj Sinha (2011) was also instrumental in informing the approach adopted in this
study. It explored the possibility of sovereign default, using panel data for 31 countries for the
past 30 years. Another interesting study by Arif and Hussain (2018) explored budget deficit
instability for the period 1984–2016, using panel data for South Asia and ASEAN countries.
Other studies examined the relationship between debt and economic growth, using panel data
(Ibrahim & Halima, 2015; Ogawa & Sterken, 2016; Ndieupa, 2018; Spilioti, 2015). Factors
influencing long-term interest rates were studied using panel data in (Nakamura, 2015; Petrovic,
2013).
This study’s close relevance from empirical literature culminates in estimation techniques and
regression modelling. Sufficient evidence suggests that panel data analysis suitability is inherent
66
in the advantages it has over both time-series and cross-sectional data analysis. The study seeks
to establish the relationship between external debt and control variables, with focus being on the
interest rate. That creditors demand better returns is a widely theorised and researched
phenomenon in finance and investment (Abor, 2011; Paudyn, 2014; Rao, 2003; Robbins &
Simonsen, 2019; Sercu, 2000). Increased cost of borrowing (to borrower) represents the
incentive for lenders to extend more credit.
On the other hand, increased cost of borrowing discourages extended borrowing (Mishkin,
2016). This argument forms the premise of this study’s expected negative relationship between
external debt and interest rates charged by all creditors. Indeed, managing the cost of borrowing
is one of the positive tenets of prudent debt management (Eichengreen et al., 2019; Spilioti,
2015; Zampolli, 2013). Macro-economic variables used as control variables in this study are
discussed below. These selected explanatory variables are gross national income (GNI); exports;
imports; foreign direct investment (FDI); international reserves; debt-service- to-GNI ratio;
interest arrears on long-term debt; short-term-to-external-debt-stocks ratio; and reserves-to-
external debt-stocks ratio.
Gross national income (GNI)
The impact of external debt on economic growth has caught the attention of scholars, including
the work of Ali and Mustafa (2012). In their study of the impact of external debt on economic
growth in Pakistan, over the 1970–2010 period, they found that external debt had a negative
impact on economic growth (Ali, 2012). The negative relationship of external debt is found in
other works, albeit with benchmark debt-levels in some, such as Senadza and Fiagbe, (2017) and
Buthelezi (2018). Reverse causality, and the association of GNI with external debt in particular,
is not an absolute impossibility. It is therefore proposed that GNI is associated with external
debt.
Exports
A healthy export base facilitates the flow of foreign currency into the domestic economy.
Foreign currency also facilitates the repayment of external liabilities, since the majority are
denominated in foreign currencies. Exports also increase national income, building healthy
balance sheets and improving investor sentiment, despite exposure to market fluctuations, as
67
widely discussed in Gevorkyan and Kvangraven, (2016) and Kodongo (2011). Foreign currency
mitigates the severe effects of currency devaluation, inevitably incentivising external debt
funding. It is, therefore, proposed that exports are associated with external debt.
Imports
Imports, in the form of investment inputs and machinery, are instrumental in domestic economic
growth. External debt can be used to import machinery and equipment unavailable in the
domestic market, thus creating a need for investment. Imports do erode foreign currency
reserves, potentially impeding the country’s ability to service foreign currency denominated
debts. Imports largely play the role opposite that of exports (Chee et al., 2015; Mishkin, 2016).
So, it is proposed here that imports are associated with external debt.
Foreign direct investment (FDI)
FDI encourages economic growth (Behname, 2012). Economic growth is also a function of
socio-economic factors, including national income (Saini, Madan & Batra, 2011). FDI is also
instrumental in mobilizing foreign currency when production is for the export market, as
discussed in Addison, Pikkarainen, Rönkkö and Tarp (2017). With a strong FDI base, a country
can afford to service foreign-currency-denominated debt. Potential debt-servicing sustainability
increases the appetite for external debt. From prior discussions, FDI and external debt
individually are associated with economic growth. It is postulated here that FDI is associated
with external debt.
Primary income on FDI
Primary income on FDI increases national income and economic growth. With a healthy primary
income from FDI, a sovereign can raise liabilities without increasing exposure to the risk of
inability to pay interest or capital. Income from FDI is directly proportional to the amount of FDI
in the economy. The relationship between FDI and economic growth has been empirically
discussed in Behname (2012) and Saini et al. (2011). With healthy growth, a country is enticed
into acquiring debt by positive market sentiments (Cantor, 2015). As such, during times of solid
primary income from FDI, the country can be tempted to raise external loan funds. So, it is
proposed that there is an association between primary FDI income and external debt.
68
International reserves
The availability of international reserves may afford the country the ability to service external
liabilities, without worrying about exposure to volatilities in the international finance markets
(Mishkin, 2016). In their open-economy model, supported by empirical panel data from Pen
World Trade, Fukuda and Kon (2010) found supporting evidence. They discovered that
increasing foreign exchange increases both liquidity and total debt, but shortens overall debt
maturity (Fukuda & Kon, 2010). Their additional finding was that increasing foreign exchange
could facilitate a decrease in domestic consumption while enhancing investment and economic
growth. Against this background, it is postulated that international reserves are associated with
external debt.
Debt service to GNI ratio
Healthy debt-to-GNI ratio indicates to investors that the country is not at risk of debt-distress and
can service any debt comfortably. A smaller ratio is healthy, since debt-service represents cash
outflow, rendering a country attractive to international investors. The literature further
documents positive (Spilioti, 2015) and negative (Senadza & Fiagbe, 2017; Buthelezi, 2018)
relationships between debt and gross domestic product (GDP). Healthy GDP growth and
consequent national income (GNI) entice increasing debt (Mankiw, 2012). So, it is proposed that
debt-to-GNI ratio is associated with external debt. Increasing debt-service-to-GNI ratio implies
increasing indebtedness, and potential distress.
Interest arrears on long-term debt
Creditors may have concerns as interest arrears on long-term debt perpetually increase. This
threat may be premised on the fact that increasing arrears indicate debt-distress. Arrears not only
potentially constrain domestic spending in favour of paying off the arrears, but also attract the
imposition of austerity as a condition for further credit extension by the lender community
(Block-Lieb, 2015). Debt does not have a positive influence on long-term growth (Pato, 2019).
Accelerating the decrease in arrears on long-term debt indicates to creditors that the country’s
economic health is improving. Raising more external loans may not then be extremely
constrained. So, it is postulated that interest arrears on long-term debt have an association with
external debt.
69
Short-term borrowing to external-debt ratio
Increasing the short-term-to-external-debt ratio implies that the country is increasing short-term
debt in its total debt portfolio. Increasing short-term debt has the effect of limiting project
financing. Short-term is, therefore, not instrumental for development financing, as discussed in
Alagidede (2012) and Ocran (2012). Both the increase and decrease of short-term debt has an
impact on the amount of external debt raised (Mustapha & Prizzon, 2018), so, it is proposed that
the short-term-to-external-debt-stocks ratio is associated with external debt.
Reserves to external debt-stocks ratio
Increasing reserves-to-external-debt-stocks ratio indicates to international investors that the
country’s ability to honour foreign currency denominated obligations is not questionable.
Foreign reserve muscle can incentivise a sovereign to incur more debt for development projects,
encouraging economic growth. Thus, foreign reserves represent foreign assets’ buying power
(Asteriou et al., 2016). Importing important plant, equipment and machinery for critical
developmental projects is indispensable (Mishkin, 2016). It is, therefore, proposed that reserves-
to-external-debt-stocks ratio is associated with external debt. The anticipated relationship is as
depicted in Figure 2.5.
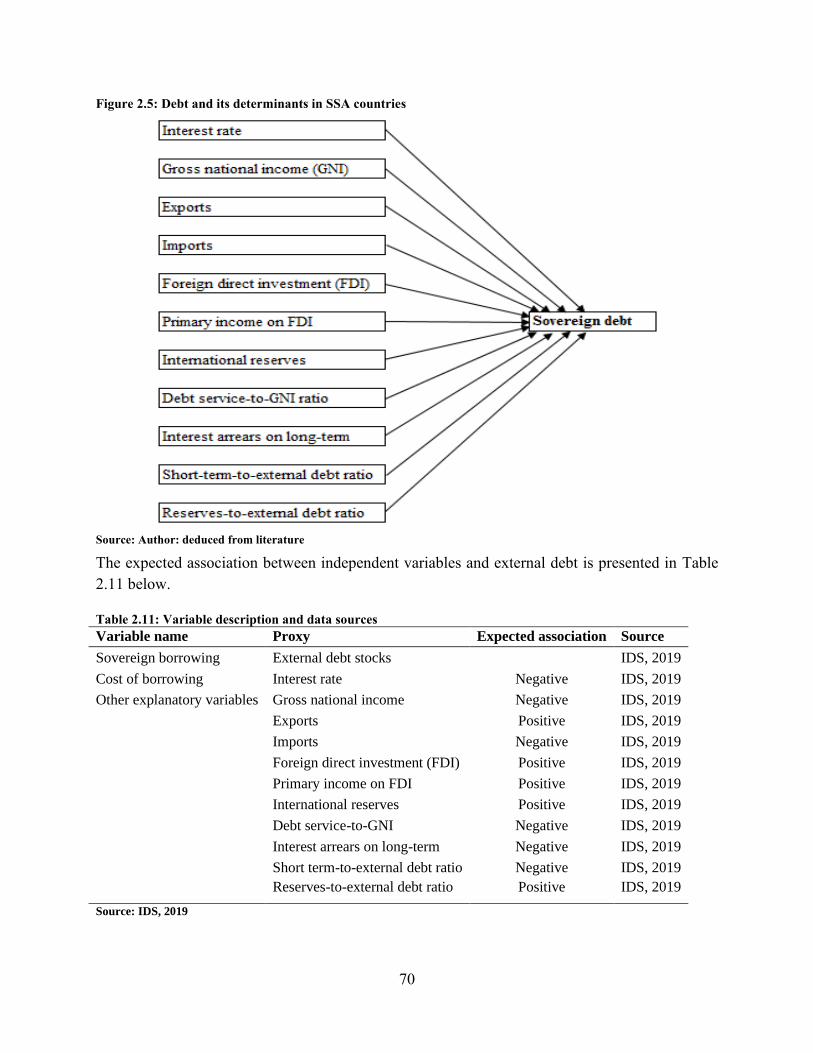
70
Figure 2.5: Debt and its determinants in SSA countries
Source: Author: deduced from literature
The expected association between independent variables and external debt is presented in Table
2.11 below.
Table 2.11: Variable description and data sources
Variable name Proxy Expected association Source
Sovereign borrowing External debt stocks IDS, 2019
Cost of borrowing Interest rate Negative IDS, 2019
Other explanatory variables Gross national income Negative IDS, 2019
Exports Positive IDS, 2019
Imports Negative IDS, 2019
Foreign direct investment (FDI) Positive IDS, 2019
Primary income on FDI Positive IDS, 2019
International reserves Positive IDS, 2019
Debt service-to-GNI Negative IDS, 2019
Interest arrears on long-term Negative IDS, 2019
Short term-to-external debt ratio Negative IDS, 2019
Reserves-to-external debt ratio Positive IDS, 2019
Source: IDS, 2019
71
2.13 Conclusion
Traditionally, taxation is the source of funding for government programmes. When taxation falls
short of budget, borrowing becomes inevitable. The need for external financing is known to be
driven by the desire to maintain or increase government spending without increasing taxes
(McConnell, Brue & Flynn, 2012). Governments borrow from domestic and international capital
markets and from official creditors. Donors also play an important role in the developing
countries’ development programmes. Mobilization of domestic resources, including tax
expansion, plays a critical role in breaking developing countries’ cycles of dependence on
donations and foreign loans.
Accessing capital markets is a function of investigating creditworthiness established by
independent, market-trusted credit-worthiness rating agencies: Standard and Poor’s, Moody
Investor Services, and Fitch Ratings occupy 95% of the global market. Credit ratings have two
major categories—investment and sub-investment grades. Sovereign credit rating is affected by
macro-economic management, strength of local institutions, and governance. Countries with low
ratings obtain debt expensively, compared to their better-rated counterparts. Sub-Saharan African
(SSA) countries have a commendable accumulation of debt, and their Eurobonds have mostly
been oversubscribed, despite their low credit ratings by Standard and Poor’s.
Apart from international capital markets, sovereigns can raise long-tenure debt from official
creditors—the World Bank (WB) and affiliates, regional development banks and sovereign
creditors. Loan disbursement by multilateral creditors is influenced by their mandates; for
example, WB loans are instrumental in poverty reduction and development in developing
countries. Official creditors offer key advantages to developing countries, including concessions
and grants with little or no influence from market sentiment. For this reason, their loans have
conditions attached: rule of law; sound macroeconomic management; capacitated domestic
institutions; and international political relations. The International Monetary Fund (IMF)
intervention loans, during sovereign budget deficit challenges, are accompanied by conditional
austerity measures imposed on the borrower. Development finance institutions (DFIs) raise funds
from capital markets cheaply because of their favourable credit ratings and use them for
extending loans.
72
High debt levels (measured by debt-to-GDP ratio) expose the borrower to high risk of distress
and defaults in the worst case. Therefore, prudent sovereign debt management cannot be left to
chance. Beyond HIPC and MDRI initiatives, SSA recipient countries have increasingly become
over-indebted, as evidenced by some countries being at low risk of distress and others already in
debt distress. Domestic capital markets in the region are under-developed and shallow, making
them unfit as alternatives. SSA needs infrastructure development and poverty reduction funding,
in the pursuit of Sustainable Development Goals (SDGs).
However, SSA countries incur expensive debt in the international financial markets. Compared
with their peers—Latin America and Caribbean (LA&C), South Asia (SA), and East Asia and
Pacific (EA&P)—SSA Eurobonds give the highest yields. Debt is increasing relative to national
income in SSA and LA&C, but the situation is different in SA and EA&P. Unsustainable debt
and increasing debt-distress among a number of SSA countries caught the attention of this study.
Getting back to sustainability, SSA countries must complement growth with institutional
capacity, sound macro-economic policies, and robust debt-management programmes.
Debt-crisis ferments over time, with cautioning signals to respond to. Indicators of looming or
existing debt-distress are: currency devaluation; falling foreign reserves; reduced debt market
access; falling bond prices; significant shift in sustainability analysis results; worsening
creditworthiness risk rating; defaulting on sovereign debt contracts; banking system crises; new
debt accumulation; and insufficient historical data. Inability to issue domestic currency
denominated bonds; reliance on short-term bonds; and excessive unsustainable borrowing lead to
debt crisis. Defaults take the form of restructuring, running inflation, repudiation and
expropriation of project assets. Debt-crisis has a negative impact on a country, on both economic
and social fronts, through decreasing productivity and the nation’s overall wellbeing.
Qualitative determinants of sovereign borrowing are: regulative conditions; level of
decentralisation; lender-borrower relations; political factors; revenue-generating opportunities;
and level of financial infrastructure. Quantitative determinants are: cost of funding; debt risk;
transaction costs; debt costs; and financing choices. This study’s proposed determinants are:
gross national income (GNI); exports; imports; foreign direct investment (FDI); primary income
on FDI; international reserves; debt service; interest arrears on long-term debt; and short-term
73
debt. Cost of debt is also suspected to have explanatory power on the amount of debt raised. The
study seeks to investigate the relationship between debt as a dependent variable and cost of debt,
proxied by interest rate, as an independent variable, as well as other proposed explanatory
variables.
Analysis extends to different country groupings to examine any similarities and differences in
the determinants of external debt. Categorisation is based on the work of the IMF (2019:17).
Countries have been classified into: all SSA countries; SSA countries excluding South Africa
(SA); SSA countries excluding Nigeria; SSA excluding Nigeria and SA; SSA excluding debt-
distressed countries; SSA excluding countries at high risk of distress; countries with low to
moderate risk of distress; Heavily Indebted Poor Countries (HIPC) Initiative post-completion
point recipient countries; low-income countries; middle-income countries; oil-exporting
countries; other resource-intensive countries; and non-resource-intensive countries. Drawing on
the theoretical literature and control variable models above, it is posited that there exists a
relationship between debt and the proposed explanatory variables—individually and collectively.
Given the theoretical inverse relationship between debt and interest rate (Mishkin, 2016), it is
posited that there exists a relationship between the interest rate and external debt.
Therefore, the following sets of hypotheses have been developed, each set comprising both the
null and alternative hypotheses.
Hypothesis 1:
H0a: No relationship exists between external debt and cost of debt.
H1a: There is a relationship between external debt and cost of debt.
Hypothesis 2:
H0b: External debt is not related to any one control variable.
H1b: There exists a relationship between external debt and chosen control variables.
Hypothesis 3:
H0c: The same set of explanatory variables has a similar effect on debt across all country
groupings.
H1c: Different country groupings are unique.
74
3. Methodology
3.1 Research approach and strategy
There are two available methods of data collection and analysis, the qualitative and quantitative
approaches. The former employs inductive and latter deductive reasoning (Schindler, 2014). This
study’s approach employs a deductive method to achieve its aims and objectives. The deductive
approach involves testing a developed hypothesis or set of hypotheses deduced from theory or
literature. Choosing this approach is premised on its suitability for collecting interval data related
to quantities of a variable (determinants of sovereign debt in Sub-Saharan Africa), with the end
goal of providing the researcher with an opportunity to establish the relationship between
dependent (debt) and independent variables (Schindler, 2014).
The qualitative approach on the other hand is prone to researcher subjectivity and would not be
suitable for this study because the investigation is done on the existing numbers (Dawson, 2009).
There is no need for any interpretation or inductive reasoning. The deductive approach affords
the researcher in-depth comprehension of the research context, allowing for structure flexibility.
Given greater reliance on researcher interpretation, an inductive approach makes generalisation
from large population results difficult (Williams, 2007). A quantitative approach invariably
mitigates this caveat.
3.2 Model specification
While the literature documents both qualitative and quantitative determinants of sovereign
borrowing, this study’s focus is on the latter. Sovereign debt (represented by external debt-
stocks) has been described as a function of a set of macro-economic factors. Interest rate is the
explanatory variable of interest with regard to the impact it has on borrowing behaviour (proxied
by amount of debt). The study does not exhaust all macro-economic factors, though they could
have association with sovereign debt. Nevertheless, the study includes major variables with
potential impact on the borrowing behaviour, subject to data availability.
Values of a dependent variable (debt) have been collected annually for 2009–2017. The
matching independent variables have been collected over the same period for each of the 36 SSA
countries. The panel data set is created from the paired variables for all countries in the sample
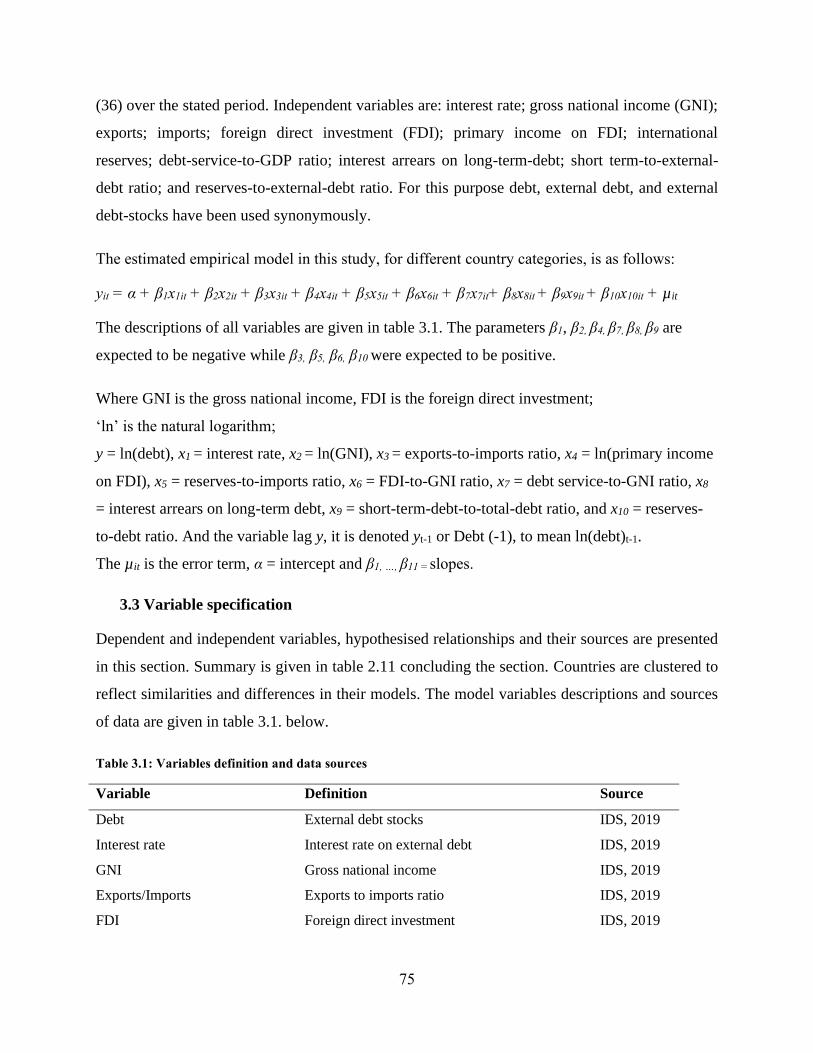
75
(36) over the stated period. Independent variables are: interest rate; gross national income (GNI);
exports; imports; foreign direct investment (FDI); primary income on FDI; international
reserves; debt-service-to-GDP ratio; interest arrears on long-term-debt; short term-to-external-
debt ratio; and reserves-to-external-debt ratio. For this purpose debt, external debt, and external
debt-stocks have been used synonymously.
The estimated empirical model in this study, for different country categories, is as follows:
yit = α + β1x1it + β2x2it + β3x3it + β4x4it + β5x5it + β6x6it + β7x7it+ β8x8it + β9x9it + β10x10it + µit
The descriptions of all variables are given in table 3.1. The parameters β1, β2, β4, β7, β8, β9 are
expected to be negative while β3, β5, β6, β10 were expected to be positive.
Where GNI is the gross national income, FDI is the foreign direct investment;
‘ln’ is the natural logarithm;
y = ln(debt), x1 = interest rate, x2 = ln(GNI), x3 = exports-to-imports ratio, x4 = ln(primary income
on FDI), x5 = reserves-to-imports ratio, x6 = FDI-to-GNI ratio, x7 = debt service-to-GNI ratio, x8
= interest arrears on long-term debt, x9 = short-term-debt-to-total-debt ratio, and x10 = reserves-
to-debt ratio. And the variable lag y, it is denoted yt-1 or Debt (-1), to mean ln(debt)t-1.
The µit is the error term, α = intercept and β1, …, β11 = slopes.
3.3 Variable specification
Dependent and independent variables, hypothesised relationships and their sources are presented
in this section. Summary is given in table 2.11 concluding the section. Countries are clustered to
reflect similarities and differences in their models. The model variables descriptions and sources
of data are given in table 3.1. below.
Table 3.1: Variables definition and data sources
Variable Definition Source
Debt External debt stocks IDS, 2019
Interest rate Interest rate on external debt IDS, 2019
GNI Gross national income IDS, 2019
Exports/Imports Exports to imports ratio IDS, 2019
FDI Foreign direct investment IDS, 2019
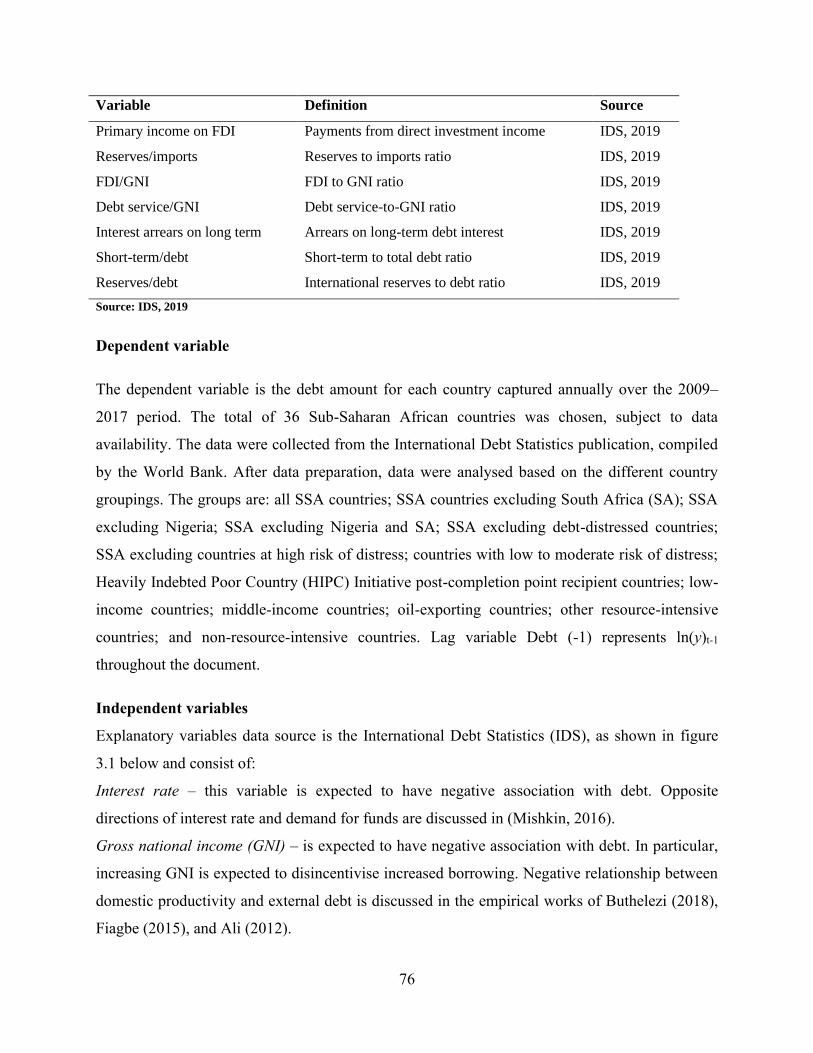
76
Variable Definition Source
Primary income on FDI Payments from direct investment income IDS, 2019
Reserves/imports Reserves to imports ratio IDS, 2019
FDI/GNI FDI to GNI ratio IDS, 2019
Debt service/GNI Debt service-to-GNI ratio IDS, 2019
Interest arrears on long term Arrears on long-term debt interest IDS, 2019
Short-term/debt Short-term to total debt ratio IDS, 2019
Reserves/debt International reserves to debt ratio IDS, 2019
Source: IDS, 2019
Dependent variable
The dependent variable is the debt amount for each country captured annually over the 2009–
2017 period. The total of 36 Sub-Saharan African countries was chosen, subject to data
availability. The data were collected from the International Debt Statistics publication, compiled
by the World Bank. After data preparation, data were analysed based on the different country
groupings. The groups are: all SSA countries; SSA countries excluding South Africa (SA); SSA
excluding Nigeria; SSA excluding Nigeria and SA; SSA excluding debt-distressed countries;
SSA excluding countries at high risk of distress; countries with low to moderate risk of distress;
Heavily Indebted Poor Country (HIPC) Initiative post-completion point recipient countries; low-
income countries; middle-income countries; oil-exporting countries; other resource-intensive
countries; and non-resource-intensive countries. Lag variable Debt (-1) represents ln(y)t-1
throughout the document.
Independent variables
Explanatory variables data source is the International Debt Statistics (IDS), as shown in figure
3.1 below and consist of:
Interest rate – this variable is expected to have negative association with debt. Opposite
directions of interest rate and demand for funds are discussed in (Mishkin, 2016).
Gross national income (GNI) – is expected to have negative association with debt. In particular,
increasing GNI is expected to disincentivise increased borrowing. Negative relationship between
domestic productivity and external debt is discussed in the empirical works of Buthelezi (2018),
Fiagbe (2015), and Ali (2012).
77
Exports – this variable is expected to have positive association with debt; its increase gives the
sovereign foreign assets buying power in currency reserves. This potentially enables the country
to service foreign currency-denominated debt, thus increasing the borrowing appetite. The
theorised relationship between exports and external debt is discussed in Mishkin (2016) and
Mankiw (2012).
Imports – this variable is expected to have negative association with external debt. This is the
direct opposite of the exports–external debt relationship, as attested to by Chee et al. (2015).
Foreign direct investment – this variable is expected to have positive association with debt
because it increases productivity. FDI’s impacts on economic growth, national income, and
foreign currency reserves are confirmed in numerous studies (Addison et al., 2017; Behname,
2012; Saini et al., 2011).
Primary income on FDI – this variable is expected to have positive association with debt because
it increases national income, inevitably increasing the country’s obligations-servicing abilities.
Positive association between market sentiment and economic growth is discussed in Richard
Cantor (2015) and Saini et al. (2011).
International reserves – this variable is expected to have positive association with sovereign
debt, as it provides exchange volatility hedging as discussed in Mishkin (2016). The impact on
liquidity, total debt and maturity is found in Fukuda & Kon (2010).
Debt-service-to-GNI ratio – is expected to relate negatively with external debt. Increasing debt-
service-to-GNI ratio implies looming indebtedness, which impacts on credit risk rating
negatively. Lower rating has a negative effect on the sovereign access to debt markets (Ballester
& González-Urteaga, 2017).
Interest arrears on long-term debt – should have a negative relationship with external debt.
Interest arrears attract creditors’ austerity and potentially impair economic growth (Block-Lieb,
2015; Pato, 2019), which associate negatively with productivity. Decreased productivity affects
credit rating negatively, inevitably constraining access to debt markets (Mukherjee, 2015).
Short term-to-external debt – this variable is expected to have negative association with
sovereign debt. Borrowing depletes fiscal space, rendering one maturity type increase mutually
exclusive of another. So, short-term debt negatively impacts external debt as implied in
Mustapha and Prizzon (2018).
78
Reserves-to-external debt – this variable is expected to have a positive association with
sovereign debt. Reserves association with economic growth, macro-economic variables, and
debt-markets-driven access to foreign currency are widely discussed in Akpan (2016); Kashif
and Sridharan (2017); Obstfeld, Shambaugh and Taylor (2010).
A predictor variable of interest is the interest rate. This and other independent variables first
serve the purpose of control variables. Their second purpose is explaining the behaviour of
dependent variables similar to interest-rate. A number of regressions are run, introducing
independent variables incrementally, to observe the change in the variable of interest— interest-
rate. Preliminary results include all models to show any changes (or absence of change) in the
interest-rate. The final model includes all variables that optimised the model fit after running the
tests.
The Hausman test is carried out prior to preliminary results to determine a suitable approach
between dynamic and fixed effects panel data analysis. Robustness checks on independent
variables are run after the preliminary results, to determine their statistical significance. Both the
correlation and variance inflation factor tests are run to check for multicollinearity. After
controlling for existence for multicollinearity, the final model is presented. The final presented
model consists of variables that are statistically significant, and less correlated since collinearity
can only be minimised instead of complete correction (Schindler, 2014).
3.4 Sampling and data collection
Out of all Sub-Saharan African (SSA) countries, 36 were sampled subject to data availability for
the period 2009–2017. Data about sovereign borrowing were collected from the World Bank’s
International Debt Statistics (IDS, 2019) publication. In the publication external debt and
external debt-stocks have been used synonymously. Data about interest rates were also collected
from IDS (2019), as well as data for other explanatory variables, namely: gross national income
(GNI); exports; imports; foreign direct investment (FDI); primary income on FDI; international
reserves; debt service; short-term; and interest arrears. Debt service-to-GNI, short term-to-
external debt, and reserves-to-external debt have been computed for analysis.
IDS compilation covers external debt and financial flows of about 121 low- and middle-income
countries. The information is extracted from the World Bank’s Debtor Reporting System (DRS),
79
which commenced operations in 1951. The World Debt Tables publication was launched in
1973, and it includes DRS external data. The data comprises: borrower composition; private and
non-guaranteed debt; creditor composition; private creditors; and loan terms and conditions
(IBRD, 2019:3). IDS online tables are accessible from http://datatopics.worldbank.org/debt/ids,
with a leading menu including Country, Region and Topic options (IBRD, 2019:x).
Specific country tables are accessed directly through http://datatopics.worldbank.org/debt/ids/
and the country code (e.g. http://datatopics.worldbank.org/debt/ids/DZA for Algeria). Regional
tables are directly accessible by clicking on the Region tab and, from the dropdown menu
selecting the region from the list. For example, to view South Asia, the direct link is
http://datatopics.worldbank.org/debt/ids/region/SAS. Databank, an online web resource, is
accessible from http://databank.worldbank.org. The link “provides simple and quick access to
collections of time series data” (IBRD, 2019:xiii).
Data about all countries that contracted loans from any of the World Bank Group affiliates are
documented. So is the case with other debts classified as ‘external debts’, because they are
“owed to non-resident creditors and are repayable in both foreign and domestic currency”,
(IBRD, 2019:67). Data contained in the IDS publications are “the reports to the World Bank
through the World Bank’s Debtor Reporting System (DRS) from member countries that have
received either International Bank for Reconstruction and Development (IBRD) loans or
International Development Association (IDA)” (IBRD, 2019:64).
3.5 Data analysis
The main study objective was the determination of macro-economic external debt
determinants—so debt is the dependent variable, and other variables are independent. To
establish the relationship between dependent and independent variables, regression was carried
out, using Stata 15 software. Due to substantial differences in number sizes between variables,
some variables were transformed by conversion into logarithms and others into ratios. Final
variables set in their logarithm form were: external debt-stocks, gross national income (GNI),
and primary income on foreign direct investment (FDI). Variables in their ratio form were:
interest-rate; exports-to-imports ratio; reserves-to-imports ratio; FDI-to-GNI ratio; debt service-
to-GNI ratio; short term-to-total debt ratio; and reserves-to-debt ratio.
80
The Hausman test was carried out to determine a suitable approach between random and fixed
effects. Robustness tests to establish statistical significance of variables were also carried out
prior to regressions runs. Data was further tested for variable stationarity using unit root tests.
Unit root tests were carried out using the Levin, Lin and Chu (2002) specification. Correlation
tests were also carried out to establish preliminary relationships and their direction. Full
regressions were run for all countries and for different country clusters.
3.6 Research criteria and limitations
This is a formal study, exploiting secondary data to establish potential relationships between
variables. It is cross-sectional in nature, limited within the given duration and budget—two
constraints that favoured the choice over longitudinal method. It seeks to shed light in another
direction using the existing data. Data is not to be used for reasons similar to those for which it
was collected and processed. An aspect of borrowing behaviour is examined along the lines of
how it can be explained by the cost of debt and explanatory variables.
The explanatory variables are: interest rate; gross national income (GNI); exports; imports;
foreign direct investment (FDI); primary income on FDI; international reserves; debt service to
GNI ratio; interest arrears on long-term loan; short-term-to-external debt-stocks ratio; and
reserves to external debt-stocks ratio. Secondary data was collected from existing World Bank
data bank and International Debt Statistics (IDS) compilations. Data about individual countries
was collected for the study’s intended purpose, prepared and stored awaiting analysis. The data is
accessed from database of international institution – the World Bank, which make it accessible to
the public.
The researcher was handling data extracted from publications for use to establish other patterns.
Two types of datasets were regressed to establish existence of relationships: debt as a dependent
variable and a set of explanatory variables. Association of interest was between external-debt and
interest-rate. It is that relationship (or none) which helps to answer the research question.
Regression analysis establishes the explanatory character of changes in the interest rate to
changes in the external debt. Other independent variables are included to examine their
explanatory nature of external debt. The study is causal, trying to examine the existence of a
relationship between dependent and independent variables. As part of model validity checks,
81
explanatory power of independent variables is examined to establish the strength of a
relationship. The study also employs an ex-post-facto design; the researcher was unable to
manipulate predictor variables as is the case with experimental designs (Schindler, 2014).
The study has been carried out within a specified time and financial resources framework. Panel
data has been collected from existing records once, prepared and analysed. The nature of the
study demanded that execution be done within the academic ambits. The aim of the exercise was
to test the research aspect of training on the part of the researcher. The researcher is a student
executing research as partial requirement for completion of the degree programme.
This is a statistical study, since several sample subjects were investigated to help draw
inferences. Scientific (experimental) methods have been applied according to the academic
requirement to render the outcomes reliable for consumption. Hypotheses have been tested
quantitatively, and generalisations are based on the sample of selected countries. Sampling is
based on the availability of data for individual countries. Data used covers the period 2009–2017,
examining the relationship between loan amounts contracted and interest-rates on debt from all
creditors averaged.
Other variables serve the dual purpose of control and explanation. The study is confined to the
Sub-Saharan African countries, using data compiled by the World Bank Group Debtor Reporting
System (DRS). All activities were desktop based, from data collection to data preparation and
analysis. No human elements or potentially sensitive items have been used for data collection,
rendering participants’ perceptions and biases irrelevant.
4. Results and findings
4.1 Contextual background of SSA and debt management
Debt markets in the SSA region are mostly under-developed, and not sophisticated enough to
support sustainable development funding. Countries find it difficult to raise enough financing for
development in their domestic markets, which are dominated by commercial banks. However,
the SSA unavoidable developments financing gap (for infrastructure, housing, education, health,
poverty-reduction programmes) compels countries to seek loan funds beyond national borders.
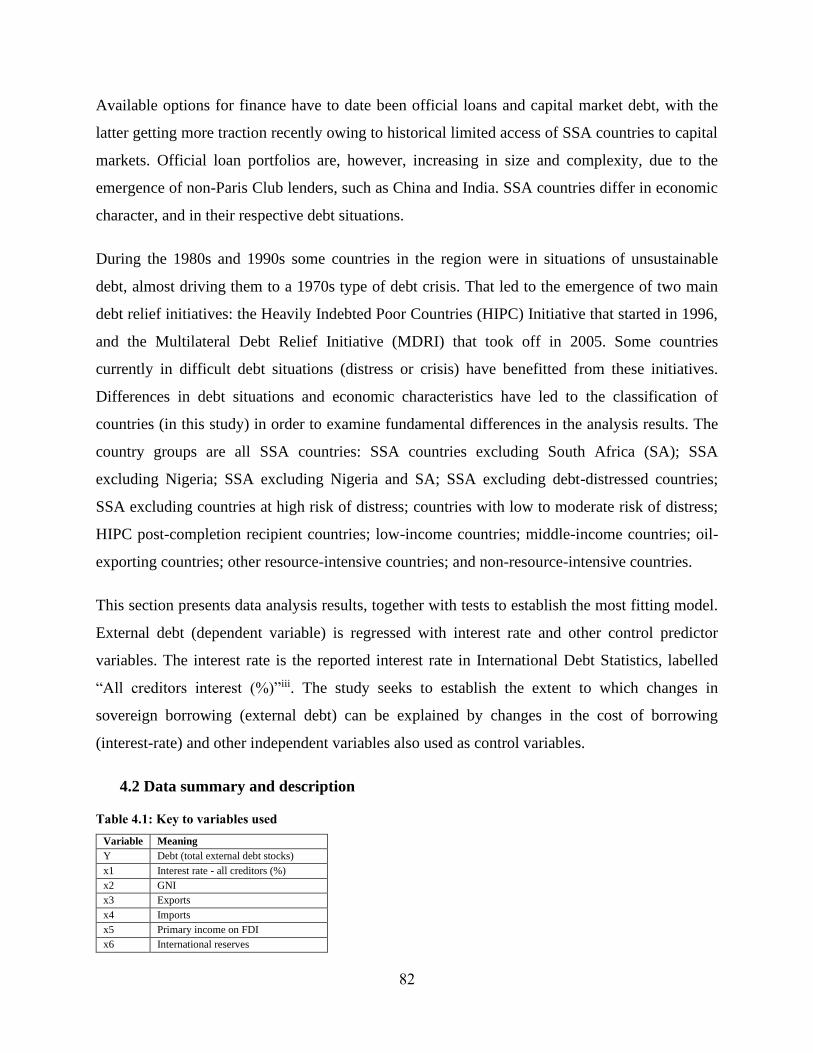
82
Available options for finance have to date been official loans and capital market debt, with the
latter getting more traction recently owing to historical limited access of SSA countries to capital
markets. Official loan portfolios are, however, increasing in size and complexity, due to the
emergence of non-Paris Club lenders, such as China and India. SSA countries differ in economic
character, and in their respective debt situations.
During the 1980s and 1990s some countries in the region were in situations of unsustainable
debt, almost driving them to a 1970s type of debt crisis. That led to the emergence of two main
debt relief initiatives: the Heavily Indebted Poor Countries (HIPC) Initiative that started in 1996,
and the Multilateral Debt Relief Initiative (MDRI) that took off in 2005. Some countries
currently in difficult debt situations (distress or crisis) have benefitted from these initiatives.
Differences in debt situations and economic characteristics have led to the classification of
countries (in this study) in order to examine fundamental differences in the analysis results. The
country groups are all SSA countries: SSA countries excluding South Africa (SA); SSA
excluding Nigeria; SSA excluding Nigeria and SA; SSA excluding debt-distressed countries;
SSA excluding countries at high risk of distress; countries with low to moderate risk of distress;
HIPC post-completion recipient countries; low-income countries; middle-income countries; oil-
exporting countries; other resource-intensive countries; and non-resource-intensive countries.
This section presents data analysis results, together with tests to establish the most fitting model.
External debt (dependent variable) is regressed with interest rate and other control predictor
variables. The interest rate is the reported interest rate in International Debt Statistics, labelled
“All creditors interest (%)”iii. The study seeks to establish the extent to which changes in
sovereign borrowing (external debt) can be explained by changes in the cost of borrowing
(interest-rate) and other independent variables also used as control variables.
4.2 Data summary and description
Table 4.1: Key to variables used
Variable Meaning
Y Debt (total external debt stocks)
x1 Interest rate - all creditors (%)
x2 GNI
x3 Exports
x4 Imports
x5 Primary income on FDI
x6 International reserves
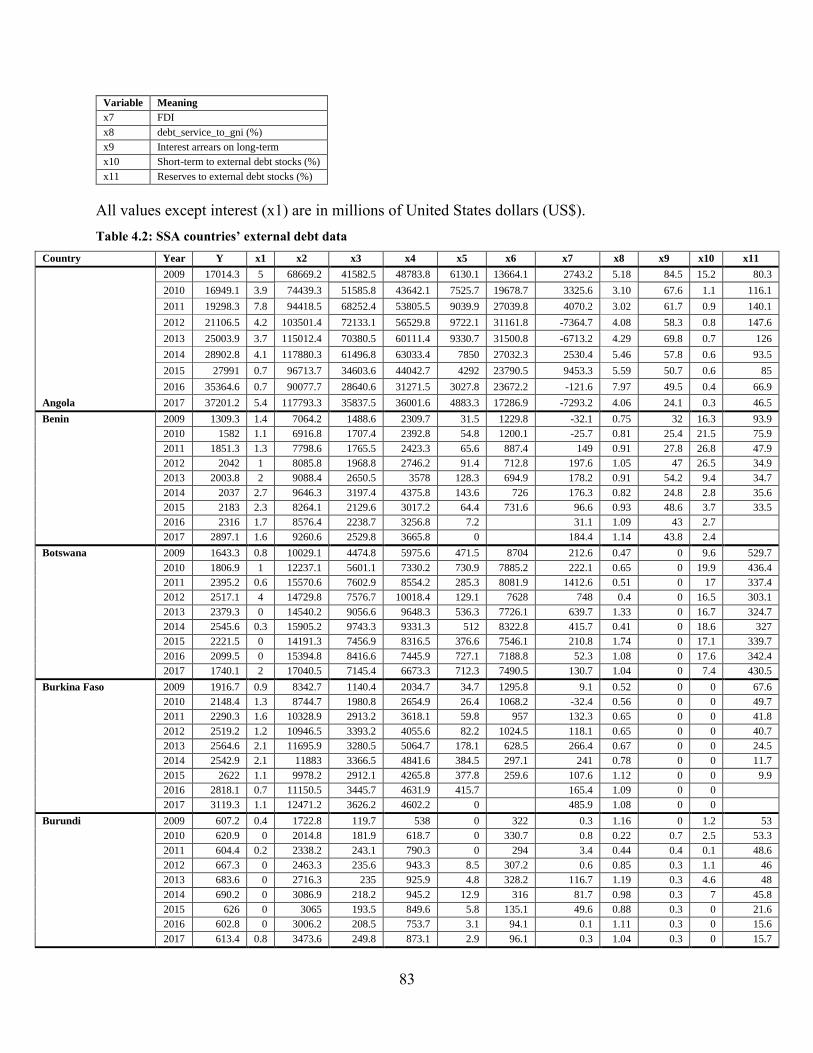
83
Variable Meaning
x7 FDI
x8 debt_service_to_gni (%)
x9 Interest arrears on long-term
x10 Short-term to external debt stocks (%)
x11 Reserves to external debt stocks (%)
All values except interest (x1) are in millions of United States dollars (US$).
Table 4.2: SSA countries’ external debt data
Country Year Y x1 x2 x3 x4 x5 x6 x7 x8 x9 x10 x11
Angola
2009 17014.3 5 68669.2 41582.5 48783.8 6130.1 13664.1 2743.2 5.18 84.5 15.2 80.3
2010 16949.1 3.9 74439.3 51585.8 43642.1 7525.7 19678.7 3325.6 3.10 67.6 1.1 116.1
2011 19298.3 7.8 94418.5 68252.4 53805.5 9039.9 27039.8 4070.2 3.02 61.7 0.9 140.1
2012 21106.5 4.2 103501.4 72133.1 56529.8 9722.1 31161.8 -7364.7 4.08 58.3 0.8 147.6
2013 25003.9 3.7 115012.4 70380.5 60111.4 9330.7 31500.8 -6713.2 4.29 69.8 0.7 126
2014 28902.8 4.1 117880.3 61496.8 63033.4 7850 27032.3 2530.4 5.46 57.8 0.6 93.5
2015 27991 0.7 96713.7 34603.6 44042.7 4292 23790.5 9453.3 5.59 50.7 0.6 85
2016 35364.6 0.7 90077.7 28640.6 31271.5 3027.8 23672.2 -121.6 7.97 49.5 0.4 66.9
2017 37201.2 5.4 117793.3 35837.5 36001.6 4883.3 17286.9 -7293.2 4.06 24.1 0.3 46.5
Benin 2009 1309.3 1.4 7064.2 1488.6 2309.7 31.5 1229.8 -32.1 0.75 32 16.3 93.9
2010 1582 1.1 6916.8 1707.4 2392.8 54.8 1200.1 -25.7 0.81 25.4 21.5 75.9
2011 1851.3 1.3 7798.6 1765.5 2423.3 65.6 887.4 149 0.91 27.8 26.8 47.9
2012 2042 1 8085.8 1968.8 2746.2 91.4 712.8 197.6 1.05 47 26.5 34.9
2013 2003.8 2 9088.4 2650.5 3578 128.3 694.9 178.2 0.91 54.2 9.4 34.7
2014 2037 2.7 9646.3 3197.4 4375.8 143.6 726 176.3 0.82 24.8 2.8 35.6
2015 2183 2.3 8264.1 2129.6 3017.2 64.4 731.6 96.6 0.93 48.6 3.7 33.5
2016 2316 1.7 8576.4 2238.7 3256.8 7.2 31.1 1.09 43 2.7
2017 2897.1 1.6 9260.6 2529.8 3665.8 0 184.4 1.14 43.8 2.4
Botswana 2009 1643.3 0.8 10029.1 4474.8 5975.6 471.5 8704 212.6 0.47 0 9.6 529.7
2010 1806.9 1 12237.1 5601.1 7330.2 730.9 7885.2 222.1 0.65 0 19.9 436.4
2011 2395.2 0.6 15570.6 7602.9 8554.2 285.3 8081.9 1412.6 0.51 0 17 337.4
2012 2517.1 4 14729.8 7576.7 10018.4 129.1 7628 748 0.4 0 16.5 303.1
2013 2379.3 0 14540.2 9056.6 9648.3 536.3 7726.1 639.7 1.33 0 16.7 324.7
2014 2545.6 0.3 15905.2 9743.3 9331.3 512 8322.8 415.7 0.41 0 18.6 327
2015 2221.5 0 14191.3 7456.9 8316.5 376.6 7546.1 210.8 1.74 0 17.1 339.7
2016 2099.5 0 15394.8 8416.6 7445.9 727.1 7188.8 52.3 1.08 0 17.6 342.4
2017 1740.1 2 17040.5 7145.4 6673.3 712.3 7490.5 130.7 1.04 0 7.4 430.5
Burkina Faso 2009 1916.7 0.9 8342.7 1140.4 2034.7 34.7 1295.8 9.1 0.52 0 0 67.6
2010 2148.4 1.3 8744.7 1980.8 2654.9 26.4 1068.2 -32.4 0.56 0 0 49.7
2011 2290.3 1.6 10328.9 2913.2 3618.1 59.8 957 132.3 0.65 0 0 41.8
2012 2519.2 1.2 10946.5 3393.2 4055.6 82.2 1024.5 118.1 0.65 0 0 40.7
2013 2564.6 2.1 11695.9 3280.5 5064.7 178.1 628.5 266.4 0.67 0 0 24.5
2014 2542.9 2.1 11883 3366.5 4841.6 384.5 297.1 241 0.78 0 0 11.7
2015 2622 1.1 9978.2 2912.1 4265.8 377.8 259.6 107.6 1.12 0 0 9.9
2016 2818.1 0.7 11150.5 3445.7 4631.9 415.7 165.4 1.09 0 0
2017 3119.3 1.1 12471.2 3626.2 4602.2 0 485.9 1.08 0 0
Burundi 2009 607.2 0.4 1722.8 119.7 538 0 322 0.3 1.16 0 1.2 53
2010 620.9 0 2014.8 181.9 618.7 0 330.7 0.8 0.22 0.7 2.5 53.3
2011 604.4 0.2 2338.2 243.1 790.3 0 294 3.4 0.44 0.4 0.1 48.6
2012 667.3 0 2463.3 235.6 943.3 8.5 307.2 0.6 0.85 0.3 1.1 46
2013 683.6 0 2716.3 235 925.9 4.8 328.2 116.7 1.19 0.3 4.6 48
2014 690.2 0 3086.9 218.2 945.2 12.9 316 81.7 0.98 0.3 7 45.8
2015 626 0 3065 193.5 849.6 5.8 135.1 49.6 0.88 0.3 0 21.6
2016 602.8 0 3006.2 208.5 753.7 3.1 94.1 0.1 1.11 0.3 0 15.6
2017 613.4 0.8 3473.6 249.8 873.1 2.9 96.1 0.3 1.04 0.3 0 15.7
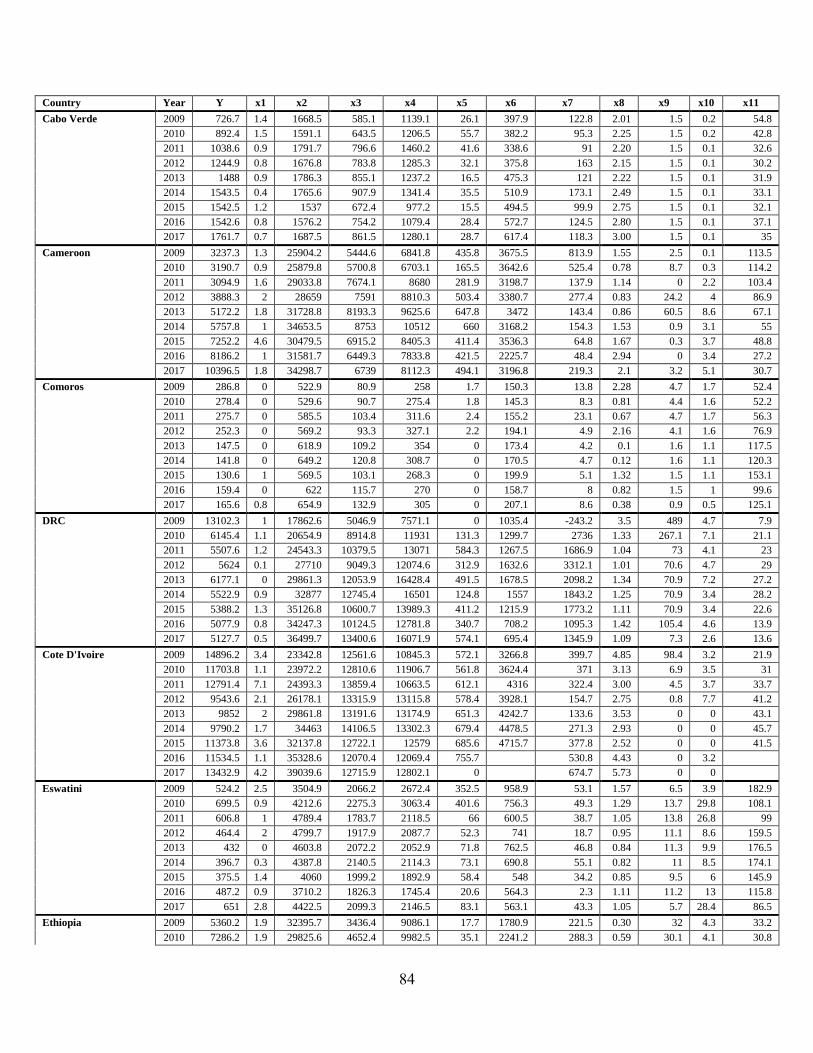
84
Country Year Y x1 x2 x3 x4 x5 x6 x7 x8 x9 x10 x11
Cabo Verde 2009 726.7 1.4 1668.5 585.1 1139.1 26.1 397.9 122.8 2.01 1.5 0.2 54.8
2010 892.4 1.5 1591.1 643.5 1206.5 55.7 382.2 95.3 2.25 1.5 0.2 42.8
2011 1038.6 0.9 1791.7 796.6 1460.2 41.6 338.6 91 2.20 1.5 0.1 32.6
2012 1244.9 0.8 1676.8 783.8 1285.3 32.1 375.8 163 2.15 1.5 0.1 30.2
2013 1488 0.9 1786.3 855.1 1237.2 16.5 475.3 121 2.22 1.5 0.1 31.9
2014 1543.5 0.4 1765.6 907.9 1341.4 35.5 510.9 173.1 2.49 1.5 0.1 33.1
2015 1542.5 1.2 1537 672.4 977.2 15.5 494.5 99.9 2.75 1.5 0.1 32.1
2016 1542.6 0.8 1576.2 754.2 1079.4 28.4 572.7 124.5 2.80 1.5 0.1 37.1
2017 1761.7 0.7 1687.5 861.5 1280.1 28.7 617.4 118.3 3.00 1.5 0.1 35
Cameroon 2009 3237.3 1.3 25904.2 5444.6 6841.8 435.8 3675.5 813.9 1.55 2.5 0.1 113.5
2010 3190.7 0.9 25879.8 5700.8 6703.1 165.5 3642.6 525.4 0.78 8.7 0.3 114.2
2011 3094.9 1.6 29033.8 7674.1 8680 281.9 3198.7 137.9 1.14 0 2.2 103.4
2012 3888.3 2 28659 7591 8810.3 503.4 3380.7 277.4 0.83 24.2 4 86.9
2013 5172.2 1.8 31728.8 8193.3 9625.6 647.8 3472 143.4 0.86 60.5 8.6 67.1
2014 5757.8 1 34653.5 8753 10512 660 3168.2 154.3 1.53 0.9 3.1 55
2015 7252.2 4.6 30479.5 6915.2 8405.3 411.4 3536.3 64.8 1.67 0.3 3.7 48.8
2016 8186.2 1 31581.7 6449.3 7833.8 421.5 2225.7 48.4 2.94 0 3.4 27.2
2017 10396.5 1.8 34298.7 6739 8112.3 494.1 3196.8 219.3 2.1 3.2 5.1 30.7
Comoros 2009 286.8 0 522.9 80.9 258 1.7 150.3 13.8 2.28 4.7 1.7 52.4
2010 278.4 0 529.6 90.7 275.4 1.8 145.3 8.3 0.81 4.4 1.6 52.2
2011 275.7 0 585.5 103.4 311.6 2.4 155.2 23.1 0.67 4.7 1.7 56.3
2012 252.3 0 569.2 93.3 327.1 2.2 194.1 4.9 2.16 4.1 1.6 76.9
2013 147.5 0 618.9 109.2 354 0 173.4 4.2 0.1 1.6 1.1 117.5
2014 141.8 0 649.2 120.8 308.7 0 170.5 4.7 0.12 1.6 1.1 120.3
2015 130.6 1 569.5 103.1 268.3 0 199.9 5.1 1.32 1.5 1.1 153.1
2016 159.4 0 622 115.7 270 0 158.7 8 0.82 1.5 1 99.6
2017 165.6 0.8 654.9 132.9 305 0 207.1 8.6 0.38 0.9 0.5 125.1
DRC 2009 13102.3 1 17862.6 5046.9 7571.1 0 1035.4 -243.2 3.5 489 4.7 7.9
2010 6145.4 1.1 20654.9 8914.8 11931 131.3 1299.7 2736 1.33 267.1 7.1 21.1
2011 5507.6 1.2 24543.3 10379.5 13071 584.3 1267.5 1686.9 1.04 73 4.1 23
2012 5624 0.1 27710 9049.3 12074.6 312.9 1632.6 3312.1 1.01 70.6 4.7 29
2013 6177.1 0 29861.3 12053.9 16428.4 491.5 1678.5 2098.2 1.34 70.9 7.2 27.2
2014 5522.9 0.9 32877 12745.4 16501 124.8 1557 1843.2 1.25 70.9 3.4 28.2
2015 5388.2 1.3 35126.8 10600.7 13989.3 411.2 1215.9 1773.2 1.11 70.9 3.4 22.6
2016 5077.9 0.8 34247.3 10124.5 12781.8 340.7 708.2 1095.3 1.42 105.4 4.6 13.9
2017 5127.7 0.5 36499.7 13400.6 16071.9 574.1 695.4 1345.9 1.09 7.3 2.6 13.6
Cote D'Ivoire 2009 14896.2 3.4 23342.8 12561.6 10845.3 572.1 3266.8 399.7 4.85 98.4 3.2 21.9
2010 11703.8 1.1 23972.2 12810.6 11906.7 561.8 3624.4 371 3.13 6.9 3.5 31
2011 12791.4 7.1 24393.3 13859.4 10663.5 612.1 4316 322.4 3.00 4.5 3.7 33.7
2012 9543.6 2.1 26178.1 13315.9 13115.8 578.4 3928.1 154.7 2.75 0.8 7.7 41.2
2013 9852 2 29861.8 13191.6 13174.9 651.3 4242.7 133.6 3.53 0 0 43.1
2014 9790.2 1.7 34463 14106.5 13302.3 679.4 4478.5 271.3 2.93 0 0 45.7
2015 11373.8 3.6 32137.8 12722.1 12579 685.6 4715.7 377.8 2.52 0 0 41.5
2016 11534.5 1.1 35328.6 12070.4 12069.4 755.7 530.8 4.43 0 3.2
2017 13432.9 4.2 39039.6 12715.9 12802.1 0 674.7 5.73 0 0
Eswatini 2009 524.2 2.5 3504.9 2066.2 2672.4 352.5 958.9 53.1 1.57 6.5 3.9 182.9
2010 699.5 0.9 4212.6 2275.3 3063.4 401.6 756.3 49.3 1.29 13.7 29.8 108.1
2011 606.8 1 4789.4 1783.7 2118.5 66 600.5 38.7 1.05 13.8 26.8 99
2012 464.4 2 4799.7 1917.9 2087.7 52.3 741 18.7 0.95 11.1 8.6 159.5
2013 432 0 4603.8 2072.2 2052.9 71.8 762.5 46.8 0.84 11.3 9.9 176.5
2014 396.7 0.3 4387.8 2140.5 2114.3 73.1 690.8 55.1 0.82 11 8.5 174.1
2015 375.5 1.4 4060 1999.2 1892.9 58.4 548 34.2 0.85 9.5 6 145.9
2016 487.2 0.9 3710.2 1826.3 1745.4 20.6 564.3 2.3 1.11 11.2 13 115.8
2017 651 2.8 4422.5 2099.3 2146.5 83.1 563.1 43.3 1.05 5.7 28.4 86.5
Ethiopia 2009 5360.2 1.9 32395.7 3436.4 9086.1 17.7 1780.9 221.5 0.30 32 4.3 33.2
2010 7286.2 1.9 29825.6 4652.4 9982.5 35.1 2241.2 288.3 0.59 30.1 4.1 30.8
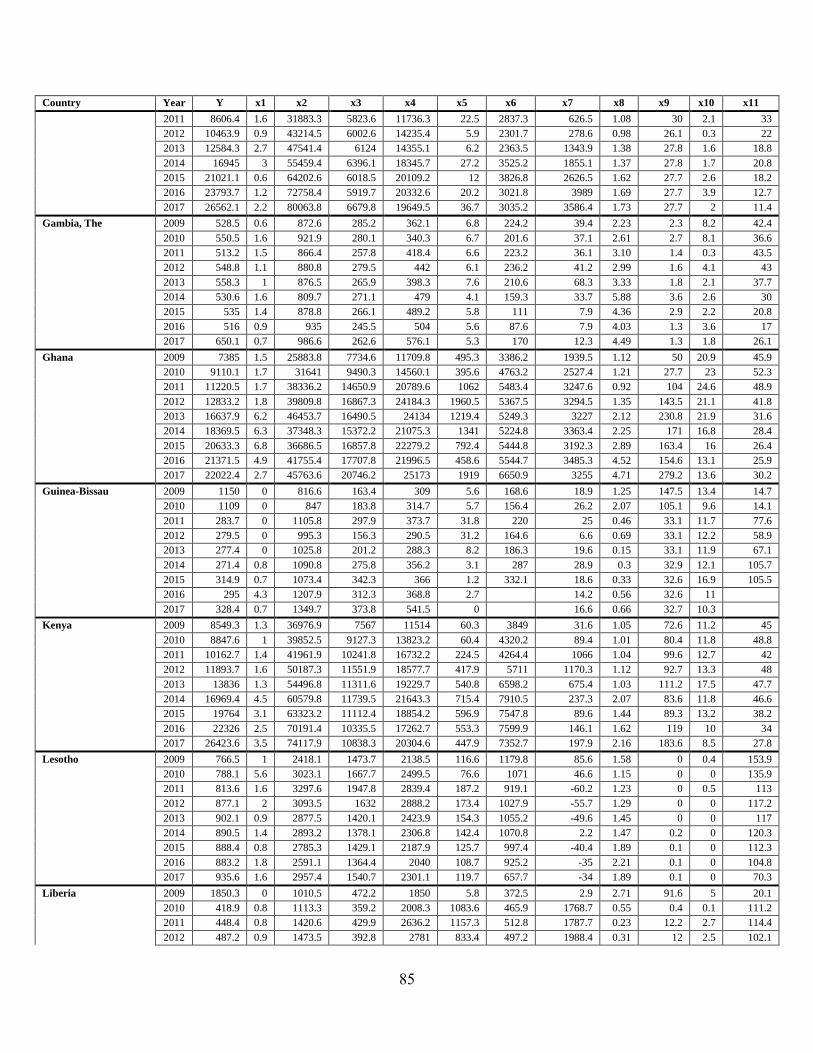
85
Country Year Y x1 x2 x3 x4 x5 x6 x7 x8 x9 x10 x11
2011 8606.4 1.6 31883.3 5823.6 11736.3 22.5 2837.3 626.5 1.08 30 2.1 33
2012 10463.9 0.9 43214.5 6002.6 14235.4 5.9 2301.7 278.6 0.98 26.1 0.3 22
2013 12584.3 2.7 47541.4 6124 14355.1 6.2 2363.5 1343.9 1.38 27.8 1.6 18.8
2014 16945 3 55459.4 6396.1 18345.7 27.2 3525.2 1855.1 1.37 27.8 1.7 20.8
2015 21021.1 0.6 64202.6 6018.5 20109.2 12 3826.8 2626.5 1.62 27.7 2.6 18.2
2016 23793.7 1.2 72758.4 5919.7 20332.6 20.2 3021.8 3989 1.69 27.7 3.9 12.7
2017 26562.1 2.2 80063.8 6679.8 19649.5 36.7 3035.2 3586.4 1.73 27.7 2 11.4
Gambia, The 2009 528.5 0.6 872.6 285.2 362.1 6.8 224.2 39.4 2.23 2.3 8.2 42.4
2010 550.5 1.6 921.9 280.1 340.3 6.7 201.6 37.1 2.61 2.7 8.1 36.6
2011 513.2 1.5 866.4 257.8 418.4 6.6 223.2 36.1 3.10 1.4 0.3 43.5
2012 548.8 1.1 880.8 279.5 442 6.1 236.2 41.2 2.99 1.6 4.1 43
2013 558.3 1 876.5 265.9 398.3 7.6 210.6 68.3 3.33 1.8 2.1 37.7
2014 530.6 1.6 809.7 271.1 479 4.1 159.3 33.7 5.88 3.6 2.6 30
2015 535 1.4 878.8 266.1 489.2 5.8 111 7.9 4.36 2.9 2.2 20.8
2016 516 0.9 935 245.5 504 5.6 87.6 7.9 4.03 1.3 3.6 17
2017 650.1 0.7 986.6 262.6 576.1 5.3 170 12.3 4.49 1.3 1.8 26.1
Ghana 2009 7385 1.5 25883.8 7734.6 11709.8 495.3 3386.2 1939.5 1.12 50 20.9 45.9
2010 9110.1 1.7 31641 9490.3 14560.1 395.6 4763.2 2527.4 1.21 27.7 23 52.3
2011 11220.5 1.7 38336.2 14650.9 20789.6 1062 5483.4 3247.6 0.92 104 24.6 48.9
2012 12833.2 1.8 39809.8 16867.3 24184.3 1960.5 5367.5 3294.5 1.35 143.5 21.1 41.8
2013 16637.9 6.2 46453.7 16490.5 24134 1219.4 5249.3 3227 2.12 230.8 21.9 31.6
2014 18369.5 6.3 37348.3 15372.2 21075.3 1341 5224.8 3363.4 2.25 171 16.8 28.4
2015 20633.3 6.8 36686.5 16857.8 22279.2 792.4 5444.8 3192.3 2.89 163.4 16 26.4
2016 21371.5 4.9 41755.4 17707.8 21996.5 458.6 5544.7 3485.3 4.52 154.6 13.1 25.9
2017 22022.4 2.7 45763.6 20746.2 25173 1919 6650.9 3255 4.71 279.2 13.6 30.2
Guinea-Bissau 2009 1150 0 816.6 163.4 309 5.6 168.6 18.9 1.25 147.5 13.4 14.7
2010 1109 0 847 183.8 314.7 5.7 156.4 26.2 2.07 105.1 9.6 14.1
2011 283.7 0 1105.8 297.9 373.7 31.8 220 25 0.46 33.1 11.7 77.6
2012 279.5 0 995.3 156.3 290.5 31.2 164.6 6.6 0.69 33.1 12.2 58.9
2013 277.4 0 1025.8 201.2 288.3 8.2 186.3 19.6 0.15 33.1 11.9 67.1
2014 271.4 0.8 1090.8 275.8 356.2 3.1 287 28.9 0.3 32.9 12.1 105.7
2015 314.9 0.7 1073.4 342.3 366 1.2 332.1 18.6 0.33 32.6 16.9 105.5
2016 295 4.3 1207.9 312.3 368.8 2.7 14.2 0.56 32.6 11
2017 328.4 0.7 1349.7 373.8 541.5 0 16.6 0.66 32.7 10.3
Kenya 2009 8549.3 1.3 36976.9 7567 11514 60.3 3849 31.6 1.05 72.6 11.2 45
2010 8847.6 1 39852.5 9127.3 13823.2 60.4 4320.2 89.4 1.01 80.4 11.8 48.8
2011 10162.7 1.4 41961.9 10241.8 16732.2 224.5 4264.4 1066 1.04 99.6 12.7 42
2012 11893.7 1.6 50187.3 11551.9 18577.7 417.9 5711 1170.3 1.12 92.7 13.3 48
2013 13836 1.3 54496.8 11311.6 19229.7 540.8 6598.2 675.4 1.03 111.2 17.5 47.7
2014 16969.4 4.5 60579.8 11739.5 21643.3 715.4 7910.5 237.3 2.07 83.6 11.8 46.6
2015 19764 3.1 63323.2 11112.4 18854.2 596.9 7547.8 89.6 1.44 89.3 13.2 38.2
2016 22326 2.5 70191.4 10335.5 17262.7 553.3 7599.9 146.1 1.62 119 10 34
2017 26423.6 3.5 74117.9 10838.3 20304.6 447.9 7352.7 197.9 2.16 183.6 8.5 27.8
Lesotho 2009 766.5 1 2418.1 1473.7 2138.5 116.6 1179.8 85.6 1.58 0 0.4 153.9
2010 788.1 5.6 3023.1 1667.7 2499.5 76.6 1071 46.6 1.15 0 0 135.9
2011 813.6 1.6 3297.6 1947.8 2839.4 187.2 919.1 -60.2 1.23 0 0.5 113
2012 877.1 2 3093.5 1632 2888.2 173.4 1027.9 -55.7 1.29 0 0 117.2
2013 902.1 0.9 2877.5 1420.1 2423.9 154.3 1055.2 -49.6 1.45 0 0 117
2014 890.5 1.4 2893.2 1378.1 2306.8 142.4 1070.8 2.2 1.47 0.2 0 120.3
2015 888.4 0.8 2785.3 1429.1 2187.9 125.7 997.4 -40.4 1.89 0.1 0 112.3
2016 883.2 1.8 2591.1 1364.4 2040 108.7 925.2 -35 2.21 0.1 0 104.8
2017 935.6 1.6 2957.4 1540.7 2301.1 119.7 657.7 -34 1.89 0.1 0 70.3
Liberia 2009 1850.3 0 1010.5 472.2 1850 5.8 372.5 2.9 2.71 91.6 5 20.1
2010 418.9 0.8 1113.3 359.2 2008.3 1083.6 465.9 1768.7 0.55 0.4 0.1 111.2
2011 448.4 0.8 1420.6 429.9 2636.2 1157.3 512.8 1787.7 0.23 12.2 2.7 114.4
2012 487.2 0.9 1473.5 392.8 2781 833.4 497.2 1988.4 0.31 12 2.5 102.1
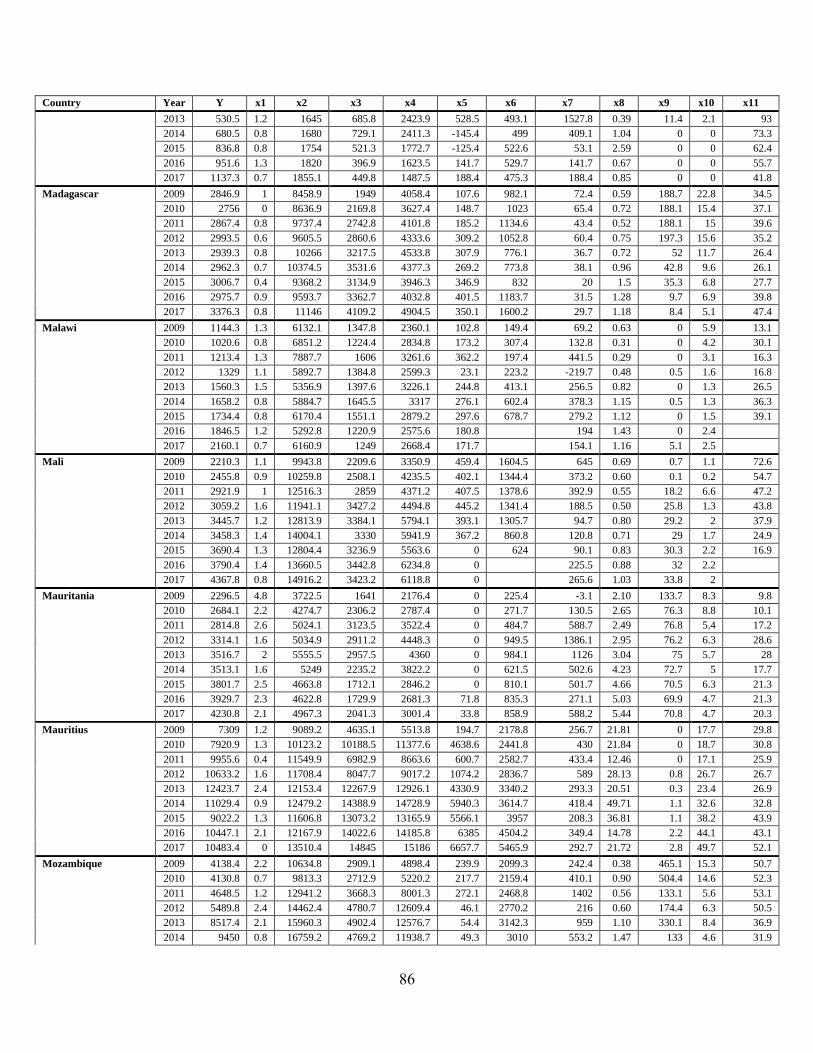
86
Country Year Y x1 x2 x3 x4 x5 x6 x7 x8 x9 x10 x11
2013 530.5 1.2 1645 685.8 2423.9 528.5 493.1 1527.8 0.39 11.4 2.1 93
2014 680.5 0.8 1680 729.1 2411.3 -145.4 499 409.1 1.04 0 0 73.3
2015 836.8 0.8 1754 521.3 1772.7 -125.4 522.6 53.1 2.59 0 0 62.4
2016 951.6 1.3 1820 396.9 1623.5 141.7 529.7 141.7 0.67 0 0 55.7
2017 1137.3 0.7 1855.1 449.8 1487.5 188.4 475.3 188.4 0.85 0 0 41.8
Madagascar 2009 2846.9 1 8458.9 1949 4058.4 107.6 982.1 72.4 0.59 188.7 22.8 34.5
2010 2756 0 8636.9 2169.8 3627.4 148.7 1023 65.4 0.72 188.1 15.4 37.1
2011 2867.4 0.8 9737.4 2742.8 4101.8 185.2 1134.6 43.4 0.52 188.1 15 39.6
2012 2993.5 0.6 9605.5 2860.6 4333.6 309.2 1052.8 60.4 0.75 197.3 15.6 35.2
2013 2939.3 0.8 10266 3217.5 4533.8 307.9 776.1 36.7 0.72 52 11.7 26.4
2014 2962.3 0.7 10374.5 3531.6 4377.3 269.2 773.8 38.1 0.96 42.8 9.6 26.1
2015 3006.7 0.4 9368.2 3134.9 3946.3 346.9 832 20 1.5 35.3 6.8 27.7
2016 2975.7 0.9 9593.7 3362.7 4032.8 401.5 1183.7 31.5 1.28 9.7 6.9 39.8
2017 3376.3 0.8 11146 4109.2 4904.5 350.1 1600.2 29.7 1.18 8.4 5.1 47.4
Malawi 2009 1144.3 1.3 6132.1 1347.8 2360.1 102.8 149.4 69.2 0.63 0 5.9 13.1
2010 1020.6 0.8 6851.2 1224.4 2834.8 173.2 307.4 132.8 0.31 0 4.2 30.1
2011 1213.4 1.3 7887.7 1606 3261.6 362.2 197.4 441.5 0.29 0 3.1 16.3
2012 1329 1.1 5892.7 1384.8 2599.3 23.1 223.2 -219.7 0.48 0.5 1.6 16.8
2013 1560.3 1.5 5356.9 1397.6 3226.1 244.8 413.1 256.5 0.82 0 1.3 26.5
2014 1658.2 0.8 5884.7 1645.5 3317 276.1 602.4 378.3 1.15 0.5 1.3 36.3
2015 1734.4 0.8 6170.4 1551.1 2879.2 297.6 678.7 279.2 1.12 0 1.5 39.1
2016 1846.5 1.2 5292.8 1220.9 2575.6 180.8 194 1.43 0 2.4
2017 2160.1 0.7 6160.9 1249 2668.4 171.7 154.1 1.16 5.1 2.5
Mali 2009 2210.3 1.1 9943.8 2209.6 3350.9 459.4 1604.5 645 0.69 0.7 1.1 72.6
2010 2455.8 0.9 10259.8 2508.1 4235.5 402.1 1344.4 373.2 0.60 0.1 0.2 54.7
2011 2921.9 1 12516.3 2859 4371.2 407.5 1378.6 392.9 0.55 18.2 6.6 47.2
2012 3059.2 1.6 11941.1 3427.2 4494.8 445.2 1341.4 188.5 0.50 25.8 1.3 43.8
2013 3445.7 1.2 12813.9 3384.1 5794.1 393.1 1305.7 94.7 0.80 29.2 2 37.9
2014 3458.3 1.4 14004.1 3330 5941.9 367.2 860.8 120.8 0.71 29 1.7 24.9
2015 3690.4 1.3 12804.4 3236.9 5563.6 0 624 90.1 0.83 30.3 2.2 16.9
2016 3790.4 1.4 13660.5 3442.8 6234.8 0 225.5 0.88 32 2.2
2017 4367.8 0.8 14916.2 3423.2 6118.8 0 265.6 1.03 33.8 2
Mauritania 2009 2296.5 4.8 3722.5 1641 2176.4 0 225.4 -3.1 2.10 133.7 8.3 9.8
2010 2684.1 2.2 4274.7 2306.2 2787.4 0 271.7 130.5 2.65 76.3 8.8 10.1
2011 2814.8 2.6 5024.1 3123.5 3522.4 0 484.7 588.7 2.49 76.8 5.4 17.2
2012 3314.1 1.6 5034.9 2911.2 4448.3 0 949.5 1386.1 2.95 76.2 6.3 28.6
2013 3516.7 2 5555.5 2957.5 4360 0 984.1 1126 3.04 75 5.7 28
2014 3513.1 1.6 5249 2235.2 3822.2 0 621.5 502.6 4.23 72.7 5 17.7
2015 3801.7 2.5 4663.8 1712.1 2846.2 0 810.1 501.7 4.66 70.5 6.3 21.3
2016 3929.7 2.3 4622.8 1729.9 2681.3 71.8 835.3 271.1 5.03 69.9 4.7 21.3
2017 4230.8 2.1 4967.3 2041.3 3001.4 33.8 858.9 588.2 5.44 70.8 4.7 20.3
Mauritius 2009 7309 1.2 9089.2 4635.1 5513.8 194.7 2178.8 256.7 21.81 0 17.7 29.8
2010 7920.9 1.3 10123.2 10188.5 11377.6 4638.6 2441.8 430 21.84 0 18.7 30.8
2011 9955.6 0.4 11549.9 6982.9 8663.6 600.7 2582.7 433.4 12.46 0 17.1 25.9
2012 10633.2 1.6 11708.4 8047.7 9017.2 1074.2 2836.7 589 28.13 0.8 26.7 26.7
2013 12423.7 2.4 12153.4 12267.9 12926.1 4330.9 3340.2 293.3 20.51 0.3 23.4 26.9
2014 11029.4 0.9 12479.2 14388.9 14728.9 5940.3 3614.7 418.4 49.71 1.1 32.6 32.8
2015 9022.2 1.3 11606.8 13073.2 13165.9 5566.1 3957 208.3 36.81 1.1 38.2 43.9
2016 10447.1 2.1 12167.9 14022.6 14185.8 6385 4504.2 349.4 14.78 2.2 44.1 43.1
2017 10483.4 0 13510.4 14845 15186 6657.7 5465.9 292.7 21.72 2.8 49.7 52.1
Mozambique 2009 4138.4 2.2 10634.8 2909.1 4898.4 239.9 2099.3 242.4 0.38 465.1 15.3 50.7
2010 4130.8 0.7 9813.3 2712.9 5220.2 217.7 2159.4 410.1 0.90 504.4 14.6 52.3
2011 4648.5 1.2 12941.2 3668.3 8001.3 272.1 2468.8 1402 0.56 133.1 5.6 53.1
2012 5489.8 2.4 14462.4 4780.7 12609.4 46.1 2770.2 216 0.60 174.4 6.3 50.5
2013 8517.4 2.1 15960.3 4902.4 12576.7 54.4 3142.3 959 1.10 330.1 8.4 36.9
2014 9450 0.8 16759.2 4769.2 11938.7 49.3 3010 553.2 1.47 133 4.6 31.9
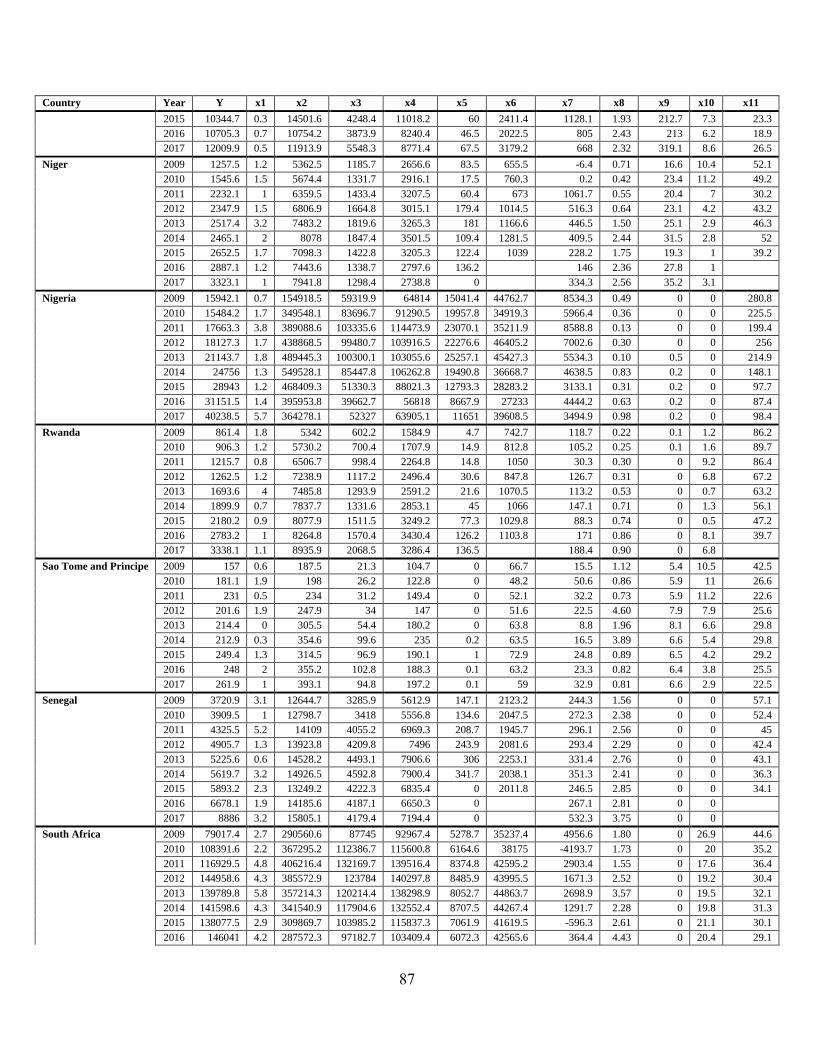
87
Country Year Y x1 x2 x3 x4 x5 x6 x7 x8 x9 x10 x11
2015 10344.7 0.3 14501.6 4248.4 11018.2 60 2411.4 1128.1 1.93 212.7 7.3 23.3
2016 10705.3 0.7 10754.2 3873.9 8240.4 46.5 2022.5 805 2.43 213 6.2 18.9
2017 12009.9 0.5 11913.9 5548.3 8771.4 67.5 3179.2 668 2.32 319.1 8.6 26.5
Niger 2009 1257.5 1.2 5362.5 1185.7 2656.6 83.5 655.5 -6.4 0.71 16.6 10.4 52.1
2010 1545.6 1.5 5674.4 1331.7 2916.1 17.5 760.3 0.2 0.42 23.4 11.2 49.2
2011 2232.1 1 6359.5 1433.4 3207.5 60.4 673 1061.7 0.55 20.4 7 30.2
2012 2347.9 1.5 6806.9 1664.8 3015.1 179.4 1014.5 516.3 0.64 23.1 4.2 43.2
2013 2517.4 3.2 7483.2 1819.6 3265.3 181 1166.6 446.5 1.50 25.1 2.9 46.3
2014 2465.1 2 8078 1847.4 3501.5 109.4 1281.5 409.5 2.44 31.5 2.8 52
2015 2652.5 1.7 7098.3 1422.8 3205.3 122.4 1039 228.2 1.75 19.3 1 39.2
2016 2887.1 1.2 7443.6 1338.7 2797.6 136.2 146 2.36 27.8 1
2017 3323.1 1 7941.8 1298.4 2738.8 0 334.3 2.56 35.2 3.1
Nigeria 2009 15942.1 0.7 154918.5 59319.9 64814 15041.4 44762.7 8534.3 0.49 0 0 280.8
2010 15484.2 1.7 349548.1 83696.7 91290.5 19957.8 34919.3 5966.4 0.36 0 0 225.5
2011 17663.3 3.8 389088.6 103335.6 114473.9 23070.1 35211.9 8588.8 0.13 0 0 199.4
2012 18127.3 1.7 438868.5 99480.7 103916.5 22276.6 46405.2 7002.6 0.30 0 0 256
2013 21143.7 1.8 489445.3 100300.1 103055.6 25257.1 45427.3 5534.3 0.10 0.5 0 214.9
2014 24756 1.3 549528.1 85447.8 106262.8 19490.8 36668.7 4638.5 0.83 0.2 0 148.1
2015 28943 1.2 468409.3 51330.3 88021.3 12793.3 28283.2 3133.1 0.31 0.2 0 97.7
2016 31151.5 1.4 395953.8 39662.7 56818 8667.9 27233 4444.2 0.63 0.2 0 87.4
2017 40238.5 5.7 364278.1 52327 63905.1 11651 39608.5 3494.9 0.98 0.2 0 98.4
Rwanda 2009 861.4 1.8 5342 602.2 1584.9 4.7 742.7 118.7 0.22 0.1 1.2 86.2
2010 906.3 1.2 5730.2 700.4 1707.9 14.9 812.8 105.2 0.25 0.1 1.6 89.7
2011 1215.7 0.8 6506.7 998.4 2264.8 14.8 1050 30.3 0.30 0 9.2 86.4
2012 1262.5 1.2 7238.9 1117.2 2496.4 30.6 847.8 126.7 0.31 0 6.8 67.2
2013 1693.6 4 7485.8 1293.9 2591.2 21.6 1070.5 113.2 0.53 0 0.7 63.2
2014 1899.9 0.7 7837.7 1331.6 2853.1 45 1066 147.1 0.71 0 1.3 56.1
2015 2180.2 0.9 8077.9 1511.5 3249.2 77.3 1029.8 88.3 0.74 0 0.5 47.2
2016 2783.2 1 8264.8 1570.4 3430.4 126.2 1103.8 171 0.86 0 8.1 39.7
2017 3338.1 1.1 8935.9 2068.5 3286.4 136.5 188.4 0.90 0 6.8
Sao Tome and Principe 2009 157 0.6 187.5 21.3 104.7 0 66.7 15.5 1.12 5.4 10.5 42.5
2010 181.1 1.9 198 26.2 122.8 0 48.2 50.6 0.86 5.9 11 26.6
2011 231 0.5 234 31.2 149.4 0 52.1 32.2 0.73 5.9 11.2 22.6
2012 201.6 1.9 247.9 34 147 0 51.6 22.5 4.60 7.9 7.9 25.6
2013 214.4 0 305.5 54.4 180.2 0 63.8 8.8 1.96 8.1 6.6 29.8
2014 212.9 0.3 354.6 99.6 235 0.2 63.5 16.5 3.89 6.6 5.4 29.8
2015 249.4 1.3 314.5 96.9 190.1 1 72.9 24.8 0.89 6.5 4.2 29.2
2016 248 2 355.2 102.8 188.3 0.1 63.2 23.3 0.82 6.4 3.8 25.5
2017 261.9 1 393.1 94.8 197.2 0.1 59 32.9 0.81 6.6 2.9 22.5
Senegal 2009 3720.9 3.1 12644.7 3285.9 5612.9 147.1 2123.2 244.3 1.56 0 0 57.1
2010 3909.5 1 12798.7 3418 5556.8 134.6 2047.5 272.3 2.38 0 0 52.4
2011 4325.5 5.2 14109 4055.2 6969.3 208.7 1945.7 296.1 2.56 0 0 45
2012 4905.7 1.3 13923.8 4209.8 7496 243.9 2081.6 293.4 2.29 0 0 42.4
2013 5225.6 0.6 14528.2 4493.1 7906.6 306 2253.1 331.4 2.76 0 0 43.1
2014 5619.7 3.2 14926.5 4592.8 7900.4 341.7 2038.1 351.3 2.41 0 0 36.3
2015 5893.2 2.3 13249.2 4222.3 6835.4 0 2011.8 246.5 2.85 0 0 34.1
2016 6678.1 1.9 14185.6 4187.1 6650.3 0 267.1 2.81 0 0
2017 8886 3.2 15805.1 4179.4 7194.4 0 532.3 3.75 0 0
South Africa 2009 79017.4 2.7 290560.6 87745 92967.4 5278.7 35237.4 4956.6 1.80 0 26.9 44.6
2010 108391.6 2.2 367295.2 112386.7 115600.8 6164.6 38175 -4193.7 1.73 0 20 35.2
2011 116929.5 4.8 406216.4 132169.7 139516.4 8374.8 42595.2 2903.4 1.55 0 17.6 36.4
2012 144958.6 4.3 385572.9 123784 140297.8 8485.9 43995.5 1671.3 2.52 0 19.2 30.4
2013 139789.8 5.8 357214.3 120214.4 138298.9 8052.7 44863.7 2698.9 3.57 0 19.5 32.1
2014 141598.6 4.3 341540.9 117904.6 132552.4 8707.5 44267.4 1291.7 2.28 0 19.8 31.3
2015 138077.5 2.9 309869.7 103985.2 115837.3 7061.9 41619.5 -596.3 2.61 0 21.1 30.1
2016 146041 4.2 287572.3 97182.7 103409.4 6072.3 42565.6 364.4 4.43 0 20.4 29.1
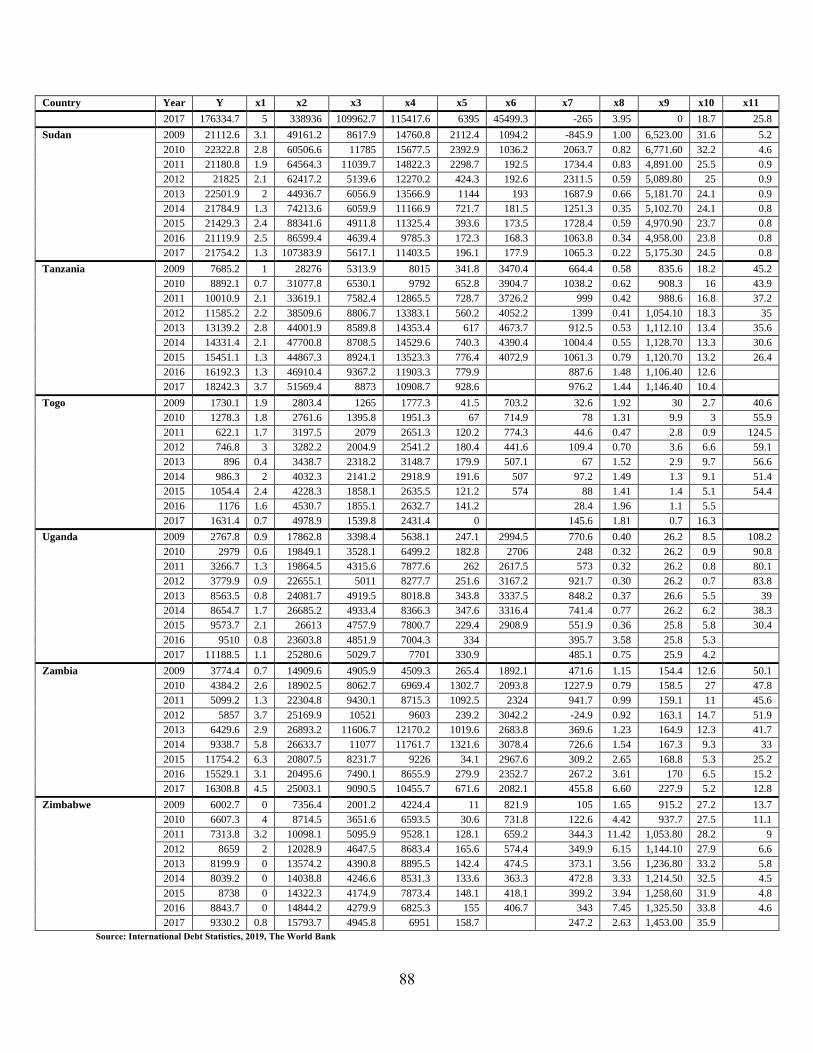
88
Country Year Y x1 x2 x3 x4 x5 x6 x7 x8 x9 x10 x11
2017 176334.7 5 338936 109962.7 115417.6 6395 45499.3 -265 3.95 0 18.7 25.8
Sudan 2009 21112.6 3.1 49161.2 8617.9 14760.8 2112.4 1094.2 -845.9 1.00 6,523.00 31.6 5.2
2010 22322.8 2.8 60506.6 11785 15677.5 2392.9 1036.2 2063.7 0.82 6,771.60 32.2 4.6
2011 21180.8 1.9 64564.3 11039.7 14822.3 2298.7 192.5 1734.4 0.83 4,891.00 25.5 0.9
2012 21825 2.1 62417.2 5139.6 12270.2 424.3 192.6 2311.5 0.59 5,089.80 25 0.9
2013 22501.9 2 44936.7 6056.9 13566.9 1144 193 1687.9 0.66 5,181.70 24.1 0.9
2014 21784.9 1.3 74213.6 6059.9 11166.9 721.7 181.5 1251.3 0.35 5,102.70 24.1 0.8
2015 21429.3 2.4 88341.6 4911.8 11325.4 393.6 173.5 1728.4 0.59 4,970.90 23.7 0.8
2016 21119.9 2.5 86599.4 4639.4 9785.3 172.3 168.3 1063.8 0.34 4,958.00 23.8 0.8
2017 21754.2 1.3 107383.9 5617.1 11403.5 196.1 177.9 1065.3 0.22 5,175.30 24.5 0.8
Tanzania 2009 7685.2 1 28276 5313.9 8015 341.8 3470.4 664.4 0.58 835.6 18.2 45.2
2010 8892.1 0.7 31077.8 6530.1 9792 652.8 3904.7 1038.2 0.62 908.3 16 43.9
2011 10010.9 2.1 33619.1 7582.4 12865.5 728.7 3726.2 999 0.42 988.6 16.8 37.2
2012 11585.2 2.2 38509.6 8806.7 13383.1 560.2 4052.2 1399 0.41 1,054.10 18.3 35
2013 13139.2 2.8 44001.9 8589.8 14353.4 617 4673.7 912.5 0.53 1,112.10 13.4 35.6
2014 14331.4 2.1 47700.8 8708.5 14529.6 740.3 4390.4 1004.4 0.55 1,128.70 13.3 30.6
2015 15451.1 1.3 44867.3 8924.1 13523.3 776.4 4072.9 1061.3 0.79 1,120.70 13.2 26.4
2016 16192.3 1.3 46910.4 9367.2 11903.3 779.9 887.6 1.48 1,106.40 12.6
2017 18242.3 3.7 51569.4 8873 10908.7 928.6 976.2 1.44 1,146.40 10.4
Togo 2009 1730.1 1.9 2803.4 1265 1777.3 41.5 703.2 32.6 1.92 30 2.7 40.6
2010 1278.3 1.8 2761.6 1395.8 1951.3 67 714.9 78 1.31 9.9 3 55.9
2011 622.1 1.7 3197.5 2079 2651.3 120.2 774.3 44.6 0.47 2.8 0.9 124.5
2012 746.8 3 3282.2 2004.9 2541.2 180.4 441.6 109.4 0.70 3.6 6.6 59.1
2013 896 0.4 3438.7 2318.2 3148.7 179.9 507.1 67 1.52 2.9 9.7 56.6
2014 986.3 2 4032.3 2141.2 2918.9 191.6 507 97.2 1.49 1.3 9.1 51.4
2015 1054.4 2.4 4228.3 1858.1 2635.5 121.2 574 88 1.41 1.4 5.1 54.4
2016 1176 1.6 4530.7 1855.1 2632.7 141.2 28.4 1.96 1.1 5.5
2017 1631.4 0.7 4978.9 1539.8 2431.4 0 145.6 1.81 0.7 16.3
Uganda 2009 2767.8 0.9 17862.8 3398.4 5638.1 247.1 2994.5 770.6 0.40 26.2 8.5 108.2
2010 2979 0.6 19849.1 3528.1 6499.2 182.8 2706 248 0.32 26.2 0.9 90.8
2011 3266.7 1.3 19864.5 4315.6 7877.6 262 2617.5 573 0.32 26.2 0.8 80.1
2012 3779.9 0.9 22655.1 5011 8277.7 251.6 3167.2 921.7 0.30 26.2 0.7 83.8
2013 8563.5 0.8 24081.7 4919.5 8018.8 343.8 3337.5 848.2 0.37 26.6 5.5 39
2014 8654.7 1.7 26685.2 4933.4 8366.3 347.6 3316.4 741.4 0.77 26.2 6.2 38.3
2015 9573.7 2.1 26613 4757.9 7800.7 229.4 2908.9 551.9 0.36 25.8 5.8 30.4
2016 9510 0.8 23603.8 4851.9 7004.3 334 395.7 3.58 25.8 5.3
2017 11188.5 1.1 25280.6 5029.7 7701 330.9 485.1 0.75 25.9 4.2
Zambia 2009 3774.4 0.7 14909.6 4905.9 4509.3 265.4 1892.1 471.6 1.15 154.4 12.6 50.1
2010 4384.2 2.6 18902.5 8062.7 6969.4 1302.7 2093.8 1227.9 0.79 158.5 27 47.8
2011 5099.2 1.3 22304.8 9430.1 8715.3 1092.5 2324 941.7 0.99 159.1 11 45.6
2012 5857 3.7 25169.9 10521 9603 239.2 3042.2 -24.9 0.92 163.1 14.7 51.9
2013 6429.6 2.9 26893.2 11606.7 12170.2 1019.6 2683.8 369.6 1.23 164.9 12.3 41.7
2014 9338.7 5.8 26633.7 11077 11761.7 1321.6 3078.4 726.6 1.54 167.3 9.3 33
2015 11754.2 6.3 20807.5 8231.7 9226 34.1 2967.6 309.2 2.65 168.8 5.3 25.2
2016 15529.1 3.1 20495.6 7490.1 8655.9 279.9 2352.7 267.2 3.61 170 6.5 15.2
2017 16308.8 4.5 25003.1 9090.5 10455.7 671.6 2082.1 455.8 6.60 227.9 5.2 12.8
Zimbabwe 2009 6002.7 0 7356.4 2001.2 4224.4 11 821.9 105 1.65 915.2 27.2 13.7
2010 6607.3 4 8714.5 3651.6 6593.5 30.6 731.8 122.6 4.42 937.7 27.5 11.1
2011 7313.8 3.2 10098.1 5095.9 9528.1 128.1 659.2 344.3 11.42 1,053.80 28.2 9
2012 8659 2 12028.9 4647.5 8683.4 165.6 574.4 349.9 6.15 1,144.10 27.9 6.6
2013 8199.9 0 13574.2 4390.8 8895.5 142.4 474.5 373.1 3.56 1,236.80 33.2 5.8
2014 8039.2 0 14038.8 4246.6 8531.3 133.6 363.3 472.8 3.33 1,214.50 32.5 4.5
2015 8738 0 14322.3 4174.9 7873.4 148.1 418.1 399.2 3.94 1,258.60 31.9 4.8
2016 8843.7 0 14844.2 4279.9 6825.3 155 406.7 343 7.45 1,325.50 33.8 4.6
2017 9330.2 0.8 15793.7 4945.8 6951 158.7 247.2 2.63 1,453.00 35.9
Source: International Debt Statistics, 2019, The World Bank
89
Debt is panel regressed with all other variables – interest rate, gross national income (GNI),
exports, imports, income from foreign direct investment (FDI), international reserves, and
foreign direct investment. The figures are comparatively far larger than the interest rate and had
to be normalised. Natural logarithm of debt was used, and quotient of other variables, e.g.,
export-to-import, reserves-to-imports, FDI-to-GNI, short term-to-total debt, and reserves to debt
ratios.
4.3 Results
The first presentation comprises the Hausman test for determining the suitable model between
fixed and random effects. Preliminary results comprise eleven regression models, differing by
number of predictor variables, in increasing order. Gradual inclusion of independent variables in
the model was to see if they have impact on the interest rate (variable of interest). Robustness
checks have been carried out on the coefficients to determine their statistical significance. This
test has been run for one data set comprising all SSA countries, and not repeated for different
clusters.
The last test, collinearity, has been carried out to mitigate the risks of its damaging effect on the
regression model. This effect manifests in the risky interpretation of coefficients as indicators of
predictor variables’ importance (Keller, 2012:713–714; Schindler, 2014:577). Correlation tests
were run first, to establish the possibility of collinearity, especially correlation coefficient of 0.8
and above. Eliminating one of the correlating variables is one of the approaches to minimise the
effect of multicollinearity. Another is creating a new variable made up of highly intercorrelated
variables and using new variables in place of its components (Schindler, 2014:578).
Regressions are then carried out for various clusters and results presented in tables, with analysis
immediately after the table. All countries’ sample data analysis included thorough reporting on
the specific changes in quantities of one variable as a response to the change in another variable.
Analyses of various clusters mainly focused on the similarities of the model with all countries’
regression model. Similarities indicate the overall phenomenon linking all clusters with all the
countries’ sample results. Differences highlight the uniqueness of specific country categories and
economic imperatives matching their situation.
(i) Hausman tests
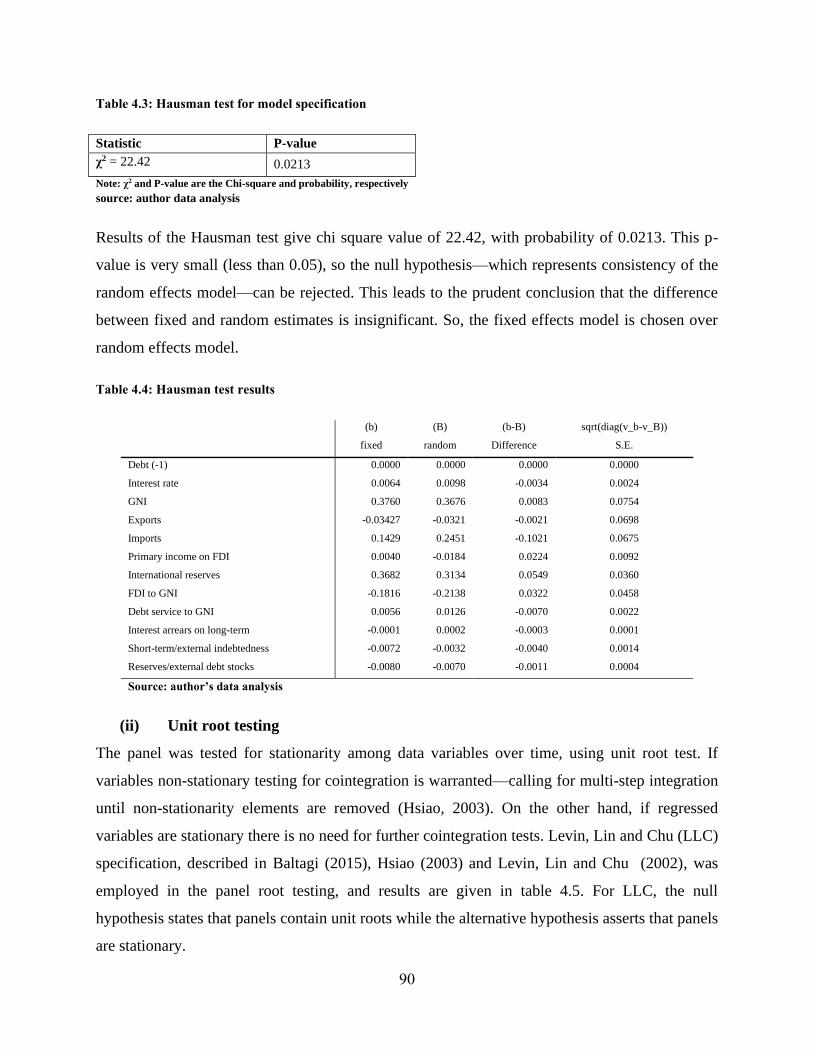
90
Table 4.3: Hausman test for model specification
Statistic P-value
χ2 = 22.42 0.0213
Note: χ2 and P-value are the Chi-square and probability, respectively
source: author data analysis
Results of the Hausman test give chi square value of 22.42, with probability of 0.0213. This p-
value is very small (less than 0.05), so the null hypothesis—which represents consistency of the
random effects model—can be rejected. This leads to the prudent conclusion that the difference
between fixed and random estimates is insignificant. So, the fixed effects model is chosen over
random effects model.
Table 4.4: Hausman test results
(b)
fixed
(B)
random
(b-B)
Difference
sqrt(diag(v_b-v_B))
S.E.
Debt (-1) 0.0000 0.0000 0.0000 0.0000
Interest rate 0.0064 0.0098 -0.0034 0.0024
GNI 0.3760 0.3676 0.0083 0.0754
Exports -0.03427 -0.0321 -0.0021 0.0698
Imports 0.1429 0.2451 -0.1021 0.0675
Primary income on FDI 0.0040 -0.0184 0.0224 0.0092
International reserves 0.3682 0.3134 0.0549 0.0360
FDI to GNI -0.1816 -0.2138 0.0322 0.0458
Debt service to GNI 0.0056 0.0126 -0.0070 0.0022
Interest arrears on long-term -0.0001 0.0002 -0.0003 0.0001
Short-term/external indebtedness -0.0072 -0.0032 -0.0040 0.0014
Reserves/external debt stocks -0.0080 -0.0070 -0.0011 0.0004
Source: author’s data analysis
(ii) Unit root testing
The panel was tested for stationarity among data variables over time, using unit root test. If
variables non-stationary testing for cointegration is warranted—calling for multi-step integration
until non-stationarity elements are removed (Hsiao, 2003). On the other hand, if regressed
variables are stationary there is no need for further cointegration tests. Levin, Lin and Chu (LLC)
specification, described in Baltagi (2015), Hsiao (2003) and Levin, Lin and Chu (2002), was
employed in the panel root testing, and results are given in table 4.5. For LLC, the null
hypothesis states that panels contain unit roots while the alternative hypothesis asserts that panels
are stationary.
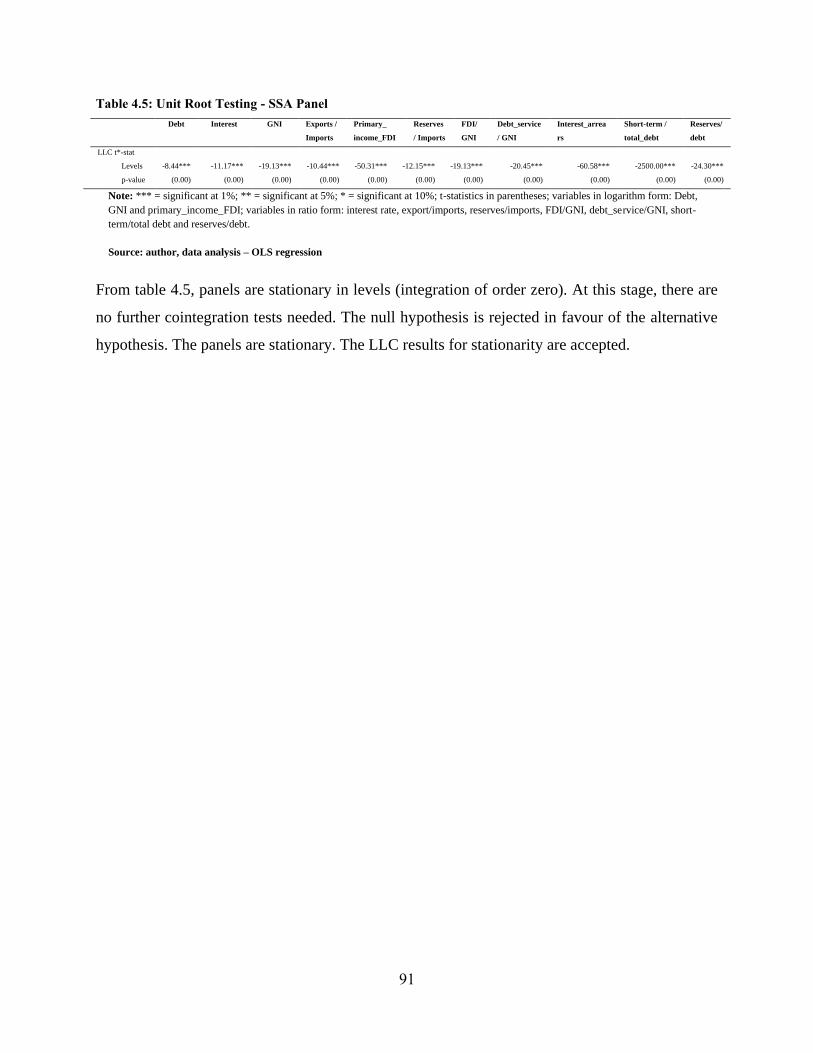
91
Table 4.5: Unit Root Testing - SSA Panel
Debt Interest GNI Exports /
Imports
Primary_
income_FDI
Reserves
/ Imports
FDI/
GNI
Debt_service
/ GNI
Interest_arrea
rs
Short-term /
total_debt
Reserves/
debt
LLC t*-stat
Levels -8.44*** -11.17*** -19.13*** -10.44*** -50.31*** -12.15*** -19.13*** -20.45*** -60.58*** -2500.00*** -24.30***
p-value (0.00) (0.00) (0.00) (0.00) (0.00) (0.00) (0.00) (0.00) (0.00) (0.00) (0.00)
Note: *** = significant at 1%; ** = significant at 5%; * = significant at 10%; t-statistics in parentheses; variables in logarithm form: Debt,
GNI and primary_income_FDI; variables in ratio form: interest rate, export/imports, reserves/imports, FDI/GNI, debt_service/GNI, short-
term/total debt and reserves/debt.
Source: author, data analysis – OLS regression
From table 4.5, panels are stationary in levels (integration of order zero). At this stage, there are
no further cointegration tests needed. The null hypothesis is rejected in favour of the alternative
hypothesis. The panels are stationary. The LLC results for stationarity are accepted.
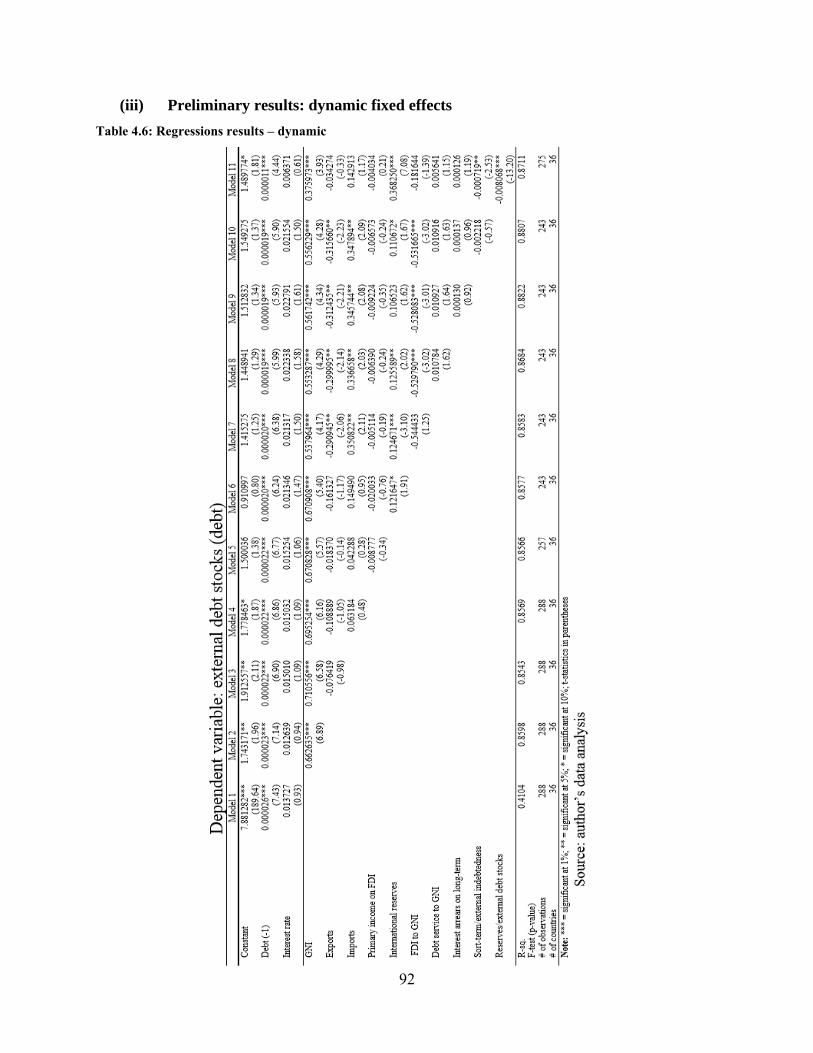
92
(iii) Preliminary results: dynamic fixed effects
Table 4.6: Regressions results – dynamic
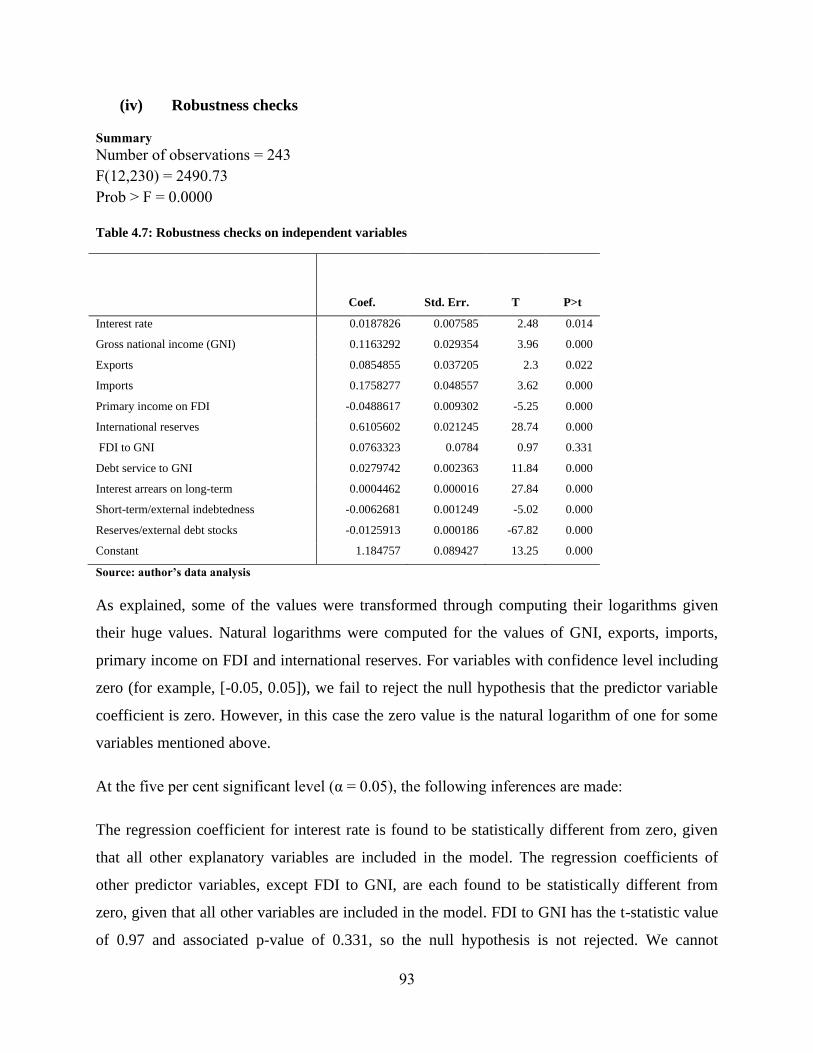
93
(iv) Robustness checks
Summary
Number of observations = 243
F(12,230) = 2490.73
Prob > F = 0.0000
Table 4.7: Robustness checks on independent variables
Coef.
Std. Err.
T
P>t
Interest rate 0.0187826 0.007585 2.48 0.014
Gross national income (GNI) 0.1163292 0.029354 3.96 0.000
Exports 0.0854855 0.037205 2.3 0.022
Imports 0.1758277 0.048557 3.62 0.000
Primary income on FDI -0.0488617 0.009302 -5.25 0.000
International reserves 0.6105602 0.021245 28.74 0.000
FDI to GNI 0.0763323 0.0784 0.97 0.331
Debt service to GNI 0.0279742 0.002363 11.84 0.000
Interest arrears on long-term 0.0004462 0.000016 27.84 0.000
Short-term/external indebtedness -0.0062681 0.001249 -5.02 0.000
Reserves/external debt stocks -0.0125913 0.000186 -67.82 0.000
Constant 1.184757 0.089427 13.25 0.000
Source: author’s data analysis
As explained, some of the values were transformed through computing their logarithms given
their huge values. Natural logarithms were computed for the values of GNI, exports, imports,
primary income on FDI and international reserves. For variables with confidence level including
zero (for example, [-0.05, 0.05]), we fail to reject the null hypothesis that the predictor variable
coefficient is zero. However, in this case the zero value is the natural logarithm of one for some
variables mentioned above.
At the five per cent significant level (α = 0.05), the following inferences are made:
The regression coefficient for interest rate is found to be statistically different from zero, given
that all other explanatory variables are included in the model. The regression coefficients of
other predictor variables, except FDI to GNI, are each found to be statistically different from
zero, given that all other variables are included in the model. FDI to GNI has the t-statistic value
of 0.97 and associated p-value of 0.331, so the null hypothesis is not rejected. We cannot
94
conclude that the regression coefficient of FDI to GNI has been found to be statistically different
from zero, given the inclusion of other explanatory variables in the model. In all but one
variable, the null hypothesis can be rejected since coefficients are statistically different from
zero.
(v) Correlations
Table 4.8: Correlation coefficients (SSA countries)
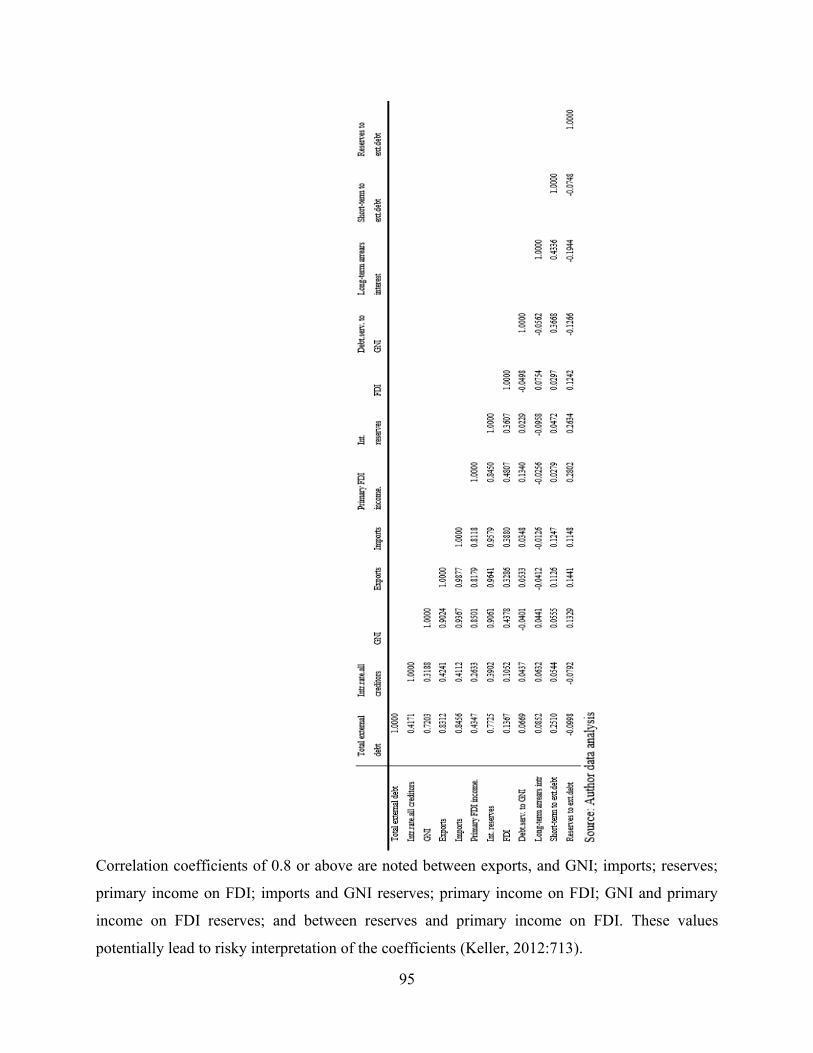
95
Correlation coefficients of 0.8 or above are noted between exports, and GNI; imports; reserves;
primary income on FDI; imports and GNI reserves; primary income on FDI; GNI and primary
income on FDI reserves; and between reserves and primary income on FDI. These values
potentially lead to risky interpretation of the coefficients (Keller, 2012:713).
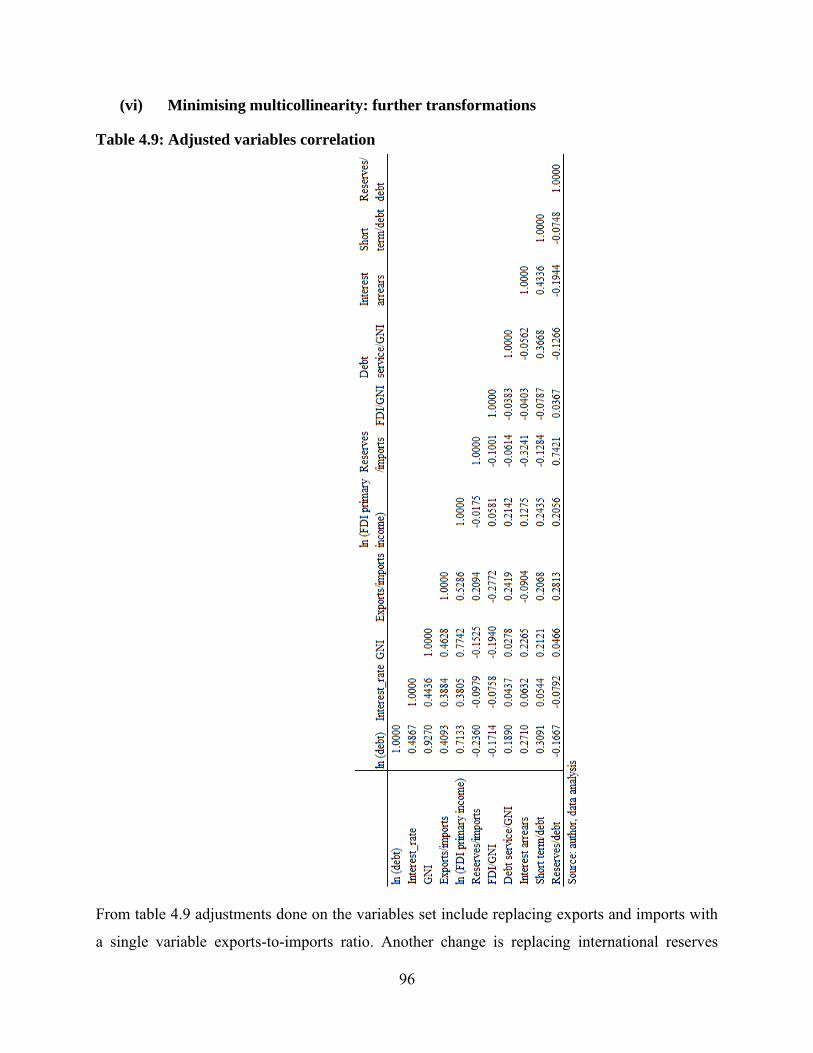
96
(vi) Minimising multicollinearity: further transformations
Table 4.9: Adjusted variables correlation
From table 4.9 adjustments done on the variables set include replacing exports and imports with
a single variable exports-to-imports ratio. Another change is replacing international reserves
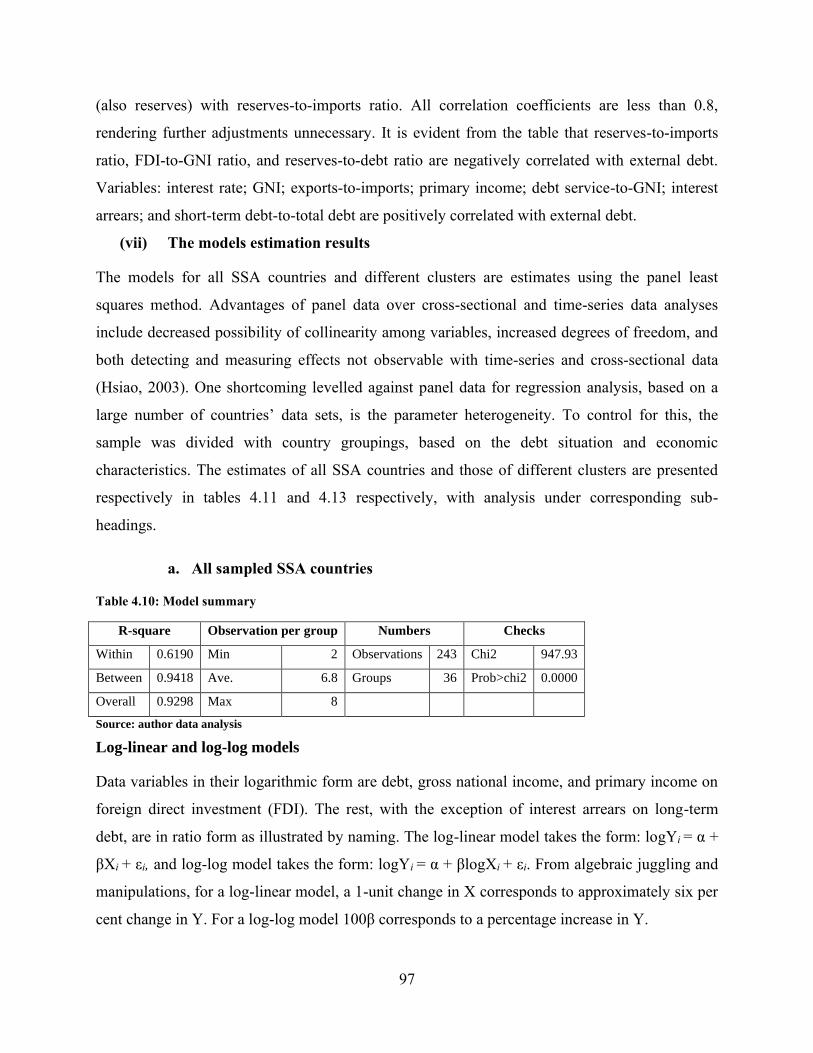
97
(also reserves) with reserves-to-imports ratio. All correlation coefficients are less than 0.8,
rendering further adjustments unnecessary. It is evident from the table that reserves-to-imports
ratio, FDI-to-GNI ratio, and reserves-to-debt ratio are negatively correlated with external debt.
Variables: interest rate; GNI; exports-to-imports; primary income; debt service-to-GNI; interest
arrears; and short-term debt-to-total debt are positively correlated with external debt.
(vii) The models estimation results
The models for all SSA countries and different clusters are estimates using the panel least
squares method. Advantages of panel data over cross-sectional and time-series data analyses
include decreased possibility of collinearity among variables, increased degrees of freedom, and
both detecting and measuring effects not observable with time-series and cross-sectional data
(Hsiao, 2003). One shortcoming levelled against panel data for regression analysis, based on a
large number of countries’ data sets, is the parameter heterogeneity. To control for this, the
sample was divided with country groupings, based on the debt situation and economic
characteristics. The estimates of all SSA countries and those of different clusters are presented
respectively in tables 4.11 and 4.13 respectively, with analysis under corresponding sub-
headings.
a. All sampled SSA countries
Table 4.10: Model summary
R-square Observation per group Numbers Checks
Within 0.6190 Min 2 Observations 243 Chi2 947.93
Between 0.9418 Ave. 6.8 Groups 36 Prob>chi2 0.0000
Overall 0.9298 Max 8
Source: author data analysis
Log-linear and log-log models
Data variables in their logarithmic form are debt, gross national income, and primary income on
foreign direct investment (FDI). The rest, with the exception of interest arrears on long-term
debt, are in ratio form as illustrated by naming. The log-linear model takes the form: logYi = α +
βXi + εi, and log-log model takes the form: logYi = α + βlogXi + εi. From algebraic juggling and
manipulations, for a log-linear model, a 1-unit change in X corresponds to approximately six per
cent change in Y. For a log-log model 100β corresponds to a percentage increase in Y.
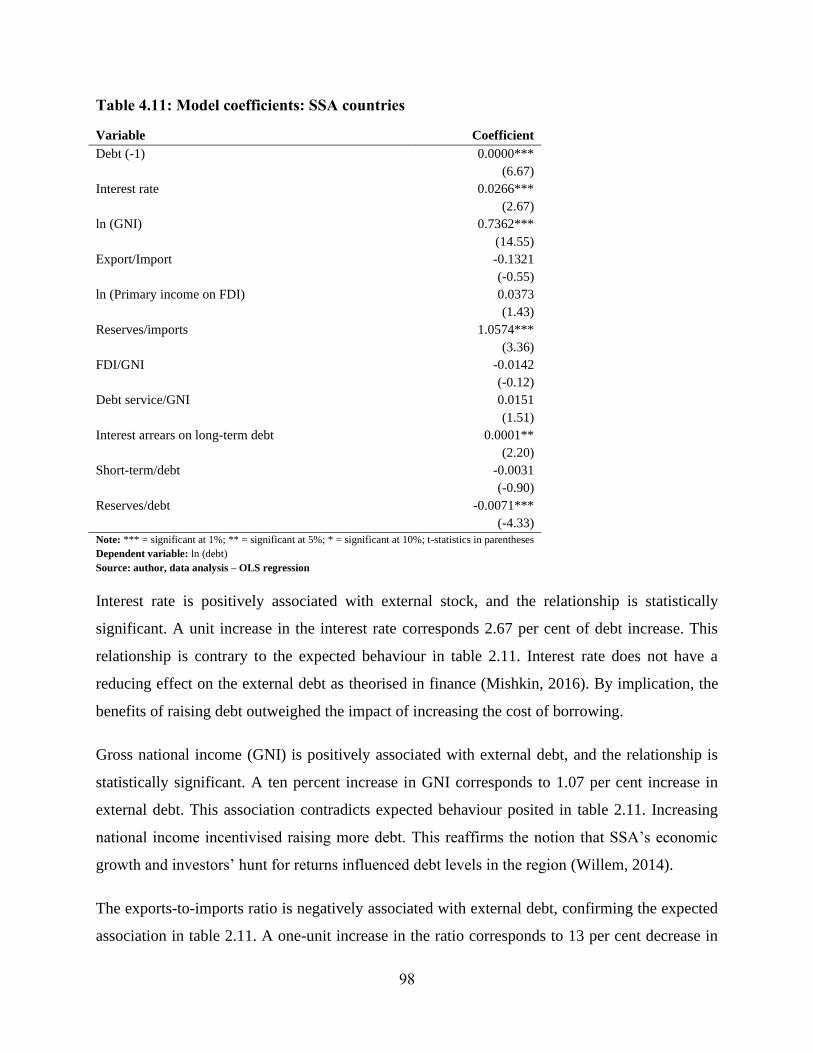
98
Table 4.11: Model coefficients: SSA countries
Variable Coefficient
Debt (-1) 0.0000***
(6.67)
Interest rate 0.0266***
(2.67)
ln (GNI) 0.7362***
(14.55)
Export/Import -0.1321
(-0.55)
ln (Primary income on FDI) 0.0373
(1.43)
Reserves/imports 1.0574***
(3.36)
FDI/GNI -0.0142
(-0.12)
Debt service/GNI 0.0151
(1.51)
Interest arrears on long-term debt 0.0001**
(2.20)
Short-term/debt -0.0031
(-0.90)
Reserves/debt -0.0071***
(-4.33)
Note: *** = significant at 1%; ** = significant at 5%; * = significant at 10%; t-statistics in parentheses
Dependent variable: ln (debt)
Source: author, data analysis – OLS regression
Interest rate is positively associated with external stock, and the relationship is statistically
significant. A unit increase in the interest rate corresponds 2.67 per cent of debt increase. This
relationship is contrary to the expected behaviour in table 2.11. Interest rate does not have a
reducing effect on the external debt as theorised in finance (Mishkin, 2016). By implication, the
benefits of raising debt outweighed the impact of increasing the cost of borrowing.
Gross national income (GNI) is positively associated with external debt, and the relationship is
statistically significant. A ten percent increase in GNI corresponds to 1.07 per cent increase in
external debt. This association contradicts expected behaviour posited in table 2.11. Increasing
national income incentivised raising more debt. This reaffirms the notion that SSA’s economic
growth and investors’ hunt for returns influenced debt levels in the region (Willem, 2014).
The exports-to-imports ratio is negatively associated with external debt, confirming the expected
association in table 2.11. A one-unit increase in the ratio corresponds to 13 per cent decrease in
99
debt. This debt and exports-to-imports ratio relationship is not statistically significant. As
discussed in earlier literature, exports have a reducing effect on external debt. This is because
exports help in building international reserves, which are used for servicing debt (Waheed,
2017).
Primary income from FDI is positively associated with external debt. This outcome confirms the
expectation in table 2.11, albeit not being statistically significant. A ten per cent increase in the
primary income on FDI corresponds to one per cent increase in external debt. This result
reaffirms a theorised and empirically proven impact of FDI on debt-raising ability. Strong and
well established FDI affords the host country increased income in addition to other positive
externalities in the form of royalties, fees, and taxation (Behname, 2012; Willem, 2014).
Change in reserves-to-imports ratio has explanatory power over change in external debt and the
relationship is positive. This reaffirms the expected behaviour in table 2.11 since reserves move
in the same but imports in the opposite direction to debt. Import cover ratio and debt relationship
is also statistically significant. One unit increase in the ratio corresponds to 106 per cent increase
in external debt, translating to one per cent change in reserves, corresponding to 1.06 per cent
change in debt. Reserves afford sovereigns the ability to service foreign-currency-denominated
debt and, inevitably, incentivise raising of external debt (Akpan, 2016; Fukuda & Kon, 2010).
FDI-to-GNI ratio is negatively associated with external debt. This result reaffirms the expected
behaviour in table 2.11 (positive, divided by negative, yields negative). However, the
relationship is not statistically significant. One unit increase in FDI-to-GNI ratio corresponds to
1.4 per cent decrease in external debt. The decreasing effect of FDI on the external debt is
premised on local income increasing, and on its debt-raising, disincentivising nature.
The debt service-to-GNI ratio is positively associated with external debt, although the
relationship is not statistically significant. This relationship is contrary to posited expected
behaviour in table 2.11. One unit increase in the ratio corresponds to 1.5 per cent increase in
external debt. Increased debt service may indicate affordability and increased creditworthiness.
Lending to credit-worthy sovereigns becomes easier for investors, while for less credit-
worthiness counterparts, there is evidence of increasing debt-service with increasing debt
(Copelovitch, Gandrud & Hallerberg, 2018; Megliani, 2015).
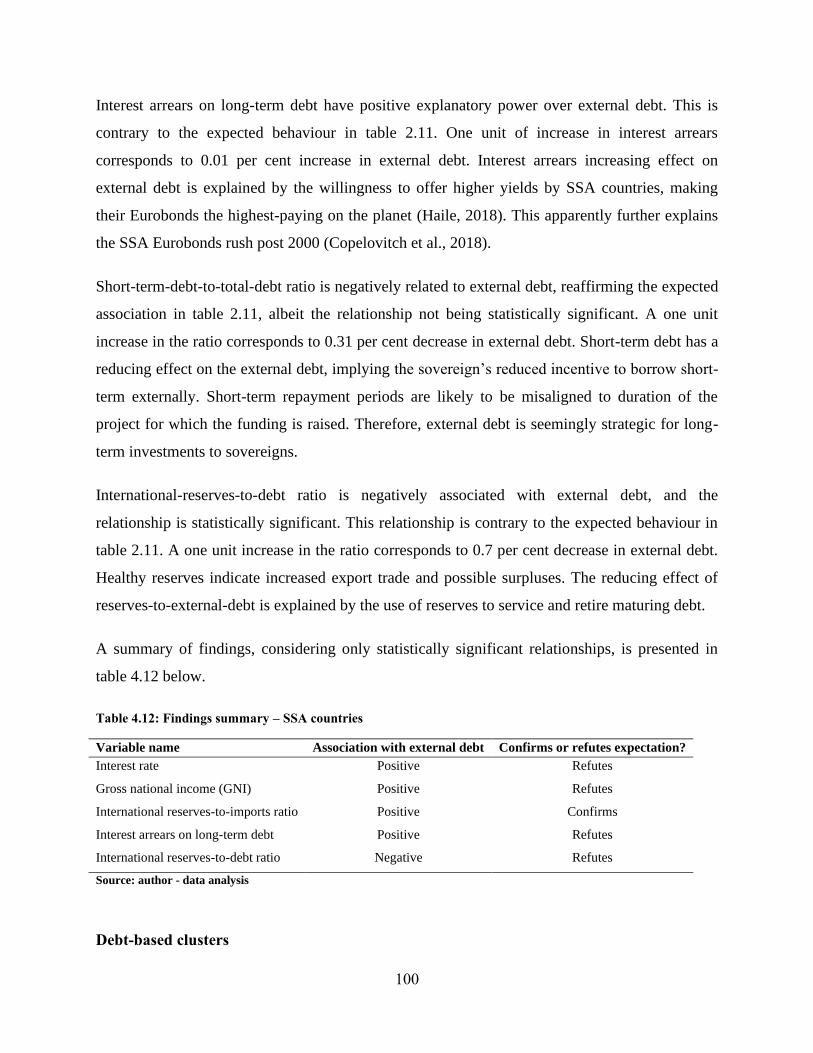
100
Interest arrears on long-term debt have positive explanatory power over external debt. This is
contrary to the expected behaviour in table 2.11. One unit of increase in interest arrears
corresponds to 0.01 per cent increase in external debt. Interest arrears increasing effect on
external debt is explained by the willingness to offer higher yields by SSA countries, making
their Eurobonds the highest-paying on the planet (Haile, 2018). This apparently further explains
the SSA Eurobonds rush post 2000 (Copelovitch et al., 2018).
Short-term-debt-to-total-debt ratio is negatively related to external debt, reaffirming the expected
association in table 2.11, albeit the relationship not being statistically significant. A one unit
increase in the ratio corresponds to 0.31 per cent decrease in external debt. Short-term debt has a
reducing effect on the external debt, implying the sovereign’s reduced incentive to borrow short-
term externally. Short-term repayment periods are likely to be misaligned to duration of the
project for which the funding is raised. Therefore, external debt is seemingly strategic for long-
term investments to sovereigns.
International-reserves-to-debt ratio is negatively associated with external debt, and the
relationship is statistically significant. This relationship is contrary to the expected behaviour in
table 2.11. A one unit increase in the ratio corresponds to 0.7 per cent decrease in external debt.
Healthy reserves indicate increased export trade and possible surpluses. The reducing effect of
reserves-to-external-debt is explained by the use of reserves to service and retire maturing debt.
A summary of findings, considering only statistically significant relationships, is presented in
table 4.12 below.
Table 4.12: Findings summary – SSA countries
Variable name Association with external debt Confirms or refutes expectation?
Interest rate Positive Refutes
Gross national income (GNI) Positive Refutes
International reserves-to-imports ratio Positive Confirms
Interest arrears on long-term debt Positive Refutes
International reserves-to-debt ratio Negative Refutes
Source: author - data analysis
Debt-based clusters
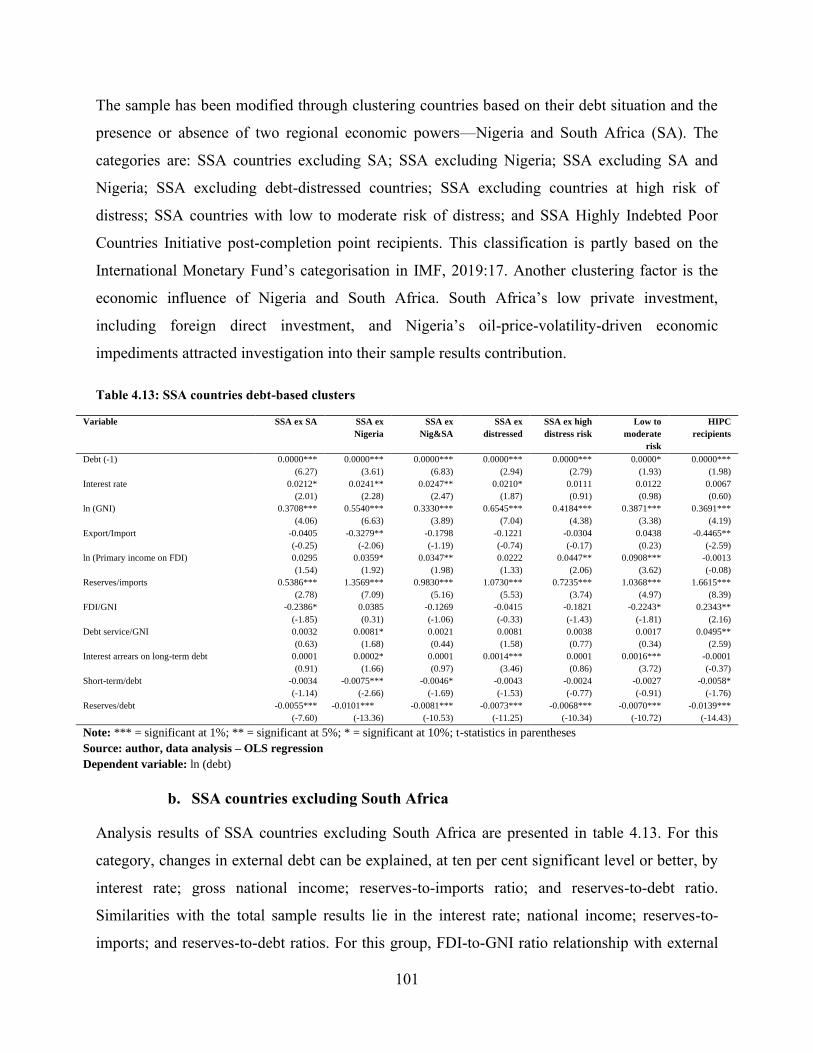
101
The sample has been modified through clustering countries based on their debt situation and the
presence or absence of two regional economic powers—Nigeria and South Africa (SA). The
categories are: SSA countries excluding SA; SSA excluding Nigeria; SSA excluding SA and
Nigeria; SSA excluding debt-distressed countries; SSA excluding countries at high risk of
distress; SSA countries with low to moderate risk of distress; and SSA Highly Indebted Poor
Countries Initiative post-completion point recipients. This classification is partly based on the
International Monetary Fund’s categorisation in IMF, 2019:17. Another clustering factor is the
economic influence of Nigeria and South Africa. South Africa’s low private investment,
including foreign direct investment, and Nigeria’s oil-price-volatility-driven economic
impediments attracted investigation into their sample results contribution.
Table 4.13: SSA countries debt-based clusters
Variable SSA ex SA SSA ex
Nigeria
SSA ex
Nig&SA
SSA ex
distressed
SSA ex high
distress risk
Low to
moderate
risk
HIPC
recipients
Debt (-1) 0.0000***
(6.27)
0.0000***
(3.61)
0.0000***
(6.83)
0.0000***
(2.94)
0.0000***
(2.79)
0.0000*
(1.93)
0.0000***
(1.98)
Interest rate 0.0212*
(2.01)
0.0241**
(2.28)
0.0247**
(2.47)
0.0210*
(1.87)
0.0111
(0.91)
0.0122
(0.98)
0.0067
(0.60)
ln (GNI) 0.3708***
(4.06)
0.5540***
(6.63)
0.3330***
(3.89)
0.6545***
(7.04)
0.4184***
(4.38)
0.3871***
(3.38)
0.3691***
(4.19)
Export/Import -0.0405
(-0.25)
-0.3279**
(-2.06)
-0.1798
(-1.19)
-0.1221
(-0.74)
-0.0304
(-0.17)
0.0438
(0.23)
-0.4465**
(-2.59)
ln (Primary income on FDI) 0.0295
(1.54)
0.0359*
(1.92)
0.0347**
(1.98)
0.0222
(1.33)
0.0447**
(2.06)
0.0908***
(3.62)
-0.0013
(-0.08)
Reserves/imports 0.5386***
(2.78)
1.3569***
(7.09)
0.9830***
(5.16)
1.0730***
(5.53)
0.7235***
(3.74)
1.0368***
(4.97)
1.6615***
(8.39)
FDI/GNI -0.2386*
(-1.85)
0.0385
(0.31)
-0.1269
(-1.06)
-0.0415
(-0.33)
-0.1821
(-1.43)
-0.2243*
(-1.81)
0.2343**
(2.16)
Debt service/GNI 0.0032
(0.63)
0.0081*
(1.68)
0.0021
(0.44)
0.0081
(1.58)
0.0038
(0.77)
0.0017
(0.34)
0.0495**
(2.59)
Interest arrears on long-term debt 0.0001
(0.91)
0.0002*
(1.66)
0.0001
(0.97)
0.0014***
(3.46)
0.0001
(0.86)
0.0016***
(3.72)
-0.0001
(-0.37)
Short-term/debt -0.0034
(-1.14)
-0.0075***
(-2.66)
-0.0046*
(-1.69)
-0.0043
(-1.53)
-0.0024
(-0.77)
-0.0027
(-0.91)
-0.0058*
(-1.76)
Reserves/debt -0.0055***
(-7.60)
-0.0101***
(-13.36)
-0.0081***
(-10.53)
-0.0073***
(-11.25)
-0.0068***
(-10.34)
-0.0070***
(-10.72)
-0.0139***
(-14.43)
Note: *** = significant at 1%; ** = significant at 5%; * = significant at 10%; t-statistics in parentheses
Source: author, data analysis – OLS regression
Dependent variable: ln (debt)
b. SSA countries excluding South Africa
Analysis results of SSA countries excluding South Africa are presented in table 4.13. For this
category, changes in external debt can be explained, at ten per cent significant level or better, by
interest rate; gross national income; reserves-to-imports ratio; and reserves-to-debt ratio.
Similarities with the total sample results lie in the interest rate; national income; reserves-to-
imports; and reserves-to-debt ratios. For this group, FDI-to-GNI ratio relationship with external
102
debt is statistically significant. Slow FDI in South Africa explains its increased significance in
the sample once South Africa is excluded.
c. SSA countries excluding Nigeria
For this category, a statistically significant relationship exists between external debt and interest
rate; national income; exports-to-imports ratio; reserves-to-imports ratio; debt-service-to-
national-income ratio; interest arrears on long-term debt; short-term-to-total-debt ratio; and
reserves-to-total-debt ratio. Results are similar to those of the total sample, except for exports-to-
imports, debt-service-to-GNI and short-term-to-total-debt ratio. Excluding Nigeria from the
sample gives three factors—exports-to-imports ratio, debt service-to-GNI ratio, and short-term-
to-total-debt ratio—explanatory power over changes in debt. Volatility in oil prices can explain
the impact of Nigeria’s exclusion from the sample. Exports, debt- service and short-term
borrowing have been negatively affected by this volatility.
d. SSA countries excluding Nigeria and South Africa
Results are similar to those of the total sample for interest rate, GNI, reserves-to-imports ratio
and reserves-to-debt ratio. The difference lies in the statistically significant relationship between
external debt and primary income on FDI and short-term-to-total-debt ratio. Slow private
investment in South Africa and oil-price-volatility-driven decline in short-term debt for Nigeria,
can explain this difference. Oil-exporting countries have surpluses and reserves affording them
ability to service short-term liabilities (Waheed, 2017). Nigeria and South Africa are the largest
economies in the region, and their exclusion in the sample (individually and collectively)
becomes the source of difference.
e. SSA excluding debt-distressed countries
The results resemble those of the total sample in interest rate; GNI; reserves-to-imports ratio;
interest arrears on long-term debt; and reserves-to-debt ratio. Excluding debt-distressed countries
from the sample virtually makes no difference to the results. By implication, the contribution of
these countries is not so substantial that it can cause a shift in the observation. The economic
character of debt-distressed countries can explain this state of affairs—they are mostly poor with
sizeable debts and borrowing capacities. This is different from the case of South Africa and
Nigeria, whose exclusion caused some noticeable difference in the results.
103
f. SSA excluding countries at high risk of distress
The similarity of these results to those of the total sample lie in the GNI, reserves-to-imports
ratio, and reserves-to-debt ratio. The difference is caused by the absence of interest rate and
interest arrears on long-term debt, and the presence of primary income on FDI in the current
results. Countries at high risk of distress are relatively larger in economic size (representing 16
per cent of regional GDP), and were able to increase borrowing, helping to explain differences in
the results caused by their exclusion. By implication, their cost of borrowing had an increasing
effect on the external debt: investors lent them more as yields on their debt increased. It is this
increased borrowing against the increasing interest rate that landed them in the distress-risk
situation.
g. Countries with low to moderate risk of distress
Results of this category are similar to those of the total sample in the GNI, reserves-to-imports
ratio, interest arrears on long-term debt, and reserves-to-debt ratio explanatory relationship with
external debt. Difference lies in the absence of interest rate, and presence of primary income on
FDI and FDI-to-GNI ratio in the explanatory variables for this group. FDI has a vital
developmental role in this category and evidently on the debt borrowing behaviour, instead of
interest rate as expected (Mishkin, 2016). By implication, FDI is important to the economic
health of countries in this category. Their borrowing behaviour is ignorant of the cost, explaining
the cause of their current debt situation.
h. HIPC recipients (post-completion)
The similarities of this group to the total sample lie in the explanatory power of GNI, reserves-
to-imports ratio, and reserves-to-debt ratio. In this category though, as opposed to the total
sample, interest rates and interest arrears on long-term debt do not have explanatory power on
debt. On the other hand, exports-to-imports ratio, FDI-to-GNI ratio, debt service-to-GNI ratio,
and short-term-to-total-debt ratio have statistically significant relationships with external debt.
Debt service had an increasing effect on external debt, explaining the increased borrowing after
their debt levels were brought to sustainability by the HIPC Initiative. Exports and FDI play an
important macroeconomic role for countries in this category—capable of affording them the
ability to service their debt.
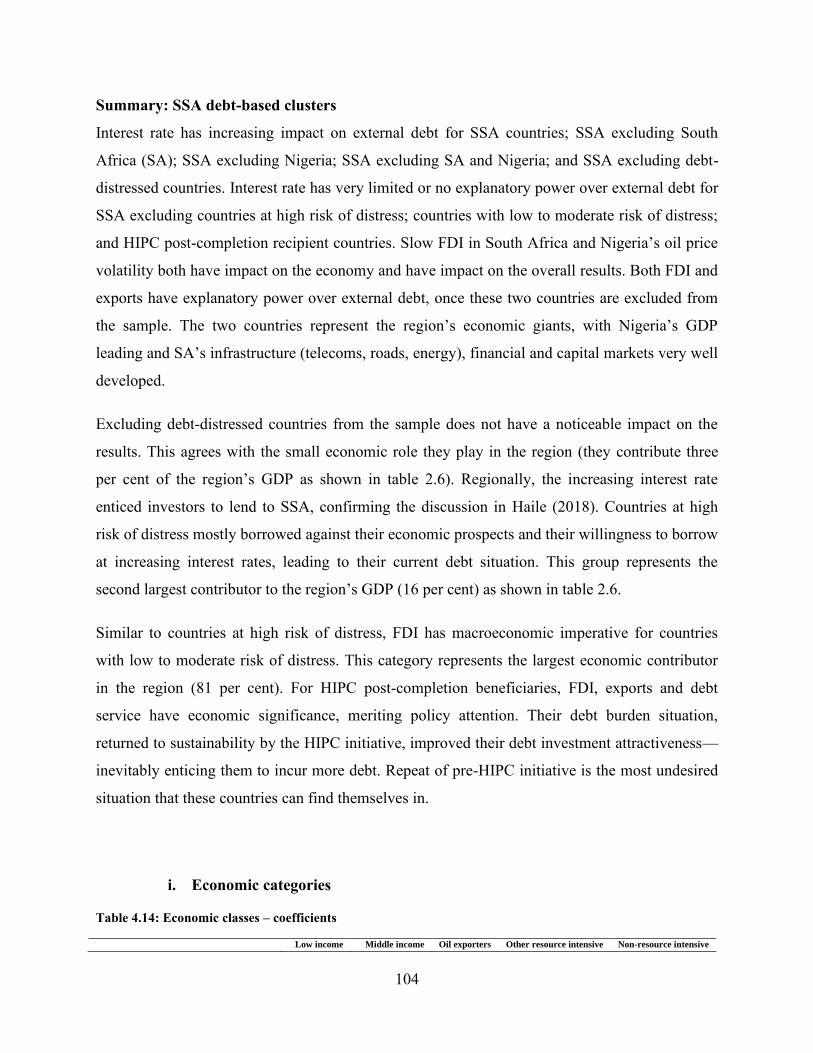
104
Summary: SSA debt-based clusters
Interest rate has increasing impact on external debt for SSA countries; SSA excluding South
Africa (SA); SSA excluding Nigeria; SSA excluding SA and Nigeria; and SSA excluding debt-
distressed countries. Interest rate has very limited or no explanatory power over external debt for
SSA excluding countries at high risk of distress; countries with low to moderate risk of distress;
and HIPC post-completion recipient countries. Slow FDI in South Africa and Nigeria’s oil price
volatility both have impact on the economy and have impact on the overall results. Both FDI and
exports have explanatory power over external debt, once these two countries are excluded from
the sample. The two countries represent the region’s economic giants, with Nigeria’s GDP
leading and SA’s infrastructure (telecoms, roads, energy), financial and capital markets very well
developed.
Excluding debt-distressed countries from the sample does not have a noticeable impact on the
results. This agrees with the small economic role they play in the region (they contribute three
per cent of the region’s GDP as shown in table 2.6). Regionally, the increasing interest rate
enticed investors to lend to SSA, confirming the discussion in Haile (2018). Countries at high
risk of distress mostly borrowed against their economic prospects and their willingness to borrow
at increasing interest rates, leading to their current debt situation. This group represents the
second largest contributor to the region’s GDP (16 per cent) as shown in table 2.6.
Similar to countries at high risk of distress, FDI has macroeconomic imperative for countries
with low to moderate risk of distress. This category represents the largest economic contributor
in the region (81 per cent). For HIPC post-completion beneficiaries, FDI, exports and debt
service have economic significance, meriting policy attention. Their debt burden situation,
returned to sustainability by the HIPC initiative, improved their debt investment attractiveness—
inevitably enticing them to incur more debt. Repeat of pre-HIPC initiative is the most undesired
situation that these countries can find themselves in.
i. Economic categories
Table 4.14: Economic classes – coefficients
Low income Middle income Oil exporters Other resource intensive Non-resource intensive
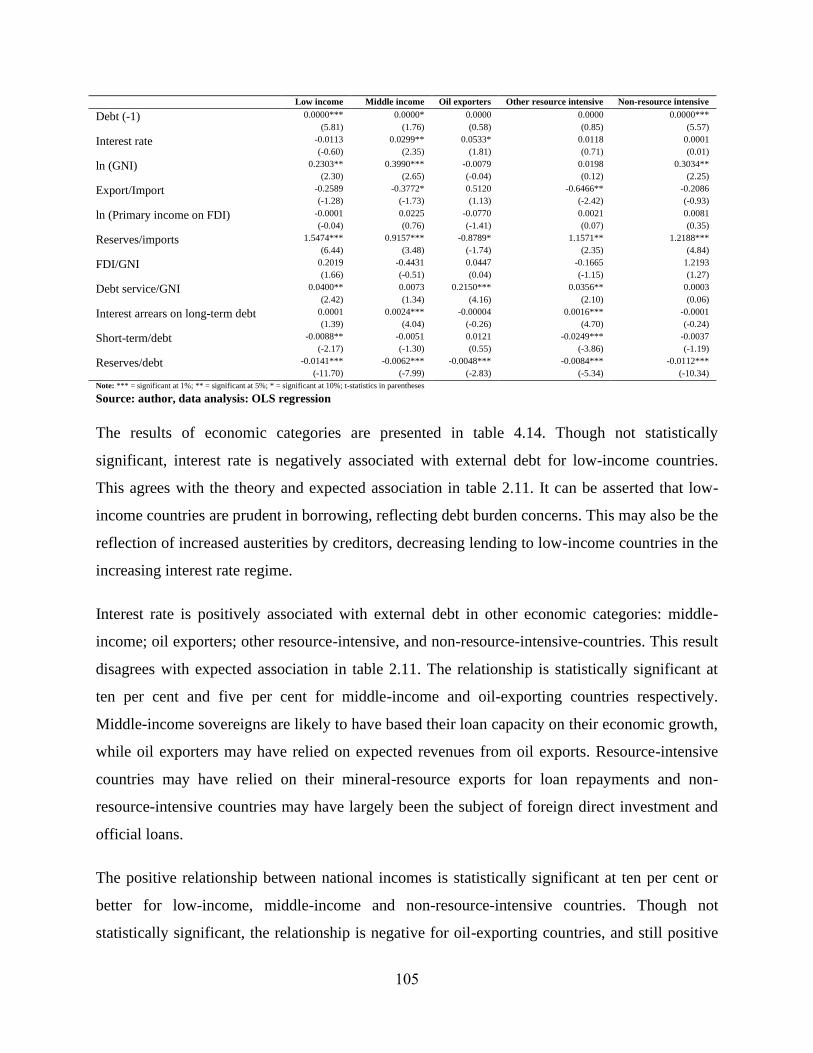
105
Low income Middle income Oil exporters Other resource intensive Non-resource intensive
Debt (-1) 0.0000***
(5.81)
0.0000*
(1.76)
0.0000
(0.58)
0.0000
(0.85)
0.0000***
(5.57)
Interest rate -0.0113
(-0.60)
0.0299**
(2.35)
0.0533*
(1.81)
0.0118
(0.71)
0.0001
(0.01)
ln (GNI) 0.2303**
(2.30)
0.3990***
(2.65)
-0.0079
(-0.04)
0.0198
(0.12)
0.3034**
(2.25)
Export/Import -0.2589
(-1.28)
-0.3772*
(-1.73)
0.5120
(1.13)
-0.6466**
(-2.42)
-0.2086
(-0.93)
ln (Primary income on FDI) -0.0001
(-0.04)
0.0225
(0.76)
-0.0770
(-1.41)
0.0021
(0.07)
0.0081
(0.35)
Reserves/imports 1.5474***
(6.44)
0.9157***
(3.48)
-0.8789*
(-1.74)
1.1571**
(2.35)
1.2188***
(4.84)
FDI/GNI 0.2019
(1.66)
-0.4431
(-0.51)
0.0447
(0.04)
-0.1665
(-1.15)
1.2193
(1.27)
Debt service/GNI 0.0400**
(2.42)
0.0073
(1.34)
0.2150***
(4.16)
0.0356**
(2.10)
0.0003
(0.06)
Interest arrears on long-term debt 0.0001
(1.39)
0.0024***
(4.04)
-0.00004
(-0.26)
0.0016***
(4.70)
-0.0001
(-0.24)
Short-term/debt -0.0088**
(-2.17)
-0.0051
(-1.30)
0.0121
(0.55)
-0.0249***
(-3.86)
-0.0037
(-1.19)
Reserves/debt -0.0141***
(-11.70)
-0.0062***
(-7.99)
-0.0048***
(-2.83)
-0.0084***
(-5.34)
-0.0112***
(-10.34)
Note: *** = significant at 1%; ** = significant at 5%; * = significant at 10%; t-statistics in parentheses
Source: author, data analysis: OLS regression
The results of economic categories are presented in table 4.14. Though not statistically
significant, interest rate is negatively associated with external debt for low-income countries.
This agrees with the theory and expected association in table 2.11. It can be asserted that low-
income countries are prudent in borrowing, reflecting debt burden concerns. This may also be the
reflection of increased austerities by creditors, decreasing lending to low-income countries in the
increasing interest rate regime.
Interest rate is positively associated with external debt in other economic categories: middle-
income; oil exporters; other resource-intensive, and non-resource-intensive-countries. This result
disagrees with expected association in table 2.11. The relationship is statistically significant at
ten per cent and five per cent for middle-income and oil-exporting countries respectively.
Middle-income sovereigns are likely to have based their loan capacity on their economic growth,
while oil exporters may have relied on expected revenues from oil exports. Resource-intensive
countries may have relied on their mineral-resource exports for loan repayments and non-
resource-intensive countries may have largely been the subject of foreign direct investment and
official loans.
The positive relationship between national incomes is statistically significant at ten per cent or
better for low-income, middle-income and non-resource-intensive countries. Though not
statistically significant, the relationship is negative for oil-exporting countries, and still positive
106
for other resource-intensive countries. Oil exporters’ incentive for loan raising is likely to have
been driven by expected revenues from oil, though the oil prices declined, effectively decreasing
national income. As resource-intensive countries relied on their revenues from exports of mineral
resources for loan repayments, prices for mineral resources did not generally fall enough to
affect national incomes over the period.
Imports’ and exports’ relationships with external debt have been negative and positive
respectively, as expected, in all categories except oil exporters. The relationship is statistically
significant at ten per cent or better for middle-income and other resource-intensive countries. Oil
exporters could have borrowed to import machinery and other inputs, hoping to pay with export
revenues, but oil prices generally declined globally. Declining global oil prices increasingly had
a substantial negative impact on the oil-exporting countries’ budgets despite their relatively fast
accumulation (Coulibaly, Brahima and Gandhi, 2019; Kapoor, Kararach, Odour, Odero,
Sennogaand and Coulibaly, 2019). Indeed, external debt has been increasing with increasing
exports—bringing up the possibility of having raised debt against oil resources in some
instances.
The foreign direct investment primary income–external debt nexus is not statistically significant
and has mixed results across all categories. Negative relationships for low-income and oil-
exporting countries go against expectations in table 2.11, while positive relationships for other
groups confirm it. These two categories should have largely been plagued by volatile portfolio
flows and private investment (including foreign direct investment), capital flight, and sometimes
corruption, as suggested in Kim, Ha and Kim (2017). Low-income countries’ investment
climates may be worsened by incurring more debt, since this potentially limits future government
expenditure. The oil-exporting countries’ display of weak investment climates is likely to have
been due to the decline and instability of global oil prices.
Reserves are consistently associated with debt at the significance level of ten per cent or better
across all categories—negative for oil-exporting countries and positive for the rest. Relationship
consistency and statistical significance are exhibited by reserves-to-imports and reserves-to-debt
ratios. The positive relationship confirms the expectation in table 2.11, derived from theory. The
differing relationship direction (negative) for oil-exporting countries can be explained by high
107
loans that depleted reserves in the face of declining oil revenues. Increasing imports with debt
also depleted reserves, yielding a negative relationship between reserves and debt.
Although not statistically significant, a relationship between foreign direct investment (FDI) and
external debt is positive for low-income, oil-exporting and non-resource-intensive countries,
confirming derived expectations in table 2.11. Contradictory results come from middle-income
and other resource-intensive categories, implying that private investment, including FDI, has
been slow in the middle-income countries, as evidenced by South Africa. Portfolio flows
remained volatile for the same group—partly explaining the impact of slower- than-anticipated
economic growth. External debt worked against investment climates in the resource-intensive
countries, inevitably disincentivising FDI growth. Mineral resource price volatility and sluggish
economic growth are partly responsible for this outcome.
Relationships between debt and debt-service are positive across all country groups, being
statistically significant for-low income, oil-exporting and other resource-intensive countries. This
contradicts the expectation in table 2.11, which was logically based on the increasing burden
implication of rising debt-service-to-income (GNI) ratio. This result can be explained by the fact
that increasing debt increases the debt-service amount. Conversely, servicing debt well entices
creditors to extend more debt, inevitably increasing debt and debt-service amounts. By
implication, changes in debt for middle-income and non-resource-intensive countries can be
explained by elements other than changes in debt service.
Negative relationships between interest arrears on long-term debt and external debt is confirmed
by the results of oil-exporting and non-resource-intensive-countries, but the relationship is not
statistically significant. This contradicts positive association results from low-income, middle-
income and other resource-intensive countries, though it is statistically significant for the latter
two. Both middle-income and resource-intensive countries are prone to increased borrowing
appetite, underpinned by positive growth prospects and mineral export revenues. Inability to
mobilise domestic resources to repay debt, results in arrears for low- income countries. Arrears
build up as revenues become unstable for resource-intensive countries, owing to volatility of
prices of mineral resources.
108
The expected negative relationship between debt and short-term is confirmed by the results of all
groups except oil-exporting countries. However, the relationship is statistically significant for
other resource-intensive countries and low-income countries. Extended credit in the face of
increasing short-term debt may have been based on the promise of oil. Oil-exporting countries,
relative to their non-oil-exporting counterparts, have surpluses that potentially afford them the
ability to service short-term debt (Waheed, 2017). Indeed, the debt-service effectiveness (higher
response measured by coefficient) is highest for oil countries as shown in table 4.14.
Summary: Economic classification
Statistically significant relationships exist between interest rate and external debt for middle-
income and oil-exporting Sub-Saharan African (SSA) countries. This is contrary to the expected
association in table 2.11, and the expected negative relationship (albeit not statistically
significant) that exists for low-income countries. National income and debt relationship is
statistically significant, but contrary to the expected association in table 2.11, for low-income,
middle-income, and non-resource-intensive countries. Expected negative relationships exist for
oil-exporting countries though it is not statistically significant. Export-to-import ratio and debt
relationship is statistically significant (and confirms the expected association) for middle-
income, other resource-intensive and non-resource-intensive countries.
Results are contrary to expected association (but not statistically significant) for oil-exporting
countries. Reserves have the explanatory power of changing debt across all groups, and
effectively reducing debt for oil-exporting countries more than the rest. The reserves-to-debt
ratio has a reduction impact on the external debt for all categories. Debt-service has explanatory
power over changing debt for low-income, oil-exporting and other resource-intensive countries,
though the association is positive, contradicting the expected association in table 2.11 across all
groups. Interest arrears on long-term debt best explain changes in debt for middle-income and
other resource-intensive countries, though contrary to the expectation.
Expected, though not statistically significant, relationships exist for oil-exporting and non-
resource-intensive countries. Short-term debt can explain changes in external debt for low-
income and other resource-intensive countries. This relationship confirms the expected
association in table 2.11. Expected associations exist for all categories except oil-exporting
109
countries, though the relationship is not statistically significant. Short-term debt has a reducing
effect on external debt.
4.4 Discussion of findings
In this section, the findings above are deliberated by drawing references from models and
literature. Some predictor variables’ relationship with external debt is not statistically significant.
For that reason, their discussion is relatively limited. Discussion is limited to variables whose
relationship with a dependent variable is statistically significant. Interest rate is the study’s
variable of interest and dominates the discussion in this study.
Analysis was done for all SSA countries, and for categories created, based on the debt situation
and economic characteristics. Debt-based clusters are: SSA countries excluding South Africa
(SA); SSA excluding Nigeria; SSA excluding SA and Nigeria; SSA excluding debt-distressed
countries; SSA excluding countries at risk of distress; low to moderate distress risk countries;
and Heavily Indebted Poor Country (HIPC) Initiative post-completion recipient countries.
Economic characteristics-based clusters are: low-income countries; middle-income countries;
oil-exporting countries; other resource-intensive countries; and non-resource-intensive countries.
As illustrated, results for debt-based clusters are presented individually. On the other hand,
economic cluster results are presented for all five groups in one table (Table 4.14).
For all SSA countries, interest rate; gross national income (GNI); international reserves-to-debt
ratio; interest arrears on long-term debt and reserves-to-debt ratios have explanatory power over
changes in external debt. Interest rate has an increasing, instead of the expected reducing effect
on external debt, with the same being true for GNI and interest arrears on long-term debt.
Reserves have an unexpected reducing effect on external debt. Reserves-to-imports ratio has an
increasing impact on external debt, as expected. By implication, investors are willing to lend to
SSA countries when interest rates, GNI reserves, and interest arrears on long-term debt increases.
For SSA excluding SA, interest rate; GNI; reserves-to-import ratio; foreign direct investment
(FDI)-to-GNI ratio; and reserves-to-debt ratio have explanatory power over the changes in
external debt. While increasing interest rate, GNI and reserves, entice investors to lend to this
category, FDI has a reducing effect on external debt. For SSA excluding Nigeria, changes in
110
external debt can be explained by: changes in interest rate; GNI; exports-to-imports ratio; debt
service-to-GNI ratio; interest arrears on long-term debt; short-term–to-total-debt ratio; and
reserves-to-debt ratio. While increases in the interest rate; national income; reserves; debt
service; and arrears in long-term repayments, all have increasing effect on external debt, exports
and short-term debt do the opposite. Investors are willing to lend to countries in this group when
interest rate; GNI; reserves; debt service; and arrears on long-term debt are on the rise, and
refrain when exports and short-term debts are increasing.
For SSA excluding SA and Nigeria, changes in interest rate; GNI; primary income on FDI;
reserves-to-imports ratio; short-term to total debt ratio; and reserves-to-total debt ratio, may
explain changes in external debt. Short-term issuance has a reducing effect on external debt,
while interest rate, GNI, primary income on FDI and reserves have an increasing effect.
Investors are disincentivised to invest in short-term debt issued by countries in this category.
They are willing to invest in this group’s debt if there are increases in interest rate, FDI, GNI,
and reserves. Major difference in all countries sampled lie in the FDI and short-term, reflecting
retarded FDI and Nigeria’s retarded short-term, because of oil price volatility.
For SSA excluding debt-distressed countries, changes in interest rate; GNI; reserves-to-imports
ratio; interest arrears on long-term debt; and reserves-to-debt ratio, explain changes in external
debt. This group has similar characteristics to all SSA countries in the sample. Excluding debt-
distressed countries in the sample has not affected the results, in line with their small
contribution to regional GDP (three per cent). All the predictor variables have increasing effect
on external debt. By implication, investors are willing to invest in this country cluster’s debt
when interest rate, national income, reserves, and interest arrears on long-term debt increase.
For SSA, excluding countries at high risk of distress, GNI; primary income on FDI; reserves-to-
imports ratio; and reserves-to-debt ratio have predictive power over changes in external debt.
GNI, FDI, and reserves have increasing impact on external debt. Investors are enticed to buy this
category’s Eurobonds if national income, FDI, and reserves increase. Interest rate does not have
explanatory power over changes in external debt. The main difference with all countries’ sample
results lies in the FDI which, by implication, has macroeconomic imperatives for this category.
111
For countries with low to moderate risk of distress, changes in GNI; primary income on FDI;
reserves-to-imports ratio; FDI-to-GNI ratio; interest arrears on long-term debt; and reserves-to-
debt ratio, explain changes in external debt. GNI, FDI, reserves and interest arrears on long-term
debt have increasing effect on external debt. For HIPC post-completion recipients, changes in
external debt is explained by changes in GNI; exports-to-imports ratio; reserves-to-imports ratio;
FDI-to-GNI ratio; short-term-to-total-debt ratio; and reserves-to-debt ratio. For this group,
similar to countries with low to moderate risk-of-distress, interest rate is not an external debt
determinant. GNI, reserves, FDI, and debt-service have increasing effect on external debt, while
exports, short-term debt and reserves have a reducing effect.
For low-income countries, GNI; reserves-to-imports ratio; debt-service-to-GNI ratio; short-term-
to-total-debt ratio all have explanatory power over changes in external debt. While GNI, reserves
and debt-service have increasing effects, short-term debt and reserves have a reducing effect on
external debt. Investors are willing to lend to SSA low-income countries if national income,
reserves and debt-service increase. They refrain from investing when reserves and short-term-
bond issuance are on the rise. Interest rate is, again, not a determinant of external debt.
For middle-income countries, changes in interest rates; GNI; exports-to-imports ratio; reserves-
to-imports ratio; interest arrears on long-term debt and reserves-to-debt, explain changes in
external debt. GNI; reserves; exports; and interest arrears on long-term debt have increasing
effects on external debt. SSA middle-income countries’ Eurobonds become attractive to
investors when interest rates, national income, exports and interest arrears on long-term debt
increase. For oil-exporting countries interest rates; reserves-to-imports ratio; debt service-to-GNI
ratio and reserves-to-debt ratio; have predictive power over changes in external debt. Reserves
and debt-service have reducing, while interest rate has increasing effects on external debt—
explaining investors’ decisions determinant character.
For other resource-intensive countries, exports-to-imports ratio; reserves-to-imports ratio; debt
service-to-GNI ratio; interest arrears on long-term debt; short-term total debt ratio; and reserves-
to-debt ratio, have explanatory power over changes in external debt. Exports, reserves and short-
term debt have reducing effects on external debt, while debt-service and interest arrears on long-
term debt have increasing impact. Investors purchase SSA resource- intensive countries’
112
Eurobonds, when debt-service and interest arrears on long-term debt increases, and refrain from
investing when exports, reserves and short-term-debt issue are on the rise. For non-resource-
intensive countries, GNI, reserves-to-imports ratio and reserves-to-debt ratio have explanatory
power over changes in external debt, but interest rate does not. Both GNI and reserves have
increasing effect on external debt, implying creditors’ willingness to lend to SSA non-resource-
intensive countries, when national income and reserves increase.
Moral hazard perception is potentially driven by the fact that majority of SSA countries in debt
distress or crisis benefited from debt relief initiatives (HIPC and MDRI). No credible, explicit
evidence exists suggesting that individual countries’ priority was placed on enhancing the ability
to repay external loan liabilities as they emerge, particularly through strengthening institutions
and economic performance. Strong institutions and improving economy have the pulling effect
on the private foreign investment (Sean J Gossel & Biekpe, 2017; Kodongo, 2011). Heightened
enterprising discipline to ensure that investment projects repay the funds borrowed specifically
for them should not be left to chance – but unsustainable debt levels in the SSA region imply
otherwise. Repaying external loans from national budgets requires that domestic resource
mobilization programs are developed, implemented and strengthened, in line with adequate
taxing of the growing economy.
4.5 Further research directions
There are two main research directions found worthy of pursuing, drawing from the insights
shared in this study. The current study’s focus is the demand side of the borrowing transaction.
Examining the supply side, exploring quantitative factors informing the funds disbursement,
could shed more light on sovereign creditor behaviour. Specifically, records of funds disbursed,
and other macroeconomic fundamentals of creditors’ other capital markets, could be critical for
analysis. Capital markets’ quantitative assessments of debt issuers may contribute immensely to
the existing body of literature.
Existing literature documents qualitative determinants of external debt, but in a more discrete
and coherent manner. Moreover, a number of determinants in examined literature appeared in
discussions and barely in the empirical analysis. Furthermore, the determinants are never all
discussed in one publication, let alone analysed collectively. Lack of a dedicated study of
113
qualitative determinants of sovereign debt at any country, regional, or global level created an
invaluable research gap. Collective qualitative determinants’ association with external debt
forms another research direction recommendation.
5 Conclusions and recommendations
Existing literature examined shed light on the qualitative determinants of sovereign borrowing
albeit in a fragmented manner. Furthermore, empirical evidence (of qualitative determinants) is
less coherent and substantive, let alone exhaustive on the subject. Most of the reported
determinants emerged in the literature discussions of the scholars mentioned. Quantitative
determinants of external sovereign debt, through specific establishment of the relationship
between debt and interest rate, as well as other macroeconomic fundamentals in SSA region,
established an interesting topic to pursue. This study attempted filling this noticeable research
gap—investigating the explanatory nature of interest rates on the external debt, not the other
round.
The study explored the determinants of sovereign borrowing decisions, with specific interest in
whether changes in the cost of debt can explain changes in external debt. Further, it also
investigates the relationship across different country clusters, based on debt situation and
economic characteristics. The investigation has been extended to explore whether other control
variables, proxied by selected macroeconomic fundamentals, have explanatory power on external
debt amounts. These variables are included to check whether their presence has any impact on
the behaviour of interest rates. Panel data from SSA countries, collected annually for the 2009–
2017 period, was used for the study.
All the three null hypotheses are rejected in favour of alternative hypotheses. For the first
hypothesis, the relationship does exist between external debt and cost of borrowing. However,
not all country clusters exhibit this, and the direction of relationships is not the same across all
clusters. For the second hypothesis, a relationship does exist between external debt and chosen
control variables. For the third hypothesis, results of various country clusters are different from
each other in terms of the combination of predictor variables and their relationship direction with
external debt.
114
Interest rate is found to have a positive determining impact on external debt for all SSA countries
aggregated: SSA countries excluding South Africa (SA); SSA excluding Nigeria; SSA excluding
Nigeria and SA; SSA excluding debt-distressed countries, middle-income and oil-exporting
countries. It does not have predictive power over changes in external debt for: SSA excluding
countries at high risk of distress; countries with low to moderate risk of distress; HIPC post-
implementation recipient countries; low-income; other resource-intensive, and non-resource-
intensive countries. External debt is also found to respond to changes in gross national income
(GNI); exports-to-imports ratio; primary income on foreign direct investment (FDI); reserves-to-
imports ratio; FDI-to-GNI ratio; debt-service-to-GNI ratio; interest arrears on long-term debt;
short-term-to-total-debt ratio; and reserves-to-debt ratio for different country groupings. For the
SSA excluding SA category, external debt is found to respond to changes in interest rate; GNI;
reserves-to-imports ratio; FDI-to-GNI ratio; and reserves-to-debt ratio. For SSA excluding
Nigeria, external debt responds to changes in interest rate; GNI; exports-to-imports ratio; debt-
service-to-GNI ratio; interest arrears on long-term debt; reserves-to-imports ratio; short-term-to-
total-debt ratio; and reserves-to-debt ratio.
For SSA excluding SA and Nigeria, changes in external debt can be explained by: changes in the
interest rate; GNI; primary income on FDI; reserves-to-imports ratio; short-term-to-total- debt
ratio; and reserves-to-debt ratio. Changes in the interest rate; GNI; reserves-to-imports ratio;
interest arrears on long-term debt; and reserves-to-debt ratio have explanatory power over
changes in external debt for SSA excluding debt-distressed countries. Determinants of external
debt for SSA excluding countries at high risk of distress are: GNI; primary income on FDI;
reserves-to-imports ratio; and reserves-to-debt ratio. In the case of low- to moderate- risk
countries, debt determinants are found to be: GNI; primary income on FDI; reserves-to-imports
ratio; FDI-to-GNI ratio; interest arrears on long-term debt; and reserves-to-debt ratio. Sovereign
borrowing is found to be responsive to: GNI; exports-to-imports ratio; reserves-to-imports ratio;
FDI-to-GNI ratio; debt-service-to-GNI ratio; short-term-to-total-debt ratio; and reserves-to-debt
ratio for Heavily Indebted Poor Country (HIPC) initiative post-completion recipient countries.
External debt flow to low-income countries is responsive to: changes in GNI; reserves-to-imports
ratio; debt-service-to-GNI ratio; short-term-to-total-debt ratio; and reserves-to-debt ratio. For
middle-income countries, external debt is determined by: interest rate; GNI; exports-to-imports
115
ratio; reserves-to-imports ratio; interest arrears on long-term debt; and reserves-to-debt ratio.
External debt in oil-exporting countries responds to: changes in interest rate; reserves-to-imports
ratio; debt-service-to-GNI ratio; and reserves-to-debt ratio. For other resource-intensive
countries, external debt is influenced by: changes in exports-to-imports ratio; reserves-to-imports
ratio; debt-service-to-GNI ratio; interest arrears on long-term debt; short-term-to-total-debt ratio;
and reserves-to-debt ratio. GNI, reserves-to-imports ratio and reserves-to-debt ratio have a
determinant character to external debt for non-resource-intensive countries. Debt is, therefore,
influenced by other heterogenous factors explored in this study, apart from interest rate – which
are also unique for each country or cluster of countries.
Instead of increasing interest rates to entice external debt, policy-makers may focus on increasing
GNI and external reserves for SSA countries aggregated. This is also the case for SSA excluding
SA and SSA excluding distressed countries. SSA excluding Nigeria should increase activities
that increase GNI and reserves; improve debt service; and desist from issuing short-term debt in
the external-debt market. For SSA excluding Nigeria and SA, policy-makers should focus on
increasing GNI, FDI and reserves; and discontinue issuing short-term debt in the external debt
market. For SSA excluding countries at high risk of distress, boosting FDI and reserves should
be given priority.
For countries with low to moderate risk of distress, their macroeconomic management
programmes should give GNI, FDI and reserves priority. For HIPC post-completion recipient
countries, improving GNI, FDI and debt service should be given high consideration to entice
external debt. For low-income countries, focus should be on increasing national income and
reserves to entice external debt. For middle-income countries, increasing national income and
exports is imperative for inviting external debt. Improving debt service and reserves by oil-
exporting countries should be given consideration, to maintain and improve relationships with
the external debt market.
Improving debt service and discontinuing short-term debt issuance in the external market are
important for other resource-intensive countries and should be considered. Increasing national
income and reserves is important for non-resource-intensive countries, for attracting external
debt. It is important that countries in SSA should increase efforts to encourage the development
116
and deepening of capital markets, to enhance sustainable sovereign domestic borrowing.
Proceeds from external debt should consistently be used for profitable projects with sustainable
revenues, to be used for servicing debt. Policy makers in the SSA are further challenged to
consider improving attempts aimed at increasing domestic resource mobilisation, including
taxation.
Minerals rich and oil producing countries’ budget projections often get affected by commodities’
prices movements in the market. Use of derivative contracts can help in the risk mitigation of
this and other cross-border financial risks. Innovations in the external loans, especially bilateral
loan arrangements, are emerging – often exhibiting increasing elements of flexibility. The
flexibilities take various forms from irregular payments to barter system. Under competent
monitoring and good faith arrangements, these avenues can be exploited in the effort to efficient
debt management.
References
Abdullahi, M. M., Bakar, N. A. B. A. & Hassan, S. B. (2015). Determining the macroeconomic
factors of external debt accumulation in Nigeria: An ARDL Bound Test approach.
Procedia: Social and Behavioral Sciences, 211, 745–752.
https://doi.org/10.1016/j.sbspro.2015.11.098
117
Abedian, I. (2016). Avoiding SA’s junk-grade sovereign credit eating. Johannesburg: The Helen
Suzman Foundation, April (78), 20–27.
Abor, J. (2011). Micro-enterprises finance. Accra: Africagrowth Institute.
Abu-Hijleh, K. A. & B. (2017). Critical success factors for public–private partnerships in the
UAE construction industry: A comparative analysis between the UAE and the UK. Journal
of Engineering, Project, and Production Management, 7(1), 21–32.
Addison, T., Pikkarainen, V., Rönkkö, R. & Tarp, F. (2017). Development and poverty in sub-
Saharan Africa (No. 2017/169). Retrieved from:
http://dx.doi.org/10.35188/UNU-WIDER/2017/395-0
Afonso, A., Gomes, P. & Rother, P. (2010). Short-and long-run determinants of sovereign debt
credit ratings. International Journal of Finance and Economics, 16(1): 1–15 ISSN1076-
9307. Retrieved from: http://eprints.bbk.ac.uk/20043
Akanbi, O. A. (2016). External debt accumulation in sub-Saharan African countries: How fast is
safe? International Journal of Sustainable Economy, 8(2), 93. Retrieved from:
https://doi.org/10.1504/ijse.2016.075916
Akpan, A. U. (2016). Foreign reserves accumulation and macroeconomic environment: The
Nigerian experience (2004–2014). International Journal of Economics and Finance Studies,
8(1), 26–47.
Alagidede, P. (2012). Masters in development finance: Topics in public sector finance (2012
Ed.). Cape Town: Africagrowth Institute.
Al-Fawwaz, T. M. (2016). Determinants of external debt in Jordan: An empirical study (1990–
2014). International Business Research, 9(7), 116. Retrieved from:
https://doi.org/10.5539/ibr.v9n7p116
Ali, R.U.M. (2012). External debt accumulation and its impact on economic growth in Pakistan.
The Pakistan Development Review, 51(4), 79–95. Retrieved from
https://www.jstor.org/stable/23734739
Amadeo, K. (2019). Sovereign debt crisis with examples. June 12, 2019. Retrieved from:
The Balance website:
https://www.thebalance.com/what-is-a-sovereign-debt-crisis-with-examples-3305748
Arif, A. & Hussain, M. (2018). Economic, political and institutional determinants of budget
deficits volatility: A panel data analysis. International Journal of Economics & Business
Administration, VI(3), 98–114. Retrieved from: https://ijeba.com/journal/166#
118
Asteriou, D., Masatci, K. & Keith, P. (2016). Exchange rate volatility and international trade :
International evidence from the MINT countries. Economic Modelling, 58 (November,
2013), 133–140. Retrieved from: https://doi.org/10.1016/j.econmod.2016.05.006
Awan, R., Anjum, A. & Rahim, S. (2015). An econometric analysis of determinants of external
debt in Pakistan. British Journal of Economics, Management & Trade, 5(4), 382–391.
Retrieved from: https://doi.org/10.9734/bjemt/2015/8837
Ballester, L. & González-Urteaga, A. (2017). How credit ratings affect sovereign credit risk:
Cross-border evidence in Latin American emerging markets ☆. Emerging Markets Review,
30, 200–214. From: https://doi.org/10.1016/j.ememar.2016.09.004
Barhoumi, K., Vu, H., Nikaein Towfighian S. & Maino, R. (2018). Public investment efficiency
in Sub-Saharan African countries. Department Papers/Policy Papers 18(09) Washington
DC: IMF. Retrieved from: http://doi.org/10.5089/9781484360019.087
Baltagi, B. H. (2015). The Oxford handbook of panel data (1st ed.) L. R. Michael Szenberg, Ed.).
New York: Oxford University Press.
Bastos, F. & Pineda, E. (2013). Fiscal space of Brazilian states. Urban Public Economic Review.
19: 44–63. ISSN 1697–6223. Retrieved from:
http://www.redalyc.org/articulo.oa?id=50430343003 (No. IDB-DP-310).
Washington DC.
Bedendo, M., Cathcart, L. & El-Jahel, L. (2018). Reputational shocks and the information
content of credit ratings. Journal of Financial Stability, 34, 44–60. Retrieved from:
https://doi.org/10.1016/j.jfs.2017.12.003
Behname, M. (2012). Foreign direct investment and economic growth : Evidence from southern
Asia. Atlantic Review of Economics, 2(2012), 1–14.
Belguith, S. O. (2017). Macroeconomic determinants of public debt growth: A case study for
Tunisia. Theoretical and Applied Economics, 24(4), 161–168.
Bharath, S. T., Dahiya, S., Saunders, A. & Srinivasan, A. (2011). Lending relationships and loan
contract terms. The Review of Financial Studies, 24(4), 1141–1203. Retrieved from:
https://doi.org/10.1093/rfs/hhp064
Binici, M. & Hutchison, M. (2018). Do credit rating agencies provide valuable information in
market evaluation of sovereign default risk? Journal of International Money and Finance,
85, 58–75. Retrieved from: https://doi.org/10.1016/j.jimonfin.2018.04.001
Bittencourt, M. (2012). Economic growth and government debt: Evidence from the young
119
democracies of Latin America. University of Pretoria, Working Paper (No. 2012–03).
Pretoria
Bittencourt, M. (2015). Determinants of government and external debt: Evidence from the young
democracies of South America. Emerging markets finance and trade, 51(3),
463–472. Retrieved from: https://doi.org/10.1080/1540496X.2015.1025667
Blankenburg, S. & Kozul-Wright, R. (2016). Sovereign debt restructurings in the contemporary
global economy: The UNCTAD approach. The Yale Journalof International Law Online,
41(2), 1–7. Retrieved from: https://cpb-us-w2.wpmucdn.com/campuspress.yale.edu/
dist/8/1581/files/2016/10/C-Preface-Special-Edition-1o3cdt9.pdf
Block-Lieb, S. (2015). Austerity, debt overhang, and the design of international standards on
sovereign, corporate and consumer debt restructuring. Indiana Journal of Global Legal
Studies, 22(2), 487–541. Retrieved from: https://doi.org/10.2979/indjglolegstu.22.2.487
Boone, B. P. & Johnson, S. (2019). Forty years of leverage: What have we learned about
sovereign debt? American Economic Association, 104(5).
Retrieved from https://www.jstor.org/stable/42920948
Boumparis, P., Milas, C. & Panagiotidis, T. (2017). Economic policy uncertainty and sovereign
credit rating decisions: Panel quantile evidence for the Eurozone. Journal of International
Money and Finance, 79, 39–71.
Retrieved from: https://doi.org/10.1016/j.jimonfin.2017.08.007
Brue, M. (2008). Macroeconomics: Principles, problems, and policies (17th ed.; R. H. Brent
Gordon, Douglas Reiner, Ed.). New York: McGraw-Hill/Irwin.
Bruno Bonizzi, J. T. (2017). Debt vulnerabilities in developing countries: A new debt trap? In
UNCTAD/GDS/MDP/2017/4 (Vol I). Retrieved from United Nations Conference on Trade
and Development website:
https://unctad.org/en/PublicationsLibrary/gdsmdp2017d4v1_en.pdf
Bunte, J. B. (2013). Debt and coalitions: Domestic politics and sovereign borrowing. Twin
Cities: University of Minnesota.
Buthelezi, E. M. (2018). Government debt and economic growth : Evidence from ECOWAS and
SADC. 4562, 7–28.
Cai, P., Gan, Q. & Kim, S. (2018). Do sovereign credit ratings matter for foreign direct
investments? Journal of International Financial Markets, Institutions & Money. Retrieved
from: https://doi.org/10.1016/j.intfin.2018.01.003
120
Carlos Oliveira Cruz, (2018). The price of project finance loans for highways. Research in
Transportation Economics, (November 2016), 1–12. Retrieved from:
https://doi.org/10.1016/j.retrec.2017.09.006
Cassimon, D., Verbeke, K. & Essers, D. (2017). The IMF-WB debt sustainability framework:
Procedures, applications and criticisms. Development Finance Agenda (DEFA), 3(1),4–6.
Chee, S. W., Fah, C. F. & Nassir, A. (2015). Macroeconomics determinants of sovereign credit
ratings. International Business Research, 8(2), 42–50.
Retrieved from: https://doi.org/10.5539/ibr.v8n2p42
Chen, S., Chen, H., Chang, C. & Yang, S. (2013). How do sovereign credit rating changes affect
private investment? Journal of Banking and Finance, 37(12), 4820–4833. Retrieved from:
https://doi.org/10.1016/j.jbankfin.2013.09.002
Claessens, S. (1993). Alternative forms of external finance : A survey. The World Bank Research
Observer, 8(1), 91–117. Retrieved from http://www.jstor.org/stable/3986489
Copelovitch, M., Gandrud, C. & Hallerberg, M. (2018). Financial data transparency,
international institutions and sovereign borrowing costs. International Studies Quarterly,
62(1), 23–41. Retrieved from: https://doi.org/10.1093/isq/sqx082
Coulibaly, B.S., Gandhi, D. & Senbet, L.W. (2019). Is sub-Saharan Africa facing another
systemic sovereign debt crisis? In Africa Growth Initiative. Retrieved from
https://www.brookings.edu/wp-content/uploads/2019/04/africa_sovereign_debt
_sustainability.pdf
Cruces, B. J. J. & Trebesch, C. (2013). Defaults: The price of haircuts. American Economic
Association, 5(3), 85–117. Retrieved from; https://www.jstor.org/stable/43189553
Cyrus, R. (2018). Restoring debt sustainability in African heavilyindebted poor countries (No.
133). Retrieved from; https://www.cigionline.org/sites/default/files/documents/PB
no.133_0.pdf
Dancho, P. (2015). Determinants of choosing sources of financingfor municipal project.
International Journal: Vallis aurea, 1(1), 1–10.
Dawson, C. (2009). Introduction to research methods. A practical guide for anyone undertaking
a research project (4th Ed.); Catherin Dawson, (Ed.).
Retrieved from: www.howtobooks.co.uk
De Groot, O. , Holm-Hadulla, F. & Leiner-killinger, N. (2015). Cost of borrowing shocks and
fiscal adjustment. Journal of International Money and Finance, 59, 23–48.
121
https://doi.org/10.1016/j.jimonfin.2015.09.005
De Nahlik, F. J. F. & C. F. (2012). Project financing (8th Ed.; F. J. F. and C. F. de Nahlik, Ed.).
Retrieved from: www.euromoneybooks.com
De Vries, J. R. & F. (1999). Short term reactions to changes in fuel prices: A panel data
analysis. Accademia Editoriale SHORT, 26(3), 331–350.
Retrieved from: https://www.jstor.org/stable/42747407
Diallo, B., Tchana Tchana, F. & Zeufack, A. G. (2016). Sovereign wealth funds and long-term
investments in Sub-Saharan Africa (No. 7903).
Retrieved from http://econ.worldbank.org.
Eichengreen, B., El-Ganainy, A., Esteves, R. P. & Mitchener, K. J. (2019). Public debt through
the ages (No. WP/19/6). Washington DC.
Ewaida, H. Y. M. (2017). The impact of sovereign debt on growth: An empirical study on GIIPS
versus JUUSD countries. European Research Studies Journal, XX(2), 607–633.
Fabozzi, F. & DeNahlik, F.J.F. (2012). Project financing. (8th Ed.) London: Eurmoney Books.
Fabozzi, F.J. & Peterson-Drake, P. (2010) The basics of fiance. New Jersey: John Wiley.
Fatás, A., Ghosh, A. R., Panizza, U. & Presbitero, A. F. (2019). The motives to borrow (No.
WP/19/101). New York.
Fiagbe, A. K. (2015). The effect of external debt on economic growth in Sub-Saharan Africa
(10279579)
Fiagbe, A. K., Senadza, B., Codjoe, E. A. (2017).Financial development and economic growth:
Additional evidence from Ghana. Ghanaian Journal of Economics, 5(1), 56–81.
Retrieved from: https://doi.org/10.4236/me.2017.82020
Fischer, T. (2015). Market structure and rating strategies in credit rating markets: A dynamic
model with matching of heterogeneous bond issuers and rating agencies. Journal of
Banking Finance, 58, 39–56.
Fukuda, S. & Kon, Y. (2010). Macroeconomic impacts of foreign exchange reserve
accumulation: Theory and international evidence (No. 197).
Retrieved from: www.adbi.org
Gevorkyan, A. V. & Kvangraven, I. H. (2016). Assessing recent determinants of borrowing costs
in Sub-Saharan Africa. Review of Development Economics, 20(4), 721–738. Retrieved
122
from: https://doi.org/10.1111/rode.12195
González, R. L., Lopez, J. A., González, R. L. & Lopez, J. A. (2007). Determinants of access to
external finance: Evidence from Spanish firms (No. 2007–22). Retrieved from
http://www.frbsf.org/publications/economics/papers/2007/wp07-22bk.pdf%0AThe
Group, W. B. (2017). Domestic resource mobilization ( DRM ) and illicit financial flows
(IFFs). The World Bank. Washington DC.
Gulati, L.C.B. & G.M. (2010a). Responsible sovereign lending and borrowing (No.
UNCTAD/OSG/DP/2010/2). Retrieved from http://www.unctad.org.
Gulati, L.C.B. & G.M. (2010b). Responsible sovereign lending and borrowing No.
UNCTAD/OSG/DP/2010/2). Retrieved from http://www.unctad.org.
Habib, M.M., Mileva, E. & Stracca, L. (2017). The real exchange rate and economic growth:
Revisiting the case using external instruments. Journal of International Money and
Finance, 73(1), 386–398. From: https://doi.org/10.1016/j.jimonfin.2017.02.014
Haile, T. (2018). Determinants of sovereign rating in Sub-Saharan African countries:
2000–2018. Progress in Economic Sciences, 5(5), 0–1. Retrieved from:
https://doi.org/10.14595/PES/05/011
Hall, S., Hondroyiannis, G., Swamy, P.A.V.B., Tavlas, G. & Ulan, M. (2010). Exchange–rate
volatility and export performance: Do emerging market economies resemble industrial
countries or other developing countries? ☆. Economic Modelling, 27(6), 1514–1521.
Retrieved from: https://doi.org/10.1016/j.econmod.2010.01.014
Hemraj, M. (2015). Credit rating agencies: Self-regulation, statutory regulation and case law
Regulation in the United States and European Union (M. Hemraj, Ed.).
Retrieved from: https://doi.org/10.1007/978-3-319-17927-8
Herwig Langohr, P. L. (2008). The rating agencies and their credit ratings: What they are, how
they work, and why they are relevant. West Sussex: John Wiley
Hill, P., Bissoondoyal-Bheenick, E. & Faff, R. (2018). New evidence on sovereign to corporate
credit rating spill-overs. International Review of Financial Analysis, 55, 209–225. Retrieved
from: https://doi.org/10.1016/j.irfa.2017.09.004
Hill, P., Brooks, R. & Faff, R. (2010). Variations in sovereign credit quality assessments across
rating agencies. Journal of Banking and Finance, 34(6), 1327–1343. Retrieved from:
https://doi.org/10.1016/j.jbankfin.2009.11.028
123
Holler, J. (2012). Funding strategies of sovereign debt management : A risk focus. Monetary
Policy & the Economy, Q2(13), 51–74.
Hoogduin, L., Öztürk, B., Wierts, P. (2011) Public debt managers’ behaviour interactions with
macro policies. Revue Économique, 62(6), 1105–1122.
Retrieved from: https://www.jstor.org/stable/41307977
Hsiao, C. (2003). Analysis of Panel Data (2nd Ed.). M.O.J. Andrew Chesher, Ed.). Retrieved
from: www.cambridge.org/9780521818551
Humphrey, C. & Michaelowa, K. (2013). Shopping for development: Multilateral lending ,
shareholder composition and borrower preferences. World Development, 44, 142–155.
Retrieved from: https://doi.org/10.1016/j.worlddev.2012.12.007
Hunt, J.E. (2014). Essays on sovereign debt and default. Houston, TX: University of Houston.
Ibrahim, & Halima. (2015). Effect of external public debt on economic growth: An empirical
analysis of east African countries. Nairobi: University of Nairobi.
IBRD. (2019a). International debt statistics 2019. Washington DC: Retrieved from:
www.worldbank.org
IBRD. (2019b). International debt statistics 2019. Washington, DC: Retrieved from
www.worldbank.org
IMF. (2019). Regional economic outlook. Sub-Saharan Africa: navigating uncertainty. (October
20; Staff, Ed.). Washington DC: International Monetary Fund.
Jaros, J. & Bartosova, V. (2015). To the capital structure choice: Miller and Modigliani model.
Procedia Economics and Finance, 26(15), 351–358. Retrieved from:
https://doi.org/10.1016/S2212-5671(15)00864-3
Jonasson, T. & Papaioannou, M. (2018). A primer on managing sovereign debt-portfolio risks.
IMF. (No. 18). New York.
Kapoor, K., Kararach, G., Odour, J., Odero, W., Sennoga, E., Brahima Coulibaly, R. N. (2019).
Fiscal and debt sustainability in Africa. Retrieved from:
https://www.afdb.org/fileadmin/uploads/afdb/Documents/Publications/WPS_No_227_
Public_Debt_Su
Karangizi, S. (2019). Understanding sovereign debt, options and opportunities for Africa (No.
1). Retrieved from www.aflsf.org
Kashif, M. & Sridharan, P. (2017). Impact of economic growth on international reserve holdings
124
in Brazil. Brazilian Journal of Political Economy, 37(148), 605–614.
https://doi.org/10.1590/0101-31572017v37n03a08
Kazuo, O., Elmer, S. & Ichiro, T. (2016) Public debt, economic growth and the real interest
rate: A panel VAR spproach to EU and OECD countries. ISER Discussion Paper No. 955.
Osaka: Osaka University Institute of Social and Economic Research. (ISER) Retrieved
from: http://hdl.handle.net/10419/148183
Keller, G. (2018) Statistics for management and economics. (11th Ed.) Boston: Cengage
Learning.
Kenny, C., Kalow, J., Leo, B. & Ramachandran, V. (2018). CGD Policy Paper 1.16 January,
2018. Washington DC
Khasipe, T. (2007). Firm productivity: A study of Lesotho garment manufacturing industry in the
post Multi-Fibre-Agreement era. Bloemfontein: University of the Free State.
Kim, E., Ha, Y. & Kim, S. (2017). Public debt, corruption and sustainable economic growth.
Sustainability (Switzerland), 9(433), 1–30. Retrieved from:
https://doi.org/10.3390/su9030433
Kingombe, C., Massa, I. & Willem, D. (2011). Comparing development finance institutions
literature review (Vol. 44). London.
Kleimeier, S. & Versteeg, R. (2010). Project finance as a driver of economic growth in low-
income countries. Review of Financial Economics, 19(2), 49–59. Retrieved from:
https://doi.org/10.1016/j.rfe.2010.01.002
Kodongo, C. O. (2011). Foreign exchange risk and the flow of international portfolio capital:
Evidence from Africa’s capital markets. Johannesburg: University of the Witwatersrand.
Kouvelis, J., Ducham, C. (Ed.) Business research methods (12th Ed.) New York: McGraw-
Hill/Irwin.
Kregel, J. (2004). External financing for development and international financial instability (No.
UNCTAD/GDS/MDPB/G24/2004/8). New York & Geneva: United Nations
Kruck, A. (2011). Private ratings, public regulations: Credit rating agencies and global
financial governance (A. Kruck, Ed.). Hampshire: Palgrave Macmillan.
Lau, E., Lee, A. S-Y. & Arip, M. A. (2015). Macroeconomics determinants of external debt in
Malaysia. International Journal of Economic Sciences, IV(4), 14–26.
Retrieved from: https://doi.org/10.20472/es.2015.4.4.002
125
Levin, A., Lin, C. F. & Chu, C. S. J. (2002). Unit root tests in panel data: Asymptotic and finite-
sample properties. Journal of Econometrics, 108(1), 1–24. Retrieved from:
https://doi.org/10.1016/S0304-4076(01)00098-7
Liang, Y. & Jia, H. (2018). Key success indicators for PPP projects: Evidence from Hong Kong.
Advances in Civil Engineering, 2018(2018), 1–10. Retrieved from
https://doi.org/10.1155/2018/9576496
Luitel, P., Vanpée, R. & De Moor, L. (2016). Business and finance pernicious effects: How the
credit rating agencies disadvantage emerging markets. Research in International Business
and Finance, 38, 286–298. From: https://doi.org/10.1016/j.ribaf.2016.04.009
Luo, J. & Wang, C. (2018). Optimal sovereign lending and default. Journal of International
Economics, (February). From: https://doi.org/10.1016/j.jinteco.2018.01.006
Makhlouf, H. H. (2014). The causes and consequences of sovereign debt. University of the
District of Columbia. International Journal of Business, Humanities and Technology, 4(6),
5–10.
Mankiw, N. G. (2012). Principles of economics (6th Ed.) (S. Morgan, Ed.). Mason, Ohio:
Cengage Learning.
Ma rtins-da-rocha, V. F. & Vailakis, Y. (2016). Dynamics borrowing in excess of natural ability
to repay ✩. Review of Economic Dynamics, 23, 42–59. Retrieved from:
https://doi.org/10.1016/j.red.2016.09.006
Matovu, J. M. (2010). Domestic resource mobilization in Sub‐Saharan Africa: The case of
Uganda. Ottawa: North-South Institute.
Mattarocci, G. (2013). The independence of credit rating agencies: How business models and
regulators interact (1st Ed.). New York: Academic Press.
Mbo, M. (2017). Drivers of organisational performance: A state-owned enterprise perspective.
Stellenbosch: Stellenbosch University.
Retrieved from: https://scholar.sun.ac.za/handle/10019.1/100877
Mbu, J. (2016). Why Eurobonds are an important source of finance for Africa.
Retrieved April 13, 2020, from: World Economic Forum website:
https://www.weforum.org/agenda/2016/02/overview-of-the-sub-saharan-african-eurobond-
market/
McConnell, C.R., Brue, S.L. & Flynn, S.M. (2012) Microeconimcs: principles, problems and
politics (19th ed.) New York: McGraw Hill
126
Megliani, M. (2015). Sovereign debt: Genesis, restructuring, litigation (1ST Ed.).
Retrieved from: https://doi.org/10.1002/9781118267073
Mensah, L., Bokpin, G. & Boachie-Yiadom, E. (2018). External debts, institutions and growth in
SSA. Journal of African Business, 19(4), 475–490.
Retrieved from: https://doi.org/10.1080/15228916.2018.1452466
Mishkin, F.S. (2016). The economics of money, banking and financial markets (11th Ed.)
(D. C. Christina Masturzo, Ed.). New York: Pearson
Mpapalika, J. & Malikane, C. (2019). The determinants of sovereign risk premium in African
countries. Journal of Risk and Financial Management, 12(1), 29.
https://doi.org/10.3390/jrfm12010029
Mukherjee, M. (2015). Essays on sovereign debt and default.Graduate Program in Economics.
Ohio State University: Ohio
Mustapha, S. (2014). What lessons can we learn from the 1980’s and 1990’s debt crises for
developing countries and how are today’s conditions similar, how are they different? London:
Overseas Development Institute
Mustapha, S. & Prizzon, A. (2018). Africa’ s rising debt: How to avoid a new crisis. London:
ODI
Nakamura, K. & Yagi, T. (2015) Fiscal Conditions and Long-Term Interest Rates (No. 15-E-10.
Vol. 35). Tokyo: Bank of Japan.
Ndieupa, H. (2018). How does public debt affect economic growth? Further evidence from
CEMAC zone. Asian Research Journal of Arts & Social Sciences, 5(1), 1–8.
Retrieved from: https://doi.org/10.9734/arjass/2018/39080
Ntsalaze, Z., Boako, G. & Alagidede, P. (2017). The impact of sovereign credit ratings on
corporate credit ratings in South Africa. African Journal of Economic and Management
Studies, 8(2), 126–146. Retrieved from: https://doi.org/10.1108/AJEMS-07-2016-0100
Ntsaluba, S. S. (2014). Comparative analysis of financing instruments used by development
finance institutions: Lessons for BRICS Development Bank. Cape Town: University of
Cape Town.
Nyambuu, U. & Semmler, W. (2017). Emerging markets’ resource booms and busts, borrowing
risk and regime change. Structural Change and Economic Dynamics, 41, 29–42. Retrieved
from: https://doi.org/10.1016/j.strueco.2017.02.001
127
Obstfeld, M., Shambaugh, J. C. & Taylor, A. M. (2010). Financial stability, the trilemma, and
international reserves. American Economic Journal: Macroeconomics, 2(2), 57–94.
Retrieved from: https://www.jstor.org/stable/25760297
Ocran, M. (2012). Masters in development finance:.Issues in development finance (M. Ocran,
Ed.). Cape Town: Africagrowth Institute.
Ogawa, K., Elmer Sterken, I. T. (2016). Public debt, economic growth and the real interest rate:
A panel VAR approach to EU and OECD countries (No. 955).
Retrieved from http://hdl.handle.net/10419/148183
Olabisi, M. & Stein, H. (2015). Sovereign bond issues: Do African countries pay more to
borrow? ☆. Journal of African Trade, 2(1–2), 87–109.
Retrieved from: https://doi.org/10.1016/j.joat.2015.08.003
Oosterlinck, K. (2013). Sovereign debt defaults: Insights from history. Oxford Review of
Economic Policy, 29(4), 697–714. https://doi.org/10.1093/oxrep/grt040
Oyedele, L. O. (2013). Avoiding performance failure payment deductions in PFI/PPP projects:
Model of critical success factors. Journal of Performance of Constructed Facilities, 27(3),
283–295. Retrievedfrom: https://doi.org/10.1061/(ASCE)CF.1943-5509.0000367.
Schindler, P.S. (2014). Business research methods (12th Ed.; J. Kouvelis, C. Ducham, Ed.). New
York: McGraw-Hill/Irwin.
Pankaj Sinha, V. A. & V. B. (2011). Determinants of public debt for middle income and high
income group countries using Panel Data regression. Munich Personal RePEc Archive,
1(2116), 0–33. Retrieved from: https://doi.org/10.1227/01.NEU.0000349921.14519.2A
Park, G. & Lee, H. (2018). Opportunistic behaviors of credit rating agencies and bond issuers.
Pacific-Basin Finance Journal, 47(October 2017), 39–59. Retrievedfrom:
https://doi.org/10.1016/j.pacfin.2017.11.003
Pato, L. (2019). External indebtedness nexus fiscal imbalances: Where and how Africa is losing?
Africa Growth Agenda, 16(3), 2019.
Paudyn, B. (2014). Credit Ratings and Sovereign Debt (T. M. Shaw, Ed.). Hampshire: Palgrave
Macmillan.
Peters, S. (2017). Sovereign wealth funds and long-term investments in infrastructure. In P. T.
128
Malan Rietveld (Ed.), The new frontiers of sovereign investment (202–228).
Retrieved from: https://www.jstor.org/stable/10.7312/riet17750.16
Petrovic, K. (2013). Government debt: An analysis of what factors influences the long-term
interest rate. Karlstads University. Retrieved from www.hhk.kau.se
Pham, T. H. H. (2015). Determinants of bank lending. Retrieved from https://hal.archives-
ouvertes.fr/hal-01158241
Prizzon, A., Greenhill, S. M. (2017). An ‘age of choice’ for external development finance?
Evidence from country case studies. Development Policy Review, 35(April), 29–45.
https://doi.org/10.1111/dpr.12268
Quartey, J. D. J. A. Q. (2019). Towards survival of state owned enterprises in Sub-Saharan
Africa : Do fiscal benefits matter? International Journal of Economics, Commerce and
Management, VII(May), 29. Retrieved from http://ijecm.co.uk/
Rao, P. K. (2003). Development finance (1st Ed.). Retrieved from http://www.springer.de
Junquera-Varela, R.F., Verhoeven, M., Shukla, G.P., Haven, B. Awasthi, R. & B. M.-D. (2017).
Strengthening domestic resource mobilization: Moving from theory to practice in low-and
middle-income countries. (and B. M.-D. Junquera-Varela, Raul Felix, Marijn Verhoeven,
Gangadhar P. Shukla, Bernard Haven, Rajul Awasthi, Ed.).
Retrieved from: https://doi.org/10.1596/978-1-4648-1073–2
Husakova, R.. (2018). Additionality in the EBRD: Review of concept and application. Retrieved
from www.ebrd.com
Cantor, R.F.P. (2015). Determinants of sovereign credit ratings. FRBNY economic policy review,
October 19(January 1996), 37–53.
Rajan Annamalai, T. & Jain, N. (2013). Project finance and investments in risky environments:
Evidence from the infrastructure sector. Journal of Financial Management of Property and
Construction, 18(3), 251–267.
Retrieved from: https://doi.org/10.1108/JFMPC-08-2012-0033
Robbins, M.D., & Simonsen, B. (2019). Do debt levels influence state borrowing costs? Public
Administration Review, 72(4), 498–505.
Retrieved from https://www.jstor.org/stable/41506800
129
Roos, J. (2019). Why not default? The political economy of sovereign debt (J. Roos, Ed.). New
Jersey: Princeton University Press.
Sagasti, F., Bezanson, K., Prada, F., Blockus, K., Lima, A. T. & Salop, J. (2004). The future of
development financing: Challenges, scenarios and strategic choices (Vol. 2004). Retrieved
from: http://www.ids.ac.uk/ids
Saggar, R. J. & M. K. (2001). Determinants of sovereign borrowings from IMF. Economic and
Political Weekly, 36(36), 3467–3471.
Retrieved from: http://www.jstor.org/stable/4411089
Saini, A., Madan, P. & Batra, S. K. (2011). Empirical relationship between foreign direct
investment and economic variables of Pakistan. IOSR Journal of Business and
Management, 12(Special Issue-AETM’16), 69–76.
Schiller, B. R. (1991). The economy today (5th ed.); (E. R. Jim Bittker, Scott D. Stratford, Ed.).
New York: McGraw-Hill
Senadza, B., Fiagbe, A. K. & Quartey, P. (2018). The effects of external debt on economic
growth in sub-Saharan Africa. International Journal of Business and Economic Sciences
Applied Research (IJBESARJ, 11(1):61–69.
Senga, C. (2019). African eurobonds:Opportunities and challenges for sustainable economic
growth after the HIPC initiative. Antwerp: University of Antwerp.
Senga, C., Cassimon, D. & Essers, D. (2018). Sub-Saharan African eurobond yields: What really
matters beyond global factors ? Review of development economics, 8(1), 49–62. Retrieved
from: https://doi.org/10.1016/j.rdf.2018.05.005
Sercu, P. (2000). Exchange rate volatility , trade , and capital flows under alternative exchange
rate regimes (2nd Ed.) R. U. (University of B. C.) Piet Sercu (Catholic University of
Leuven), Ed.. New York: Cambridge University Press.
Sercu, P., & Vanhulle, C. (1992). Exchange rate volatility, international trade, and the value of
exporting firms *. Journal of Banking and Finance, 16(1992), 155–182.
Serenis, D., & Tsounis, N. (2014). Does exchange rate variation effect African trade flows ?
Procedia Economics and Finance, 14(14), 565–574.
Retrieved from: https://doi.org/10.1016/S2212-5671(14)00757-6
130
Spilioti, S. (2015). The relationship between the government debt and GDP growth: Evidence of
the Euro area countries. Investment Management and Financial Innovations, 12(1), 174–
178. Retrieved from businessperspectives.org
Stiglitz, J. E. (2010). The Stiglitz report (J. E. Stiglitz, Ed.). New York: The New Press.
Storkey, I.A.N. (2001). Sovereign debt management: A risk management focus. The Finance Na
Treasure Professiona, (May), 7–10.
Sy, A. N. R., & Sow, M. (2016). Domestic resource mobilization and external financing: When
does governance matter ? Evidence from sub-Saharan Africa (No. 19).
Retrieved from: https://www.brookings.edu/about-us/annual-report/
Teixeira, J. C. A., Silva, F. J. F., Ferreira, M. B. S. & Vieira, J. A. C. (2018). Sovereign credit
rating determinants under financial crises. Global Finance Journal, 36 (January) 1–13.
Retrieved from: https://doi.org/10.1016/j.gfj.2018.01.003
UNCTAD. (2012a). Guidelines on rsponsible sovereign lending and borrowing. UNCTAD
project on promoting responsible lending and borrowing, (January), 1–13.
Retrieved from: http://www.unctad.info/upload/Debt Portal/RSLB Guidelines/RSLB
Guidelines 25 Aug 2014.pdf
UNCTAD. (2012b). Sovereign debt crisis: From relief to resolution. In Y. Li (Ed.), Policy Brief
(Vol. 3, 1–4). Washington DC: UNCTAD.
Kolmar, M. (2017). The SDG Investment Case. Principles for Responsible Investment. New
York: UNEP Finance Initiative and United Nations Global Compact
Van der Wansem, P. B. G., Jessen, L. & Rivetti, D. (2019). Issuing international bonds. In
Issuing International Bonds (No. 13). Retrieved from: https://doi.org/10.1596/31569
Waheed, A. (2017). Determinants of external debt: A panel data analysis for oil and gas
exporting and importing countries. International Journal of Economics and Financial
Issues, 7(1), 234–240.
Willem, D. (2014). Sovereign bonds in Sub-Saharan Africa. Good for growth or ahead of time?
(No. 87). Retrieved from
http://www.dallasfed.org/assets/documents/institute/wpapers/2008/0019.pdf
Williams, C. (2007). Research Methods. Journal of Business and Economic Research, 5(3), 65–
72.
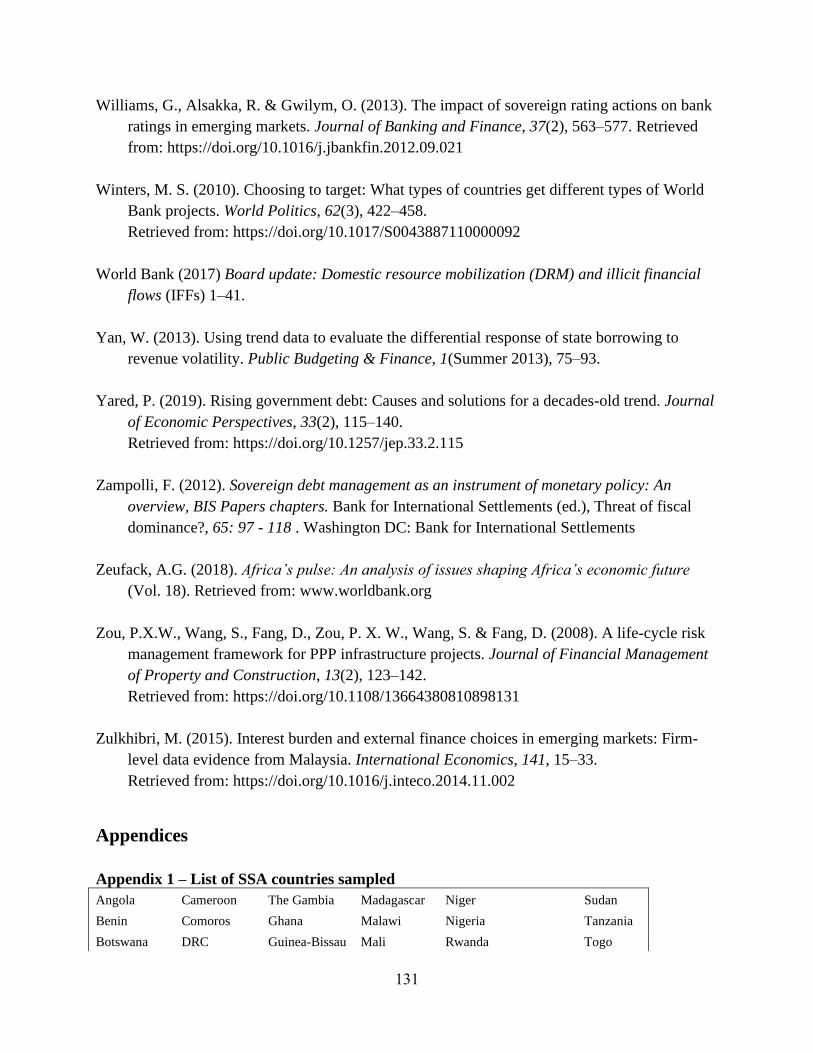
131
Williams, G., Alsakka, R. & Gwilym, O. (2013). The impact of sovereign rating actions on bank
ratings in emerging markets. Journal of Banking and Finance, 37(2), 563–577. Retrieved
from: https://doi.org/10.1016/j.jbankfin.2012.09.021
Winters, M. S. (2010). Choosing to target: What types of countries get different types of World
Bank projects. World Politics, 62(3), 422–458.
Retrieved from: https://doi.org/10.1017/S0043887110000092
World Bank (2017) Board update: Domestic resource mobilization (DRM) and illicit financial
flows (IFFs) 1–41.
Yan, W. (2013). Using trend data to evaluate the differential response of state borrowing to
revenue volatility. Public Budgeting & Finance, 1(Summer 2013), 75–93.
Yared, P. (2019). Rising government debt: Causes and solutions for a decades-old trend. Journal
of Economic Perspectives, 33(2), 115–140.
Retrieved from: https://doi.org/10.1257/jep.33.2.115
Zampolli, F. (2012). Sovereign debt management as an instrument of monetary policy: An
overview, BIS Papers chapters. Bank for International Settlements (ed.), Threat of fiscal
dominance?, 65: 97 - 118 . Washington DC: Bank for International Settlements
Zeufack, A.G. (2018). Africa’s pulse: An analysis of issues shaping Africa’s economic future
(Vol. 18). Retrieved from: www.worldbank.org
Zou, P.X.W., Wang, S., Fang, D., Zou, P. X. W., Wang, S. & Fang, D. (2008). A life-cycle risk
management framework for PPP infrastructure projects. Journal of Financial Management
of Property and Construction, 13(2), 123–142.
Retrieved from: https://doi.org/10.1108/13664380810898131
Zulkhibri, M. (2015). Interest burden and external finance choices in emerging markets: Firm-
level data evidence from Malaysia. International Economics, 141, 15–33.
Retrieved from: https://doi.org/10.1016/j.inteco.2014.11.002
Appendices
Appendix 1 – List of SSA countries sampled
Angola Cameroon The Gambia Madagascar Niger Sudan
Benin Comoros Ghana Malawi Nigeria Tanzania
Botswana DRC Guinea-Bissau Mali Rwanda Togo
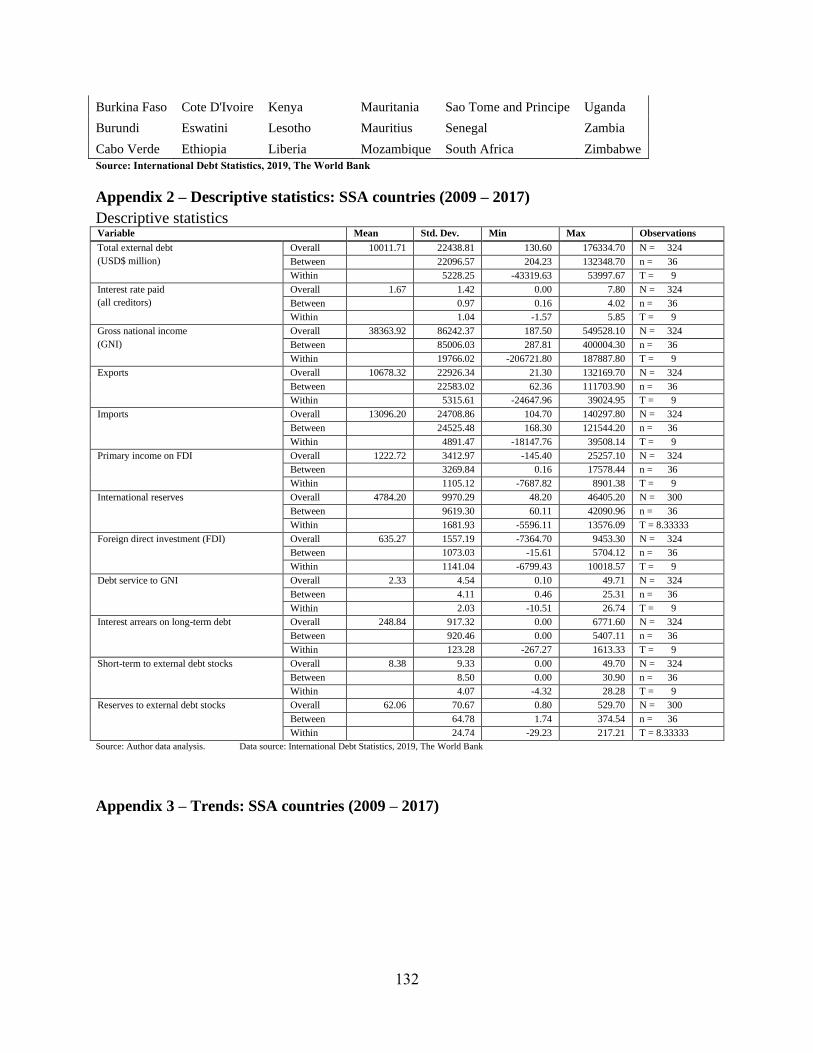
132
Burkina Faso Cote D'Ivoire Kenya Mauritania Sao Tome and Principe Uganda
Burundi Eswatini Lesotho Mauritius Senegal Zambia
Cabo Verde Ethiopia Liberia Mozambique South Africa Zimbabwe
Source: International Debt Statistics, 2019, The World Bank
Appendix 2 – Descriptive statistics: SSA countries (2009 – 2017)
Descriptive statistics Variable Mean Std. Dev. Min Max Observations
Total external debt
(USD$ million)
Overall 10011.71 22438.81 130.60 176334.70 N = 324
Between 22096.57 204.23 132348.70 n = 36
Within 5228.25 -43319.63 53997.67 T = 9
Interest rate paid
(all creditors)
Overall 1.67 1.42 0.00 7.80 N = 324
Between 0.97 0.16 4.02 n = 36
Within 1.04 -1.57 5.85 T = 9
Gross national income
(GNI)
Overall 38363.92 86242.37 187.50 549528.10 N = 324
Between 85006.03 287.81 400004.30 n = 36
Within 19766.02 -206721.80 187887.80 T = 9
Exports Overall 10678.32 22926.34 21.30 132169.70 N = 324
Between 22583.02 62.36 111703.90 n = 36
Within 5315.61 -24647.96 39024.95 T = 9
Imports Overall 13096.20 24708.86 104.70 140297.80 N = 324
Between 24525.48 168.30 121544.20 n = 36
Within 4891.47 -18147.76 39508.14 T = 9
Primary income on FDI Overall 1222.72 3412.97 -145.40 25257.10 N = 324
Between 3269.84 0.16 17578.44 n = 36
Within 1105.12 -7687.82 8901.38 T = 9
International reserves Overall 4784.20 9970.29 48.20 46405.20 N = 300
Between 9619.30 60.11 42090.96 n = 36
Within 1681.93 -5596.11 13576.09 T = 8.33333
Foreign direct investment (FDI) Overall 635.27 1557.19 -7364.70 9453.30 N = 324
Between 1073.03 -15.61 5704.12 n = 36
Within 1141.04 -6799.43 10018.57 T = 9
Debt service to GNI Overall 2.33 4.54 0.10 49.71 N = 324
Between 4.11 0.46 25.31 n = 36
Within 2.03 -10.51 26.74 T = 9
Interest arrears on long-term debt Overall 248.84 917.32 0.00 6771.60 N = 324
Between 920.46 0.00 5407.11 n = 36
Within 123.28 -267.27 1613.33 T = 9
Short-term to external debt stocks Overall 8.38 9.33 0.00 49.70 N = 324
Between 8.50 0.00 30.90 n = 36
Within 4.07 -4.32 28.28 T = 9
Reserves to external debt stocks Overall 62.06 70.67 0.80 529.70 N = 300
Between 64.78 1.74 374.54 n = 36
Within 24.74 -29.23 217.21 T = 8.33333
Source: Author data analysis. Data source: International Debt Statistics, 2019, The World Bank
Appendix 3 – Trends: SSA countries (2009 – 2017)
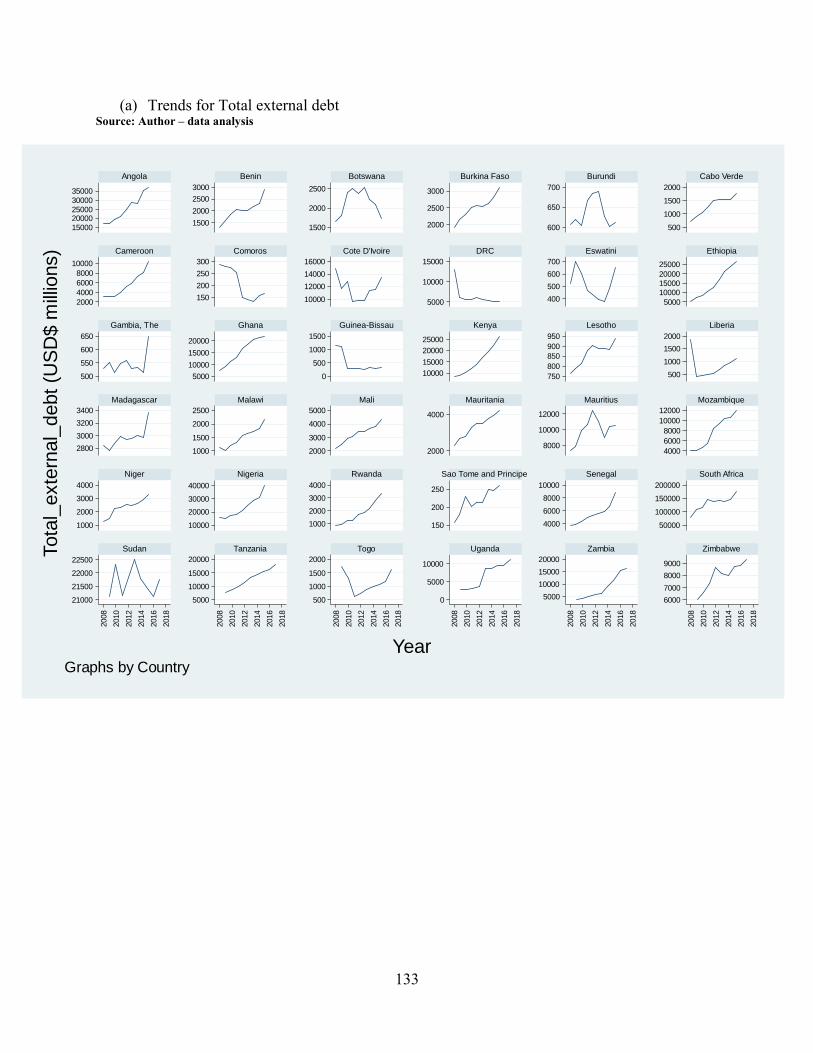
133
15000
2000025000
30000
35000
1500
2000
2500
3000
1500
2000
2500
2000
2500
3000
600
650
700
500
1000
1500
2000
2000
4000
6000
8000
10000
150
200
250
300
10000
12000
14000
16000
5000
10000
15000
400
500
600
700
5000
10000
15000
20000
25000
500
550
600
650
5000
10000
15000
20000
0
500
1000
1500
10000
15000
20000
25000
750
800
850
900
950
500
1000
1500
2000
2800
3000
3200
3400
1000
1500
2000
2500
2000
3000
4000
5000
2000
4000
8000
10000
12000
4000
6000
8000
10000
12000
1000
2000
3000
4000
10000
20000
30000
40000
1000
2000
3000
4000
150
200
250
4000
6000
8000
10000
50000
100000
150000
200000
21000
21500
22000
22500
5000
10000
15000
20000
500
1000
1500
2000
0
5000
10000
5000
10000
15000
20000
6000
7000
8000
9000
2008
2010
2012
2014
2016
2018
2008
2010
2012
2014
2016
2018
2008
2010
2012
2014
2016
2018
2008
2010
2012
2014
2016
2018
2008
2010
2012
2014
2016
2018
2008
2010
2012
2014
2016
2018
Angola Benin Botswana Burkina Faso Burundi Cabo Verde
Cameroon Comoros Cote D'Ivoire DRC Eswatini Ethiopia
Gambia, The Ghana Guinea-Bissau Kenya Lesotho Liberia
Madagascar Malawi Mali Mauritania Mauritius Mozambique
Niger Nigeria Rwanda Sao Tome and Principe Senegal South Africa
Sudan Tanzania Togo Uganda Zambia ZimbabweTota
l_exte
rnal_
debt
(US
D$ m
illio
ns)
YearGraphs by Country
(a) Trends for Total external debt Source: Author – data analysis
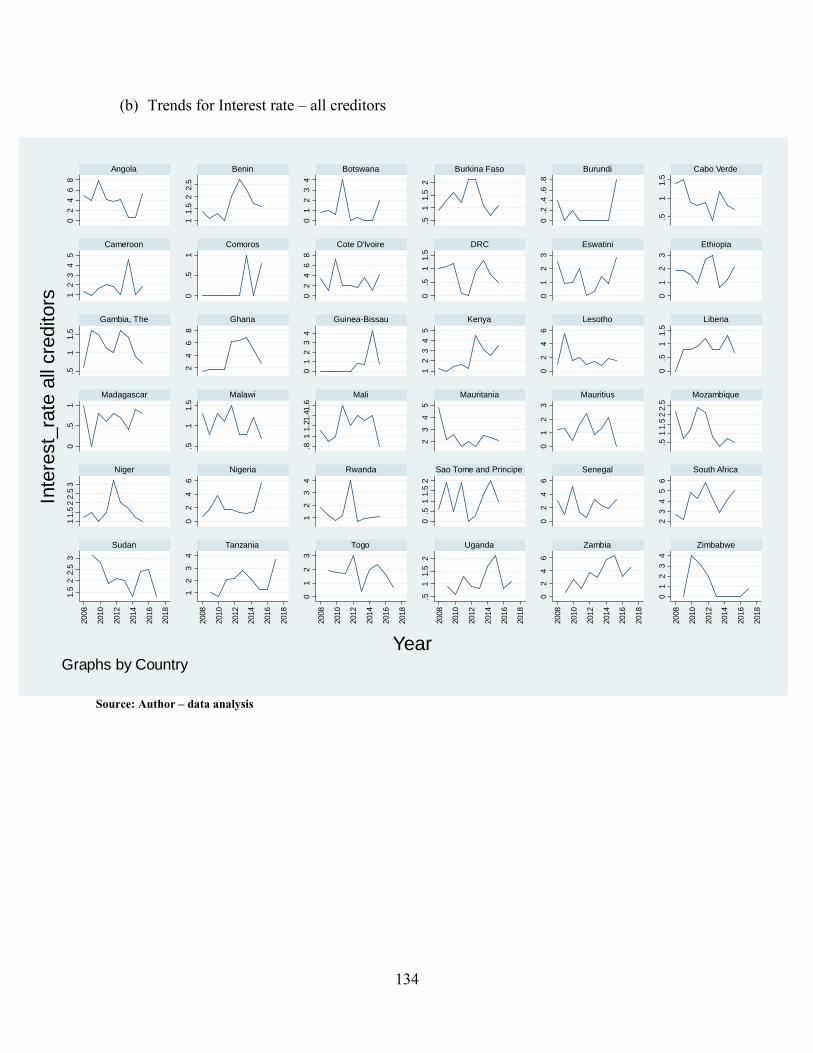
134
02
46
8
11.5
22.5
01
23
4
.51
1.5
2
0.2
.4.6
.8
.51
1.5
12
34
5
0.5
1
02
46
8
0.5
11.5
01
23
01
23
.51
1.5
24
68
01
23
4
12
34
5
02
46
0.5
11.5
0.5
1
.51
1.5
.81
1.2
1.4
1.6
23
45
01
23
.51
1.5
22.5
11.5
22.5
3
02
46
12
34
0.5
11.5
2
02
46
23
45
6
1.5
22.5
3
12
34
01
23
.51
1.5
2
02
46
01
23
4
2008
2010
2012
2014
2016
2018
2008
2010
2012
2014
2016
2018
2008
2010
2012
2014
2016
2018
2008
2010
2012
2014
2016
2018
2008
2010
2012
2014
2016
2018
2008
2010
2012
2014
2016
2018
Angola Benin Botswana Burkina Faso Burundi Cabo Verde
Cameroon Comoros Cote D'Ivoire DRC Eswatini Ethiopia
Gambia, The Ghana Guinea-Bissau Kenya Lesotho Liberia
Madagascar Malawi Mali Mauritania Mauritius Mozambique
Niger Nigeria Rwanda Sao Tome and Principe Senegal South Africa
Sudan Tanzania Togo Uganda Zambia Zimbabwe
Inte
rest_
rate
all
cre
ditors
YearGraphs by Country
(b) Trends for Interest rate – all creditors
Source: Author – data analysis
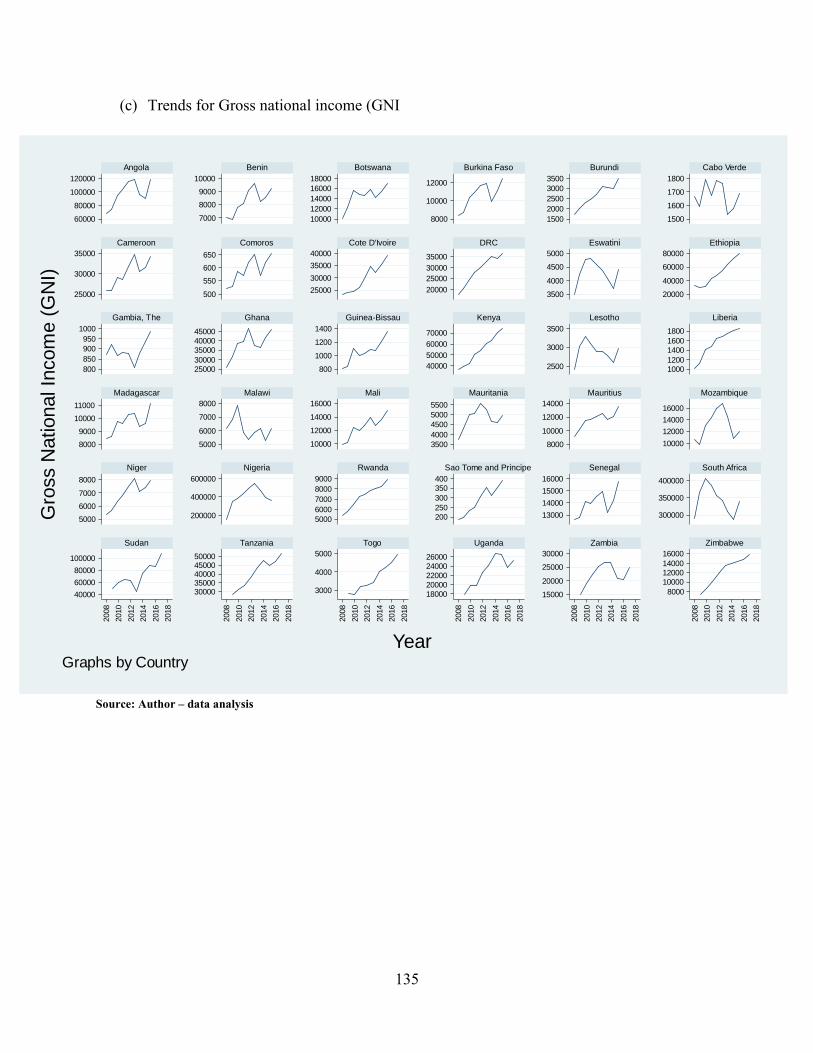
135
60000
80000
100000
120000
7000
8000
9000
10000
10000
12000
14000
16000
18000
8000
10000
12000
1500
2000
2500
3000
3500
1500
1600
1700
1800
25000
30000
35000
500
550
600
650
25000
30000
35000
40000
20000
25000
30000
35000
3500
4000
4500
5000
20000
40000
60000
80000
800
850
900
950
1000
25000
30000
35000
40000
45000
800
1000
1200
1400
40000
50000
60000
70000
2500
3000
3500
1000
1200
1400
1600
1800
8000
9000
10000
11000
5000
6000
7000
8000
10000
12000
14000
16000
3500
4000
4500
5000
5500
8000
10000
12000
14000
10000
12000
14000
16000
5000
6000
7000
8000
200000
400000
600000
5000
6000
7000
8000
9000
200
250
300
350
400
13000
14000
15000
16000
300000
350000
400000
40000
60000
80000
100000
3000035000400004500050000
3000
4000
5000
18000
20000
22000
24000
26000
15000
20000
25000
30000
8000
10000
12000
14000
16000
2008
2010
2012
2014
2016
2018
2008
2010
2012
2014
2016
2018
2008
2010
2012
2014
2016
2018
2008
2010
2012
2014
2016
2018
2008
2010
2012
2014
2016
2018
2008
2010
2012
2014
2016
2018
Angola Benin Botswana Burkina Faso Burundi Cabo Verde
Cameroon Comoros Cote D'Ivoire DRC Eswatini Ethiopia
Gambia, The Ghana Guinea-Bissau Kenya Lesotho Liberia
Madagascar Malawi Mali Mauritania Mauritius Mozambique
Niger Nigeria Rwanda Sao Tome and Principe Senegal South Africa
Sudan Tanzania Togo Uganda Zambia Zimbabwe
Gro
ss N
ational In
com
e (
GN
I)
YearGraphs by Country
(c) Trends for Gross national income (GNI
Source: Author – data analysis
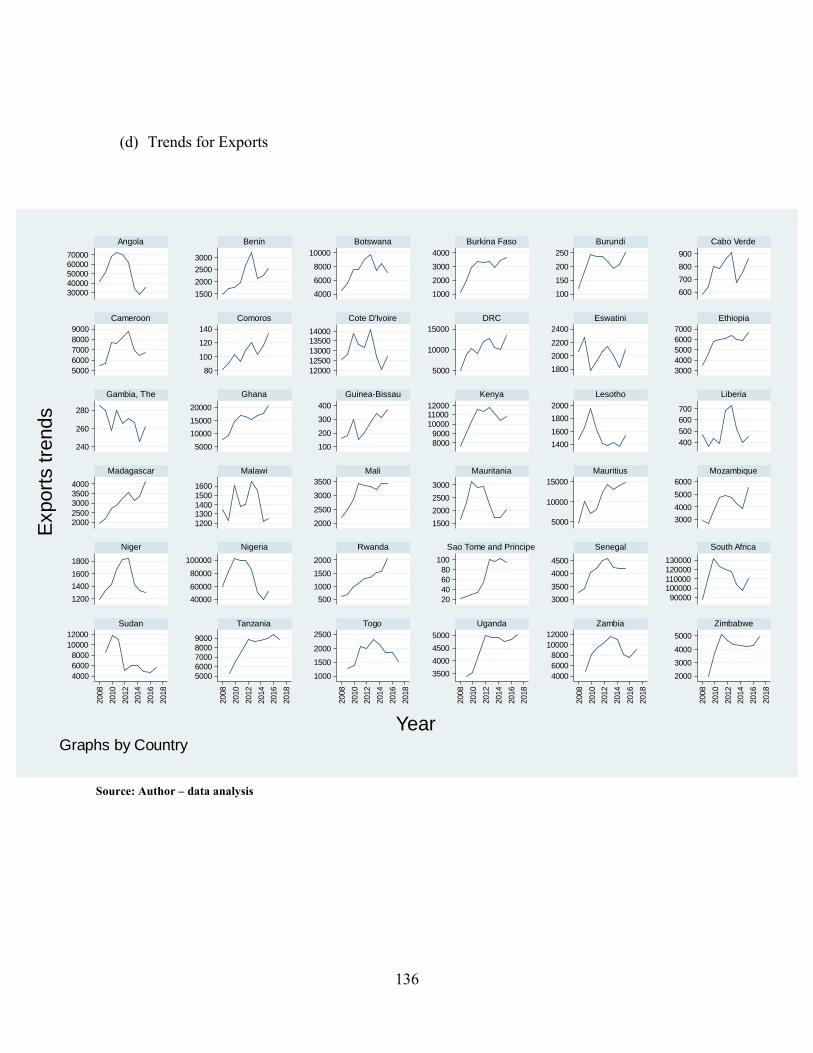
136
30000
40000
50000
60000
70000
1500
2000
2500
3000
4000
6000
8000
10000
1000
2000
3000
4000
100
150
200
250
600
700
800
900
5000
6000
7000
8000
9000
80
100
120
140
12000
12500
13000
13500
14000
5000
10000
15000
1800
2000
2200
2400
3000
4000
5000
6000
7000
240
260
280
5000
10000
15000
20000
100
200
300
400
8000
9000
10000
1100012000
1400
1600
1800
2000
400
500
600
700
2000
2500
3000
3500
4000
1200
13001400
1500
1600
2000
2500
3000
3500
1500
2000
2500
3000
5000
10000
15000
3000
4000
5000
6000
1200
1400
1600
1800
40000
60000
80000
100000
500
1000
1500
2000
20
40
60
80
100
3000
3500
4000
4500
90000
100000110000
120000
130000
4000
6000
8000
10000
12000
5000
6000
7000
8000
9000
1000
1500
2000
2500
3500
4000
4500
5000
4000
6000
8000
10000
12000
2000
3000
4000
5000
2008
2010
2012
2014
2016
2018
2008
2010
2012
2014
2016
2018
2008
2010
2012
2014
2016
2018
2008
2010
2012
2014
2016
2018
2008
2010
2012
2014
2016
2018
2008
2010
2012
2014
2016
2018
Angola Benin Botswana Burkina Faso Burundi Cabo Verde
Cameroon Comoros Cote D'Ivoire DRC Eswatini Ethiopia
Gambia, The Ghana Guinea-Bissau Kenya Lesotho Liberia
Madagascar Malawi Mali Mauritania Mauritius Mozambique
Niger Nigeria Rwanda Sao Tome and Principe Senegal South Africa
Sudan Tanzania Togo Uganda Zambia Zimbabwe
Export
s t
rends
YearGraphs by Country
(d) Trends for Exports
Source: Author – data analysis
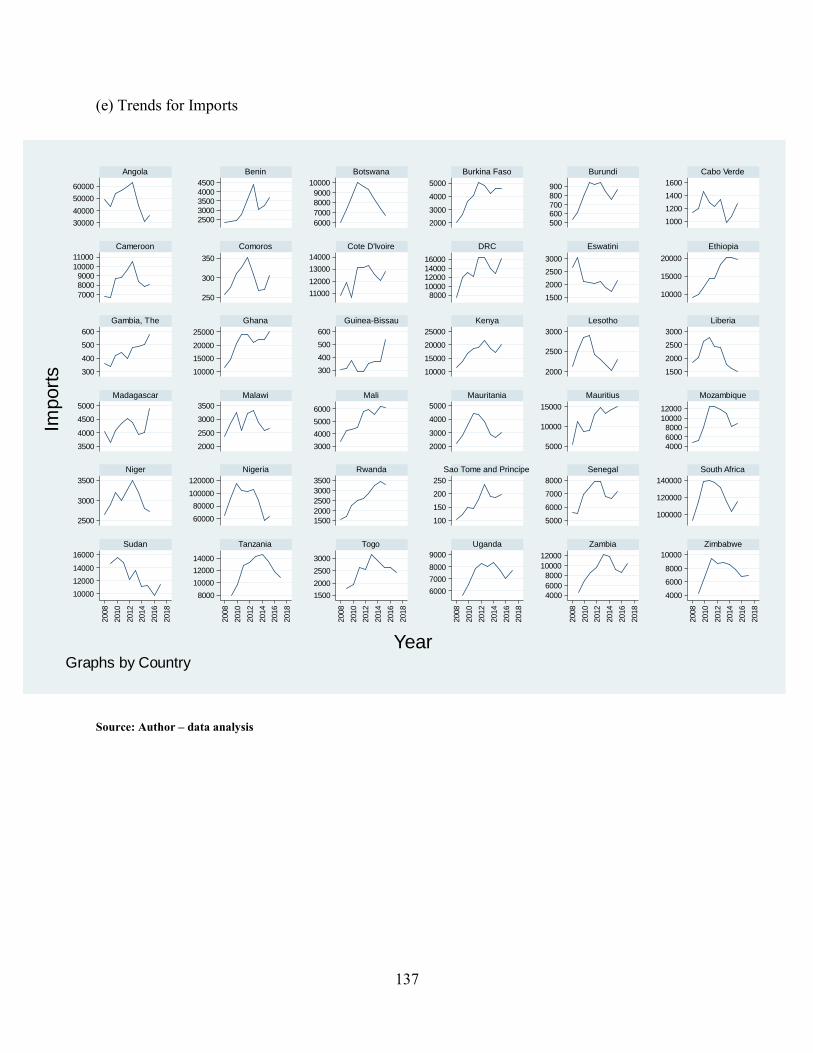
137
30000
40000
50000
60000
2500
3000
3500
4000
4500
6000
7000
8000
9000
10000
2000
3000
4000
5000
500
600700
800
900
1000
1200
1400
1600
7000
8000
9000
10000
11000
250
300
350
11000
12000
13000
14000
800010000
1200014000
16000
1500
2000
2500
3000
10000
15000
20000
300
400
500
600
10000
15000
20000
25000
300
400
500
600
10000
15000
20000
25000
2000
2500
3000
1500
2000
2500
3000
3500
4000
4500
5000
2000
2500
3000
3500
3000
4000
5000
6000
2000
3000
4000
5000
5000
10000
15000
4000
6000
8000
10000
12000
2500
3000
3500
60000
80000
100000
120000
1500
2000
2500
3000
3500
100
150
200
250
5000
6000
7000
8000
100000
120000
140000
10000
12000
14000
16000
8000
10000
12000
14000
1500
2000
2500
3000
6000
7000
8000
9000
4000
6000
8000
10000
12000
4000
6000
8000
10000
2008
2010
2012
2014
2016
2018
2008
2010
2012
2014
2016
2018
2008
2010
2012
2014
2016
2018
2008
2010
2012
2014
2016
2018
2008
2010
2012
2014
2016
2018
2008
2010
2012
2014
2016
2018
Angola Benin Botswana Burkina Faso Burundi Cabo Verde
Cameroon Comoros Cote D'Ivoire DRC Eswatini Ethiopia
Gambia, The Ghana Guinea-Bissau Kenya Lesotho Liberia
Madagascar Malawi Mali Mauritania Mauritius Mozambique
Niger Nigeria Rwanda Sao Tome and Principe Senegal South Africa
Sudan Tanzania Togo Uganda Zambia Zimbabwe
Import
s
YearGraphs by Country
(e) Trends for Imports
Source: Author – data analysis
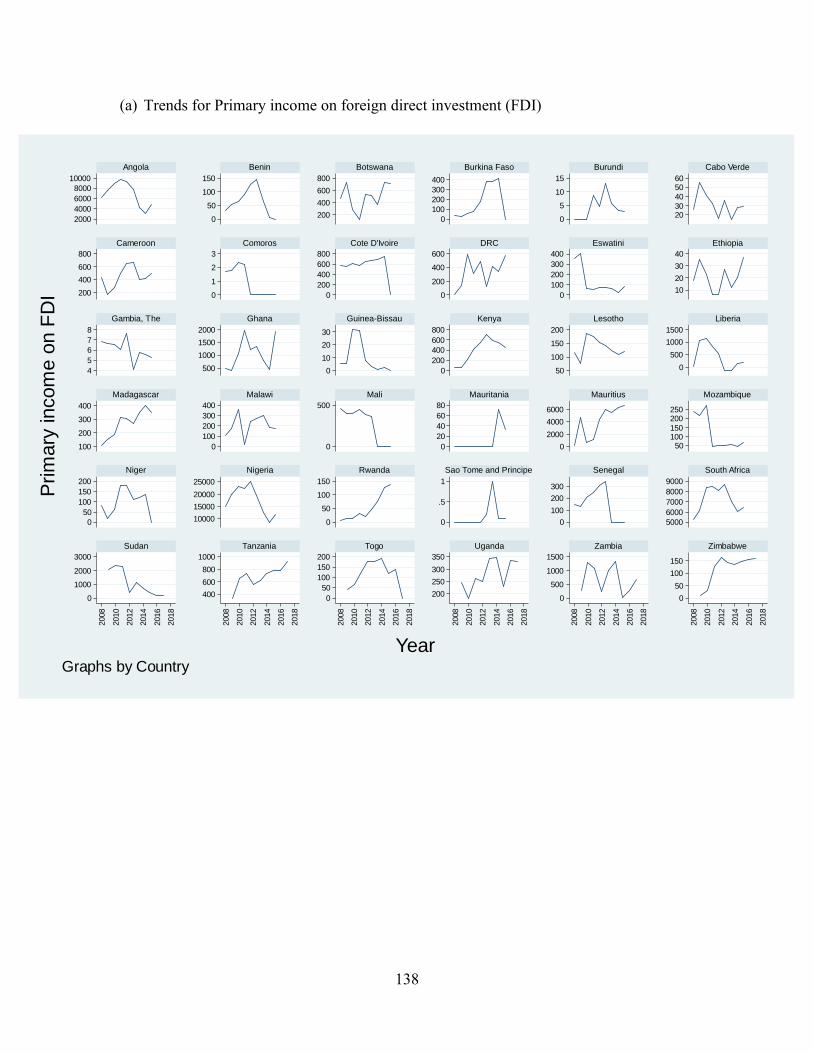
138
2000
4000
6000
8000
10000
0
50
100
150
200
400
600
800
0
100
200
300
400
0
5
10
15
2030
40
5060
200
400
600
800
0
1
2
3
0
200
400
600
800
0
200
400
600
0
100
200
300
400
10
20
30
40
4
5
6
7
8
500
1000
1500
2000
0
10
20
30
0
200
400
600
800
50
100
150
200
0
500
1000
1500
100
200
300
400
0
100
200
300
400
0
500
0
20
40
60
80
0
2000
4000
6000
50100150
200250
0
50
100
150
200
10000
15000
20000
25000
0
50
100
150
0
.5
1
0
100
200
300
5000
6000
7000
8000
9000
0
1000
2000
3000
400
600
800
1000
0
50
100
150
200
200
250
300
350
0
500
1000
1500
0
50
100
150
2008
2010
2012
2014
2016
2018
2008
2010
2012
2014
2016
2018
2008
2010
2012
2014
2016
2018
2008
2010
2012
2014
2016
2018
2008
2010
2012
2014
2016
2018
2008
2010
2012
2014
2016
2018
Angola Benin Botswana Burkina Faso Burundi Cabo Verde
Cameroon Comoros Cote D'Ivoire DRC Eswatini Ethiopia
Gambia, The Ghana Guinea-Bissau Kenya Lesotho Liberia
Madagascar Malawi Mali Mauritania Mauritius Mozambique
Niger Nigeria Rwanda Sao Tome and Principe Senegal South Africa
Sudan Tanzania Togo Uganda Zambia Zimbabwe
Prim
ary
incom
e o
n F
DI
YearGraphs by Country
(a) Trends for Primary income on foreign direct investment (FDI)
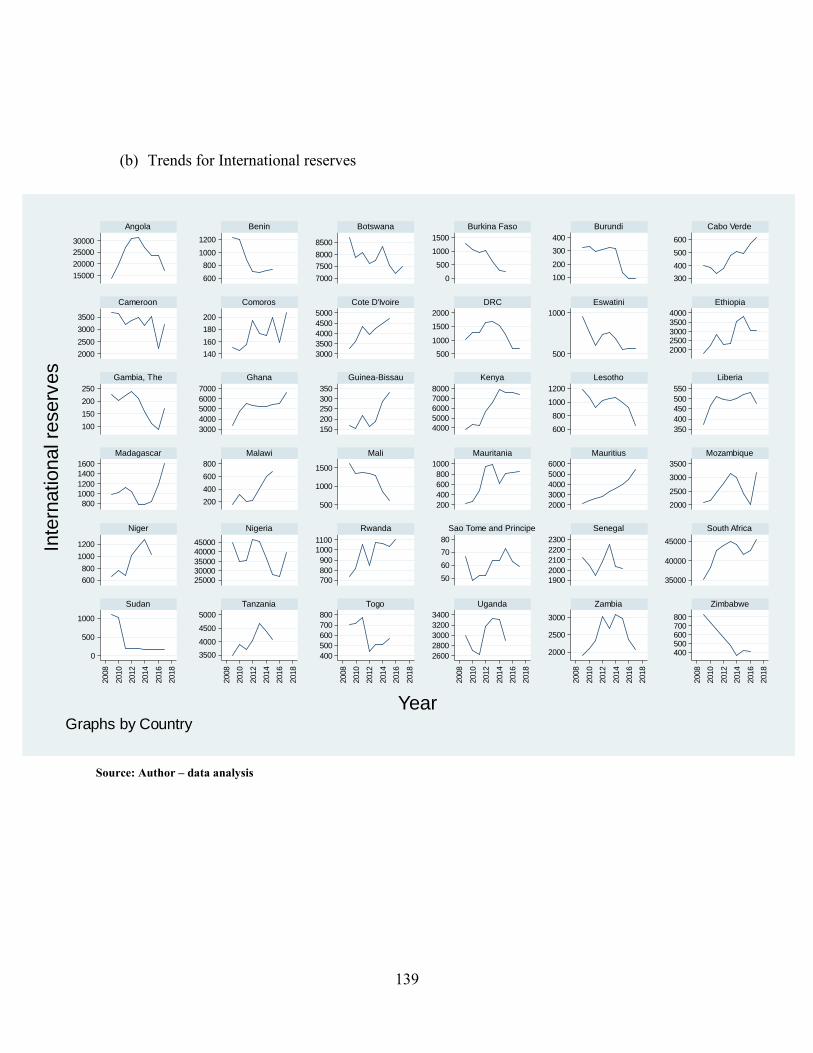
139
15000
20000
25000
30000
600
800
1000
1200
7000
7500
8000
8500
0
500
1000
1500
100
200
300
400
300
400
500
600
2000
2500
3000
3500
140
160
180
200
3000
3500
4000
4500
5000
500
1000
1500
2000
500
1000
2000
25003000
3500
4000
100
150
200
250
3000
4000
5000
6000
7000
150
200
250
300
350
4000
5000
6000
7000
8000
600
800
1000
1200
350
400
450
500
550
800
1000
1200
1400
1600
200
400
600
800
500
1000
1500
200
400
600
800
1000
2000
3000
4000
5000
6000
2000
2500
3000
3500
600
800
1000
1200
25000
30000
35000
40000
45000
700
800
900
1000
1100
50
60
70
80
1900
2000
2100
2200
2300
35000
40000
45000
0
500
1000
3500
4000
4500
5000
400
500
600
700
800
2600
2800
3000
3200
3400
2000
2500
3000
400500600700800
2008
2010
2012
2014
2016
2018
2008
2010
2012
2014
2016
2018
2008
2010
2012
2014
2016
2018
2008
2010
2012
2014
2016
2018
2008
2010
2012
2014
2016
2018
2008
2010
2012
2014
2016
2018
Angola Benin Botswana Burkina Faso Burundi Cabo Verde
Cameroon Comoros Cote D'Ivoire DRC Eswatini Ethiopia
Gambia, The Ghana Guinea-Bissau Kenya Lesotho Liberia
Madagascar Malawi Mali Mauritania Mauritius Mozambique
Niger Nigeria Rwanda Sao Tome and Principe Senegal South Africa
Sudan Tanzania Togo Uganda Zambia Zimbabwe
Inte
rnational re
serv
es
YearGraphs by Country
(b) Trends for International reserves
Source: Author – data analysis
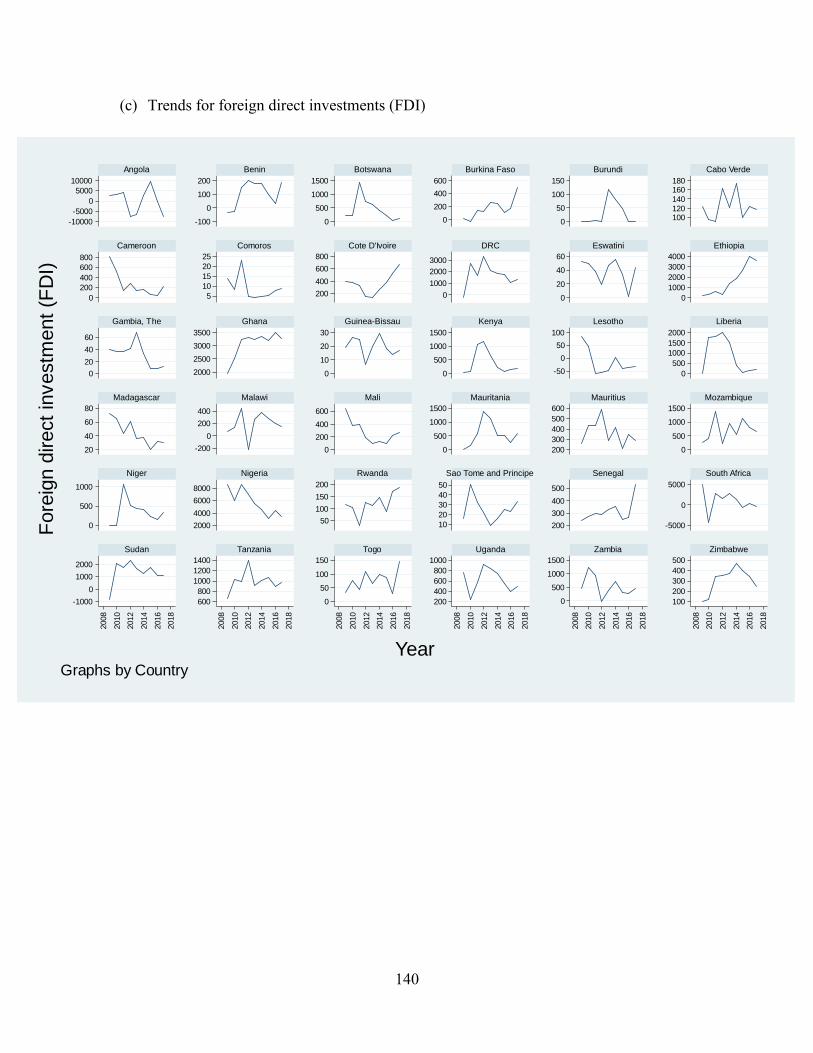
140
-10000
-5000
0
5000
10000
-100
0
100
200
0
500
1000
1500
0
200
400
600
0
50
100
150
100120
140
160180
0
200
400
600
800
5
10
15
20
25
200
400
600
800
0
1000
2000
3000
0
20
40
60
0
1000
2000
3000
4000
0
20
40
60
2000
2500
3000
3500
0
10
20
30
0
500
1000
1500
-50
0
50
100
0
500
1000
1500
2000
20
40
60
80
-200
0
200
400
0
200
400
600
0
500
1000
1500
200
300
400
500
600
0
500
1000
1500
0
500
1000
2000
4000
6000
8000
50
100
150
200
10
20
30
40
50
200
300
400
500
-5000
0
5000
-1000
0
1000
2000
600
800
1000
1200
1400
0
50
100
150
200
400
600
800
1000
0
500
1000
1500
100
200
300
400
500
2008
2010
2012
2014
2016
2018
2008
2010
2012
2014
2016
2018
2008
2010
2012
2014
2016
2018
2008
2010
2012
2014
2016
2018
2008
2010
2012
2014
2016
2018
2008
2010
2012
2014
2016
2018
Angola Benin Botswana Burkina Faso Burundi Cabo Verde
Cameroon Comoros Cote D'Ivoire DRC Eswatini Ethiopia
Gambia, The Ghana Guinea-Bissau Kenya Lesotho Liberia
Madagascar Malawi Mali Mauritania Mauritius Mozambique
Niger Nigeria Rwanda Sao Tome and Principe Senegal South Africa
Sudan Tanzania Togo Uganda Zambia Zimbabwe
Fore
ign d
irect
investm
ent
(FD
I)
YearGraphs by Country
(c) Trends for foreign direct investments (FDI)
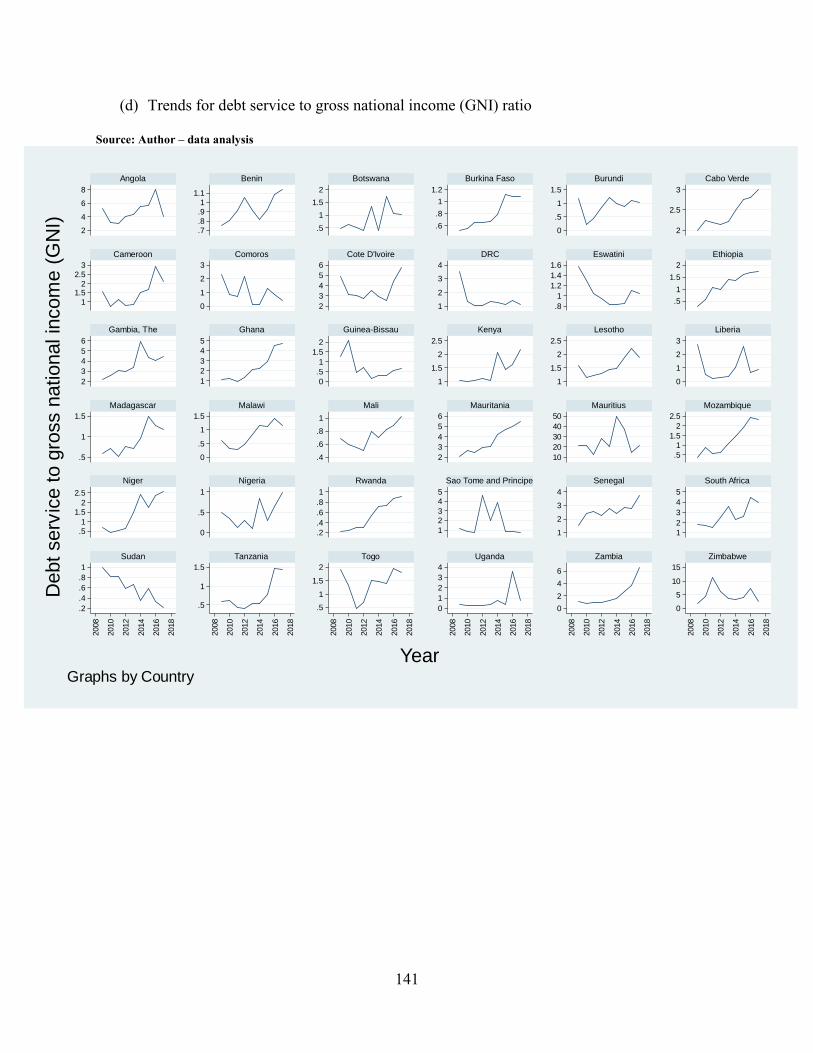
141
2
4
6
8
.7
.8
.9
1
1.1
.5
1
1.5
2
.6
.8
1
1.2
0
.5
1
1.5
2
2.5
3
1
1.52
2.5
3
0
1
2
3
2
3
4
5
6
1
2
3
4
.8
1
1.2
1.4
1.6
.5
1
1.5
2
2
3
4
5
6
1
2
3
4
5
0
.5
1
1.5
2
1
1.5
2
2.5
1
1.5
2
2.5
0
1
2
3
.5
1
1.5
0
.5
1
1.5
.4
.6
.8
1
2
3
4
5
6
10
20
30
40
50
.5
1
1.5
2
2.5
.5
1
1.5
2
2.5
0
.5
1
.2
.4
.6
.8
1
1
2
3
4
5
1
2
3
4
1
2
3
4
5
.2
.4
.6
.8
1
.5
1
1.5
.5
1
1.5
2
0
1
2
3
4
0
2
4
6
0
5
10
15
2008
2010
2012
2014
2016
2018
2008
2010
2012
2014
2016
2018
2008
2010
2012
2014
2016
2018
2008
2010
2012
2014
2016
2018
2008
2010
2012
2014
2016
2018
2008
2010
2012
2014
2016
2018
Angola Benin Botswana Burkina Faso Burundi Cabo Verde
Cameroon Comoros Cote D'Ivoire DRC Eswatini Ethiopia
Gambia, The Ghana Guinea-Bissau Kenya Lesotho Liberia
Madagascar Malawi Mali Mauritania Mauritius Mozambique
Niger Nigeria Rwanda Sao Tome and Principe Senegal South Africa
Sudan Tanzania Togo Uganda Zambia Zimbabwe
Debt
serv
ice t
o g
ross n
ational in
com
e (
GN
I)
YearGraphs by Country
(d) Trends for debt service to gross national income (GNI) ratio
Source: Author – data analysis
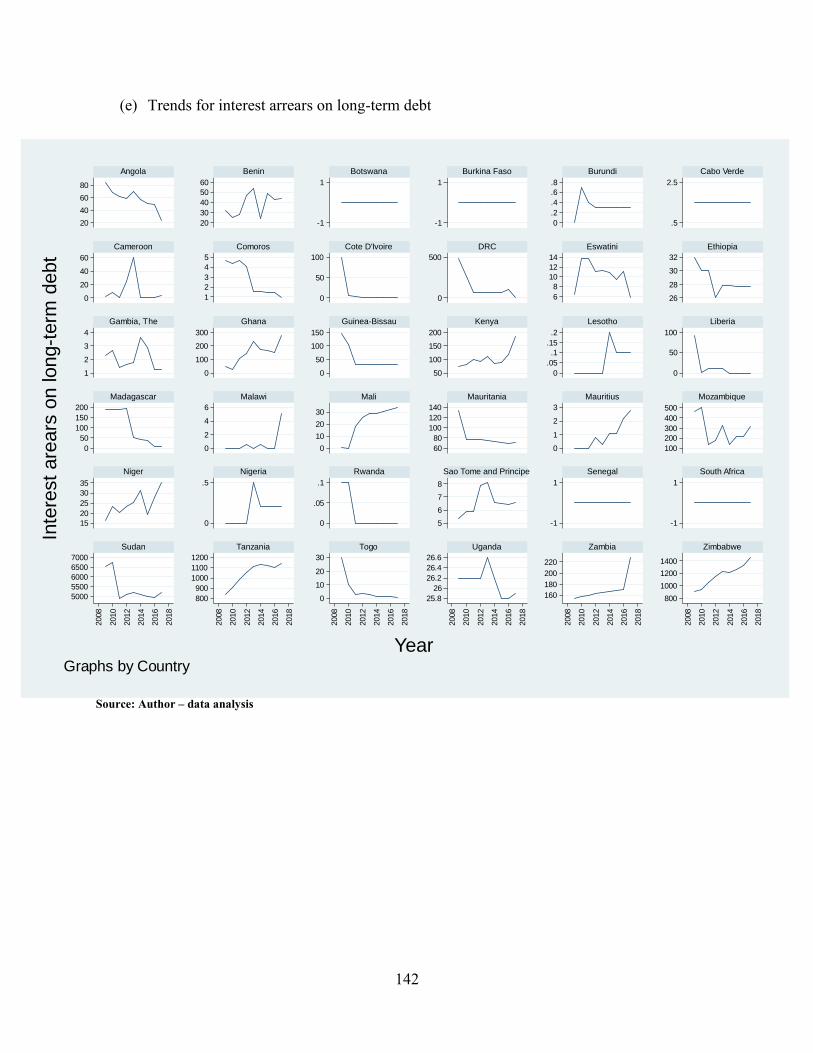
142
20
40
60
80
20
30
40
50
60
-1
1
-1
1
0
.2
.4
.6
.8
.5
2.5
0
20
40
60
1
2
3
4
5
0
50
100
0
500
6
8
10
12
14
26
28
30
32
1
2
3
4
0
100
200
300
0
50
100
150
50
100
150
200
0
.05
.1
.15
.2
0
50
100
0
50
100
150
200
0
2
4
6
0
10
20
30
60
80
100
120
140
0
1
2
3
100
200
300
400
500
15
20
25
30
35
0
.5
0
.05
.1
5
6
7
8
-1
1
-1
1
5000
5500
6000
6500
7000
800
900
1000
1100
1200
0
10
20
30
25.8
26
26.2
26.4
26.6
160
180
200
220
800
1000
1200
1400
2008
2010
2012
2014
2016
2018
2008
2010
2012
2014
2016
2018
2008
2010
2012
2014
2016
2018
2008
2010
2012
2014
2016
2018
2008
2010
2012
2014
2016
2018
2008
2010
2012
2014
2016
2018
Angola Benin Botswana Burkina Faso Burundi Cabo Verde
Cameroon Comoros Cote D'Ivoire DRC Eswatini Ethiopia
Gambia, The Ghana Guinea-Bissau Kenya Lesotho Liberia
Madagascar Malawi Mali Mauritania Mauritius Mozambique
Niger Nigeria Rwanda Sao Tome and Principe Senegal South Africa
Sudan Tanzania Togo Uganda Zambia Zimbabwe
Inte
rest
are
ars
on long-t
erm
debt
YearGraphs by Country
(e) Trends for interest arrears on long-term debt
Source: Author – data analysis
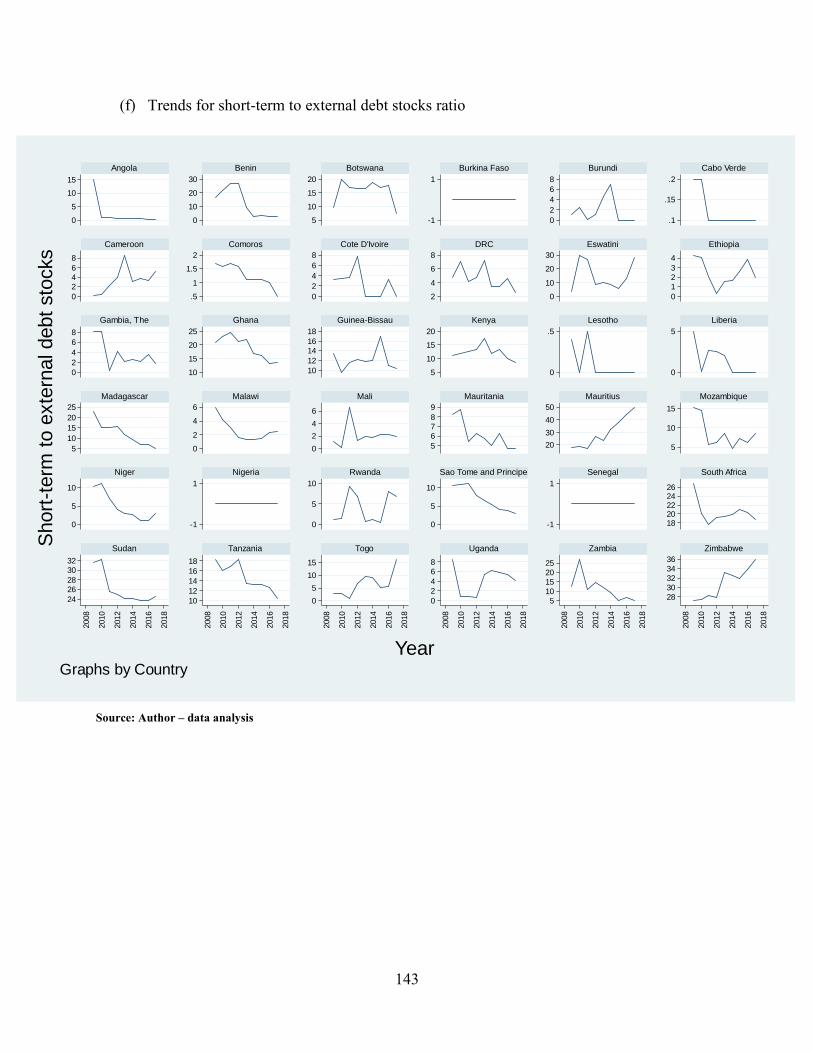
143
0
5
10
15
0
10
20
30
5
10
15
20
-1
1
0
2
4
6
8
.1
.15
.2
0
2
4
6
8
.5
1
1.5
2
0
2
4
6
8
2
4
6
8
0
10
20
30
0
1
2
3
4
0
2
4
6
8
10
15
20
25
10
12
14
16
18
5
10
15
20
0
.5
0
5
5
10
15
20
25
0
2
4
6
0
2
4
6
5
6
7
8
9
20
30
40
50
5
10
15
0
5
10
-1
1
0
5
10
0
5
10
-1
1
1820222426
24
26
28
30
32
10
12
14
16
18
0
5
10
15
0
2
4
6
8
5
10
15
20
25
28
30
32
34
36
2008
2010
2012
2014
2016
2018
2008
2010
2012
2014
2016
2018
2008
2010
2012
2014
2016
2018
2008
2010
2012
2014
2016
2018
2008
2010
2012
2014
2016
2018
2008
2010
2012
2014
2016
2018
Angola Benin Botswana Burkina Faso Burundi Cabo Verde
Cameroon Comoros Cote D'Ivoire DRC Eswatini Ethiopia
Gambia, The Ghana Guinea-Bissau Kenya Lesotho Liberia
Madagascar Malawi Mali Mauritania Mauritius Mozambique
Niger Nigeria Rwanda Sao Tome and Principe Senegal South Africa
Sudan Tanzania Togo Uganda Zambia Zimbabwe
Short
-term
to e
xte
rnal debt
sto
cks
YearGraphs by Country
(f) Trends for short-term to external debt stocks ratio
Source: Author – data analysis
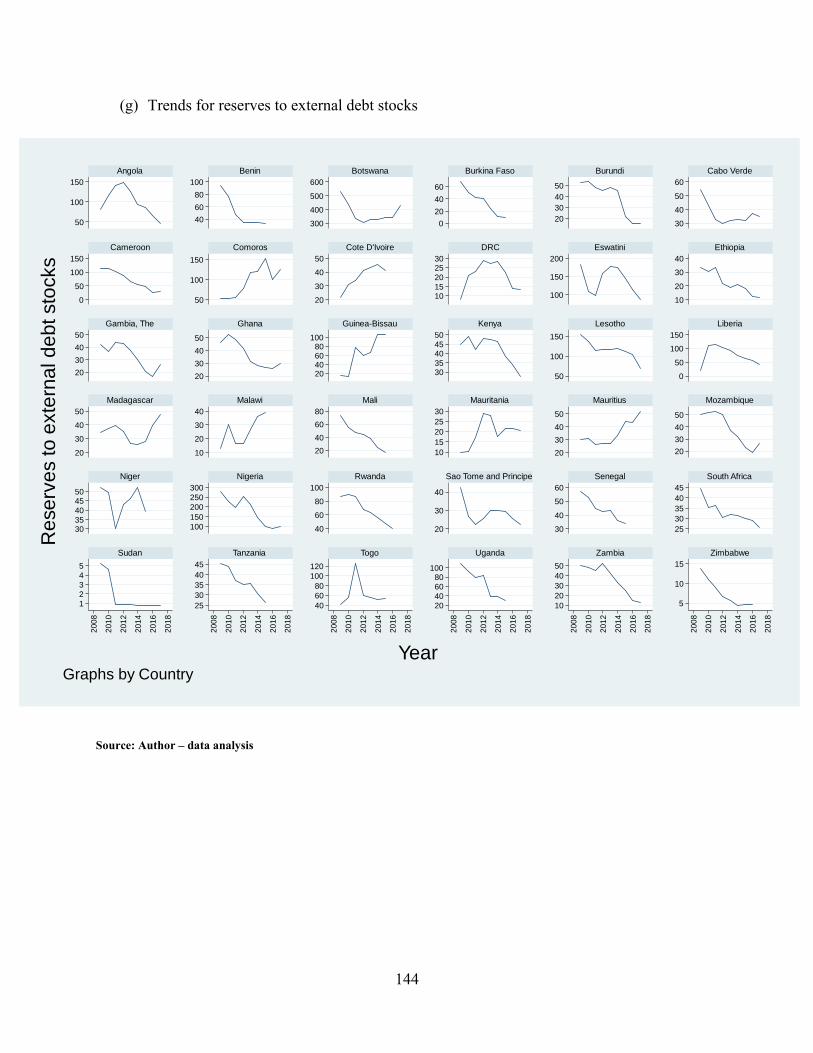
144
50
100
150
40
60
80
100
300
400
500
600
0
20
40
60
20
30
40
50
30
40
50
60
0
50
100
150
50
100
150
20
30
40
50
1015
20
2530
100
150
200
10
20
30
40
20
30
40
50
20
30
40
50
20406080
100
3035
4045
50
50
100
150
0
50
100
150
20
30
40
50
10
20
30
40
20
40
60
80
10
15
20
25
30
20
30
40
50
20
30
40
50
3035
40
4550
100
150
200
250
300
40
60
80
100
20
30
40
30
40
50
60
25
30
35
40
45
1
2
3
4
5
25
30
35
40
45
40
60
80
100
120
20
40
60
80100
10
20
30
40
50
5
10
15
20
08
20
10
20
12
20
14
20
16
20
18
20
08
20
10
20
12
20
14
20
16
20
18
20
08
20
10
20
12
20
14
20
16
20
18
20
08
20
10
20
12
20
14
20
16
20
18
20
08
20
10
20
12
20
14
20
16
20
18
20
08
20
10
20
12
20
14
20
16
20
18
Angola Benin Botswana Burkina Faso Burundi Cabo Verde
Cameroon Comoros Cote D'Ivoire DRC Eswatini Ethiopia
Gambia, The Ghana Guinea-Bissau Kenya Lesotho Liberia
Madagascar Malawi Mali Mauritania Mauritius Mozambique
Niger Nigeria Rwanda Sao Tome and Principe Senegal South Africa
Sudan Tanzania Togo Uganda Zambia Zimbabwe
Re
se
rve
s to
exte
rna
l d
eb
t sto
cks
YearGraphs by Country
(g) Trends for reserves to external debt stocks
Source: Author – data analysis
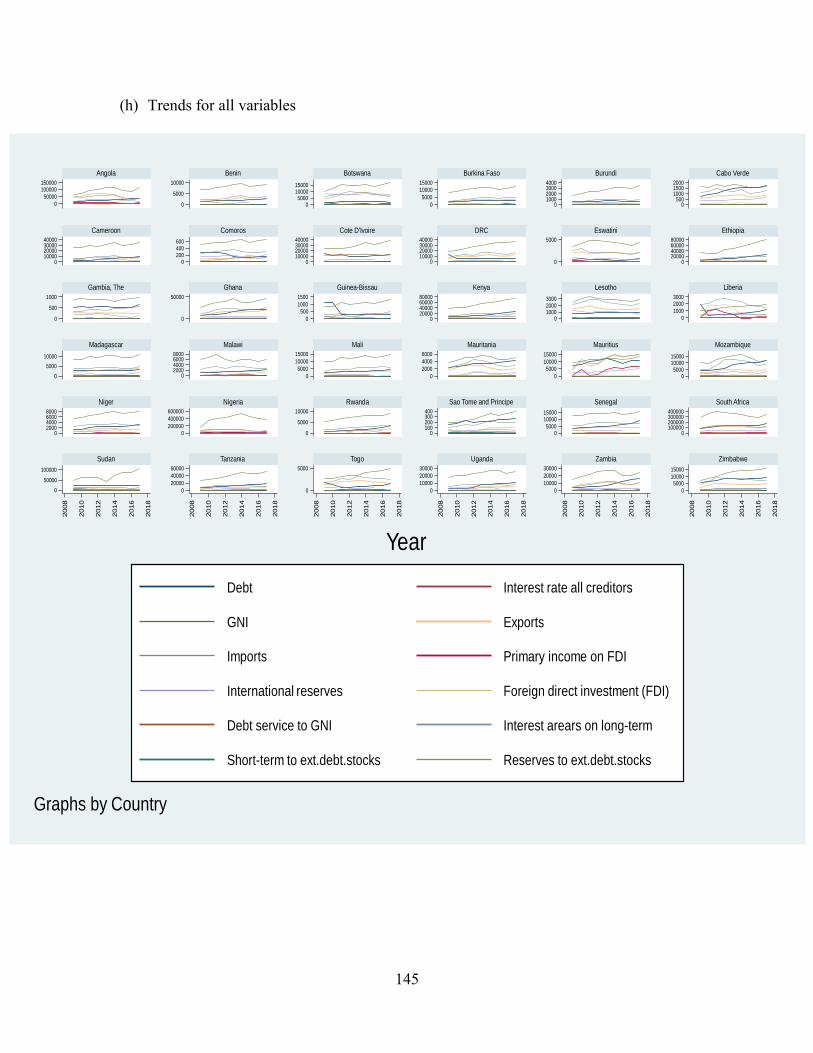
145
0
50000
100000150000
0
5000
10000
05000
1000015000
0
5000
10000
15000
01000200030004000
0500
100015002000
010000200003000040000
0200400600
010000200003000040000
010000200003000040000
0
5000
020000400006000080000
0
500
1000
0
50000
0
500
1000
1500
020000400006000080000
0100020003000
0
1000
20003000
0
5000
10000
02000400060008000
0
5000
10000
15000
0
2000
4000
6000
0
5000
10000
15000
05000
1000015000
02000400060008000
0
200000
400000
600000
0
5000
10000
0100200300400
05000
1000015000
0100000200000300000400000
0
50000
100000
0
20000
40000
60000
0
5000
0
10000
20000
30000
0
10000
20000
30000
0
500010000
15000
2008
2010
2012
2014
2016
2018
2008
2010
2012
2014
2016
2018
2008
2010
2012
2014
2016
2018
2008
2010
2012
2014
2016
2018
2008
2010
2012
2014
2016
2018
2008
2010
2012
2014
2016
2018
Angola Benin Botswana Burkina Faso Burundi Cabo Verde
Cameroon Comoros Cote D'Ivoire DRC Eswatini Ethiopia
Gambia, The Ghana Guinea-Bissau Kenya Lesotho Liberia
Madagascar Malawi Mali Mauritania Mauritius Mozambique
Niger Nigeria Rwanda Sao Tome and Principe Senegal South Africa
Sudan Tanzania Togo Uganda Zambia Zimbabwe
Debt Interest rate all creditors
GNI Exports
Imports Primary income on FDI
International reserves Foreign direct investment (FDI)
Debt service to GNI Interest arears on long-term
Short-term to ext.debt.stocks Reserves to ext.debt.stocks
Year
Graphs by Country
(h) Trends for all variables
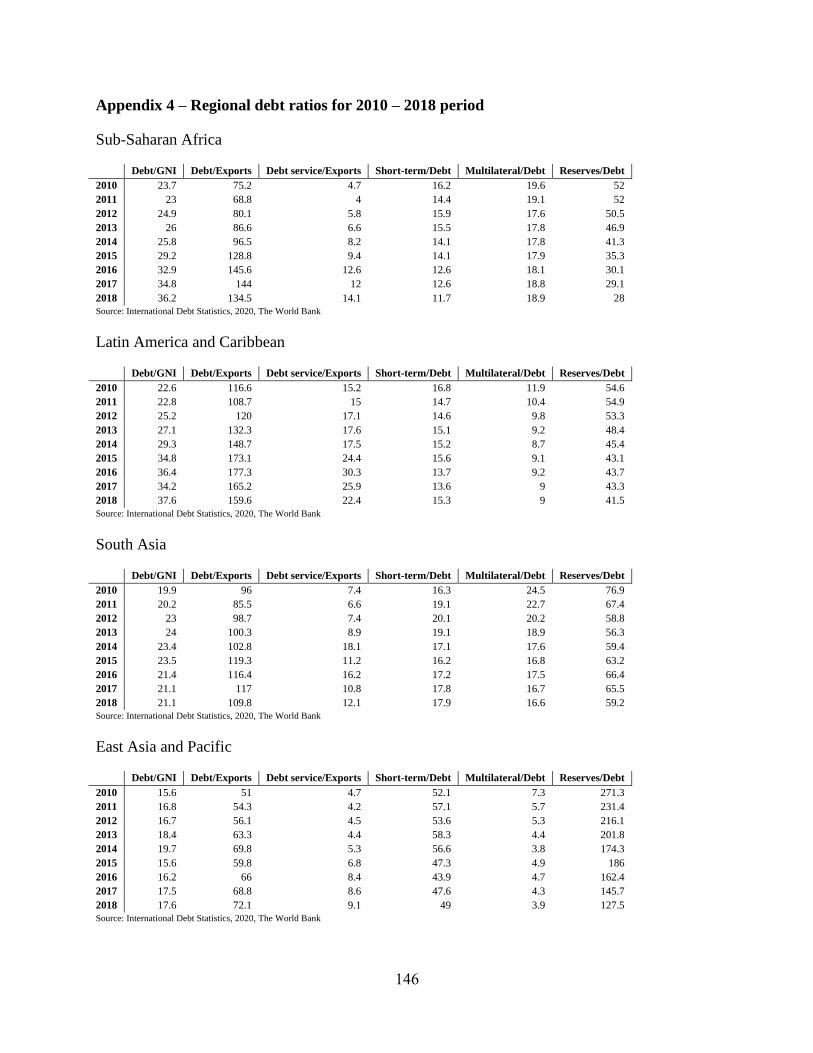
146
Appendix 4 – Regional debt ratios for 2010 – 2018 period
Sub-Saharan Africa
Debt/GNI Debt/Exports Debt service/Exports Short-term/Debt Multilateral/Debt Reserves/Debt
2010 23.7 75.2 4.7 16.2 19.6 52
2011 23 68.8 4 14.4 19.1 52
2012 24.9 80.1 5.8 15.9 17.6 50.5
2013 26 86.6 6.6 15.5 17.8 46.9
2014 25.8 96.5 8.2 14.1 17.8 41.3
2015 29.2 128.8 9.4 14.1 17.9 35.3
2016 32.9 145.6 12.6 12.6 18.1 30.1
2017 34.8 144 12 12.6 18.8 29.1
2018 36.2 134.5 14.1 11.7 18.9 28
Source: International Debt Statistics, 2020, The World Bank
Latin America and Caribbean
Debt/GNI Debt/Exports Debt service/Exports Short-term/Debt Multilateral/Debt Reserves/Debt
2010 22.6 116.6 15.2 16.8 11.9 54.6
2011 22.8 108.7 15 14.7 10.4 54.9
2012 25.2 120 17.1 14.6 9.8 53.3
2013 27.1 132.3 17.6 15.1 9.2 48.4
2014 29.3 148.7 17.5 15.2 8.7 45.4
2015 34.8 173.1 24.4 15.6 9.1 43.1
2016 36.4 177.3 30.3 13.7 9.2 43.7
2017 34.2 165.2 25.9 13.6 9 43.3
2018 37.6 159.6 22.4 15.3 9 41.5
Source: International Debt Statistics, 2020, The World Bank
South Asia
Debt/GNI Debt/Exports Debt service/Exports Short-term/Debt Multilateral/Debt Reserves/Debt
2010 19.9 96 7.4 16.3 24.5 76.9
2011 20.2 85.5 6.6 19.1 22.7 67.4
2012 23 98.7 7.4 20.1 20.2 58.8
2013 24 100.3 8.9 19.1 18.9 56.3
2014 23.4 102.8 18.1 17.1 17.6 59.4
2015 23.5 119.3 11.2 16.2 16.8 63.2
2016 21.4 116.4 16.2 17.2 17.5 66.4
2017 21.1 117 10.8 17.8 16.7 65.5
2018 21.1 109.8 12.1 17.9 16.6 59.2
Source: International Debt Statistics, 2020, The World Bank
East Asia and Pacific
Debt/GNI Debt/Exports Debt service/Exports Short-term/Debt Multilateral/Debt Reserves/Debt
2010 15.6 51 4.7 52.1 7.3 271.3
2011 16.8 54.3 4.2 57.1 5.7 231.4
2012 16.7 56.1 4.5 53.6 5.3 216.1
2013 18.4 63.3 4.4 58.3 4.4 201.8
2014 19.7 69.8 5.3 56.6 3.8 174.3
2015 15.6 59.8 6.8 47.3 4.9 186
2016 16.2 66 8.4 43.9 4.7 162.4
2017 17.5 68.8 8.6 47.6 4.3 145.7
2018 17.6 72.1 9.1 49 3.9 127.5
Source: International Debt Statistics, 2020, The World Bank
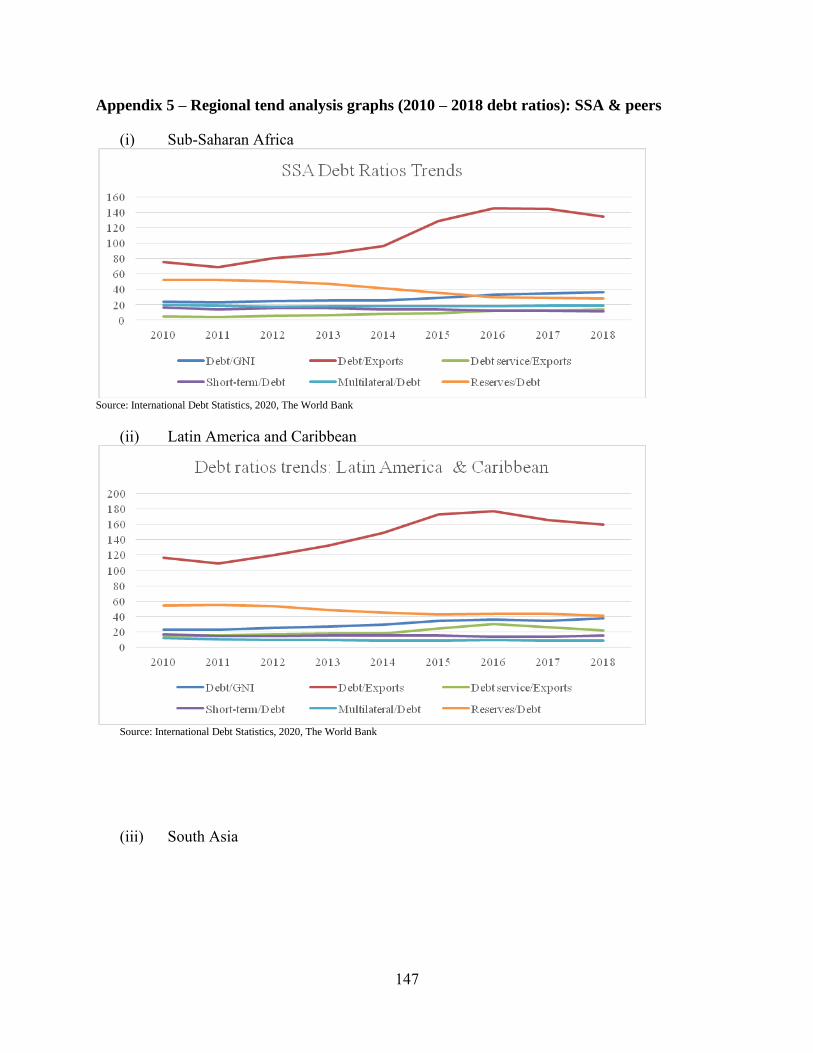
147
Appendix 5 – Regional tend analysis graphs (2010 – 2018 debt ratios): SSA & peers
(i) Sub-Saharan Africa
Source: International Debt Statistics, 2020, The World Bank
(ii) Latin America and Caribbean
Source: International Debt Statistics, 2020, The World Bank
(iii) South Asia
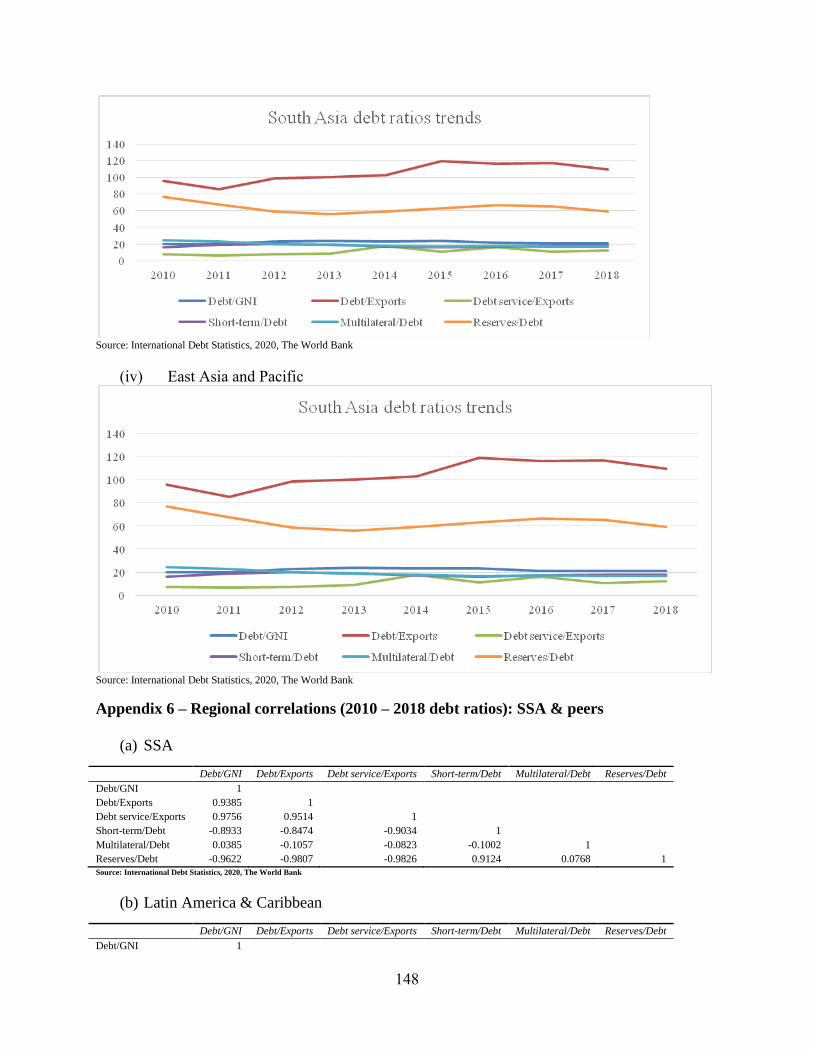
148
Source: International Debt Statistics, 2020, The World Bank
(iv) East Asia and Pacific
Source: International Debt Statistics, 2020, The World Bank
Appendix 6 – Regional correlations (2010 – 2018 debt ratios): SSA & peers
(a) SSA
Debt/GNI Debt/Exports Debt service/Exports Short-term/Debt Multilateral/Debt Reserves/Debt
Debt/GNI 1 Debt/Exports 0.9385 1 Debt service/Exports 0.9756 0.9514 1 Short-term/Debt -0.8933 -0.8474 -0.9034 1 Multilateral/Debt 0.0385 -0.1057 -0.0823 -0.1002 1 Reserves/Debt -0.9622 -0.9807 -0.9826 0.9124 0.0768 1
Source: International Debt Statistics, 2020, The World Bank
(b) Latin America & Caribbean
Debt/GNI Debt/Exports Debt service/Exports Short-term/Debt Multilateral/Debt Reserves/Debt
Debt/GNI 1
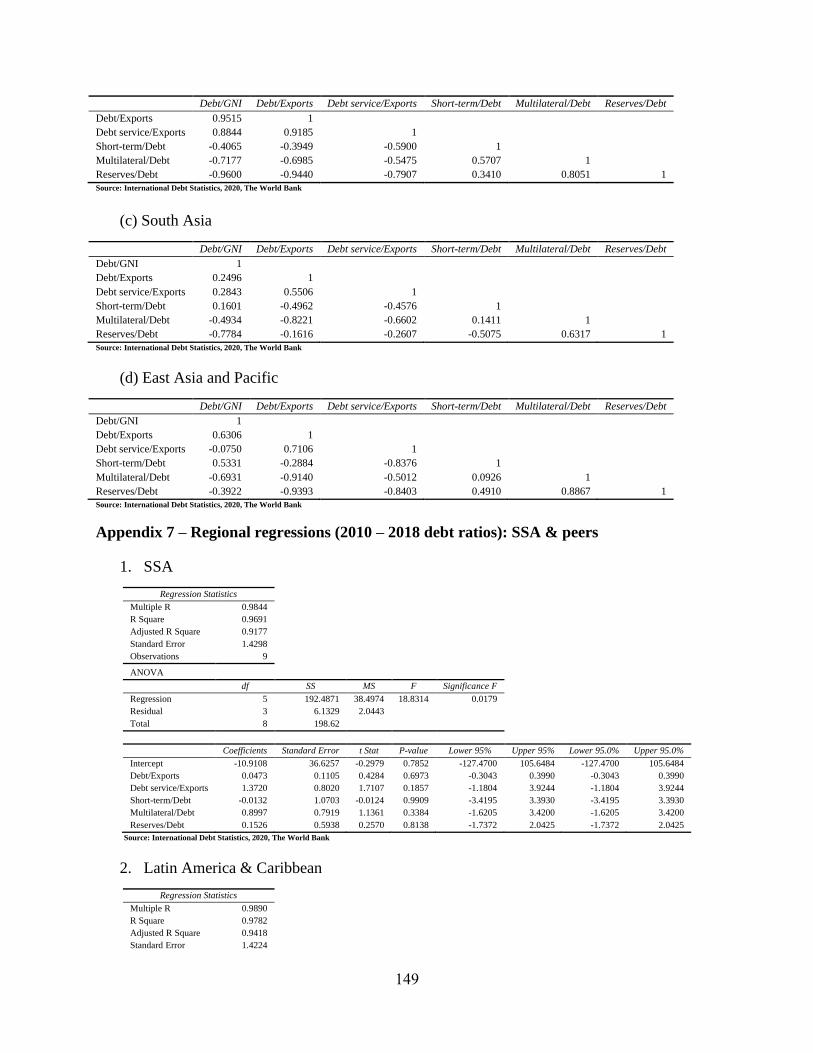
149
Debt/GNI Debt/Exports Debt service/Exports Short-term/Debt Multilateral/Debt Reserves/Debt
Debt/Exports 0.9515 1 Debt service/Exports 0.8844 0.9185 1 Short-term/Debt -0.4065 -0.3949 -0.5900 1 Multilateral/Debt -0.7177 -0.6985 -0.5475 0.5707 1 Reserves/Debt -0.9600 -0.9440 -0.7907 0.3410 0.8051 1
Source: International Debt Statistics, 2020, The World Bank
(c) South Asia
Debt/GNI Debt/Exports Debt service/Exports Short-term/Debt Multilateral/Debt Reserves/Debt
Debt/GNI 1 Debt/Exports 0.2496 1 Debt service/Exports 0.2843 0.5506 1 Short-term/Debt 0.1601 -0.4962 -0.4576 1 Multilateral/Debt -0.4934 -0.8221 -0.6602 0.1411 1 Reserves/Debt -0.7784 -0.1616 -0.2607 -0.5075 0.6317 1
Source: International Debt Statistics, 2020, The World Bank
(d) East Asia and Pacific
Debt/GNI Debt/Exports Debt service/Exports Short-term/Debt Multilateral/Debt Reserves/Debt
Debt/GNI 1 Debt/Exports 0.6306 1 Debt service/Exports -0.0750 0.7106 1 Short-term/Debt 0.5331 -0.2884 -0.8376 1 Multilateral/Debt -0.6931 -0.9140 -0.5012 0.0926 1 Reserves/Debt -0.3922 -0.9393 -0.8403 0.4910 0.8867 1
Source: International Debt Statistics, 2020, The World Bank
Appendix 7 – Regional regressions (2010 – 2018 debt ratios): SSA & peers
1. SSA
Regression Statistics Multiple R 0.9844 R Square 0.9691 Adjusted R Square 0.9177 Standard Error 1.4298 Observations 9 ANOVA
df SS MS F Significance F Regression 5 192.4871 38.4974 18.8314 0.0179 Residual 3 6.1329 2.0443 Total 8 198.62
Coefficients Standard Error t Stat P-value Lower 95% Upper 95% Lower 95.0% Upper 95.0%
Intercept -10.9108 36.6257 -0.2979 0.7852 -127.4700 105.6484 -127.4700 105.6484
Debt/Exports 0.0473 0.1105 0.4284 0.6973 -0.3043 0.3990 -0.3043 0.3990
Debt service/Exports 1.3720 0.8020 1.7107 0.1857 -1.1804 3.9244 -1.1804 3.9244
Short-term/Debt -0.0132 1.0703 -0.0124 0.9909 -3.4195 3.3930 -3.4195 3.3930
Multilateral/Debt 0.8997 0.7919 1.1361 0.3384 -1.6205 3.4200 -1.6205 3.4200
Reserves/Debt 0.1526 0.5938 0.2570 0.8138 -1.7372 2.0425 -1.7372 2.0425
Source: International Debt Statistics, 2020, The World Bank
2. Latin America & Caribbean
Regression Statistics Multiple R 0.9890 R Square 0.9782 Adjusted R Square 0.9418 Standard Error 1.4224
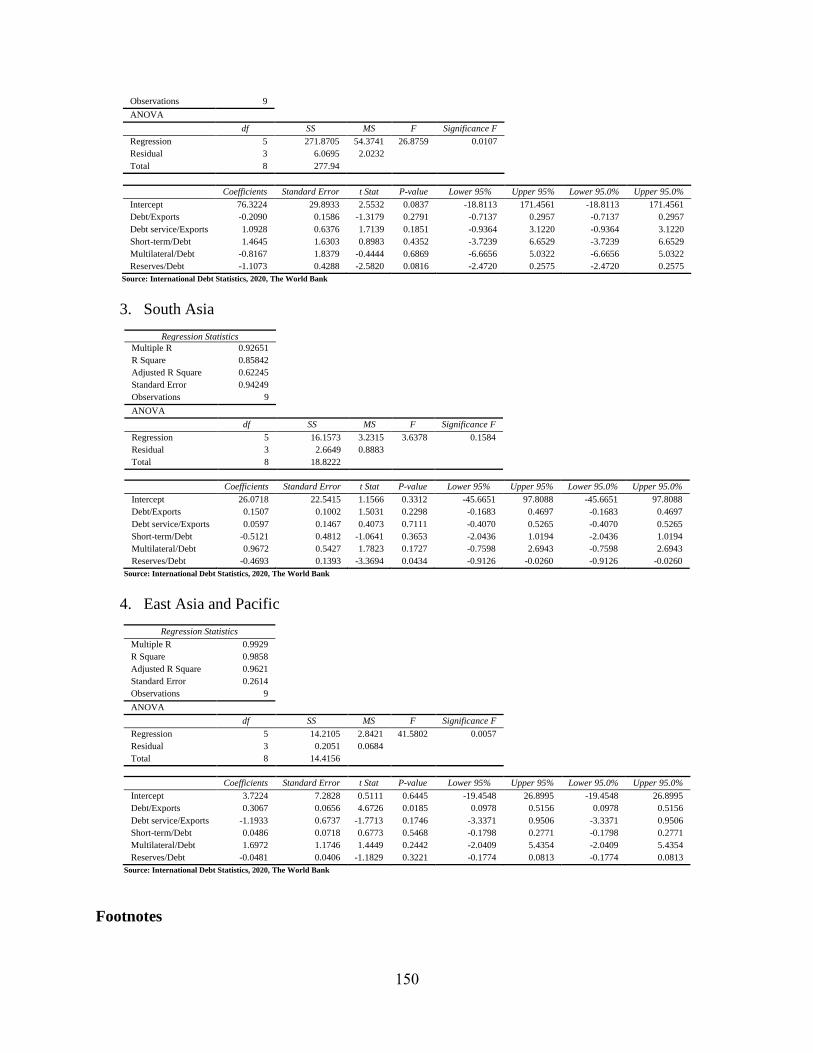
150
Observations 9 ANOVA
df SS MS F Significance F Regression 5 271.8705 54.3741 26.8759 0.0107 Residual 3 6.0695 2.0232 Total 8 277.94
Coefficients Standard Error t Stat P-value Lower 95% Upper 95% Lower 95.0% Upper 95.0%
Intercept 76.3224 29.8933 2.5532 0.0837 -18.8113 171.4561 -18.8113 171.4561
Debt/Exports -0.2090 0.1586 -1.3179 0.2791 -0.7137 0.2957 -0.7137 0.2957
Debt service/Exports 1.0928 0.6376 1.7139 0.1851 -0.9364 3.1220 -0.9364 3.1220
Short-term/Debt 1.4645 1.6303 0.8983 0.4352 -3.7239 6.6529 -3.7239 6.6529
Multilateral/Debt -0.8167 1.8379 -0.4444 0.6869 -6.6656 5.0322 -6.6656 5.0322
Reserves/Debt -1.1073 0.4288 -2.5820 0.0816 -2.4720 0.2575 -2.4720 0.2575
Source: International Debt Statistics, 2020, The World Bank
3. South Asia
Regression Statistics Multiple R 0.92651 R Square 0.85842 Adjusted R Square 0.62245 Standard Error 0.94249 Observations 9 ANOVA
df SS MS F Significance F Regression 5 16.1573 3.2315 3.6378 0.1584 Residual 3 2.6649 0.8883 Total 8 18.8222
Coefficients Standard Error t Stat P-value Lower 95% Upper 95% Lower 95.0% Upper 95.0%
Intercept 26.0718 22.5415 1.1566 0.3312 -45.6651 97.8088 -45.6651 97.8088
Debt/Exports 0.1507 0.1002 1.5031 0.2298 -0.1683 0.4697 -0.1683 0.4697
Debt service/Exports 0.0597 0.1467 0.4073 0.7111 -0.4070 0.5265 -0.4070 0.5265
Short-term/Debt -0.5121 0.4812 -1.0641 0.3653 -2.0436 1.0194 -2.0436 1.0194
Multilateral/Debt 0.9672 0.5427 1.7823 0.1727 -0.7598 2.6943 -0.7598 2.6943
Reserves/Debt -0.4693 0.1393 -3.3694 0.0434 -0.9126 -0.0260 -0.9126 -0.0260
Source: International Debt Statistics, 2020, The World Bank
4. East Asia and Pacific
Regression Statistics Multiple R 0.9929 R Square 0.9858 Adjusted R Square 0.9621 Standard Error 0.2614 Observations 9 ANOVA
df SS MS F Significance F Regression 5 14.2105 2.8421 41.5802 0.0057 Residual 3 0.2051 0.0684 Total 8 14.4156
Coefficients Standard Error t Stat P-value Lower 95% Upper 95% Lower 95.0% Upper 95.0%
Intercept 3.7224 7.2828 0.5111 0.6445 -19.4548 26.8995 -19.4548 26.8995
Debt/Exports 0.3067 0.0656 4.6726 0.0185 0.0978 0.5156 0.0978 0.5156
Debt service/Exports -1.1933 0.6737 -1.7713 0.1746 -3.3371 0.9506 -3.3371 0.9506
Short-term/Debt 0.0486 0.0718 0.6773 0.5468 -0.1798 0.2771 -0.1798 0.2771
Multilateral/Debt 1.6972 1.1746 1.4449 0.2442 -2.0409 5.4354 -2.0409 5.4354
Reserves/Debt -0.0481 0.0406 -1.1829 0.3221 -0.1774 0.0813 -0.1774 0.0813
Source: International Debt Statistics, 2020, The World Bank
Footnotes
151
i S&P Global Ratings 2017 ii The Paris Club is an informal group of 19 creditor nations that, since inception, meet in Paris each month. Its
objective is to find workable solutions to payment problems faced by debtor nations. (see Adam Hayes, 2019,
Investopedia – accessed 21 June 2019)
iii International Debt Statistics, 2019, The World Bank