Embed Size (px)
Citation preview

1
Determinants of the detrital arthropod community structure: the effects of temperature and resources along an environmental gradient
Jean-Philippe Lessard, Tara E. Sackett, William N. Reynolds, David A. Fowler and Nathan J. Sanders
J.-P. Lessard ([email protected]) and N. J. Sanders, Center for Macroecology, Evolution and Climate, Dept of Biology, Univ. of Copenhagen, Universitetsparken 15, DK-2100 Copenhagen O, Denmark. – W. N. Reynolds, D. A. Fowler and N. J. Sanders, Dept of Ecology and Evolutionary Biology, Univ. of Tennessee, 569 Dabney Hall, Knoxville, TN 37996, USA. –T. E. Sackett, Dept of Geography, Univ. of Toronto Mississauga, 3359 Mississauga Road N, South Building Mississauga, ON, L5L IC6, Canada.
Understanding the factors that shape community structure, and whether those factors vary geographically, has a long history in ecology. Because the abiotic environment often varies in predictable ways along elevational gradients, montane systems are ideal to study geographic variation in the determinants of community structure. In this study, we first examined the relative importance of environmental gradients, microclimate, and food resources in driving spatial variation in the structure of detrital communities in forests of the southeastern USA. !en, in order to assess whether the determinants of detrital community structure varied along a climatic gradient, we manipulated resource availability and microclimatic conditions at 15 sites along a well-studied elevational gradient. We found that arthropod abundance and richness generally declined with increasing elevation, though the shape of the relationship varied among taxa. Overall community composi-tion and species evenness also varied systematically along the climatic gradient, suggesting that broad-scale variation in the abiotic environment drives geographic variation in both patterns of diversity and community composition. After control-ling for the e"ect of climatic variation along the elevational gradient, food resource addition and microclimate alteration influenced the richness and abundance of some taxa. However, the e"ect of food resource addition and microclimate alteration on the richness and abundance of arthropods did not vary with elevation. In addition, the degree of community similarity between control plots and either resource-added or microclimate-altered plots did not vary with elevation sug-gesting a consistent influence of microclimate and food addition on detrital arthropod community structure. We conclude that using manipulative experiments along environmental gradients can help tease apart the relative importance and detect the interactive e"ects of local-scale factors and broad-scale climatic variation in shaping communities.
Because both abiotic conditions and local community composition vary geographically, the processes that deter-mine community structure could also vary geographically. Indeed, there is a long history in ecology of attempts to understand how local processes like competition, preda-tion, and herbivory vary along geographic gradients, such as the latitudinal gradient (Paine 1966, MacArthur 1972, Jeanne 1979, Pennings et al. 2003, Schemske et al. 2009). Elucidating the ecological determinants of community structure along climatic gradients can be challenging because of the confounding influence of multiple factors such as evolutionary history (Ricklefs and Schluter 1993) and variation in the composition of regional species pools (Cornell 1999). However, studies carried out along eleva-tional gradients can partially circumvent these problems, for at least two reasons. First, variation in evolutionary history is likely to be less pronounced along elevational gradients than along latitudinal gradients because elevational gradient studies are typically restricted to one region (Ricklefs 2007).
Second, elevational gradients typically exhibit a continuous change in climate (i.e. temperature often decays monotoni-cally with increasing elevation; McCain 2005) while habitat type changes little (relative to changes along latitudinal gra-dients), minimizing the confounding e"ects of among-site di"erences in habitat characteristics (Sanders et al. 2007, Romdal and Rahbek 2009).
Species diversity often varies in predictable ways along elevational gradients. Linear and monotonic relationships between species diversity and elevation are widespread in both plant and animal taxa (McCain 2005, Rahbek 2005, Nogues-Bravo et al. 2008). However, understanding the underlying mechanisms driving these diversity patterns remains elusive. Although temperature often correlates with diversity along elevational gradients, temperature might mediate changes in diversity either directly or indirectly. With arthropods, temperature can directly impose a physiological limit on the elevational distribution of taxa (Addo-Bediako et al. 2000, Clarke and Gaston 2006). Another possibility, which has not
Oikos 000: 001–011, 2010 doi: 10.1111/j.1600-0706.2010.18772.x
© 2010 !e Authors. Oikos © 2010 Nordic Society Oikos Subject Editor: Daniel Gruner. Accepted 19 July 2010

2
been thoroughly examined, is that temperature might medi-ate access to food resources (Sanders et al. 2007) such that more time can be spent foraging for resources at low than at high elevation. Distinguishing between these possibilities requires experimentally manipulating both temperature and resource availability along elevational gradients, which is the central aim of this paper.
Broad-scale variation in climate, whether along latitudi-nal or elevational gradients, influences both the structure of arthropod communities (e.g. the number of species; Sanders et al. 2010) and the rates of activity of particular taxa (Jeanne 1979, Pennings and Silliman 2005, O’Donnell et al. 2007). In particular, variation in temperature can modify species interactions (Cerdá et al. 1997, Morelissen and Harley 2007, O’Connor 2009) and influence the degree to which food resources are accessible (Sanders et al. 2007, Stringer et al. 2007). Small-scale variation in temperature within a single site can also drive spatial variation in rates of activity and in the composition and abundance of a variety of arthropod groups (Niemela et al. 1996, Cerdá et al. 1998). For example, humid-ity and temperature control the timing and duration of ant foraging activity at small spatial scales (e.g. 1–10 m2) (Kaspari 1993, Kaspari and Weiser 2000) and rates of nest emigration/relocation in some forest ant species (Smallwood 1982).
Spatial variation in food resource availability can also shape the structure of local arthropod communities (Polis et al. 1997). In detrital communities, food resource addition often increases abundance and species richness of ants (Kaspari 1996, McGlynn 2006, Arnan et al. 2007), spiders (Chen and Wise 1999), beetles (Yang 2006), and microarthropods (Chen and Wise 1999, Halaj and Wise 2002). Food resource addition can either increase macroarthropod abundance via bottom–up e"ects from increased abundance of prey for mac-roarthropods (Chen and Wise 1999), or increase the activity of top predators (e.g. dominant ants) such that intraguild pre-dation intensifies and subsequently decreases the abundance of subdominant predators (e.g. spiders, beetles) (Moya-Larano and Wise 2007). Previous studies have documented the e"ects of resource addition on detrital communities (Chen and Wise 1999, Halaj and Wise 2002), but to our knowledge no studies have examined whether there is geographic variation in the e"ects of resource addition on detrital communities.
In temperate forests, pulses of nitrogen-based resources can dramatically alter the cycling of nitrogen and stimulate bacterial and fungal communities, which indicates possible nitrogen limitation (Yang 2004, Lovett et al. 2009). A pulse in nitrogen-based resource availability can directly a"ect detrital communities (Yang 2006). In particular, specialized and generalist scavenging beetles increase in density following nitrogen-based food resource addition (Yang 2006). Omniv-orous taxa such as ants and predators such as spiders can also increase in density, especially if nitrogen-based resource addi-tion increases the density of prey items such as springtails and mites (Cole et al. 2008), which feed on microbes occurring on decaying material (Klironomos et al. 1992).
In this study, we took advantage of natural variation in the abiotic environment combined with an experimental manipulation to examine the relative and interactive influ-ence of regional climate and local factors in shaping commu-nity structure. In particular, we manipulated food resource availability and microclimate along an elevational gradient
to assess whether there was geographic variation in the e"ect of these local factors on the structure of arthropod commu-nities. First we tested whether there is a relationship between (1) arthropod abundance and elevation and (2) between arthropod richness and elevation, and we tested whether the relationship was linear or monotonic. We predicted that the diversity of all arthropod groups would decline with eleva-tion because the drastic change in temperature should limit the number of species that can persist and the size of popu-lations at high elevations. Our experimental design further allowed for disentangling competing ecological mechanisms underlying elevational gradients in arthropod diversity. Specifically, we tested whether temperature directly drives variation in arthropod abundance and richness or a"ects arthropods by controlling access to food resources. We tested this hypothesis in two ways: we examined whether there is an interaction between food addition and microclimate altera-tion and whether there is an interaction between food addi-tion and elevation. Second, we tested the hypotheses that microclimate alteration reduces arthropod abundance and richness and that food resource addition increases arthro-pod abundance and richness. Since all arthropod groups are ectotherms, we predicted that all groups would decrease in abundance and richness in the temperature-reduced plots. However, we predicted that because omnivorous ants and scavenging beetles can directly exploit added food resources, these groups would respond more strongly to food addition than would spiders, springtails or mites. Finally, we tested the hypothesis that changes in the richness, abundance and composition of arthropods associated with the manipulation of local factors would vary along the elevational gradient. More specifically, we predicted that the importance of food resource availability in structuring arthropod communities would decline with increasing elevation because environ-mental filtering might be more limiting than food availabil-ity in harsh climatic conditions.
Methods
Study sites
!is experiment was conducted between May–September 2007 at 15 sites along an elevational gradient (383–1318 m) in Great Smoky Mountains National Park, Tennessee, USA. !e 15 sites were located at least 100 m apart in tree-fall gaps of mixed hardwood forest away from roads and heavily vis-ited trails. Sites were evenly spread along the elevational gradi-ent. Gap canopy cover varied from 60% to 85%. Dominant tree species included Acer saccharum, Quercus rubra, Tsuga canadensis, Liriodendron tulipifera, Fagus grandifolia, Castanea dentata and Betula alleghaniensis (details in Supplementary material Appendix 1), and the composition of the tree com-munity did not vary systematically among the plots. Annual temperature declines linearly with elevation in this system (Sanders et al. 2007, Supplementary material Appendix 1).
Experimental design
At each of the 15 sites we randomly placed four 4-m2 plots at least 2 m from one another, and we randomly assigned each
3
plot to one of four treatments: food addition, shading, food addition shading, or control (no food or shade). Previous studies have used a variety of food items to enhance food resource input into detrital communities: mushrooms, pota-toes, instant Drosophila-medium (Chen and Wise 1999), shredded muck mulch (Halaj and Wise 2002), and cicada carcasses (Yang 2006). Here we manipulated food avail-ability by adding 225 g of ground dog food (18% protein, 8% fat, 6% fiber, 12% water) once per week throughout the month of June. Beginning in July, we used dead crickets (length 1.5 cm) as a food resource instead of dog food because dog food attracted bears near some of the study sites. Changing the type of food resource in mid-summer might have a"ected the responses of some arthropod species. Note however that both dog food and crickets were protein-based, and all plots would have been equally a"ected. !at is, we did not apply dog food to low elevation plots, but crickets to high elevation plots. In addition, previous resource addition experiments with detrital communities have varied widely in the food item they used, in the same way that the resources available to the detrital community varies throughout the summer (Sackett et al. unpubl.).
To assess whether disturbance by bears a"ected the results of our experiment, we conducted our analyses excluding the sites that had been frequently visited. Removing these sites from our analyses did not a"ect the general conclusions stemming from the experiment. Once per week until the end of the experiment (i.e. 16 September 2007), we added 50 crickets to the food addition treatment plots. Food items were evenly distributed within a 1-m2 quadrat in the center of each experimental plot.
We manipulated shade (thereby reducing temperature) by using square shade tables. Shade tables consisted of 90% knitted polyethylene shade cloth covering a square PVC pipe frame anchored by rebar stakes placed 30 cm in the ground at each plot corner, with the shade cloth 50 cm from the ground. Although control plots and food addition plots had no shade tables, we placed a rebar at each corner to control for disturbance e"ects.
Arthropod sampling
!ree months after the beginning of the experiment (mid-September 2007), we sampled the leaf-litter arthropod communities within each experimental plot using Winkler extractors (details in Sanders et al. 2007). We sampled leaf-litter arthropods two weeks after the last food addition to increase the likelihood that the sampled communities reflected the structure of the resident rather than transient arthropod communities. Winkler extraction consists of sift-ing the leaf-litter through a metal screen, and transferring the leaf-litter residue into a mesh bag. !e mesh bag is then suspended within a nylon bag to which is attached a jar filled with 95% ethanol. Arthropods were collected from the ethanol 72 h after the Winkler extractors were sus-pended. We counted and identified all ants (Formicidae), spiders (Araneae), beetles (Coleoptera), springtails (Col-lembola) and mites (Acari). We identified ants to species (except for those in the genera Pyramica and Stenamma), beetles to morphospecies within families, and spiders, mites and springtails to morphospecies. All taxa were identified
to the lowest possible taxonomic resolution by well-trained investigators. Although we identified adult spider speci-mens to species, we present data at the family level because the majority of individuals in our samples were immature and could be identified only to the family level. Family-level richness and species richness (excluding immature individ-uals) were positively correlated (r2 0.78, p 0.0001). Voucher specimens were deposited in N. J. Sanders’s collec-tion in the Dept of Ecology and Evolutionary Biology at the Univ. of Tennessee.
Microclimate treatments
We assessed whether resource addition and shading a"ected the microclimatic condition in our experimental plots by recording soil and air temperature and humidity once per month in each experimental plot. We measured ambi-ent air temperature and humidity in each treatment plot using an hygro-thermometer. We used a hand-held infra-red thermometer to measure ground surface temperature, and a soil water content measurement system to measure soil humidity. For each microclimatic variable, we averaged four measurements taken at random at the center of each experimental plot, once per month. Of all microclimatic factors measured, only ground temperature was a"ected, and temperature was a"ected only by the shade treat-ments. Ground temperature in shade treatments was on average 2.80 0.64°C lower than in control treatments (F1,13 22.26, p 0.0001).
Statistical analyses
Because we were interested in the shape of the relationship between elevation and the abundance and richness of several taxa, we used regressions to test whether richness and abun-dance were related to elevation. We tested for the best-fit line using a second-degree polynomial or a linear model. We selected the best model by comparing AIC scores.
Our experimental design was a 2 2 factorial analysis of covariance (ANCOVA) with food, shade and their interac-tion as the main e"ects and elevation as the covariate. We used MANCOVA to assess the overall e"ects of food, shade and elevation on richness and abundance of multiple arthro-pod taxa: the abundance and richness of each taxa were our response variables. Because the MANCOVA yielded significant results (Wilks’ lambda 0.054, p 0.0001), we followed it with subsequent ANCOVA’s on each taxon. ANCOVA assesses how much of the variation in the response variable is explained by local factors (i.e. food addition and microclimate alteration) after removing the e"ect of the covariate (i.e. elevation). Because the response variable and the covariate (elevation) were not always linearly related, we added a polynomial term (i.e. elevation2) to the ANCOVA model when a second-degree polynomial model best fit the relationship between the response variable and the covari-ate (Table 2). In addition, because the food shade, food
shade elevation, food elevation and shade eleva-tion interactions were never significant, we did not include interaction terms in any of the analyses. We did not use a traditional Bonferroni correction because it is generally too conservative and unfairly penalizes analyses involving
4
(details summarized in Table 1 and Supplementary material Appendix 2).
!e pattern of ant species richness with elevation was best fit with a second-degree polynomial regression and peaked at
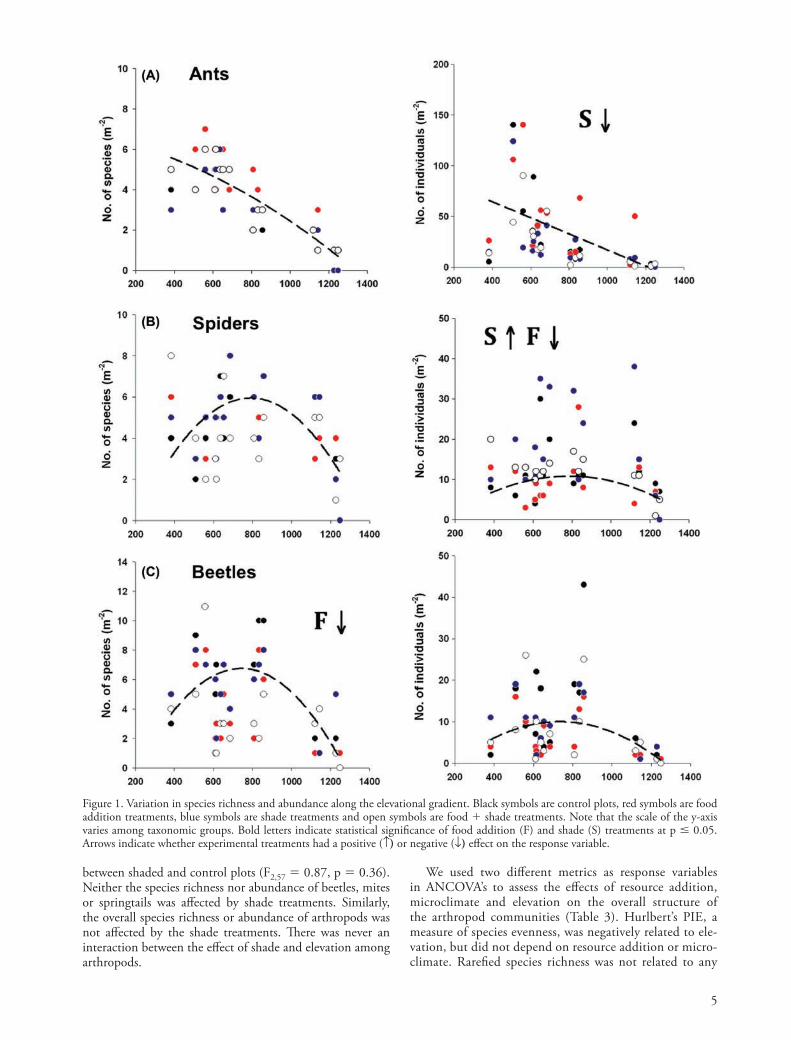
600 m, whereas the relationship between worker abundance and elevation was best fit by a linear regression (Fig. 1, Table 2). Both the richness and abundance of spiders were best fit with a second-degree polynomial regression and peaked at 600 m, however these relationships were only marginally significant following sequential Bonferroni corrections. Both the richness and abundance of beetles were best fit with a second-degree polynomial regression. Species richness of beetles peaked at 600 m, while the abundance of beetles peaked at 900 m. !e species richness and abundance of mites were not related to ele-vation. !e richness of springtails was not related to elevation, even though the abundance of springtails was best fit with a second-degree polynomial regression (not significant using sequential Bonferroni corrections). Overall species richness of arthropods was best fit by a second-degree polynomial regres-sion and peaked at 600 m, whereas overall arthropod abun-dance was best fit with a decelerating linear regression.
Food addition had no statistically significant e"ect on species richness or abundance of ant workers in the leaf litter (Fig. 1, Supplementary material Appendix 3). !ere was no e"ect of food addition on species richness of spiders, but the abundance of spiders was, on average, 32% lower in food addition plots (7.89 1.54) than in control plots (11.89 2.01). !e species richness of beetles was 33% lower in food addition plots (4 0.88) than in control plots (6 1.08), but the abundance of beetles did not di"er. !e richness and abundance of both springtails and mites were not a"ected by food addition. Overall arthropod richness was 11% lower in food addition plots (26.95 2.42) than in the control plots (31.78 2.47), but overall arthropod abundance did not di"er between treatments. !ere was no interaction between the e"ect of food addition and elevation.
Ant species richness was 11% lower in shade treatments (3.11 0.49) than in control treatments (3.45 0.55), but there was only a marginal statistical di"erence in the abundance of ant workers between shade and control treat-ments (Fig. 1, Supplementary material Appendix 3). In con-trast, the richness of spiders did not di"er between shade and control treatments whereas the abundance of spiders was 43% higher in shade treatments (16.95 2.67) than in control treatments (11.89 2.01). For spiders, within-site abundance and richness patterns were driven by web-spinning spiders, with a 62% higher abundance in shade plots (10.28 2.07) than in control plots (6.33 1.54), while the abundance of cursorial spiders did not di"er
multiple comparisons (Gotelli and Ellison 2004). How-ever, we used a sequential Bonferroni correction, which is less conservative than traditional Bonferroni correction. Note that a sequential Bonferroni correction also increases the probability of a type II error and thus should be used cautiously (Nakagawa 2004).
We also assessed the e"ects of resource addition, micro-climate and elevation on the structure of the overall arthro-pod communities using two di"erent metrics of community structure. We estimated species evenness using Hurlbert’s (1971) PIE, which estimates the probability of an interspe-cific encounter in a given sample:
PIE NN 1
1 pi2
i 1
S
where N represents the total number of individuals, S is the number of species, and pi is the proportion of the sam-ple comprised of species i. PIE estimates the probability that two randomly sampled individuals represent two dif-ferent species. PIE is an unbiased metric of evenness and is equivalent to measuring the slope of an individual-based rarefaction curve at its base (Olszewski 2004). We used EcoSim 7.0 (Gotelli and Entsminger 2009) to calculate PIE for each experimental plot. We also estimated rarefied species richness for each experimental plot. Rarefaction standardizes species richness across experimental plots based on the lowest number of individuals collected in any one sample. !erefore, rarefaction assesses whether di"er-ences in species richness among plots or treatments per-sist after controlling for di"erences in abundance. In our case, we rarefied richness in communities to 39 individuals using the VEGAN package in R (Oksanen et al. 2008).
Finally, we assessed whether the degree to which overall arthropod community composition di"ered between experi-mental and control plots varied with elevation. We used the Bray–Curtis similarity index to assess pair-wise di"erences in community composition between experimental and control plots. We compared the species composition of control plots to the species composition of shade plots and resource enhanced plots. We then used linear regression to test whether the degree of similarity between control plots and either resource enhanced or shaded plots varied with elevation.
Results
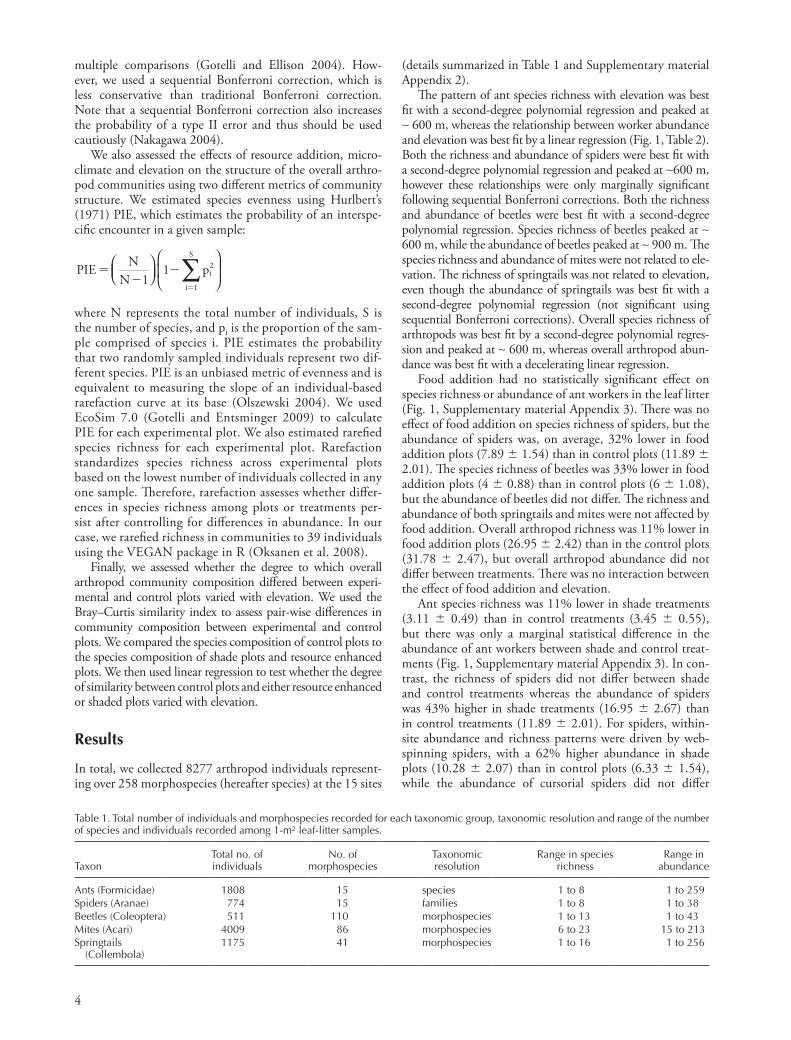
In total, we collected 8277 arthropod individuals represent-ing over 258 morphospecies (hereafter species) at the 15 sites
Table 1. Total number of individuals and morphospecies recorded for each taxonomic group, taxonomic resolution and range of the number of species and individuals recorded among 1-m2 leaf-litter samples.
TaxonTotal no. of individuals
No. of morphospecies
Taxonomic resolution
Range in species richness
Range in abundance
Ants (Formicidae) 1808 15 species 1 to 8 1 to 259Spiders (Aranae) 774 15 families 1 to 8 1 to 38Beetles (Coleoptera) 511 110 morphospecies 1 to 13 1 to 43Mites (Acari) 4009 86 morphospecies 6 to 23 15 to 213Springtails
(Collembola)1175 41 morphospecies 1 to 16 1 to 256
5
Figure 1. Variation in species richness and abundance along the elevational gradient. Black symbols are control plots, red symbols are food addition treatments, blue symbols are shade treatments and open symbols are food shade treatments. Note that the scale of the y-axis varies among taxonomic groups. Bold letters indicate statistical significance of food addition (F) and shade (S) treatments at p 0.05. Arrows indicate whether experimental treatments had a positive ( ) or negative ( ) e"ect on the response variable.
between shaded and control plots (F2,57 0.87, p 0.36). Neither the species richness nor abundance of beetles, mites or springtails was a"ected by shade treatments. Similarly, the overall species richness or abundance of arthropods was not a"ected by the shade treatments. !ere was never an interaction between the e"ect of shade and elevation among arthropods.
We used two di"erent metrics as response variables in ANCOVA’s to assess the e"ects of resource addition, microclimate and elevation on the overall structure of the arthropod communities (Table 3). Hurlbert’s PIE, a measure of species evenness, was negatively related to ele-vation, but did not depend on resource addition or micro-climate. Rarefied species richness was not related to any

6
p 0.64) or microclimate altered plots (r2 0.02, DF 14, p 0.64) were compared to control plots.
Discussion
Broad-scale variation in climate drives spatial variation in the structure and composition of many detrital communi-ties (Reynolds et al. 2003, Chatzaki et al. 2005, Escobar et al. 2005, Lessard et al. 2007, Sanders et al. 2007, 2010).
of the explanatory variables, suggesting that variation in arthropod abundance mediates whatever e"ects the treat-ments or elevation have on overall arthropod richness. !ere was no interaction between food addition and eleva-tion, or between shade and elevation for either evenness or rarefied richness.
!e Bray–Curtis similarity index indicated that the degree to which community composition di"ered between control and experimental plots was not related to elevation, when either the resource enhanced plots (r2 0.02, DF 14,
Figure 1. (Continued)
7
taxa either declined linearly with elevation or peaked at mid-elevation. However, the fact that overall arthropod abundance declined linearly with elevation suggests that tem-perature constrains the size of populations at high elevations (Sanders et al. 2007). Note that rarefied arthropod species richness was not related to elevation, suggesting that pat-terns of total arthropod species richness along the elevational gradient were sensitive to di"erences in local abundance. !at is, richness varied along the elevational gradient likely because abundance varied along the elevational gradient.
As a caveat to our experiment, the size of the sampling grain can greatly a"ect the shape of the abundance and richness-elevation relationship within and among groups of varying body sizes (Rahbek 2005). Di"erences in body size and dispersal ability among taxonomic groups are likely to a"ect how organisms perceive the environment: small-bodied organisms may respond to finer scale heterogeneity in the environment than large-bodied ones (Kaspari and Weiser 1999, Farji-Brener et al. 2004). !us, among-taxa di"erences in patterns of diversity along climatic gradients might be the consequence of the size of the sampling grain being better suited to capture variation in the diversity of large-bodied taxa than small-bodied ones. In addition, the sampling pro-tocol used in the current study likely sampled some taxa di"erentially. However, our sampling protocol was standard-ized such that comparisons of the richness and abundance of taxa among plots is constant, and our main focus was to assess variation along the gradient, not to compare richness of one taxon to another. In other similar studies, leaf-litter extraction, or a variant of leaf-litter extraction, tends to be the most commonly used approach for sampling a variety of leaf-litter arthropods (Chen and Wise 1999, Halaj and
Although richness and abundance of arthropod taxa stud-ied here varied idiosyncratically with elevation, the richness and abundance of most macroarthropod groups were related to elevation while there was no or only a weak relation-ship between elevation and the richness and abundance of microarthropod groups. In addition, when statistically sig-nificant, the relationship between both the species richness of individual arthropod taxa and overall arthropod richness with elevation was always hump-shaped (Fig. 1). One pos-sible explanation for the general hump-shaped pattern of arthropod richness is that species richness saturates at low elevations due to the small size of our sampling units (i.e. 1 m2). Alternatively, even though we selected sites that were apparently not disturbed, the history of human disturbance might have been more pronounced at low than high elevation such that low elevation sites tended to be species depauper-ate (Nogues-Bravo et al. 2008). !e abundance of arthropod
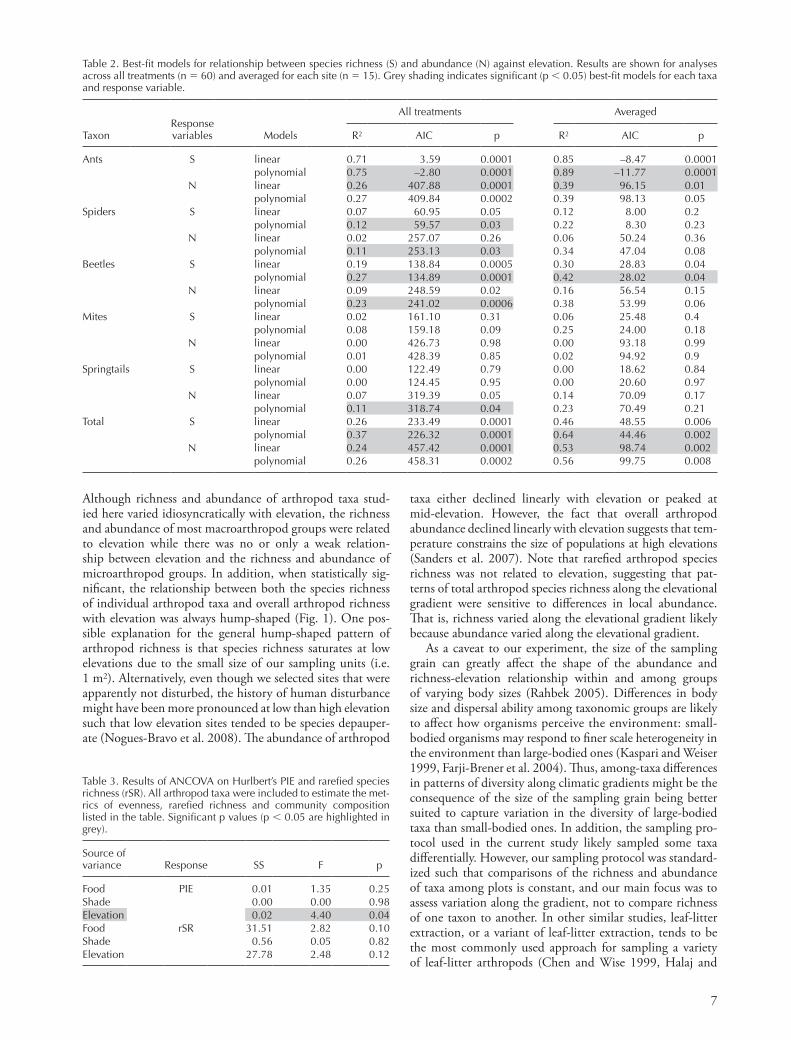
Table 2. Best-fit models for relationship between species richness (S) and abundance (N) against elevation. Results are shown for analyses across all treatments (n 60) and averaged for each site (n 15). Grey shading indicates significant (p 0.05) best-fit models for each taxa and response variable.
Response variables
All treatments Averaged
Taxon Models R2 AIC p R2 AIC p
Ants S linear 0.71 3.59 0.0001 0.85 –8.47 0.0001polynomial 0.75 –2.80 0.0001 0.89 –11.77 0.0001
N linear 0.26 407.88 0.0001 0.39 96.15 0.01polynomial 0.27 409.84 0.0002 0.39 98.13 0.05
Spiders S linear 0.07 60.95 0.05 0.12 8.00 0.2polynomial 0.12 59.57 0.03 0.22 8.30 0.23
N linear 0.02 257.07 0.26 0.06 50.24 0.36polynomial 0.11 253.13 0.03 0.34 47.04 0.08
Beetles S linear 0.19 138.84 0.0005 0.30 28.83 0.04polynomial 0.27 134.89 0.0001 0.42 28.02 0.04
N linear 0.09 248.59 0.02 0.16 56.54 0.15polynomial 0.23 241.02 0.0006 0.38 53.99 0.06
Mites S linear 0.02 161.10 0.31 0.06 25.48 0.4polynomial 0.08 159.18 0.09 0.25 24.00 0.18
N linear 0.00 426.73 0.98 0.00 93.18 0.99polynomial 0.01 428.39 0.85 0.02 94.92 0.9
Springtails S linear 0.00 122.49 0.79 0.00 18.62 0.84polynomial 0.00 124.45 0.95 0.00 20.60 0.97
N linear 0.07 319.39 0.05 0.14 70.09 0.17polynomial 0.11 318.74 0.04 0.23 70.49 0.21
Total S linear 0.26 233.49 0.0001 0.46 48.55 0.006polynomial 0.37 226.32 0.0001 0.64 44.46 0.002
N linear 0.24 457.42 0.0001 0.53 98.74 0.002polynomial 0.26 458.31 0.0002 0.56 99.75 0.008
Table 3. Results of ANCOVA on Hurlbert’s PIE and rarefied species richness (rSR). All arthropod taxa were included to estimate the met-rics of evenness, rarefied richness and community composition listed in the table. Significant p values (p 0.05 are highlighted in grey).
Source of variance Response SS F p
Food PIE 0.01 1.35 0.25Shade 0.00 0.00 0.98Elevation 0.02 4.40 0.04Food rSR 31.51 2.82 0.10Shade 0.56 0.05 0.82Elevation 27.78 2.48 0.12

8
groups is not or only weakly related to elevation. Carrying out experiments, which manipulate habitat heterogeneity in the leaf-litter, could also help understand these, and other, patterns of diversity (Hansen 2000, Sarty et al. 2006).
!e importance of climate in driving spatial variation in the structure of detrital communities was further evi-denced by changes in the relative abundance of major taxa along the elevational gradient. Evenness varied systematically along the elevational gradient, indicating that climate filters out cold-intolerant species at high elevation sites, a pattern previously documented with ants in this system (Lessard et al. 2007). Relative dominance or evenness decreased with elevation because as elevation increased, microarthropods became increasingly overrepresented relative to the rest of the community while macroarthropods became underrepre-sented (Fig. 2A–B). !e disproportionally high abundance of microarthropods at high elevation calls into question whether cold temperatures or seasonality imposes a limit on body size (Mousseau 1997). Changes in the relative dominance of functional groups can result in changes to the magnitude of interactions or the performance of functions (Hillebrand et al. 2008). !e shift in evenness of macroarthropods and microarthropods could reflect an interesting shift in interac-tions and processes resulting from these interactions to be examined further.
Within sites, resource addition and microclimate altera-tion had only limited e"ects on the overall structure of detrital communities. Although overall arthropod richness was lower in resource-added plots than in control plots, the e"ects of resource addition on arthropod richness was insig-nificant when we controlled for di"erences in abundance among plots, indicating that changes in overall arthro-pod abundance drove down overall arthropod richness in resource-added plots. Nevertheless, a reduction in the over-all diversity of arthropods when resource availability was increased is likely due to the loss of specialist species that were not able to exploit the type of resources we used. For example, a closer examination of hyperdiverse taxon such as beetles shows that the richness of a specialized phytophagous family (i.e. Curculionidae) was lower in resource-added plots than in control plots (F1,58 14.68, p 0.0003), whereas the abundance and richness of species in most other beetle families was not a"ected.
We found that manipulations of resource availability and microclimate at the local scale a"ected only specific arthropod groups in detrital communities. Neither richness nor abun-dance of any of the arthropod taxa studied here were higher in resource addition plots than in the control plots. Results from our resource addition experiment thus contrast with pre-vious studies showing that nitrogen-based resource addition in detrital food webs increases the abundance of microbial and fungal consumers such as springtails and mites (Cole et al. 2005, 2008). Perhaps then it is not surprising that predaceous spiders or ants did not respond positively to food resource addition since some of these macroarthropods might rely largely on mites and springtails to fulfill their diet (Chen and Wise 1999, Halaj and Wise 2002). !e lack of a significant response to resource addition in our system suggests that the amount of nitrogen-based food resource available to detrital communities is not limiting, and thus has minimal e"ects on the local distribution of most arthropod groups. Instead,
Wise 2002). Some studies have used pitfall traps, but this sampling technique tends to be biased towards mobile organisms (Topping and Sunderland 1992).
!ough our results support the hypothesis that tempera-ture limits abundance and therefore richness in this system, other factors that covary with elevation might also be impor-tant. For example, even though we sampled in broadleaf deciduous forests along the gradient, subtle di"erences in plant community composition could a"ect soil arthropod communities in ways that we did not measure. While ant diversity does not correlate with leaf-litter depth in our study system (Sanders unpubl.), many arthropod groups are sensi-tive to leaf-litter complexity (Hansen 2000), leaf-litter depth (Bultman and Uetz 1982) or micro-habitat architectural characteristics (Kaspari and Weiser 1999, Farji-Brener et al. 2004). In particular, spiders (Bultman and Uetz 1982) and mites (Hansen 2000) are sensitive to changes in leaf-litter characteristics, which might explain why diversity in these
Figure 2. Change in overall arthropod community composition along the elevational gradient. Each symbol shows the relative con-tribution of each taxon to the overall (A) species richness and (B) abundance of arthropods in the leaf-litter. !e position of each dot indicates the total arthropod (A) species richness and (B) abun-dance at the site.
9
interaction terms – food elevation and shade eleva-tion). For example, when ground temperature was reduced, ant species richness was always lower and spider abundance always higher locally than in control treatments, regardless of elevation. In addition, the di"erence in overall arthropod species composition (estimated with the Bray–Curtis simi-larity index) between experimental and control plots did not co-vary with elevation, further refuting the hypothesis that the importance of local food availability and microclimate on arthropod community structure depends on regional climate. Several studies have documented geographic varia-tion in biotic interactions and the outcome of those interac-tions on community structure (Jeanne 1979, Pennings and Silliman 2005, O’Donnell et al. 2007). But here, we found no evidence of geographic variation in the e"ect of local-scale factors on arthropod community structure.
Taken together, our work suggests that broad-scale variation in climate strongly influences the structure of detrital com-munities among sites. Within-sites, local factors such as spatial variation in resource availability and microclimate can fur-ther a"ect the number of species and individuals of particular taxa. While the importance of the interplay between local and regional factors has been recognized for some time (Schluter and Ricklefs 1993), few studies have explicitly examined how local and regional factors interact, especially along elevational gradients. Integrative gradient analyses (i.e. conducting manip-ulative experiments along environmental gradients; Fukami and Wardle 2005), such as the one used here can provide a unique opportunity to disentangle the relative contribution of processes operating over broad spatial scales, and those operating locally, in shaping the structure of communities. Integrative gradient analyses further o"er an exciting opportunity for testing alter-nate hypotheses while trying to determine the underlying eco-logical mechanisms driving variation in species diversity along environmental gradients.
Acknowledgements – !anks to Andrew Jones, Chris Burges, Audry Hite and Noa Davidai for help in the lab and in the field and to Rob Dunn, Christy McCain, Walter Jetz, Chris Buddle, Katie Stuble and Mariano Rodriguez-Cabal for providing useful com-ments on a previous version of the manuscript. We especially thank Daniel Gruner for making comments that greatly improved the quality of the manuscript. JPL was supported by FQRNT and NSERC doctoral scholarships and the Dept of Ecology and Evolu-tionary Biology at the Univ. of Tennessee. TES was supported by a FQRNT post-doctoral fellowship. NJS was supported by DOE-PER grant DE-FG02-08ER6451.
References
Addo-Bediako, A. et al. 2000. !ermal tolerance, climatic vari-ability and latitude. – Proc. R. Soc. Lond. B 267: 739–745.
Arnan, X. et al. 2007. Uncoupling the e"ects of shade and food resources of vegetation on Mediterranean ants: an experimental approach at the community level. – Ecography 30: 161–172.
Bultman, T. L. and Uetz, G. W. 1982. Abundance and community structure of forest floor spiders following litter manipulation. – Oecologia 55: 34–41.
Cerdá, X. et al. 1997. !ermal disruption of transitive hierar-chies in Mediterranean ant communities. – J. Anim. Ecol. 66: 363–374.
spatial variation in microclimate seemed to drive the local distribution of species. Reduced ground temperature under the shade structures led to a decrease in the abundance of ants and an increase in the abundance of spiders. Given that ground temperature is known to control the timing and dura-tion of ant foraging activity (Cerdá et al. 1998, Lessard et al. 2009), microclimate alteration might have reduced the activity of particular ant species. !us the absence or reduced activity of particular ant species in shaded plots might have provided taxa such as spiders with a refuge against ant predation or a release from interference competition.
Biotic interactions could be responsible for some of the patterns observed within sites. Of particular interest is the low abundance of spiders in the food addition plots. !e presence of particular ant species attracted to the added food resources could have deterred web-spinning spiders. A pre-vious study in temperate forests showed that artificial baits increased the activity of large omnivorous ants (e.g. Cam-ponotus and Formica) and led to the local displacement of certain groups of spiders (Moya-Larano and Wise 2007). !ough in the current study food addition did not increase ant richness and abundance in the leaf-litter, it might have caused ground-dwelling ants (which includes Camponotus and Formica) to forage more intensively in and around the food added plots.
In addition to direct e"ects of temperature and resource availability, microsite temperature could mediate the e"ect of food availability on arthropod communities by con-trolling access to those resources (e.g. foraging activities; Cerdá et al. 1998, Lessard et al. 2009). If that were the case, then we would predict that un-shaded, resource-added plots would have more species and individuals than shaded, resource-added plots or control plots. However, we found that resource addition did not interact with temperature to control arthropod richness and abundance. Nevertheless, our results indicate that within-site variation in temperature shapes arthropod communities via other ecological mecha-nisms than controlling access to food resources. Instead, variation in microclimate within sites might act as an envi-ronmental filter and shape the local distribution of species in the same way that broad-scale variation in climate drives the geographic distribution of species. Temperature can shape the structure of communities via a variety of other mecha-nisms, including its e"ect on energy availability (Clarke and Gaston 2006).
Because temperature a"ects the rate at which species interact (Cerdá et al. 1998, O’Donnell et al. 2007) and can mediate access to resources (Murcia 1990), we predicted that the e"ect of local factors on arthropod communities would vary along the elevational gradient due to variation in ambi-ent temperatures. We expected resource addition to have a stronger e"ect on low elevation communities than high elevation ones because temperature is less likely to restrict activity rates (e.g. rates of foraging activities) at low than at high elevation. We further predicted that microclimate alter-ation would have a stronger e"ect on community structure at high than low elevation, because the abiotic environment already exerts a strong selective pressure at high elevation. Our results, however, indicate that the influence of local fac-tors on arthropod community composition does not vary along this climatic gradient (indicated by the lack of significant
10
McGlynn, T. P. 2006. Ants on the move: resource limitation of a litter-nesting ant community in Costa Rica. – Biotropica 38: 419–427.
Morelissen, B. and Harley, C. D. G. 2007. !e e"ects of tempera-ture on producers, consumers, and plant-herbivore interac-tions in an intertidal community. – J. Exp. Mar. Biol. Ecol. 348: 162–173.
Mousseau, T. A. 1997. Ectotherms follow the converse to Bergmann’s rule. – Evolution 51: 630–632.
Moya-Larano, J. and Wise, D. H. 2007. Direct and indirect e"ects of ants on a forest-floor food web. – Ecology 88: 1454–1465.
Nakagawa, S. 2004. A farewell to Bonferroni: the problems of low statistical power and publication bias. – Behav. Ecol. 15: 1044–1045.
Niemela, J. et al. 1996. !e importance of small-scale heteroge-neity in boreal forests: variation in diversity in forest-floor invertebrates across the succession gradient. – Ecography 19: 352–368.
Nogues-Bravo, D. et al. 2008. Scale e"ects and human impact on the elevational species richness gradients. – Nature 453: 216–218.
O’Connor, M. I. 2009. Warming strengthens an herbivore-plant interaction. – Ecology 90: 388–398.
O’Donnell, S. et al. 2007. Army ants in four forests: geographic variation in raid rates and species composition. – J. Anim. Ecol. 76: 580–589.
Oksanen, J. et al. 2008. VEGAN: community ecology package. – R package.
Olszewski, T. D. 2004. A unified mathematical framework for the measurement of richness and evenness within and among multiple communities. – Oikos 104: 377–387.
Paine, R. T. 1966. Food web complexity and species diversity. – Am. Nat. 100: 65–76.
Pennings, S. C. and Silliman, B. R. 2005. Linking biogeography and community ecology: latitudinal variation in plant-herbivore interaction strength. – Ecology 86: 2310–2319.
Pennings, S. C. et al. 2003. Geographic variation in positive and negative interactions among salt marsh plants. – Ecology 84: 1527–1538.
Polis, G. A. et al. 1997. Toward an integration of landscape and food web ecology: the dynamics of spatially subsidized food webs. – Annu. Rev. Ecol. Syst. 28: 289–316.
Rahbek, C. 2005. !e role of spatial scale and the perception of large-scale species-richness patterns. – Ecol. Lett. 8: 224–239.
Reynolds, B. C. et al. 2003. Response of soil invertebrates to forest canopy inputs along and elevational gradient. – Pedobiologia 47: 127–139.
Ricklefs, R. E. 2007. History and diversity: explorations at the intersection of ecology and evolution. – Am. Nat. 170: S56–S70.
Ricklefs, R. E. and Schluter, D. 1993. Species diversity in eco-logical communities: historical and geographical perspectives. – Univ. of Chicago Press.
Romdal, T. S. and Rahbek, C. 2009. Elevational zonation of afro-tropical forest bird communities along a homogeneous forest gradient. – J. Biogeogr. 36: 327–336.
Sanders, N. J. et al. 2007. Temperature, but not productivity or geometry, predicts elevational diversity gradients in ants across spatial grains. – Global Ecol. Biogeogr. 16: 640–649.
Sanders, N. J. et al. 2010. Diverse elevational diversity gradients in Great Smoky Mountains National Park, USA. – In: Spehn, E. M. and Korner, C. (eds), Data mining for global trends in mountain biodiversity. CRC Press, pp. 75–87.
Sarty, M. et al. 2006. Habitat complexity facilitates coexistence in a tropical ant community. – Oecologia 149: 465–473.
Schemske, D. W. et al. 2009. Is there a latitudinal gradient in the importance of biotic interactions? – Annu. Rev. Ecol. Evol. Syst. 40: 245–269.
Cerdá, X. et al. 1998. !e role of competition by dominants and temperature in the foraging of subordinate species in Mediter-ranean ant communities. – Oecologia 117: 404–412.
Chatzaki, M. et al. 2005. !e distribution of ground spiders (Araneae, Gnaphosidae) along the altitudinal gradient of Crete, Greece: species richness, activity and altitudinal range. – J. Biogeogr. 32: 813–831.
Chen, B. R. and Wise, D. H. 1999. Bottom–up limitation of pre-daceous arthropods in a detritus-based terrestrial food web. – Ecology 80: 761–772.
Clarke, A. and Gaston, K. J. 2006. Climate, energy and diversity. – Proc. R. Soc. Lond. B 273: 2257–2266.
Cole, L. et al. 2008. Influence of disturbance and nitrogen addition on plant and soil animal diversity in grassland. – Soil Biol. Biochem. 40: 505–514.
Cornell, H. V. 1999. Unsaturation and regional influences on species richness in ecological communities: a review of the evidence. – Ecoscience 6: 303–315.
Escobar, F. et al. 2005. Altitudinal variation of dung beetle (Scarabaeidae : Scarabaeinae) assemblages in the Colombian Andes. – Global Ecol. Biogeogr. 14: 327–337.
Farji-Brener, A. G. et al. 2004. Environmental rugosity, body size and access to food: a test of the size-grain hypothesis in tropi-cal litter ants. – Oikos 104: 165–171.
Fukami, T. and Wardle, D. A. 2005. Long-term ecological dynamics: reciprocal insights from natural and anthropogenic gradients. – Proc. R. Soc. Lond. B 272: 2105–2115.
Gotelli, N. J. and Ellison, A. M. 2004. A primer of ecological statistics. – Sinauer.
Gotelli, N. J. and Entsminger, G. L. 2009. EcoSim: null models software for ecology, ver. 7.0. – Acquired Intelligence & Kesey-Bear, Jericho, VT, USA. http://garyentsminger.com/ecosim.htm
Halaj, J. and Wise, D. H. 2002. Impact of a detrital subsidy on trophic cascades in a terrestrial grazing food web. – Ecology 83: 3141–3151.
Hillebrand, H. et al. 2008. Consequences of dominance: a review of evenness e"ects on local and regional ecosystem processes. – Ecology 89: 1510–1520.
Hansen, R. A. 2000. E"ects of habitat complexity and composition on a diverse litter microarthropod assemblage. – Ecology 81: 1120–1132.
Hurlbert, S. H. 1971. Nonconcept of species diversity – critique and alternative parameters. – Ecology 52: 577–586.
Jeanne, R. L. 1979. A latitudinal gradient in rates of ant predation. – Ecology 60: 1211–1224.
Kaspari, M. 1993. Body-size and microclimate use in Neotropical granivorous ants. – Oecologia 96: 500–507.
Kaspari, M. 1996. Testing resource-based models of patchiness in four Neotropical litter ant assemblages. – Oikos 76: 443–454.
Kaspari, M. and Weiser, M. D. 1999. !e size-grain hypothesis and interspecific scaling in ants. – Funct. Ecol. 13: 530–538.
Kaspari, M. and Weiser, M. D. 2000. Ant activity along moisture gradients in a neotropical forest. – Biotropica 32: 703–711.
Klironomos, J. N. et al. 1992. Feeding preferences of the collem-bolan Folsomia candida in relation to microfungal successions on decaying litter. – Soil Biol. Biochem. 24: 685–692.
Lessard, J.-P. et al. 2007. Rarity and diversity in forest ant assemblages of Great Smoky Mountains National Park. – Southeastern Nat. 6: 215–228.
Lessard, J.-P. et al. 2009. Temperature-mediated coexistence in forest ant communities. – Insectes Soc. 56: 149–156.
Lovett, G. M. et al. 2009. Insect defoliation and nitrogen cycling in forests. – BioScience 52: 335–341.
MacArthur, R. H. 1972. Geographical ecology: patterns in the distributions of species. – Harper and Row.
McCain, C. M. 2005. Elevational gradients in diversity of small mammals. – Ecology 86: 366–372.

11
domination in an ant community. – Ecol. Entomol. 32: 732–740.
Topping, C. J. and Sunderland, K. D. 1992. Limitations to the use of pitfall traps in ecological studies exemplified by a study of spiders in a field of winter-wheat. – J. Appl. Ecol. 29: 485–491.
Yang, L. H. 2004. Periodical cicadas as resource pulses in North American forests. – Science 306: 1565–1567.
Yang, L. H. 2006. Interactions between a detrital resource pulse and a detritivore community. – Oecologia 147: 522–532.
Schluter, D. And Ricklefs, R. E. 1993. Convergence and the regional component of species diversity. – In: Ricklefs, R. E. and Schluter, D. (eds), Species diversity in ecological com-munities: historical and geographical perspectives. Univ. of Chicago Press, pp. 230–242.
Smallwood, J. 1982. !e e"ect of shade and competition on emigra-tion rate in the ant Aphaenogaster rudis. – Ecology 63: 124–134.
Stringer, L. D. et al. 2007. !e influence of temperature and fine-scale resource distribution on resource sharing and
Supplementary material (available as Appendix O18772 at www.oikos.ekol.lu.se/appendix ). Appendix 1–3.