Embed Size (px)
Citation preview

Rachna Mathur / International Journal for Research in Management and Pharmacy
Vol. 3, Issue 3, April 2014 (IJRMP) ISSN: 2320- 0901
1 Online International, Reviewed & Indexed Monthly Journal www.raijmr.com RET Academy for International Journals of Multidisciplinary Research (RAIJMR)
Determinants of the Total Actual Cost of Reproductive
Healthcare Services in Patna
RACHNA MATHUR Assistant Professor,
Dept. of Economics, University of Delhi
Delhi (India)
Abstract:
Reproductive health care is an essential component of basic care for women. There are direct and
positive link among reproductive health, economic growth and development. It has been widely
recognized that investment in the reproductive health of the poor can enhance growth and reduce
poverty. There is strong empirical evidence suggesting significant correlation in between health and
economic growth. Present study aims to analyze the total actual cost of reproductive healthcare
services (TACRHS) in Patna which is capital of Bihar. It aims to identify the determinants which
affect the total actual cost of reproductive healthcare Services (TCRHCS) with respect to pre-
delivery, delivery and post delivery expenditure of the household which they actually incurred on
reproductive healthcare services. The study found that total actual cost of reproductive healthcare
services increases with the increase in caesarean delivery and in services of private hospitals. The
study also found that expenditure on reproductive healthcare services increases with increase
education, wife working status, households’ monthly income, early delivery complications. While
total actual expenditure on reproductive healthcare services decreases with increase in the birth
order of children, expectation of the birth of girl child, increase in numbers of member in the family,
in joint families and insurance awareness of the respondents.
Keywords: Economic growth, Healthcare Services, Reproductive health, TACRHS, Total Actual
Cost
1. Introduction
The International Conference on Population and Development (ICPD) defines reproductive health as
a state of complete physical, mental and social well-being and...not merely the absence of disease or
infirmity, in all matters relating to the reproductive system and its functions and processes.
Reproductive health therefore implies that people are able to have a satisfying and safe sex life and
that they have the capability to reproduce and the freedom to decide if, when and how often to do so.
Implicit in this last condition are the right of men and women to be informed [about] and to have
access to safe, effective, affordable and acceptable methods of family planning of their choice, as
well as other methods of birth control which are not against the law, and the right of access to
appropriate health-care services that will enable women to go safely through pregnancy and
childbirth and provide couples with the best chance of having a healthy infant. (ICPD Programme of
Action, 1994).
Reproductive health care is an essential component of basic care for women. Women make up half
of our population and shoulder key responsibilities for our future generations and our prosperity.
Therefore, access to reproductive health services should be a central and established part of health
care to ensure that women can attain good health, maintain it through their reproductive years and
age well. There has been consensus among the medical and public health experts for decades that
women must be healthy in order to have healthy pregnancies and babies (Chavkin,et.al,1999).

Rachna Mathur / International Journal for Research in Management and Pharmacy
Vol. 3, Issue 3, April 2014 (IJRMP) ISSN: 2320- 0901
2 Online International, Reviewed & Indexed Monthly Journal www.raijmr.com RET Academy for International Journals of Multidisciplinary Research (RAIJMR)
To improve maternal and new-born health by reducing mortality and morbidity related to pregnancy
and child birth, it is essential to build continuum of care that increases access to and use of skilled
care during pregnancy, birth and the post par took period. The continuum of care need to extend
from care in the household to the care provided by a skilled health professional at the primary care
level, to that provided at the referral facility for those women and new-born’s with complications.
Having a pool of skilled manpower for provision for this continuum of care is a major challenge for
India towards improving its maternal health. Many states have incorporated strategies for improving
preconception health into their health promotion plans (Boulet, et.al, 2006).
At present many countries are struggling to meet the United Nations Millennium Development
Goals (MDGs), there is a growing trend worldwide to implement strategies designed to reduce
financial barriers to reproductive healthcare. With developing country health systems focusing
heavily on reducing child mortality and improving maternal health (MDGs 4 and 5), there is
inevitable tension deciding between financing strategies that will bring fast improvements in specific
indicator areas (such as reproductive health), and those that target the entire health care system and
may be more sustainable in the long term. Healthcare costs associated with pregnancy and delivery
and with the care of newborn infants are significant, they represent the two most expensive
conditions requiring hospitalization (Wier, et al,2011). While a variety of tools is being employed to
reduce the financial burden on households for health care, two of the most prominent are the
expansion of free services policies and the expansion of health insurance.(Kelley, et al.,2010).
There are direct and positive link among reproductive health, economic growth and development. It
has been widely recognized that investment in the reproductive health of the poor can enhance
growth and reduce poverty. There is strong empirical evidence suggesting significant correlation in
between health and economic growth. Some studies have concluded that healthier people are more
productive. Investment in the health of the poor raises their educational ability and productivity. It
gives them both the assets they need to lift themselves from poverty and the immediate welfare gains
of relief from physical sufferings (Wuensch & Poteat, 1998).
The objective of the present study is to identify the determinants which affect the total actual cost of
reproductive healthcare Services (TCRHCS) with respect to pre-delivery, delivery and post delivery
expenditure of the household which they actually incurred on reproductive healthcare in Patna.
The study aims to analyze the total actual cost of reproductive healthcare services (TACRHS) in
Patna which is capital of Bihar. Bihar is the 12th largest state with geographical area of 94,163
square km. And with an increase in population of about 20.8 million in the last decade, Bihar is the
third most populous state in India, after Uttar Pradesh and Maharashtra. According to 2011 census,
the total population of Bihar stands at 103.8 million. The decadal growth rate of population of Bihar
between 2001 and 2011 was 25.1 percent.
Description of Patna
Patna is the capital of Bihar and it is the second most populous districts of Bihar with population
density of (1803 persons per sq. km) after Sheohar with population density (1882 persons per sq.
km.). Patna is situated on the bank of the river Ganga.
Table 1. Description of Patna
City Patna
Government Municipal Corporation
Urban Agglomeration Patna Metropolitan
State Bihar

Rachna Mathur / International Journal for Research in Management and Pharmacy
Vol. 3, Issue 3, April 2014 (IJRMP) ISSN: 2320- 0901
3 Online International, Reviewed & Indexed Monthly Journal www.raijmr.com RET Academy for International Journals of Multidisciplinary Research (RAIJMR)
Table 2. Demographic profile of Patna
Patna City Total Male Female
Population of Patna 1,683,200 894,158 789,042
Literacy Rate 1,264,523(84.71%) 694,580(87.71%) 569,943(81.33%)
Children (0-6) 190,496 102,208 88,288
Average Literacy (%) 84.71 87.71 81.33
Sex ratio 882 per 1000 male
Child Sex ratio 864 per 1000 male child Source: Economic Survey of Bihar 2011
2. Objectives of the study
The objectives of the study are as follows:-
To find out the total actual cost of the reproductive healthcare services of the respondents in
Patna which include all the cost of reproductive healthcare services namely, pre-delivery,
delivery and post delivery together.
To find out the impact of age of the respondents on the total cost of reproductive healthcare
services.
To find out the impact of social and economic status of the respondent on the total cost of
reproductive healthcare services.
To find out the impact of reproductive healthcare services provided by government and private
hospitals in Patna.
3. Hypothesis
Total cost of reproductive healthcare services increases with the increase in the age of the
respondent (pregnant women).
Total cost of reproductive healthcare services is positively related to husband’s education,
wife working status, households monthly income, early delivery complications, type of
delivery (in case of caesarean delivery),type of hospital visited(in case of private hospitals).
Total cost of reproductive healthcare services is negatively related to joint family, insurance
information to the respondents, birth order of children, expectation of the birth of girl child.
4. Survey
A Primary survey is conducted in the district of Patna, capital of Bihar. Face to face interview of 528
respondents are taken in form of questionnaire. The survey is conducted in the month of May, June and
July 2011. All government hospitals and private maternity clinics are visited to conduct the interviews
with the women who have given birth to their babies. The government hospitals providing maternity
healthcare services which are visited during this period are Patna Medical College and Hospital (PMCH),
Nalanda Medical College and Hospital(NMCH) and Guru Govind Singh College and Hospital. The
Hospitals are visited frequently during the survey. Beside government hospitals all private maternity
clinics, hospitals run by NGO’s and missionaries in the district are also visited to conduct the interviews
with the respondents. The survey is done on primary basis. Questions are asked from the women or her
family (in case women are unable to answer) about their total cost of reproductive health care. The
responses of the respondents are recorded properly and coding of response is done accordingly.
5. The Questionnaire TACRHCS data are obtained by using a questionnaire. The content of the questionnaire are common
to all sample. All respondents are asked how much they have paid to finance the present cost of
RHCS. Both close ended and open ended questions are asked in the survey. On the cover letter of the
questionnaire, the respondents are well informed that:
Data collection and analysis are fully anonymous so that their private information would be
completely protected.

Rachna Mathur / International Journal for Research in Management and Pharmacy
Vol. 3, Issue 3, April 2014 (IJRMP) ISSN: 2320- 0901
4 Online International, Reviewed & Indexed Monthly Journal www.raijmr.com RET Academy for International Journals of Multidisciplinary Research (RAIJMR)
All the answers would be kept confidential processed statistically and would be used only for
scientific study.
Respondents could either participate of their own accord or refuse to participate.
Total 528 respondents are enquired about their total actual cost for RHCS. The questionnaires are
given to the respondents who are educated, while illiterate respondents are asked to give the answers
verbally. Respondents are given 15- 20 minutes time to answer the questions. The questionnaire
includes age, socio-demographic and economic data, experiences with respect to different cost
incurred in the RHCS and complications in her delivery, health behaviour etc. Both qualitative and
qualitative data are required for testing the hypothesis. The questions in the survey consist of both
multiple-choice form and open ended form. All statistical analyses are performed using statistics
software SPSS ver.18.0 (SPSS Ltd., Chicago, USA).
6. Methodology
As per specified objectives the primary need is to estimate the total actual cost of reproductive
healthcare services (TACRHCS). For achieving this objective the details of cost components vis-a-
vis its determinants from the targeted women population in Patna are required. All expenditure
related to RHCS like expenditure on consulting doctors, and visiting maternity clinics, expenditure on
various tests related to pregnancy, monthly expenditure on medicines for the expecting mother, cost
related to types of delivery namely normal delivery and caesarean delivery are examined, other post
delivery related cost like immunization and vaccination etc are clubbed together so that total cost of
reproductive healthcare service could be studied. Time cost, transport cost and other opportunity costs
of the respondents and their attendants are not included in the present study.
Explanatory variables are age of respondent, family types, number of family members, husband
education, household monthly income, number of earning members in the family, wife working status,
own house, television, insurance information, delivery type, expectation of sex of child born, birth order
of the child born, early delivery complication, types of reproductive health care service providers i.e.
government hospitals and private hospitals for getting RHCS, financial benefits in government hospital
delivery. For the statistical analysis some variables are dropped out, not taken into consideration as it
create the problem of multicollinearity in the statistical analysis e.g. age of the couple at the time of
marriage, number of members in the family and number of children in the family, household monthly
income is taken as a proxy for wife working status, own house, television and level of education of
husband and wife etc in which one of the variables is taken and other related variable is dropped out.
The information is collected through Primary survey. However the specified variables, their
definitions and the empirical model are given below. An Ordinary Least Square regression is used to
determine the relationship between the total actual cost of RHCS and the identified socio-economic
and related determinants. The empirical specification of the model is as:
7. Model Specification
7.1 Dependent Variables
Total actual cost incurred on reproductive healthcare services.
TACRHCS= f (X1+X2+X3+X4+X5+X6+X7+X8+X9+X10+X11+X12+X13+X14+X15)
7.2 Explanatory Variables Explanatory variables are defined as below.
X1 = Age of the respondent in years (wife age at the time of pregnancy)
X2 = Family type (Nuclear family =0, Joint family=1)
X3 = Number of family members
X4 = Husband’s education (Illiterate=0, Primary school=1, High School=2, Graduate=3, More
than graduate=4)

Rachna Mathur / International Journal for Research in Management and Pharmacy
Vol. 3, Issue 3, April 2014 (IJRMP) ISSN: 2320- 0901
5 Online International, Reviewed & Indexed Monthly Journal www.raijmr.com RET Academy for International Journals of Multidisciplinary Research (RAIJMR)
X5 = Household monthly income
X6 = Numbers of earning members in the family
X7 = Wife working status (No=0, Yes=1)
X8 = Own house of the household (No=0, Yes=1)
X9 = Access to television (No=0, Yes=1)
X10 = Insurance awareness among the households (No=0, Yes=1)
X11 = Delivery type (Normal delivery=0, Caesarean delivery=1)
X12 = Sex of child born (Boy=0, Girl=1)
X13 = Birth order of children
X14 = Early delivery complications (No=0, Yes=1)
X15 = Hospital type for RHCS (Government hospitals =0, Private hospital=1).
Following are the detail explanation for identifications and descriptions of the variables used in the
study for finding the determinants of total actual cost incurred on reproductive healthcare services in
Patna.
8. Description of Variables
Age of the respondents: The study is conducted on the primary survey where questions are asked
from 528 women who have given birth to her children. The age of the women vary from minimum
age of 17 years to maximum age of 36 years. The statistical descriptions of age of respondents
(women) are shown in the table and pie-chart given below.
Table 3. Description of the age of respondents (in Years)
Age of respondents in years Frequency Percent Cumulative Percent
Up to 20 107 20.3 20.3
21 to 25 214 40.5 60.8
26 to 30 141 26.7 87.5
31 to 35 54 10.2 97.7
36 and above 12 2.3 100.0
Total 528 100.0 Source: As per survey on determinants of the total actual cost of Reproductive Health Care Services in Patna
Figure 1. Age of the respondents (in Years)
Source: As per survey on determinants of the total actual cost of Reproductive Health Care Services in Patna
Marriage age of husband and wife: Following tables given below show the age of marriage of both
husband and wife in the survey.
20.3%
40.5%
26.7%
10.2% 2.3%
Upto 20 years
21 to 25 years
26 to 30 years

Rachna Mathur / International Journal for Research in Management and Pharmacy
Vol. 3, Issue 3, April 2014 (IJRMP) ISSN: 2320- 0901
6 Online International, Reviewed & Indexed Monthly Journal www.raijmr.com RET Academy for International Journals of Multidisciplinary Research (RAIJMR)
Table 4. Husband age of marriage
Husband age of marriage
Age in years Frequency Percent Cumulative Percent
up to 21years 107 20.3 20.3
22 - 25years 182 34.5 54.7
26 -30years 142 26.9 81.6
31 -35years 56 10.6 92.2
36 -40years 36 6.8 99.1
41 and above 5 .9 100.0
Total 528 100.0 Source: As per survey on determinants of the total actual cost of Reproductive Health Care Services in Patna
Table 5. Wife age of marriage
Wife age of marriage
Age in years Frequency Percent Cumulative Percent
upto 18 years 161 30.5 30.5
19 to 25 years 280 53.0 83.5
26 to 30 years 45 8.5 92.0
31 and above 42 8.0 100.0
Total 528 100.0 Source: As per survey on determinants of the total actual cost of Reproductive Health Care Services in Patna
Family type: Following table and pie chart show that there are 124(23.5%) nuclear family where
husband, wife and their unmarried children live together and 404(76.5%) joint family where father,
mother, their children and their grand children live together and have food cooked in one kitchen.
Table 6. Description of Family type
Family type Frequency Percent Cumulative Percent
Nuclear Family 124 23.5 23.5
Joint Family 404 76.5 100.0
Total 528 100.0 Source: As per survey on determinants of the total actual cost of Reproductive Health Care Services in Patna.
Figure 2. Description of family type
Source: As per survey on determinants of the total actual cost of Reproductive Health Care Services in Patna.
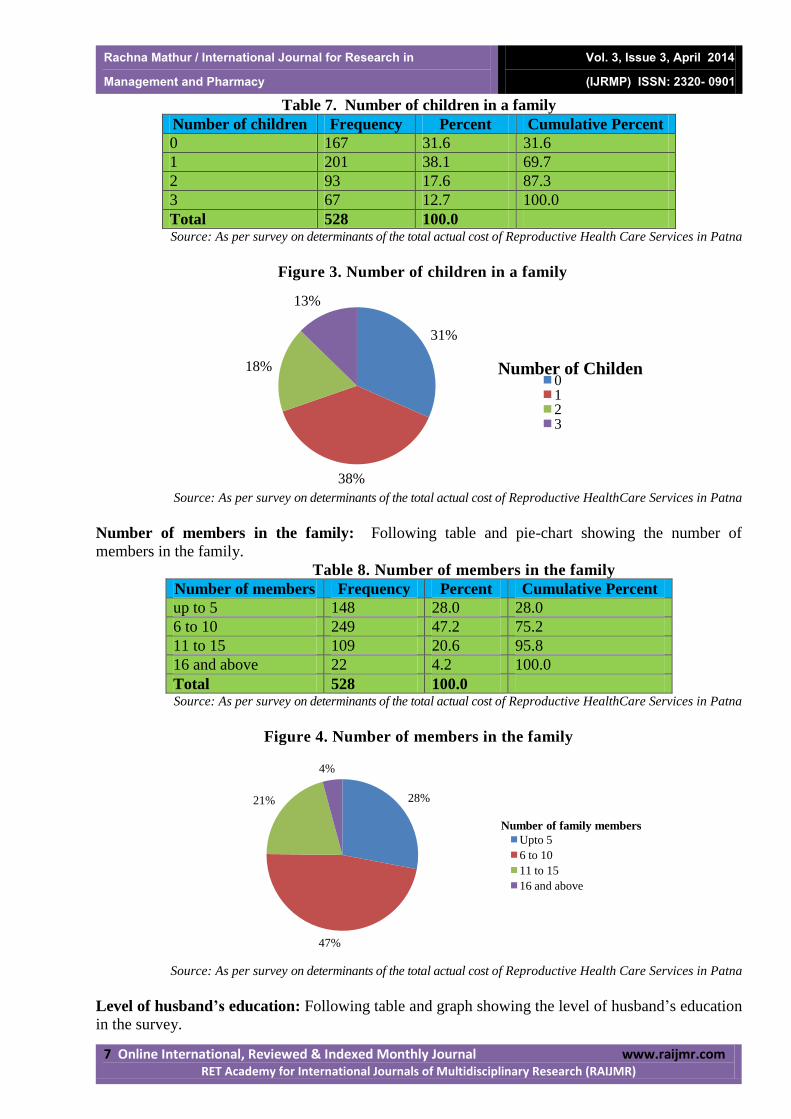
Number of children in the family: Number of children in the family vary from zero to three in the
survey. Following table and pie chart show the statistical description of number of children in the
family.
23%
77%
Nuclear Family
Joint Family
Rachna Mathur / International Journal for Research in Management and Pharmacy
Vol. 3, Issue 3, April 2014 (IJRMP) ISSN: 2320- 0901
7 Online International, Reviewed & Indexed Monthly Journal www.raijmr.com RET Academy for International Journals of Multidisciplinary Research (RAIJMR)
Table 7. Number of children in a family
Number of children Frequency Percent Cumulative Percent
0 167 31.6 31.6
1 201 38.1 69.7
2 93 17.6 87.3
3 67 12.7 100.0
Total 528 100.0 Source: As per survey on determinants of the total actual cost of Reproductive Health Care Services in Patna
Figure 3. Number of children in a family
Source: As per survey on determinants of the total actual cost of Reproductive HealthCare Services in Patna
Number of members in the family: Following table and pie-chart showing the number of
members in the family.
Table 8. Number of members in the family
Number of members Frequency Percent Cumulative Percent
up to 5 148 28.0 28.0
6 to 10 249 47.2 75.2
11 to 15 109 20.6 95.8
16 and above 22 4.2 100.0
Total 528 100.0 Source: As per survey on determinants of the total actual cost of Reproductive HealthCare Services in Patna
Figure 4. Number of members in the family
Source: As per survey on determinants of the total actual cost of Reproductive Health Care Services in Patna
Level of husband’s education: Following table and graph showing the level of husband’s education
in the survey.
31%
38%
18%
13%
Number of Childen 0 1 2 3
28%
47%
21%
4%
Number of family members
Upto 5
6 to 10
11 to 15
16 and above

Rachna Mathur / International Journal for Research in Management and Pharmacy
Vol. 3, Issue 3, April 2014 (IJRMP) ISSN: 2320- 0901
8 Online International, Reviewed & Indexed Monthly Journal www.raijmr.com RET Academy for International Journals of Multidisciplinary Research (RAIJMR)
Table 9. Level of husband’s education
Level of education Frequency Percent Cumulative Percent
Illiterate 41 7.8 7.8
Primary school 133 25.2 33.0
High school 133 25.2 58.1
Graduate 122 23.1 81.3
More than graduate 99 18.8 100.0
Total 528 100.0 Source: As per survey on determinants of the total actual cost of Reproductive Health Care Services in Patna
Figure 5. Level of husband’s education
Source: As per survey on determinants of the total actual cost of Reproductive Health Care Services in Patna
Level of wife’s education: Following table and graph showing the level of wife’s education in the
survey.
Table 10. Level of wife's education
Level of education Frequency Percent Cumulative Percent
Illiterate 61 11.6 11.6
Primary school 92 17.4 29.0
High school 160 30.3 59.3
Graduate 129 24.4 83.7
More than Graduate 86 16.3 100.0
Total 528 100.0 Source: As per survey on determinants of the total actual cost of Reproductive Health Care Services in Patna
Figure 6. Level of wife's education
Source: As per survey on determinants of the total actual cost of Reproductive HealthCare Services in Patna
Number of earning members: Following table and pie-chart showing the number of earning
members in the families.
41
133 133 122
99
0
20
40
60
80
100
120
140
Iillitrate Primary
School
High
School
Graduate More than
Graduate
Husband Education
61
92
160
129
86
0
50
100
150
200
Illitrate Primary
School
High
School
Graduate More
than
Graduate
Wife Education

Rachna Mathur / International Journal for Research in Management and Pharmacy
Vol. 3, Issue 3, April 2014 (IJRMP) ISSN: 2320- 0901
9 Online International, Reviewed & Indexed Monthly Journal www.raijmr.com RET Academy for International Journals of Multidisciplinary Research (RAIJMR)
Table 11. Number of earning members
Number of earning
members in the family
Frequency Percent Cumulative Percent
1 204 38.6 38.6
2 217 41.1 79.7
3 100 18.9 98.7
More than 3 7 1.3 100.0
Total 528 100.0 Source: As per survey on determinants of the total actual cost of Reproductive Health Care Services in Patna
Figure 7. Number of earning members
Source: As per survey on determinants of the total actual cost of Reproductive Health Care Services in Patna
Husband job nature: Following table and pie chart showing the job nature of husband in the
survey.
Table 12. Job nature of Husband
Job Profile Frequency Percent Cumulative Percent
Public sector 111 21.0 21.0
Private sector 170 32.2 53.2
Self employed 80 15.2 68.4
Unskilled labour 19 3.6 72.0
Traders 95 18.0 90.0
Daily wage workers 44 8.3 98.3
Others 2 .4 98.7
Unemployed 7 1.3 100.0
Total 528 100.0 Source: As per survey on determinants of the total actual cost of Reproductive Health Care Services in Patna
Figure 8. Job Nature of Husband
Source: As per survey on determinants of the total actual cost of Reproductive Health Care Services in Patna
Monthly salary of Husband: Following table shows monthly salary of husbands in the survey.
39%
41%
19%
1%
Number of Earning Members
1 2 3 More than 3
21.0%
32.2% 15.2%
3.6%
18.0%
8.3% 0.4% 1.3%
Husband's nature of job
Public Sector
Private Sector
Self Employed
Unskilled Labour
Traders
Daily Wage Workers
Others
Unemployed

Rachna Mathur / International Journal for Research in Management and Pharmacy
Vol. 3, Issue 3, April 2014 (IJRMP) ISSN: 2320- 0901
10 Online International, Reviewed & Indexed Monthly Journal www.raijmr.com RET Academy for International Journals of Multidisciplinary Research (RAIJMR)
Table 13. Monthly salary of Husbands
Husband’s salary Frequency Percent Cumulative Percent
upto 2000 85 16.1 16.1
2001 to 10000 270 51.1 67.2
10001 to 20000 96 18.2 85.4
20001 to 30000 60 11.4 96.8
30001 to 40000 14 2.7 99.4
40001 and above 3 .6 100.0
Total 528 100.0 Source: As per survey on determinants of the total actual cost of Reproductive Health Care Services in Patna
Wife's working status: Following table and pie-chart showing wife working status. In the study
50%of the wives are reported to be working in the sample.
Table 14. Wife's working status
Wife working status Frequency Percent Cumulative Percent
Not working 262 49.6 49.6
Working 266 50.4 100.0
Total 528 100.0 Source: As per survey on determinants of the total actual cost of Reproductive Health Care Services in Patna
Figure 9. Wife's working status
Source: As per survey on determinants of the total actual cost of Reproductive Health Care Services in Patna
Household monthly income: Following table and pie-chart showing the statistics of households
monthly income in the survey.
Table 15. Household monthly income
Household monthly income Frequency Percent Cumulative Percent
Upto 5000 164 31.1 31.1
5001 – 10000 107 20.3 51.3
10001 – 20000 112 21.2 72.5
20001 – 30000 52 9.8 82.4
30001 – 40000 46 8.7 91.1
40001 – 50000 33 6.3 97.3
Above 50001 14 2.7 100.0
Total 528 100.0 Source: As per survey on determinants of the total actual cost of Reproductive Health Care Services in Patna
49.6% 50.4%
Wife's Working status
Not Working Working

Rachna Mathur / International Journal for Research in Management and Pharmacy
Vol. 3, Issue 3, April 2014 (IJRMP) ISSN: 2320- 0901
11 Online International, Reviewed & Indexed Monthly Journal www.raijmr.com RET Academy for International Journals of Multidisciplinary Research (RAIJMR)
Figure 10. Households Monthly Income
Source: As per survey on determinants of the tota actual cost of Reproductive Health Care Services in Patna
Ownership of house: Following table and pie-chart showing the ownership of house by the
householders in the survey.
Table 16. Ownership of house by the households
Own House Frequency Percent Cumulative Percent
No 109 20.6 20.6
Yes 419 79.4 100.0
Total 528 100.0 Source: As per survey on determinants of the total actual cost of Reproductive Health Care Services in Patna
Figure 11. Ownership of house by the households
Source As per survey on determinants of the total actual cost of Reproductive Health Care Services in Patna
Reader of the news paper: Following table and pie-chart showing the numbers of newspaper
readers in the survey.
Table 17. Household reader of the Newspaper
News Paper Frequency Percent Cumulative Percent
No 283 53.6 53.6
Yes 245 46.4 100.0
Total 528 100.0 Source: As per survey on determinants of the total actual cost of Reproductive Health Care Services in Patna
31.1%
20.3% 21.2%
9.8%
8.7%
6.3% 2.7%
Household Monthly Income
Upto 5000
5001 - 10000
10001 - 20000
20001 - 30000
30001 - 40000
40001 - 50000
Above 50001
20.6%
79.4%
Own House
No
Yes

Rachna Mathur / International Journal for Research in Management and Pharmacy
Vol. 3, Issue 3, April 2014 (IJRMP) ISSN: 2320- 0901
12 Online International, Reviewed & Indexed Monthly Journal www.raijmr.com RET Academy for International Journals of Multidisciplinary Research (RAIJMR)
Figure 12. Household reader of the Newspaper
Source: As per survey on determinants of the total actual cost of Reproductive Health Care Services in Patna
Television: Following table and pie-chart showing the number of households watching television as
a source of information and entertainment in the survey.
Table 17. Households having Television
Television Frequency Percent Cumulative Percent
Yes 127 24.1 24.1
No 401 75.9 100.0
Total 528 100.0 Source: As per survey on determinants of the total actual cost of Reproductive Health Care Services in Patna
Figure 13. Households having Television
Source: As per survey on determinants of the total actual cost of Reproductive Health Care Services in Patna
Insurance information: Following table and pie-chart showing the insurance information
(awareness) among the household below.
Table 18. Insurance information among the households
Insurance information Frequency Percent Cumulative Percent
No 124 23.5 23.5
Yes 404 76.5 100.0
Total 528 100.0 Source: As per survey on determinants of the total actual cost of Reproductive Health Care Services in Patna
53.6%
46.4% Newspaper Readers
No
Yes
24.1%
75.9%
Television Yes No

Rachna Mathur / International Journal for Research in Management and Pharmacy
Vol. 3, Issue 3, April 2014 (IJRMP) ISSN: 2320- 0901
13 Online International, Reviewed & Indexed Monthly Journal www.raijmr.com RET Academy for International Journals of Multidisciplinary Research (RAIJMR)
Figure 14. Insurance information among the households
Source: As per survey on determinants of the total actual cost of Reproductive Health Care Services in Patna
Type of Insurance scheme: Following table and pie-chart showing different types of insurance
scheme purchased by the householders.
Table 19. Types of Insurance Schemes purchased by the households
Type of Insurance scheme Frequency Percent Cumulative Percent
General Insurance 20 3.8 3.8
Life Insurance 226 42.8 46.6
Other 72 13.6 60.2
Don’t know 210 39.8 100.0
Total 528 100.0
Figure 15. Types of Insurance Schemes purchased by the households.
Source: As per survey on determinants of the total actual cost of Reproductive Health Care Services in Patna
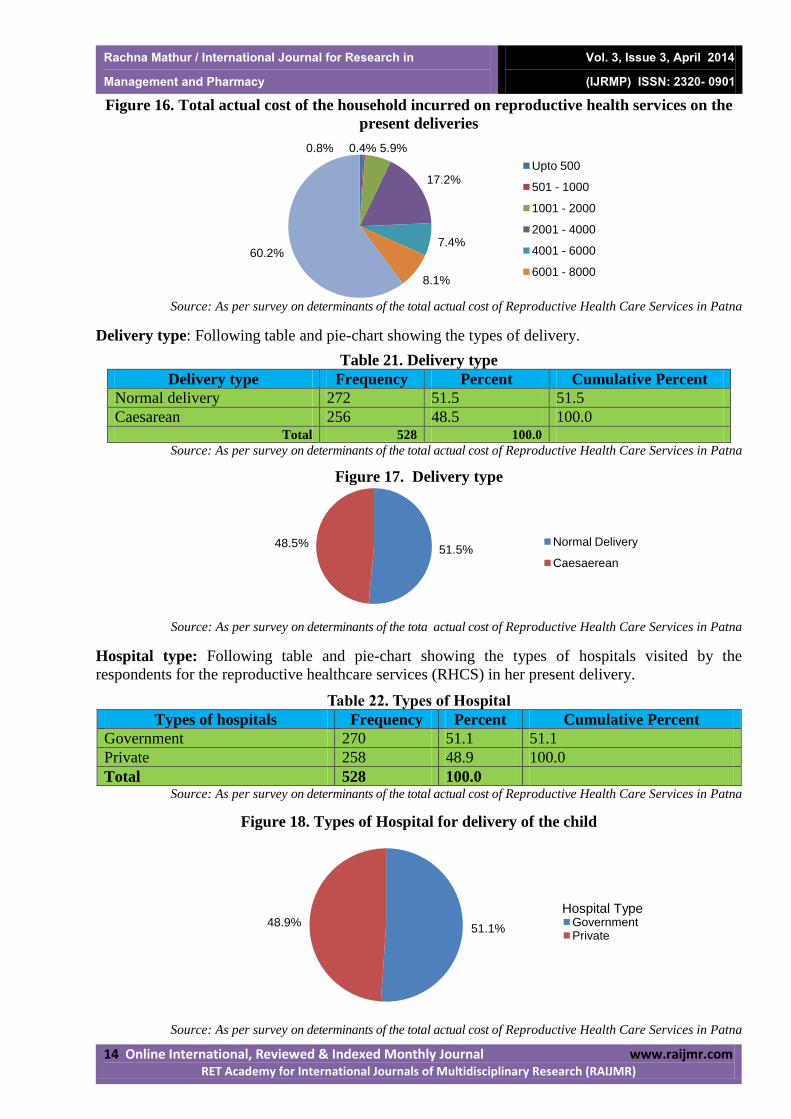
Total actual cost of reproductive healthcare services: Following table and pie-chart showing total
actual cost incurred by the households on reproductive healthcare services in the present deliveries.
Table 20.Total Actual Cost of reproductive healthcare services
(TACRHS) in the present deliveries
TACRHS(in Rupees) Frequency Percent Cumulative Percent
upto 500 4 .8 .8
501 - 1000 2 .4 1.1
1001 - 2000 31 5.9 7.0
2001 - 4000 91 17.2 24.2
4001 - 6000 39 7.4 31.6
6001 - 8000 43 8.1 39.8
8001 and above 318 60.2 100.0
Total 528 100.0 Source: As per survey on determinants of the total actual cost of Reproductive Health Care Services in Patna
23.5%
76.5%
Insurance Information No
3.8%
42.8%
13.6%
39.8% General Insurance
Life Insurance
Other
DK
Rachna Mathur / International Journal for Research in Management and Pharmacy
Vol. 3, Issue 3, April 2014 (IJRMP) ISSN: 2320- 0901
14 Online International, Reviewed & Indexed Monthly Journal www.raijmr.com RET Academy for International Journals of Multidisciplinary Research (RAIJMR)
Figure 16. Total actual cost of the household incurred on reproductive health services on the
present deliveries
Source: As per survey on determinants of the total actual cost of Reproductive Health Care Services in Patna
Delivery type: Following table and pie-chart showing the types of delivery.
Table 21. Delivery type
Delivery type Frequency Percent Cumulative Percent
Normal delivery 272 51.5 51.5
Caesarean 256 48.5 100.0 Total 528 100.0
Source: As per survey on determinants of the total actual cost of Reproductive Health Care Services in Patna
Figure 17. Delivery type
Source: As per survey on determinants of the tota actual cost of Reproductive Health Care Services in Patna
Hospital type: Following table and pie-chart showing the types of hospitals visited by the
respondents for the reproductive healthcare services (RHCS) in her present delivery.
Table 22. Types of Hospital
Types of hospitals Frequency Percent Cumulative Percent
Government 270 51.1 51.1
Private 258 48.9 100.0
Total 528 100.0 Source: As per survey on determinants of the total actual cost of Reproductive Health Care Services in Patna
Figure 18. Types of Hospital for delivery of the child
Source: As per survey on determinants of the total actual cost of Reproductive Health Care Services in Patna
0.8% 0.4% 5.9%
17.2%
7.4%
8.1%
60.2%
Upto 500
501 - 1000
1001 - 2000
2001 - 4000
4001 - 6000
6001 - 8000
51.5% 48.5% Normal Delivery
Caesaerean
51.1% 48.9%
Hospital Type Government Private

Rachna Mathur / International Journal for Research in Management and Pharmacy
Vol. 3, Issue 3, April 2014 (IJRMP) ISSN: 2320- 0901
15 Online International, Reviewed & Indexed Monthly Journal www.raijmr.com RET Academy for International Journals of Multidisciplinary Research (RAIJMR)
Sex of child born: Following table and pie-chart showing the expectation of sex of the child born.
Table 23. Expectation of the Sex of Child born
Gender Frequency Percent Cumulative Percent
Boy 304 57.6 57.6
Girl 224 42.4 100.0
Total 528 100.0 Source: As per survey on determinants of the total actual cost of Reproductive Health Care Services in Patna
Figure 19. Expectation of the Sex of Child Born
Source: As per survey on determinants of the total actual cost of Reproductive Health Care Services in Patna
Birth order of the children: Following table and pie chart showing the birth order of the child
(born) in the present delivery
Table 24. Birth Order of the Children
Birth order of children Frequency Percent Cumulative Percent
First child 182 34.5 34.5
Second child 189 35.8 70.3
Third child 93 17.6 87.9
Forth child 63 11.9 99.8
Fifth child 1 .2 100.0
Total 528 100.0 Source: As per survey on determinants of the total actual cost of Reproductive Health Care Services in Patna
Figure 20. Birth Order of the Children
Source: As per survey on determinants of the total actual cost of Reproductive Health Care Services in Patna
Early delivery complication: Following table and pie-chart showing delivery complications among
women in her past/present delivery.
Table 25. Early Delivery Complication
Response Frequency Percent Cumulative Percent
No 347 65.7 65.7
Yes 181 34.3 100.0
Total 528 100.0 Source: As per survey on determinants of the total actual cost of Reproductive Health Care Services in Patna
57.6%
42.4% Sex of Child Born
Boy
33.9%
35.2%
17.3%
11.7% 2.0%
Birth Order of Children 1 2 3 4 More than 4

Rachna Mathur / International Journal for Research in Management and Pharmacy
Vol. 3, Issue 3, April 2014 (IJRMP) ISSN: 2320- 0901
16 Online International, Reviewed & Indexed Monthly Journal www.raijmr.com RET Academy for International Journals of Multidisciplinary Research (RAIJMR)
Figure 21. Early delivery complication
Source: As per survey on determinants of the total actual cost of Reproductive Health Care Services in Patna
Types of delivery complication: Following table and pie-chart showing types of early delivery
complications in the women.
Table 26. Types of Delivery Complication Types
Types of complication Frequency Percent Cumulative Percent
No complications 347 65.7 65.7
Abortion 35 6.6 72.3
Child death at time of birth 14 2.7 75.0
Delivery in the seventh months 13 2.5 77.5
Anaemic mother 20 3.8 81.3
Excess bleeding 12 2.3 83.5
High risk pregnancy 28 5.3 88.8
Jaundice to the baby 28 5.3 94.1
Weak child 31 5.9 100.0
Total 528 100.0 Source: As per survey on determinants of the total actual cost of Reproductive Health Care Services in Patna
Figure 22. Types of early delivery complications in the women
Source: As per survey on determinants of the total actual cost of Reproductive Health Care Services in Patna
Total Actual Cost of Reproductive Health Care services (TACRHS) in Patna: A statistical
analysis.
Analysis of the total actual cost of reproductive healthcare services incurred in the present
reproductive health care services.
65.7%
34.3%
Early Delivery Complication
No
65.63% 6.59%
2.70%
2.50%
3.80%
2.30%
5.29%
5.29% 5.89%
No complications
Abortion
Child death at time of birth
Delivery in the seventh months
Anemic mother
Excess bleeding
High risk pregnancy
Jaundice to the baby
Weak child

Rachna Mathur / International Journal for Research in Management and Pharmacy
Vol. 3, Issue 3, April 2014 (IJRMP) ISSN: 2320- 0901
17 Online International, Reviewed & Indexed Monthly Journal www.raijmr.com RET Academy for International Journals of Multidisciplinary Research (RAIJMR)
Table 27. Explaining descriptive statistics of the variables for the analysis of the actual cost of
reproductive healthcare services(TACRHCS)
Descriptive Statistics
Particulars Mean Std. Deviation N
Total cost of RHCS 16827.85 16111.226 528
Age of Respondent 24.95 4.867 528
Family Type 1.77 .424 528
Husband education 2.20 1.228 528
Household monthly income 16688.07 15047.975 528
Insurance information .77 .424 528
Delivery Type 1.48 .500 528
Sex of child born 1.42 .495 528
Birth order of children 2.08 1.006 528
Early delivery complication 1.34 .475 528
Hospital type 1.49 .500 528 Source: As per survey on determinants of the total actual cost of Reproductive Health Care Services in Patna
Table 28. Determinants of the Total Actual Cost of Reproductive Healthcare Services
(TACRHS)/ Determinants of expenditure incurred for TACRHCS
Coefficients
Model
Un standardized
Coefficients
Standardized
Coefficients t Sig.
B Std. Error Beta
(Constant) -14475.174 3664.342 -3.950 .000
Age of Respondent 645.212 97.657 .195 6.607 .000***
Family Type -6368.238 953.967 -.168 -6.676 .000***
Husband education 800.600 531.031 .061 1.508 .132
Household monthly
income
.374 .040 .349 9.371 .000***
Insurance information -2195.560 1130.140 -.058 -1.943 .053**
Delivery type 3040.004 1044.619 .094 2.910 .004***
Sex of child born -496.491 774.339 -.015 -.641 .522
Birth order of children -212.006 392.051 -.013 -.541 .589
Delivery complication 4657.956 1185.643 .137 3.929 .000***
Hospital type 7061.352 999.561 .219 7.064 .000***
a. Dependent Variable: Actual cost of reproductive healthcare services *indicates 10% level of significance,** indicates 5% level of significance,
*** indicates 1% level of significance
Source: As per survey on Reproductive Health Care Services in Patna
The regression analysis table shows that TACRHS in the present delivery is directly or positively
related to age of respondent, husband's education, household's monthly income, delivery
type(caesarean), early delivery complication, hospital type(private hospitals). TACRHS is inversely
or negatively related to family type(joint family), insurance information, expectation of sex of child
born(girl),birth order of children in the present delivery. Here seven variables out of total ten
variables are found to be significant in the above analysis.

Rachna Mathur / International Journal for Research in Management and Pharmacy
Vol. 3, Issue 3, April 2014 (IJRMP) ISSN: 2320- 0901
18 Online International, Reviewed & Indexed Monthly Journal www.raijmr.com RET Academy for International Journals of Multidisciplinary Research (RAIJMR)
Table 29. Test Statistics for the Regression Model for TACRHS
R . .857
a
R squared .735
Adjusted R square .730
F 143.165
Significance of F .000a
Degree of freedom 10
Durbin- Watson 1.809 Source: As per survey on determinants of the total actual cost of Reproductive Health Care Services in Patna
a. Predictors: (Constant), Hospital type, Birth order of children, Sex of child born, Family Type,
Delivery Type, Age of Respondent, Insurance information, Delivery complication, Household
monthly income, Husband education.
b. Dependent Variable: Total actual cost of reproductive health services (TACRHS) in the present
delivery.
Table illustrates the test statistic of the regression result for the determinants of the Total Actual Cost
of Reproductive Healthcare Services. The model is quite robust with F statistic value of 143.16 with
over 99% level of confidence. The value of R-square (coefficient of determination) is estimated to be
.735, i.e., 73% variation in the dependent variable (TACRHS) is explained by the variations in the
independent variables. Adjusted R square value .730 gives us the idea of how well our model
generalizes. Ideally we would like Adjusted R value to be the same or very close to the value of R
square which is .735. R is the multiple correlation coefficients that tells us how strongly the multiple
independent variables are related to the dependent variable. Regression coefficient R value is .857
shows that there is high positive correlation between the dependent variable TACRHS and all
independent variables in the model.
Table 30. Test statistics of the Regression Model of TACRHS
Variable
Un
standardized
Coefficients
95% Confidence Interval
for B
Col linearity
statistics
B Lower Bound Upper
Bound Tolerance VIF
(constant ) -14475.174 -21674.005 -7276.344
Age of respondent 645.212 453.358 837.066 .590 1.696
Family Type(Joint family) -6368.238 -8242.367 -4494.109 .813 1.230
Husband education 800.600 -242.643 1843.844 .313 3.190
Household monthly
income
.374 .295 .452 .370 2.701
Insurance information -2195.560 -4415.791 24.671 .579 1.726
Delivery Type(caesarean
delivery)
3040.004 987.783 5092.225 .488 2.050
Sex of child born -496.491 -2017.728 1024.746 .908 1.102
Birth order of children -212.006 -982.214 558.202 .857 1.167
Delivery complication 4657.956 2328.685 6987.227 .420 2.382
Hospital type 7061.352 5097.651 9025.053 .533 1.878 Source: As per survey on determinants of the total actual cost of Reproductive Health Care Services in Patna
Table states test statistics of the regression model for TACRHS, in the given model Variance
Inflation Factor (VIF) value is less than 10 and Tolerance level is more than 1 which show that given
model is free from the problem of multi co linearity.

Rachna Mathur / International Journal for Research in Management and Pharmacy
Vol. 3, Issue 3, April 2014 (IJRMP) ISSN: 2320- 0901
19 Online International, Reviewed & Indexed Monthly Journal www.raijmr.com RET Academy for International Journals of Multidisciplinary Research (RAIJMR)
9. Conclusions
The empirical study on the total actual cost of reproductive healthcare services in Patna has proved
the hypothesis as follows:
Total cost of reproductive healthcare services increases with the increase in the age of the
respondents.
Husbands with higher education are ready to afford larger total cost of reproductive healthcare
services.
Household with higher monthly income can afford larger cost on reproductive health care
services.
Early delivery complication increases the total cost of reproductive healthcare services.
With the increase of birth of additional child the amount spend on the total cost of reproductive
healthcare services for next chid decreases.
Total cost of RHCS is more in private hospitals than in government hospitals. This focused on
the need for the spread of health facilities in government hospitals to increase the reproductive
health in the state.
The study shows the biasness for the birth of boy child in Patna as the expenditure on the
reproductive healthcare services decreases on the expectation of the birth of girl child in present
study.
The study shows that insurance information among the respondents reduces the total actual cost
of RHCS. The result focused on the need for the spread of health insurance among the people to
reduce the actual total cost of reproductive health care services in future which can be an
important tool of healthcare financing in the state.
References
1. Boulet, S. L., Johnson, K., Parker, C., Posner, S. F., & Atrash, H. (2006). ‘ A perspective of
preconception health activities in the United States. Maternal and Child Health Journal,
10(5 Suppl): pp. S13-20
2. Chavkin, W. & Bernstein, P. (1999). ‘Maternal-Fetal Conflict is Not a Useful Construct. In
Marie C. McCormick & J. E. Siegel (Eds.), Prenatal Care: Practice and Potential. New
York, NY: Cambridge University Press.
3. Economic Survey of Bihar 2011.
4. ICPD Programme of Action (1994). Paragraph 7.2Programme of Action of the International
Conference on Population and Development, Cairo, Egypt, Sept. 5-13, 1994, para. 7.2, U.N.
Doc. A/CONF.171/13/Rev.1 (1995) [hereinafter ICPD Programme of Action]
5. Kelley. A.G, Rao. A, Makinen. M, et al. (2010).‘Reducing Financial Barriers to Reproductive
HealthCare: Experiences with Free Care and Health Insurance Ministerial Leadership
Initiative for Global Health ISSUE BRIEF, Printed in USA September, 2010 ,One Dupont
Circle N.W. Suite 700 Washington, D.C. 20036-1133 www.ministerial-leadership.org
6. Linda, L. Alexander, Judith H. LaRosa, Helaine Bader, & Susan Garfield. (2007). ‘New
dimensions in women’s health 4th ed. Boston, MA: Jones and Bartlett.
7. Wier, L.M, Andrews, R.M.,(2011). ‘The National Hospital Bill: the most Expensive Conditions
by Payer’, 2008. HCUP Statistical Brief #107. Rockville, MD: Agency for Health Care
Research and Quality.
8. World Health Organization (2011). UNICEF, United Nations Population Fund(UNFPA) & The
World Bank, Trends In Maternal Mortality: 1990 TO 2010, 1 (2012) [hereinafter Trends In
Maternal Mortality]; See also Rafael Lozano et al., Progress towards Millennium
Development Goals 4 and 5 on maternal and child mortality: an updated systematic
analysis, 378 The Lancet1139 (2011) [hereinafter Progress towards Millennium
Development Goals 4 and 5.