Embed Size (px)
Citation preview

International Journal of Scientific Engineering and Science Volume 5, Issue 11, pp. 33-45, 2021. ISSN (Online): 2456-7361
33
http://ijses.com/
All rights reserved
Determinants of the Value of Listed Consumer Goods
Companies in Nigeria
Azende Terungwa PhD1, Apebo Avapine Benedicta2
1, 2Benue State University Makurdi
Email address: tazende(at)yahoo.com, bennieava(at)gmail.com
Abstract— The study examines the effect of dividend per share, earnings per share, firm size, leverage, and profit after tax on the value of listed
consumer goods firms in Nigeria. Panel regression was used to analyze data for the period of 2012 to 2019. A sample of fifteen (15) consumer
goods companies was selected using the purposive sampling technique. The results of the study indicated that earnings per share and firm size
have a significant effect on the value of listed consumer goods companies in Nigeria measured by the market price per share. Dividend per share,
leverage and profit after tax of consumer goods companies did not significantly affect their value measured by the market price per share. The
study concluded that the major determinants of firm value are the size of the firm and its earnings per unit of shares. The study recommended that
managers of consumer goods companies should engage in those activities that will boost their earnings per unit share to create value for their
shareholders.
Keywords— Earnings per share, dividend per share, firm size, leverage, profit after tax.
I. INTRODUCTION
In the present highly competitive business environment,
companies leave no stone unturned for the right valuation.
Company valuation has cracked the attention of corporate
financial analysts (Bhullar, 2017). Company valuation is
important because it is an indication of the wealth that has been
created for stockholders on their investments. The basic
economic objective of a firm capitalist in nature is to maximize
the wealth of its owners through increased profitability and
market share price. Before a person invests in a company in any
capital market. The investor must acquire information on the
capital market. When a capital market is informative efficient
prices of securities reflect all relevant information. For very
efficient capital markets information is quickly and accurately
reflected in share price (Sampurna & Romawati, 2019).
Sudiyatno, Puspitasar, Suwarti and Asyif, (2020) opined that
information on share prices helps investors in their investing
policies. Sudiyatno, Puspitasar, Suwarti and Asyif, (2020) argued
that the fundamental aspect of a firm becomes part of its basic
valuation. This is because the value of a company
shares reflects both the intrinsic value of the company and
expectations about its prospects. Some factors influencing a
company’s value may be out of the company’s control. It is
however important for companies to identify those factors that
influence the value that is within their control to be able to
control them to get a maximal valuation. Du, Wu and Liong,
(2016) argued that corporate size, corporate liquidity and
innovation can affect firm value. Consumer goods companies listed on the Nigerian stock
exchange have witnessed strong volatility in their share prices
in recent years despite their huge earnings. Previous studies
including Sudiyatno, Puspitasar, Suwarti and Asyif,
(2020) have argued that the share price of a company is a
reflection of its value to shareholders It is based on the volatility
in their share prices that this study investigates the determinants
of the firm value of consumer goods companies measured in
their share prices.
II. LITERATURE REVIEW
Firm Value
Firm Value has been viewed by several authors and
scholars. Kusiyah and Arief (2017) view firm value as certain
conditions that have been achieved by a company after going
through a process of several years, since the company was
founded until now. In a similar vein Awan, Lodhi, and Hussain,
(2018). Stated that firm value is a sum of the values of a
company’s total assets that make the market value. It reveals
the total wealth of the owners of the entity. Firm value is the
total value of the company’s asset that determines the market
value of a company, it indicates the total wealth to the company
(Awan, Lodhi, and Hussain, 2018). Firm value can also be seen
as the present net worth of a company often measured by its net
book value or its present market value.
Determinants of Firm Value
Empirical evidence suggests that firm value could be
determined by several factors Awan, Lodhi, and Hussain,
(2018). Identified some possible determinants of firm value to
include future performance, financial leverage, financial
returns, net profit, and total assets among others. Endri and
Fathony (2020) stated that the determinants of firm value could
include; Dividend per share, Return on Assets, company size,
debt to equity ratio, and growth. For this study Dividend per
share, Earnings per share, firm size, leverage, and profit after
tax will be considered as possible determinants and their effect
on the firm value measured by the market price per share
analyzed. The value of consumer goods companies in Nigeria
continues to fluctuate without a clear indication of what factors
are responsible for these fluctuations. It is pertinent to
empirically investigate the factors that contribute to the
fluctuation of the firm value measured by the market price per
International Journal of Scientific Engineering and Science Volume 5, Issue 11, pp. 33-45, 2021. ISSN (Online): 2456-7361
34
http://ijses.com/
All rights reserved
share in the consumer goods sector of the Nigerian Stock
Exchange.
Empirical Evidence
Endri and Fathony (2020) analyzed the effect of dividend
policy, profitability, firm size, leverage, and growth on firm
value in financial sector firms listed on the Indonesia Stock
Exchange. The study used a sample of 21 companies. Data were
analyzed using panel regression. The results of the study
indicated that firm size, leverage, and growth did not have any
significant effect on firm value in the financial sector
companies in the period 2013-2017 while dividend policy and
profitability proved to have a significant positive effect on firm
value in financial sector companies for the period under
investigation. Husna and Satria, (2019) analyzed the effect of Return on
assets, debts to asset ratio, current ratio, firm size, and dividend
payout ratio to the value of manufacturing companies listed on
the Indonesia Stock Exchange for the period 2013 -2016. The
study used the purposive sampling technique and obtained a
sample of 32 companies out of 138 firms that met the criteria.
Multiple regression was used to analyze the data. The results
indicated that return on assets and firm size affect firm value.
While, the debt to asset ratio, current ratio, and dividend payout
ratio does not affect firm value. Sampurna and Romawati (2019) examined the determinants
of the firm value of listed manufacturing companies in the
Indonesia Stock Exchange during five years. The study used a
sample of 84 companies listed on the Indonesia Stock
Exchange. Panel regression was used to analyze data. The
results of the study indicated that firm size return on assets and
market to book value has a positive effect on firm value. The
results also proved that debt to total assets has a negative
significant effect on firm value. While institutional ownership
has a negative insignificant effect on firm value. Awan, Lodhi, and Hussain (2018) analyzed the importance
of chemical industries of Pakistan and the major factors
affecting their working and profitability. The study used a
sample of 19 chemical companies listed on the Pakistan Stock
Exchange. Multiple regression was used to analyze data,
Results of the study indicated that firm value increases with an
increase in networking capital and earnings per share while
financial leverage, firm size and return on assets did not
significantly affect stock prices. Endrir (2018) analyzed the influence of capital structure,
profitability, liquidity, and market share on company value. The
study was conducted in the consumer goods sector of the
cigarette sub-sector in Indonesia Stock Exchange for the period
of 20012 – 2016. The study used a sample of 4 companies and
multiple regression was used to analyze data. The results
proved that capital structure and profitability have a positive
and significant influence on firm value. Liquidity has a negative
and insignificant influence on the value of the company. Market
share has a positive but insignificant effect on firm value. Oktarina (2018) examined the effect of profitability, capital
structure, managerial ownership, and institutional ownership on
the firm value of property and real estate companies listed on
the Indonesia stock exchange for the period 2014 to 2017. The
sample was derived using the purposive sampling technique.
Data were analyzed using multiple regression. The results of the
study indicated that profitability, capital structure, and
managerial ownership affect the firm value. Gharaibeh and Qadar (2017) examined the endogenous
(firm-specific) determinants of firm value as measured by
Tobin’s Q. A sample of 40 companies was selected. Data for
the period (2005-2014) were analyzed using panel regression.
The results of the OLS regression suggested that one-year
lagged firm value, market capitalization, growth opportunities,
profitability, and solvency of the firm have statistically
significant relationships with firm value. Firm size, efficiency,
and tangibility were found to have a positive but statistically
insignificant relationship with firm value. Leveraging and
dividend policy was found to have a negative thought
statistically insignificant relationship with the value of the firm.
The study suggests that firm size, efficiency, tangibility,
leveraging and dividend policy are not significant determinants
of the value of firms listed in the Saudi Stock Exchange. Kusiyah and Arief (2017) studied the impact of investment
decisions, financing decisions, and dividend policy on the value
of commercial banks in Indonesia. The study used secondary
data obtained from the company’s financial statements for the
period of 2011-2015. The study used panel regression to
analyze data. Results of the study indicated that investment
decisions and dividend policy affects the value of the company
while funding decisions do not affect the value of the company,
simultaneously, investment decisions, financing decisions, and
dividend policy affect the value of the company. The results
suggested a positive relationship between investing decisions,
financing decisions, and dividend policy on firm value. Sucuahi and Cambarihan (2016) investigated the influence
between a company’s profile such as industry, company age,
and its profitability with the firm value using Tobin’s Q model.
The study used a sample of 86 diversified companies in the
Philippines, annual reports for 2014 were analyzed using
multiple regression. The results of the study revealed that only
profitability shows a significant positive impact on a firm’s
value Hermuningsih (2013) examined the influence of
profitability, growth opportunity, and capital structure on firm
value. The study used a sample of 150 listed companies on the
Indonesian stock exchange from 2006 to 2010. Using Structural
Equation Model (SEM) the study showed that profitability,
growth opportunity, and capital structure positively and
significantly affect a company’s value. Capital structure
intervenes in the effect of growth opportunity on a company’s
value but not for profitability. Rajhans and Kaur (2013) Investigated the determinants of
firm value creation for 16 companies of four sectors namely
metal, fast-moving consumer goods (FMCG) information
technology (IT), and the Automobile industry listed on the
Bombay Stock Exchange from 2002 to 2011. A pooled
regression model was applied to identify the significant factors.
The results of the study indicated that capital structure doesn’t
influence the value of the firm, while the Weighted Average
Cost of Capital (WACC) has a significant effect on firm value.

International Journal of Scientific Engineering and Science Volume 5, Issue 11, pp. 33-45, 2021. ISSN (Online): 2456-7361
35
http://ijses.com/
All rights reserved
Fixed assets, net sales, and profit had a significant effect on firm
value. Cheng and Tzeng (2011) estimated the effect of leverage on
firm values and contextual variables. A sample of 645
companies listed in Taiwan was selected. Data for the period
2000-2009 were analyzed using the generalized method of
moment (GMM). The results of the study proved that the values
of leveraged firms are greater than that of unleveraged firms.
The study also revealed that leveraged is significantly
positively related to the firm value before reaching the firm’s
optimal capital structure. The study tends to be stronger when
the firm financial quality is better. The study however
considered only leverage and failed to consider other
determinants.
From the reviewed literature. Different factors have been
identified as having an effect on firm value. This could be due
to the different methodologies used and different economic
environments where the research was carried out. Looking at
the consumer goods sector in Nigeria as one of the largest
sectors contributing to the nation’s GDP, it is pertinent to
examine the factors that affects the value of companies in this
sector.
Objecctives of the Study
The study seeks to investigate the determinants of the firm
value of consumer goods firms listed on the Nigerian stock
exchange. In specific terms it seeks to: 1. To examine the effect of Earnings per share (EPS) on the
market price per share (MPS) of consumer goods firms
listed on the Nigerian Stock Exchange. 2. O analyze the effect of Dividends per share (DPS) on MPS
of consumer goods firms listed on the Nigerian Stock
Exchange. 3. To assess the effect of Firm Size (FS) on the MPS of
consumer goods companies listed on the Nigerian Stock
Exchange. 4. To investigate the effect of Leverage (LV) on the MPS of
consumer goods companies listed on the Nigerian Stock
Exchange. 5. To analyze the effect of profit after tax (PAT) on Market
price per share of consumer goods firms listed on the
Nigerian Stock Exchange.
The Research hypothesis
The following five (5) research hypotheses are formulated
in null form for testing to identify the potential factors
determining the firm value of consumer goods firms listed on
the Nigerian Stock Exchange. H01: There is no significant relationship between EPS and MPS
of consumer goods firms listed on the Nigerian Stock Exchange
(NSE). H02: There is no significant relationship between DPS and MPS
of consumer goods firms listed on the Nigerian Stock Exchange
(NSE). H03: There is no significant relationship between FS and MPS
of consumer goods firms listed on the Nigerian Stock Exchange
(NSE).
H04: There is no significant relationship between LV and MPs
of consumer goods firms listed on the Nigerian Stock Exchange
(NSE). H05: There is no significant relationship between PAT and MPS
of consumer goods firms listed on the Nigerian Stock Exchange
(NSE).
III. DATA AND METHODOLOGY
This study analyses data of 15 consumer goods firms listed
on the Nigerian Stock Exchange for the period of 2012-2019.
The eight year period is thought to be adequate for determing
the determinants of firm value in the consumer goods sector in
Nigeria.
The Study Model
This study uses panel regression to examine the effect of
specific firm variables on the value of consumer goods firms in
Nigeria measured by the market price per share (MPS). The
independent variables include DPS, EPS, FS, LV, and PAT.
The dependent variable used is firm value and it is measured by
MPS as observed in the stock market for various years. Firm Size: Agency theory suggests that managers are often
tempted by incentives to expand in company size, buy assets
that have nothing to do with their business because this action
will enable them to maintain their positions as managers, Firm
size (FS) is measured in the study by total assets. Profitability: Profitability is the ability of the company to earn
a profit it is measured in this study through profit after tax
(PAT) and earnings per share (EPS). Dividend: Dividends are payments out of a company’s profit to
its shareholders. Dividend payments in this study are measured
by dividend per share calculated by total dividend declared/
total number of shares (Kusiyah and Arief 2017). Leverage: Debt is a source of external funding for companies
and companies often find it attractive to recapitalize or
restructure capital and develop their business operations. In
addition, debt financing can increase earnings per share.
However excessive debt can increase the financial risk and
cause financial distress. Leverage in this study is measured by
Total liabilities / Total assets Gharaibeh and Qadar (2017). Firm Value: firm value is the dependent variable in the study
and is measured by the market price per share as observed on
the Nigerian Stock Exchange. Below is the economic regression model estimated to test
the above-mentioned study hypothesis
LogMPSit=β0+ β1EPSit+ β2DPS+ β3FS+it β4LVit+ βLog5PATit+µit Where β0=Intercept or constant Β1- β5=Coefficients of explanatory variables µ=error term log MPS= log of Market Price Per Share as observed in the
stock market. DPS=Dividend Per Share calculated by total declared
dividends/Total number of shares EPS=Earnings Per Share calculated by total earnings/total
number of shares FS=Firm Size measured by total assets

International Journal of Scientific Engineering and Science Volume 5, Issue 11, pp. 33-45, 2021. ISSN (Online): 2456-7361
36
http://ijses.com/
All rights reserved
LV= firm leverage measured by total liabilities to total assets as
a proxy of the leverage, capital structure, or debt ratio. Log PAT=Log of Profit after tax
µ=error term
it = firm I at time t
IV. DATA ANALYSIS AND RESULTS
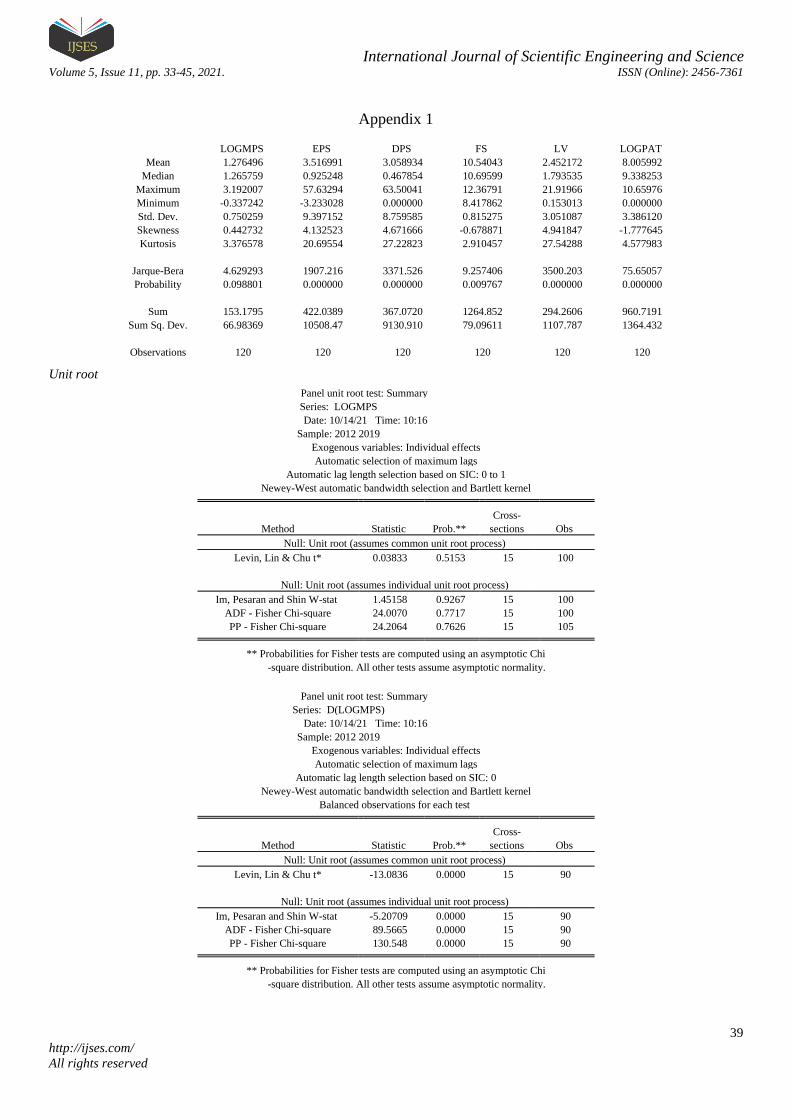
Descriptive statistics
LOGMPS EPS DPS FS LV LOGPAT
Mean 1.276496 3.516991 3.058934 10.54043 2.452172 8.005992
Maximum 3.192007 57.63294 63.50041 12.36791 21.91966 10.65976
Minimum -0.337242 -3.233028 0.000000 8.417862 0.153013 0.000000
Std. Dev. 0.750259 9.397152 8.759585 0.815275 3.051087 3.386120
Skewness 0.442732 4.132523 4.671666 -0.678871 4.941847 -1.777645
Kurtosis 3.376578 20.69554 27.22823 2.910457 27.54288 4.577983
Jarque-Bera 4.629293 1907.216 3371.526 9.257406 3500.203 75.65057
Probability 0.098801 0.000000 0.000000 0.009767 0.000000 0.000000
Observations 120 120 120 120 120 120
Source: E View output in the study appendix
The descriptive statistic table above reveal a total number of
observation for the study as 120. From the observed statistics,
the means and standard deviations of the variables (LOGMPS,
EPS, DPS, FS, LV & LOGPAT) are 1.276496, 3.516991,
3.058934, 10.54043, 2.452172, 8.005992 and 0.750259,
9.397152, 8.759585, 0.815275, 3.051087, 3.386120
respectively.
In respect to the maximum and minimum values, the study
reveals the maximum values of 3.192007, 57.63294, 63.50041,
12.36791, 21.91966 and 10.65976 for LOGMPS, EPS, DPS,
FS, LV and LOGPAT. Also, the study further reveal minimum
values of -0.337242, -3.233028, 0.000000, 8.417862, 0.153013
0.000000 for LOGMPS, EPS, DPS, FS, LV and LOGPAT
respectively.
The values for the means and standard deviation shows the
average values, as well as the level of deviation in dividend
policy and financial performance proxy of the listed firms in
Nigeria with its’ respectively skeweness test for normality. Data
for the variables reveal skeweness values between -2 and +2
which signifies that the data are normalized at a platykurtic
direction except data for EPS, DPS and LV which are not
normally distributed. Furthermore, the Jarques-Bera test for
stationarity reveal that the data for LOGMPS meets the
stationarity criteria with a probability value >0.05 while data
for both EPS, DPS, FS, LV, and LOGPAT require further
checks to ascertain the level of stationarity since they have
probability values of <0.05. The level of variation within the
study data signifies the presence of firms’ specific variation
which needs to be observed. Thus, the Unit root test for
stationarity and the cointegration test for long run adjustment of
the variable means will be deployed to correct the non-
normality of the data set.
Diagnostic statistics
Variable
LLC
(Commo
n P-
value)
ADF
(Individua
l P-Value)
Orde
r
Cointegratio
n criteria
LOGMP
S 0.0000 00000 I(1)
1st
Dif 0.0056
EPS 0.0000 0.0523 I(0) Leve
l 0.0056
DPS 0.0000 0.0001 I(1) 1st Dif
0.0056
FS 0.0000 0.0017 I(0) Leve
l 0.0056
LV 0.0000 0.0362 I(0) Leve
l 0.0056
LOGPA
T 0.0000 0.0032 I(0)
Level
0.0056
Source: E View output in the study appendix
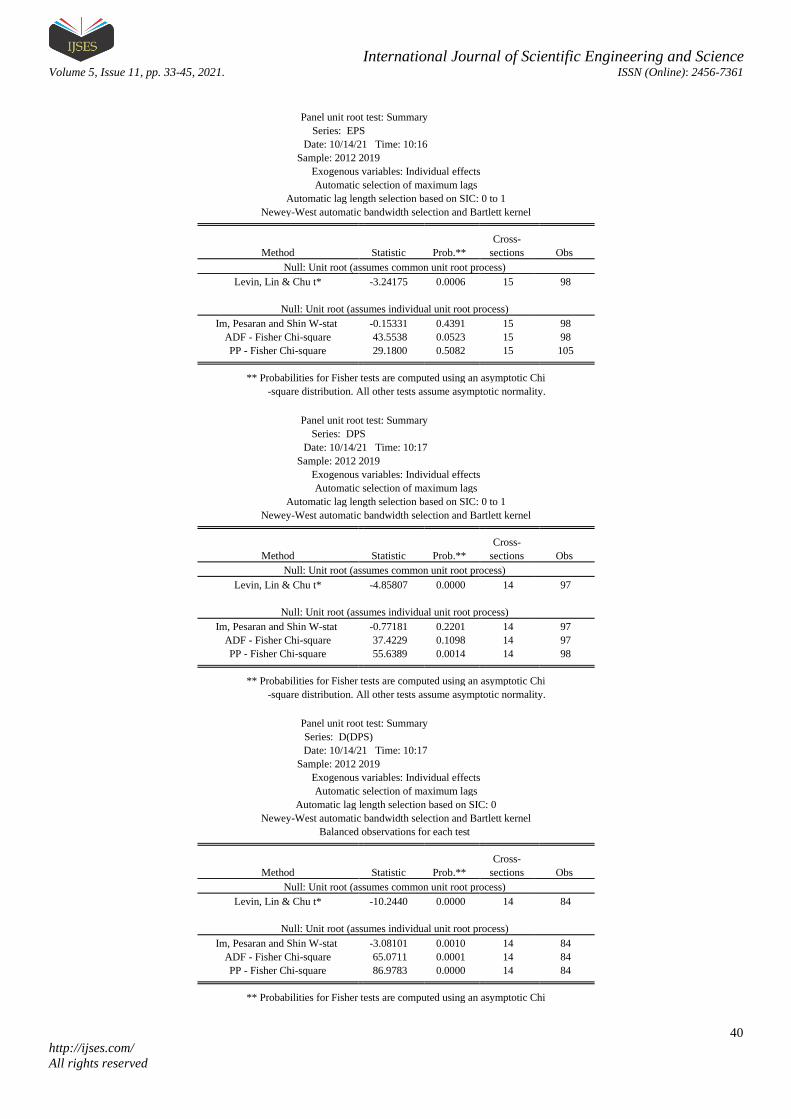
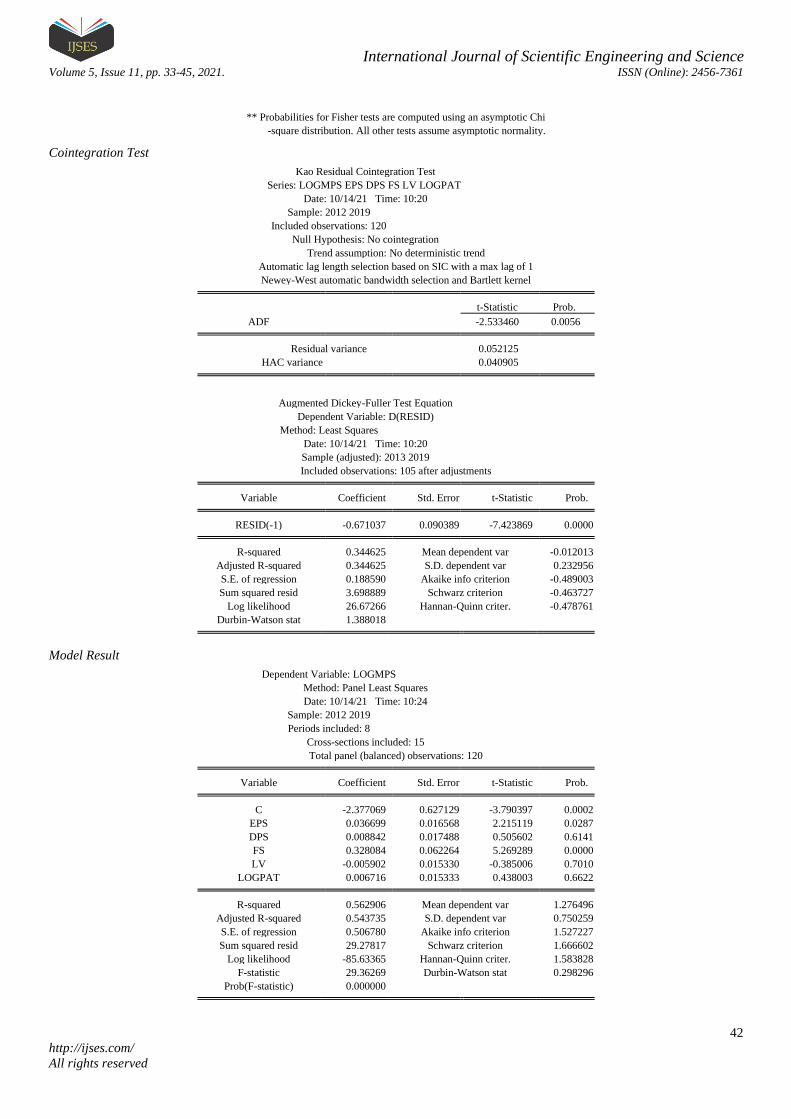
From the diagnostic statistic table above, it is inferred that,
EPS, FS, LV and LOGPAT are all stationary at level order of
integration, except LOGMPS and DPS which are stationary at
1st difference order. As a result, the study further conducts a
cointegration test to ascertain if there are adjustment for data
fluctuation in the long run. From the table above, the
cointegration result for both LOGMPS against EPS, DPS, FS,
LV, LOGPAT model reveal that, there is no need for the study
to adopt an Error correction model given the fact that, Kao
cointegration criteria reveal a probability value of <0.05 which
means; the mean of the variable data will adjust for corrections
in the long run. Therefore, the study adopts the panel least
square regression model.
Regression result for market price per share model
Pre estimation test table
Criteria Tau Stat. Fisher Stat. Chi-Sq.
Stat Prob.
Hausman Test
15.603994 0.0081
Breusch-Pagan LM
205.7661 0.000
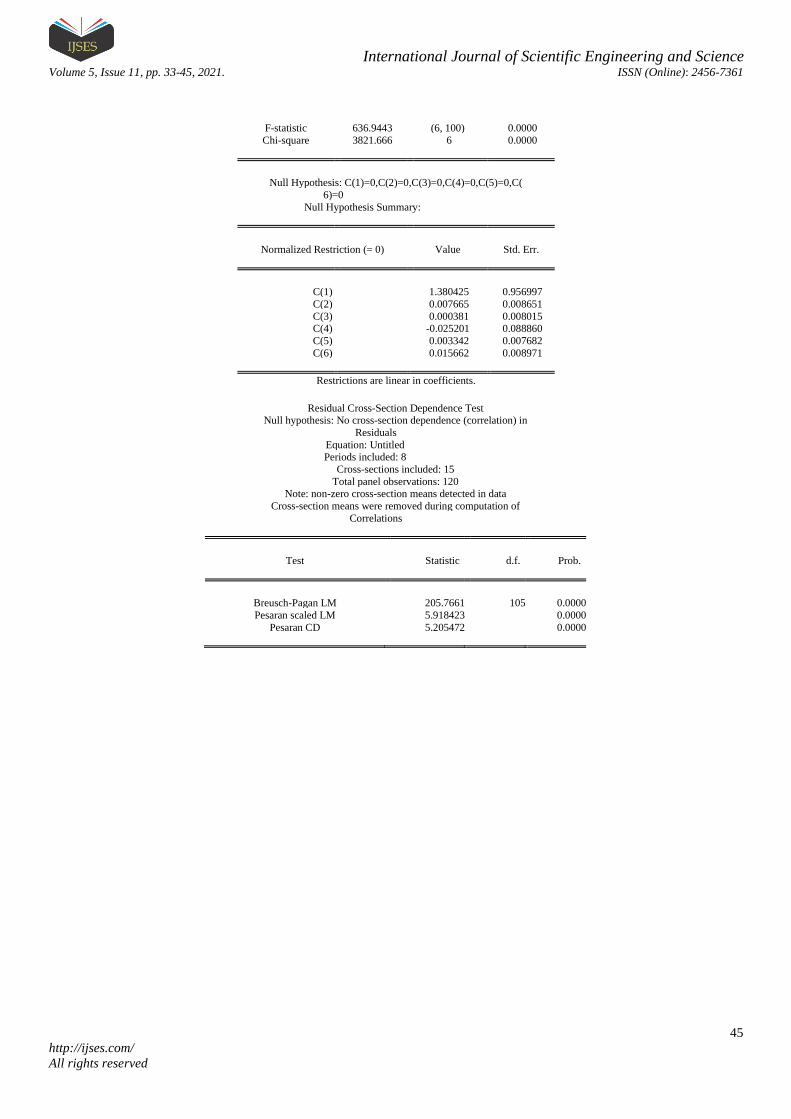
Wald Test 636.9443 0.000
Wald Test 3821.666 0.000
Source: E View output in the study appendix
To enable the study chose the most appropriate estimated
model in regards to the panel linear model for EPS, DPS, FS,
LV, LOGPAT against LOGMPS, Hausman, Breusch-Pagan
LM and Wald test are conducted. From the table able, the
Hausman test result reveal a Chi Square (15.603994)
probability value of 0.0081. This means the random effect
model is not appropriate since the firms considered show no
satisficing evidence of specific variation in the data set used for
the study. As a result, the Breusch-Pagan LM test is considered
to enable the study chose between the random effect test and
the pooled effect test. The Breusch-Pagan LM test reveal a Tau
statistic (205.7661) probability value of <0.05 which means that
the pooled effect test is most preferred against the random effect
test. Finally, to ensure that there are no time specific variation
in the pooled effect result, the Wald test is conducted using a;
International Journal of Scientific Engineering and Science Volume 5, Issue 11, pp. 33-45, 2021. ISSN (Online): 2456-7361
37
http://ijses.com/
All rights reserved
C(1,2,3,4,5,6,)=0 criteria model for the variables. The Wald test
result reveal a Chi-square (3821.666) and Fisher (636.9443)
statistics probability values of <0.05 which means; there are no
time specific variations contained in the data set. Thus, the
pooled effect test is the most appropriate model to be adopted
for the study.
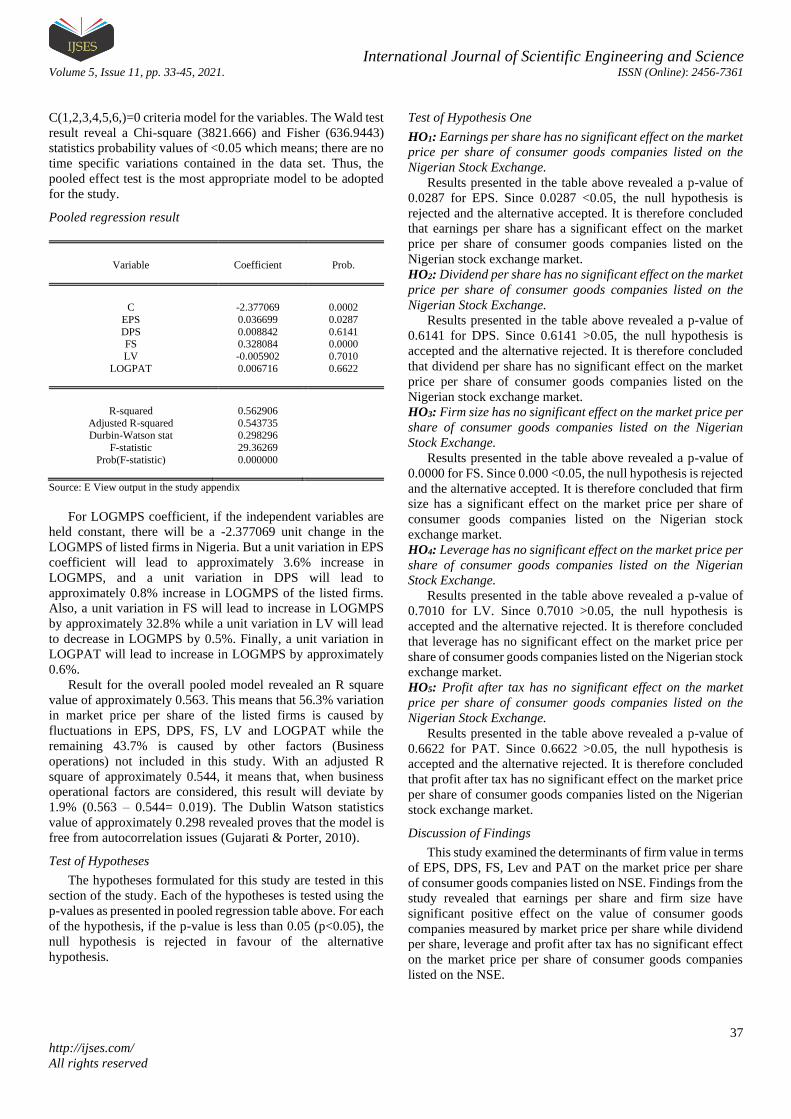
Pooled regression result
Variable Coefficient Prob.
C -2.377069 0.0002
EPS 0.036699 0.0287
DPS 0.008842 0.6141 FS 0.328084 0.0000
LV -0.005902 0.7010
LOGPAT 0.006716 0.6622
R-squared 0.562906
Adjusted R-squared 0.543735 Durbin-Watson stat 0.298296
F-statistic 29.36269
Prob(F-statistic) 0.000000
Source: E View output in the study appendix
For LOGMPS coefficient, if the independent variables are
held constant, there will be a -2.377069 unit change in the
LOGMPS of listed firms in Nigeria. But a unit variation in EPS
coefficient will lead to approximately 3.6% increase in
LOGMPS, and a unit variation in DPS will lead to
approximately 0.8% increase in LOGMPS of the listed firms.
Also, a unit variation in FS will lead to increase in LOGMPS
by approximately 32.8% while a unit variation in LV will lead
to decrease in LOGMPS by 0.5%. Finally, a unit variation in
LOGPAT will lead to increase in LOGMPS by approximately
0.6%.
Result for the overall pooled model revealed an R square
value of approximately 0.563. This means that 56.3% variation
in market price per share of the listed firms is caused by
fluctuations in EPS, DPS, FS, LV and LOGPAT while the
remaining 43.7% is caused by other factors (Business
operations) not included in this study. With an adjusted R
square of approximately 0.544, it means that, when business
operational factors are considered, this result will deviate by
1.9% (0.563 – 0.544= 0.019). The Dublin Watson statistics
value of approximately 0.298 revealed proves that the model is
free from autocorrelation issues (Gujarati & Porter, 2010).
Test of Hypotheses
The hypotheses formulated for this study are tested in this
section of the study. Each of the hypotheses is tested using the
p-values as presented in pooled regression table above. For each
of the hypothesis, if the p-value is less than 0.05 (p<0.05), the
null hypothesis is rejected in favour of the alternative
hypothesis.
Test of Hypothesis One
HO1: Earnings per share has no significant effect on the market
price per share of consumer goods companies listed on the
Nigerian Stock Exchange.
Results presented in the table above revealed a p-value of
0.0287 for EPS. Since 0.0287 <0.05, the null hypothesis is
rejected and the alternative accepted. It is therefore concluded
that earnings per share has a significant effect on the market
price per share of consumer goods companies listed on the
Nigerian stock exchange market.
HO2: Dividend per share has no significant effect on the market
price per share of consumer goods companies listed on the
Nigerian Stock Exchange.
Results presented in the table above revealed a p-value of
0.6141 for DPS. Since 0.6141 >0.05, the null hypothesis is
accepted and the alternative rejected. It is therefore concluded
that dividend per share has no significant effect on the market
price per share of consumer goods companies listed on the
Nigerian stock exchange market.
HO3: Firm size has no significant effect on the market price per
share of consumer goods companies listed on the Nigerian
Stock Exchange.
Results presented in the table above revealed a p-value of
0.0000 for FS. Since 0.000 <0.05, the null hypothesis is rejected
and the alternative accepted. It is therefore concluded that firm
size has a significant effect on the market price per share of
consumer goods companies listed on the Nigerian stock
exchange market.
HO4: Leverage has no significant effect on the market price per
share of consumer goods companies listed on the Nigerian
Stock Exchange.
Results presented in the table above revealed a p-value of
0.7010 for LV. Since 0.7010 >0.05, the null hypothesis is
accepted and the alternative rejected. It is therefore concluded
that leverage has no significant effect on the market price per
share of consumer goods companies listed on the Nigerian stock
exchange market.
HO5: Profit after tax has no significant effect on the market
price per share of consumer goods companies listed on the
Nigerian Stock Exchange.
Results presented in the table above revealed a p-value of
0.6622 for PAT. Since 0.6622 >0.05, the null hypothesis is
accepted and the alternative rejected. It is therefore concluded
that profit after tax has no significant effect on the market price
per share of consumer goods companies listed on the Nigerian
stock exchange market.
Discussion of Findings
This study examined the determinants of firm value in terms
of EPS, DPS, FS, Lev and PAT on the market price per share
of consumer goods companies listed on NSE. Findings from the
study revealed that earnings per share and firm size have
significant positive effect on the value of consumer goods
companies measured by market price per share while dividend
per share, leverage and profit after tax has no significant effect
on the market price per share of consumer goods companies
listed on the NSE.

International Journal of Scientific Engineering and Science Volume 5, Issue 11, pp. 33-45, 2021. ISSN (Online): 2456-7361
38
http://ijses.com/
All rights reserved
Results however indicate a positive relationship between
DPS and MPS. This implies that an increase in dividend
payment to shareholders will increase the market price per
share, such increase is not significant. This corroborates with
the dividend irrelevance theory which is of the notion that the
value of a firm depends on revenue earned by its assets and not
in what way the firm divides the revenue into retained earnings
and dividends. Therefore, dividend per share does not
significantly predict the value of a firm. This substantiates the
findings of Husna and Satria, (2019) but contradicts the
findings of Endri and Fathony (2020).
Findings revealed that Earnings per share (EPS) has a
significant positive effect on the market price per share (MPS)
of consumer goods companies listed on the NSE. The
relationship existing between EPS and MPS is positive in
nature, indicating that an increase in Earnings per share will
lead to an increase in the market price per share. This may be
attributed to the fact that Investors are attracted to companies
with higher earnings on their investment. This is consistent with
the findings of Awan, Lodhi and Hussain (2018).
The study also found that firm size (FS) has a significant
effect on the market price per share (MPS) of consumer goods
companies listed on the NSE. Generally, investors would prefer
to invest in large companies with known years of success. The
nature of the relationship between firm size and market price
per share is positive, showing that an increase in the size of the
companies lead to an increase in market price per share
Sampurna and Romawati (2019) who found a significant
relationship between firm size and share prices of companies.
In relation to whether LEV has an insignificant effect on the
MPS of consumer goods companies listed on the NSE. Findings
also indicates a negative relationship existing between leverage
and market price per share of the companies. Lev is the ratio of
total liabilities to total assets. This result indicates that the
higher the total liabilities are to total assets the lower the market
price per share. This may be attributed to the fact that investors
are risk averse and are not willing to invest in highly leveraged
companies as there exist a tendency of takeover in this
companies. Company’s performance. This is similar to the
findings of Gharaibeh and Qadar (2017 who found an
insignificant negative relationship between leverage and stock
prices.
Finally, the study found that that Profit after tax has no
significant effect on the market price per share of consumer
goods companies listed on the NSE. Findings also revealed a
positive relationship existing between PAT and MPS of the
companies. PAT represents the profitability of the firm.
Investors will definitely prefer the stocks of a company with
high returns. However, a higher profit after tax leads to a higher
market price per share PAT of consumer goods firms does not
significantly affect share prices.
V. CONCLUSION
The study provided empirical evidence on the relationship
between the determinants of firm value (proxied by earnings per
share, dividends per share, firm size, leverage and profit after
tax and the firm value (proxied by market price per share) of
listed consumer goods companies in Nigeria. Earnings per
share and firm size increases the value of the companies in a
statistically significant manner. This can be attributed to the fact
that investors are attracted to companies with higher returns per
share.
VI. RECOMMENDATION
Management of corporate entities should consider
investment opportunities for increasing their earnings before
deciding on the amount of earnings to pay to shareholders as
dividends and the amount to reinvest in the company. Managers
of corporate entities should also reinvest their returns and
encourage growth in the size of their firm. If opportunities for
higher earnings exist retention and efficient utilization of
earnings could increase the value of the firm.
REFERENCES
1. Awan, G., Lodhi, U., & Hussain, D. (2018). Determinants of Firm Value:
A Case Study of Chemical Industry of Pakistan. Global Journal of Managenent, Social Sciences and Humanities, 4(1), 46-61.
2. Bhullar, P. (2017). Empirical analysis of Operating efficiency and Firm
value. International Journal of Economics and Financial Issues, 7(3), 671-675.
3. Cheng, M., & Tzeng, Z. (2011). The Effect of Leverage on Firm value
and how the firm's financial quality influence on this. World Journal of Management, 3(2), 30-53.
4. Du, J., Wu, F., & Liong, X. (2016). Corporate liquidity and firm value:
evidence from china's listed firms. SHS web Conferencing. Guangzhou:
EDP Sciences.
5. Endri, E., & Fathony, M. (2020). Determinants of Frm's value: Evidence
from Financial Industry. Management Science Letters, 10, 111-120. 6. Endrir, C. D. (2018). Determinants oof Firm value: A case study of
Cigarette companies listed on the Indonesia Stcok Exchange. International Journal of Mangerial Studies and Research, 6(8), 51-59.
7. Gharaibeh, A., & Qadar, A. (2017). Factors affecting Firm Value as
measured by Tobin's Q: Empirical Evidence from Saudi Stock Exchange. nternational Journal of Applied Business and Economics Research, 15(6),
333-358.
8. Gujarati, D. N., & Porter, D. C. (2010). Investment and Econometria. Mexico: McGraw-Hill.
9. Hermuningsih, S. (2013). Profitability, Growth opportunity, Capital
structure and the Firm value. Bullentin of Monetary, Economics and Banking, 116-136.
10. Husna, A., & Satria, I. (2019). Effects of Return on Assets, Debt to
Assetsratio, Current eatio, Firm size and Dividend payout ratio on Firm value. International Journal of Economics and Financial Issues, 9(5), 50-
54.
11. Kusiyah, U., & Arief, :. (2017). The Determinants of Firm Value on Commercial Banks in Indonesia. Journal of Engineering and Applied
Sciences, 12(2), 408-416.
12. Oktarina, D. (2018). The Analysis of Firm value in Indonesia Property and Real Estate Companies. International Journal of Research Science &
Management, 5(9), 85-92.
13. Rajhans, K., & Kaur, K. (2013). Financial Determinants of Firm's Value: Evidence from Indian FirmsI. International Journal of Business,
Economics and Management Research, 3(5), 70-76.
14. Sampurna, D. S., & Romawati, E. (2019). Determimamts of Firm Value: Evidence in Indonesia Stock Exchange. Advances in Economics,
Business and Management Research, 132(6), 12-15.
15. Sucuahi, W., & Cambarihan, J. M. (2016). Influence of profitability to the firm value of diversified companies in the Philippines. Accounting and
Finance Research, 5(2), 149-153.
16. Sudiyatno, B., Puspitasar, E., Suwarti, T., & Asyif, M. (2020).
Determinants of firm value and profitability: Evidence from Indonesia.
Journal of Asian Finance, Economics and Business, 7(1), 769-778.
International Journal of Scientific Engineering and Science Volume 5, Issue 11, pp. 33-45, 2021. ISSN (Online): 2456-7361
39
http://ijses.com/
All rights reserved
Appendix 1
LOGMPS EPS DPS FS LV LOGPAT
Mean 1.276496 3.516991 3.058934 10.54043 2.452172 8.005992
Median 1.265759 0.925248 0.467854 10.69599 1.793535 9.338253
Maximum 3.192007 57.63294 63.50041 12.36791 21.91966 10.65976
Minimum -0.337242 -3.233028 0.000000 8.417862 0.153013 0.000000
Std. Dev. 0.750259 9.397152 8.759585 0.815275 3.051087 3.386120
Skewness 0.442732 4.132523 4.671666 -0.678871 4.941847 -1.777645
Kurtosis 3.376578 20.69554 27.22823 2.910457 27.54288 4.577983
Jarque-Bera 4.629293 1907.216 3371.526 9.257406 3500.203 75.65057
Probability 0.098801 0.000000 0.000000 0.009767 0.000000 0.000000
Sum 153.1795 422.0389 367.0720 1264.852 294.2606 960.7191
Sum Sq. Dev. 66.98369 10508.47 9130.910 79.09611 1107.787 1364.432
Observations 120 120 120 120 120 120
Unit root
Panel unit root test: Summary
Series: LOGMPS
Date: 10/14/21 Time: 10:16
Sample: 2012 2019
Exogenous variables: Individual effects
Automatic selection of maximum lags
Automatic lag length selection based on SIC: 0 to 1
Newey-West automatic bandwidth selection and Bartlett kernel
Cross-
Method Statistic Prob.** sections Obs
Null: Unit root (assumes common unit root process)
Levin, Lin & Chu t* 0.03833 0.5153 15 100
Null: Unit root (assumes individual unit root process)
Im, Pesaran and Shin W-stat 1.45158 0.9267 15 100
ADF - Fisher Chi-square 24.0070 0.7717 15 100
PP - Fisher Chi-square 24.2064 0.7626 15 105
** Probabilities for Fisher tests are computed using an asymptotic Chi
-square distribution. All other tests assume asymptotic normality.
Panel unit root test: Summary
Series: D(LOGMPS)
Date: 10/14/21 Time: 10:16
Sample: 2012 2019
Exogenous variables: Individual effects
Automatic selection of maximum lags
Automatic lag length selection based on SIC: 0
Newey-West automatic bandwidth selection and Bartlett kernel
Balanced observations for each test Cross-
Method Statistic Prob.** sections Obs
Null: Unit root (assumes common unit root process)
Levin, Lin & Chu t* -13.0836 0.0000 15 90
Null: Unit root (assumes individual unit root process)
Im, Pesaran and Shin W-stat -5.20709 0.0000 15 90
ADF - Fisher Chi-square 89.5665 0.0000 15 90
PP - Fisher Chi-square 130.548 0.0000 15 90
** Probabilities for Fisher tests are computed using an asymptotic Chi
-square distribution. All other tests assume asymptotic normality.
International Journal of Scientific Engineering and Science Volume 5, Issue 11, pp. 33-45, 2021. ISSN (Online): 2456-7361
40
http://ijses.com/
All rights reserved
Panel unit root test: Summary
Series: EPS
Date: 10/14/21 Time: 10:16
Sample: 2012 2019
Exogenous variables: Individual effects
Automatic selection of maximum lags
Automatic lag length selection based on SIC: 0 to 1
Newey-West automatic bandwidth selection and Bartlett kernel
Cross-
Method Statistic Prob.** sections Obs
Null: Unit root (assumes common unit root process)
Levin, Lin & Chu t* -3.24175 0.0006 15 98
Null: Unit root (assumes individual unit root process)
Im, Pesaran and Shin W-stat -0.15331 0.4391 15 98
ADF - Fisher Chi-square 43.5538 0.0523 15 98
PP - Fisher Chi-square 29.1800 0.5082 15 105
** Probabilities for Fisher tests are computed using an asymptotic Chi
-square distribution. All other tests assume asymptotic normality.
Panel unit root test: Summary
Series: DPS
Date: 10/14/21 Time: 10:17
Sample: 2012 2019
Exogenous variables: Individual effects
Automatic selection of maximum lags
Automatic lag length selection based on SIC: 0 to 1
Newey-West automatic bandwidth selection and Bartlett kernel Cross-
Method Statistic Prob.** sections Obs
Null: Unit root (assumes common unit root process)
Levin, Lin & Chu t* -4.85807 0.0000 14 97
Null: Unit root (assumes individual unit root process)
Im, Pesaran and Shin W-stat -0.77181 0.2201 14 97
ADF - Fisher Chi-square 37.4229 0.1098 14 97
PP - Fisher Chi-square 55.6389 0.0014 14 98
** Probabilities for Fisher tests are computed using an asymptotic Chi
-square distribution. All other tests assume asymptotic normality.
Panel unit root test: Summary
Series: D(DPS)
Date: 10/14/21 Time: 10:17
Sample: 2012 2019
Exogenous variables: Individual effects
Automatic selection of maximum lags
Automatic lag length selection based on SIC: 0
Newey-West automatic bandwidth selection and Bartlett kernel
Balanced observations for each test
Cross-
Method Statistic Prob.** sections Obs
Null: Unit root (assumes common unit root process)
Levin, Lin & Chu t* -10.2440 0.0000 14 84
Null: Unit root (assumes individual unit root process)
Im, Pesaran and Shin W-stat -3.08101 0.0010 14 84
ADF - Fisher Chi-square 65.0711 0.0001 14 84
PP - Fisher Chi-square 86.9783 0.0000 14 84 ** Probabilities for Fisher tests are computed using an asymptotic Chi

International Journal of Scientific Engineering and Science Volume 5, Issue 11, pp. 33-45, 2021. ISSN (Online): 2456-7361
41
http://ijses.com/
All rights reserved
-square distribution. All other tests assume asymptotic normality.
Panel unit root test: Summary
Series: FS
Date: 10/14/21 Time: 10:17
Sample: 2012 2019
Exogenous variables: Individual effects
Automatic selection of maximum lags
Automatic lag length selection based on SIC: 0 to 1
Newey-West automatic bandwidth selection and Bartlett kernel Cross-
Method Statistic Prob.** sections Obs
Null: Unit root (assumes common unit root process)
Levin, Lin & Chu t* -15.2490 0.0000 15 101
Null: Unit root (assumes individual unit root process)
Im, Pesaran and Shin W-stat -2.62903 0.0043 15 101
ADF - Fisher Chi-square 57.7745 0.0017 15 101
PP - Fisher Chi-square 54.2819 0.0043 15 105
** Probabilities for Fisher tests are computed using an asymptotic Chi
-square distribution. All other tests assume asymptotic normality.
Panel unit root test: Summary
Series: LV
Date: 10/14/21 Time: 10:18
Sample: 2012 2019
Exogenous variables: Individual effects
Automatic selection of maximum lags
Automatic lag length selection based on SIC: 0 to 1
Newey-West automatic bandwidth selection and Bartlett kernel
Cross-
Method Statistic Prob.** sections Obs
Null: Unit root (assumes common unit root process)
Levin, Lin & Chu t* -5.53436 0.0000 15 102
Null: Unit root (assumes individual unit root process)
Im, Pesaran and Shin W-stat -1.55432 0.0601 15 102
ADF - Fisher Chi-square 45.3006 0.0362 15 102
PP - Fisher Chi-square 48.7407 0.0167 15 105 ** Probabilities for Fisher tests are computed using an asymptotic Chi
-square distribution. All other tests assume asymptotic normality.
Panel unit root test: Summary
Series: LOGPAT
Date: 10/14/21 Time: 10:18
Sample: 2012 2019
Exogenous variables: Individual effects
Automatic selection of maximum lags
Automatic lag length selection based on SIC: 0 to 1
Newey-West automatic bandwidth selection and Bartlett kernel
Cross-
Method Statistic Prob.** sections Obs
Null: Unit root (assumes common unit root process)
Levin, Lin & Chu t* -5.46650 0.0000 14 93
Null: Unit root (assumes individual unit root process)
Im, Pesaran and Shin W-stat -2.13178 0.0165 14 93
ADF - Fisher Chi-square 52.6821 0.0032 14 93
PP - Fisher Chi-square 39.7542 0.0695 14 98
International Journal of Scientific Engineering and Science Volume 5, Issue 11, pp. 33-45, 2021. ISSN (Online): 2456-7361
42
http://ijses.com/
All rights reserved
** Probabilities for Fisher tests are computed using an asymptotic Chi
-square distribution. All other tests assume asymptotic normality.
Cointegration Test
Kao Residual Cointegration Test
Series: LOGMPS EPS DPS FS LV LOGPAT
Date: 10/14/21 Time: 10:20
Sample: 2012 2019
Included observations: 120
Null Hypothesis: No cointegration
Trend assumption: No deterministic trend
Automatic lag length selection based on SIC with a max lag of 1
Newey-West automatic bandwidth selection and Bartlett kernel t-Statistic Prob.
ADF -2.533460 0.0056 Residual variance 0.052125
HAC variance 0.040905
Augmented Dickey-Fuller Test Equation
Dependent Variable: D(RESID)
Method: Least Squares
Date: 10/14/21 Time: 10:20
Sample (adjusted): 2013 2019
Included observations: 105 after adjustments Variable Coefficient Std. Error t-Statistic Prob.
RESID(-1) -0.671037 0.090389 -7.423869 0.0000
R-squared 0.344625 Mean dependent var -0.012013
Adjusted R-squared 0.344625 S.D. dependent var 0.232956
S.E. of regression 0.188590 Akaike info criterion -0.489003
Sum squared resid 3.698889 Schwarz criterion -0.463727
Log likelihood 26.67266 Hannan-Quinn criter. -0.478761
Durbin-Watson stat 1.388018
Model Result
Dependent Variable: LOGMPS
Method: Panel Least Squares
Date: 10/14/21 Time: 10:24
Sample: 2012 2019
Periods included: 8
Cross-sections included: 15
Total panel (balanced) observations: 120
Variable Coefficient Std. Error t-Statistic Prob.
C -2.377069 0.627129 -3.790397 0.0002
EPS 0.036699 0.016568 2.215119 0.0287
DPS 0.008842 0.017488 0.505602 0.6141
FS 0.328084 0.062264 5.269289 0.0000
LV -0.005902 0.015330 -0.385006 0.7010
LOGPAT 0.006716 0.015333 0.438003 0.6622
R-squared 0.562906 Mean dependent var 1.276496
Adjusted R-squared 0.543735 S.D. dependent var 0.750259
S.E. of regression 0.506780 Akaike info criterion 1.527227
Sum squared resid 29.27817 Schwarz criterion 1.666602
Log likelihood -85.63365 Hannan-Quinn criter. 1.583828
F-statistic 29.36269 Durbin-Watson stat 0.298296
Prob(F-statistic) 0.000000

International Journal of Scientific Engineering and Science Volume 5, Issue 11, pp. 33-45, 2021. ISSN (Online): 2456-7361
43
http://ijses.com/
All rights reserved
Dependent Variable: LOGMPS
Method: Panel Least Squares
Date: 10/14/21 Time: 10:24
Sample: 2012 2019
Periods included: 8
Cross-sections included: 15
Total panel (balanced) observations: 120 Variable Coefficient Std. Error t-Statistic Prob.
C -0.524150 1.051373 -0.498538 0.6193
EPS 0.005595 0.008007 0.698749 0.4865
DPS 0.004940 0.007463 0.661934 0.5097
FS 0.161496 0.098410 1.641053 0.1042
LV -0.003016 0.007407 -0.407239 0.6848
LOGPAT 0.008870 0.008230 1.077799 0.2839
Effects Specification
Cross-section fixed (dummy variables)
Period fixed (dummy variables)
R-squared 0.944377 Mean dependent var 1.276496
Adjusted R-squared 0.928826 S.D. dependent var 0.750259
S.E. of regression 0.200158 Akaike info criterion -0.184316
Sum squared resid 3.725863 Schwarz criterion 0.442870
Log likelihood 38.05896 Hannan-Quinn criter. 0.070387
F-statistic 60.72911 Durbin-Watson stat 1.245650
Prob(F-statistic) 0.000000
Dependent Variable: LOGMPS
Method: Panel EGLS (Cross-section random effects)
Date: 10/14/21 Time: 10:24
Sample: 2012 2019
Periods included: 8
Cross-sections included: 15
Total panel (balanced) observations: 120
Swamy and Arora estimator of component variances
Variable Coefficient Std. Error t-Statistic Prob. C 0.206163 0.838468 0.245880 0.8062
EPS 0.012269 0.008513 1.441277 0.1522
DPS 0.000773 0.008006 0.096520 0.9233
FS 0.082193 0.077258 1.063884 0.2896
LV 0.001915 0.007619 0.251421 0.8019
LOGPAT 0.019206 0.008686 2.211092 0.0290
Effects Specification
S.D. Rho Cross-section random 0.480287 0.8181
Idiosyncratic random 0.226436 0.1819
Weighted Statistics
R-squared 0.113139 Mean dependent var 0.209878
Adjusted R-squared 0.074242 S.D. dependent var 0.246042
S.E. of regression 0.236733 Sum squared resid 6.388837
F-statistic 2.908661 Durbin-Watson stat 1.005509
Prob(F-statistic) 0.016490 Unweighted Statistics

International Journal of Scientific Engineering and Science Volume 5, Issue 11, pp. 33-45, 2021. ISSN (Online): 2456-7361
44
http://ijses.com/
All rights reserved
R-squared 0.298147 Mean dependent var 1.276496
Sum squared resid 47.01271 Durbin-Watson stat 0.136645
Correlated Random Effects - Hausman Test
Equation: Untitled
Test cross-section random effects
Test Summary Chi-Sq. Statistic Chi-Sq. d.f. Prob.
Cross-section random 15.603994 5 0.0081
Cross-section random effects test comparisons:
Variable Fixed Random Var(Diff.) Prob.
EPS 0.007665 0.012269 0.000002 0.0028 DPS 0.000381 0.000773 0.000000 0.3103
FS -0.025201 0.082193 0.001927 0.0144
LV 0.003342 0.001915 0.000001 0.1459 LOGPAT 0.015662 0.019206 0.000005 0.1139
Cross-section random effects test equation: Dependent Variable: LOGMPS
Method: Panel Least Squares
Date: 10/14/21 Time: 10:25 Sample: 2012 2019
Periods included: 8
Cross-sections included: 15 Total panel (balanced) observations: 120
Variable Coefficient Std. Error t-Statistic Prob.
C 1.380425 0.956997 1.442454 0.1523
EPS 0.007665 0.008651 0.885978 0.3778 DPS 0.000381 0.008015 0.047482 0.9622
FS -0.025201 0.088860 -0.283609 0.7773
LV 0.003342 0.007682 0.435109 0.6644 LOGPAT 0.015662 0.008971 1.745781 0.0839
Effects Specification
Cross-section fixed (dummy variables)
R-squared 0.923454 Mean dependent var 1.276496
Adjusted R-squared 0.908911 S.D. dependent var 0.750259
S.E. of regression 0.226436 Akaike info criterion 0.018300 Sum squared resid 5.127313 Schwarz criterion 0.482882
Log likelihood 18.90198 Hannan-Quinn criter. 0.206969
F-statistic 63.49522 Durbin-Watson stat 1.249486 Prob(F-statistic) 0.000000
Wald Test:
Equation: Untitled
Test Statistic Value df Probability
International Journal of Scientific Engineering and Science Volume 5, Issue 11, pp. 33-45, 2021. ISSN (Online): 2456-7361
45
http://ijses.com/
All rights reserved
F-statistic 636.9443 (6, 100) 0.0000
Chi-square 3821.666 6 0.0000
Null Hypothesis: C(1)=0,C(2)=0,C(3)=0,C(4)=0,C(5)=0,C(
6)=0
Null Hypothesis Summary:
Normalized Restriction (= 0) Value Std. Err.
C(1) 1.380425 0.956997
C(2) 0.007665 0.008651
C(3) 0.000381 0.008015 C(4) -0.025201 0.088860
C(5) 0.003342 0.007682
C(6) 0.015662 0.008971
Restrictions are linear in coefficients.
Residual Cross-Section Dependence Test Null hypothesis: No cross-section dependence (correlation) in
Residuals
Equation: Untitled Periods included: 8
Cross-sections included: 15
Total panel observations: 120 Note: non-zero cross-section means detected in data
Cross-section means were removed during computation of
Correlations
Test Statistic d.f. Prob.
Breusch-Pagan LM 205.7661 105 0.0000
Pesaran scaled LM 5.918423 0.0000
Pesaran CD 5.205472 0.0000