Embed Size (px)
Citation preview

Journal of the American Society of Nephrology 1571
Determinants of Glomerular Hypofiltration in NephroticPatients With Minimal Change Nephropathy1
Antonio Guasch and Bryan D. Myers2
A. Guasch, B.D. Myers, Stanford University School of
Medicine, Division of Nephroiogy, Stanford, CA
(J. Am. Soc. Nephrol. 1994; 4:1571-1581)
ABSTRACTPhysiologic and morphologic techniques were used
to eluciate the determinants of the GFR in 25 ne-
phrotic patients with minimal change nephropathy.
They were divided into two groups according to thefinding of either a normal (Group 1, N = 13) or adepressed (Group 2, N = 12) inulln clearance. RPF,afferent oncotic pressure, and dextran sieving coef-ficients were determined. Mathematical models ofgbomerular ultrafiltration were then used to compute
likely upper bounds for the ultrafiltration coefficient
and pore area/length ratio (a measure of pore den-sity). The upper bounds for each measure of intrinsicultrafiltration capacity were depressed below esti-mated normal values in healthy controls by 55 and47% in Group I patients and by 86 and 83% In Group2 patients with minimal change nephropathy. A cor-
responding excess of ultrafiltration pressure (versus
control), attributable solely to reduced intracapilbaryoncotic pressure, was by 10.8 and I 1.5 mm Hg,
respectively. Gbomerular morphometry revealed pe-ripheral capillary filtration surface area to be pre-
served in both minimal change nephropathy groups.However, a significant reduction in filtration slit fre-quency due to epithellal podocyte broadening cor-related with the computed ultrafiltration coefficientacross the two minimal change nephropathy groups
(r= 0.65; P< 0.001). It was concluded that podocyte
deformation invariably lowers the ultrafiltration coef-
ficient and pore area/length ratio in minimal change
nephropathy but that an offsetting reduction in intra-
capillary oncotic pressure prevents the GFR from
declining in many cases. However, the models pre-sented here predict that the depression of capillary
I Received January 26. 1993. Accepted September 6. 1993.2 Correspondence to Dr. B.D. Myers. Stanford UnIversity School of Medicine.
Division of Nephrology-Room 5-069. 300 Pasteur Drive, Stanford, CA 94305.
1046’6673/0408�157 I $030010Journal of the American Society of NephrologyCopyright C 1994 by the Arnedcan SOCIetY of Nephrology
oncotic pressure Is insufficient to compensate when
the ultrafiltration coefficIent is lowered by substan-
tially more than half and that it is In this circumstancethat minimal change nephropathy is most likely tobe accompanied by glomerular hypofiltration.
Key Words: Filtration dynamics, glomerular oncotic pressure,ultrafiltration coefficient, dextran sieving, pore density, gb-
merubar morphometry
M inimal change nephropathy (MCN), a commoncause of the nephrotic syndrome, is widely
regarded as the most benign of nephrotic, gbomerubarInjuries. Although the massive proteinuria points to
severe disruption of the filtration barrier within thegbomerular capillary wall, most cases are responsiveto and completely reversed by immunosuppressivetherapy (1 ,2). Furthermore, the serum creatininelevel is usually maintained within the normal range,
suggesting that the rate of gbomerular ultrafiltration(GFR) remains rapid in this disorder (3).
Several laboratories, including our own, have usedthe clearance of inulin to accurately estimate theGFR in MCN. Despite normal levels of creatinine inserum, a substantial portion of cases was found toexhibit glomerubar hypofiltration (4-8). The depres-sion of GFR in MCN has, in fact, been sufficientlyprofound to precipitate acute renal failure (9). Thebatter complication has often been attributed to con-
traction of the effective blood volume (10). The dem-onstration in some cases of hyperreninemia (11,12)or coexistent ATN (9, 1 3, 1 4) appears to support a
hemodynamic mechanism for hypofibtration, one inwhich the gbomerular perfusion rate and, perhaps,
pressure are lowered.
Another potential mechanism for hypofiltration inMCN is a reduction in the intrinsic ultrafiltration
capacity of the glomerular capillary walls. Indeed,micropuncture studies of experimental models ofMCN in the rat have revealed depression of the gb-merular ultrafiltration coefficient (K1)-the productof the hydraulic permeability of the gbomerular cap-illary walls and the filtration surface area. In con-trast, the net pressure for ultrafiltration was dc-vated, suggesting that a low K1 can be uniquely re-sponsibbe for hypofibtration (1 5- 1 8). The fact that
this may also be true of human MCN is suggested bythe consistent demonstration in this disorder ofrestricted transglomerular sieving of uncharged dcx-
tran or polyvinylpyrrobidone macromolecules of in-
C’)
N.,
E
140 -
120
100
80 . AA
A AA A
60’ A
40
20. A AA AA
0-�10 20 30 40 50 60 70 80
Minimal Change Nephropathy
1572 Volume 4 #{149}Number 8 . 1994
termediate size (7,8, 1 9,20). Although this finding Isconsistent with a reduced Kf, a depression of thegbomerubar perfusion rate or pressure is predicted toresult in enhancement and not depression of the
transglomerular passage of uncharged macromole-cubes (21).
The purpose of this study was to explore the con-tribution of various determinants of GFR to hypofil-tration in MCN. To do this, we have estimated gb-merular flows, pregbomerular vascular pressures,and dextran sieving coefficients in 25 nephrotic in-dividuals whose gbomerubi exhibited only minimal orminor changes by bight microscopy. We then ana-
lyzed the findings with theoretical models of glomer-ular filtration in an effort to distinguish betweenpossible contributions by reduced ultrafiltration
pressure and diminished ultrafiltration capacity tothe prevailing GFR. To define the structural corre-bates of impaired ultrafiltration capacity, we also sub-
jected glomeruli obtained by needle biopsy of thekidney to a morphometric analysis.
METHODS
Patient Population
The subjects of our study were 25 adult patients
who presented consecutively to our clinic with a ne-phrotic syndrome and a histopathobogic diagnosis ofMCN. The latter was based on the electron micro-scopic demonstration of an isolated or disproportion-ate injury to glomerular epithelial cells, with simpli-fication and broadening of their podocytes. By lightmicroscopy, the gbomerubi appeared entirely normalor exhibited only minor changes (22). The most com-mon minor change was modest mesangial cell hyper-
plasia; this was observed in 14 biopsy cores. In twocases, an additional minor finding was the collapseof a single segment of an isolated gbomerular tuft (1
out of 20 and 37 gbomerubi, respectively). In neithercase was the segmental collapse accompanied by anaccumulation of extracellular matrix or hyaline ma-terial. The patients varied widely in age (15 to 69 yr)’and 1 6 of 25 were male patients. In five instances,
the presenting nephrotic episode represented a re-lapse of MCN, which had been diagnosed by needlerenal biopsy 9 to 36 mo previously. The presentingepisode of nephrosis was the first for the remaining20 subjects.
One hundred one healthy volunteers underwent anidentical evaluation of gbomerular function and serve
as a control group. They spanned an age range (18 to80 yr) similar to that observed in the patients withMCN and were also predominantly men (64 of 101).All denied a history of renal disease, hypertension,and diabetes. At the time of evaluation, each wasfound to be normotensive and normoglycemic and tohave a negative dipstick test for urinary protein. The
relationship between GFR (inulin clearance) and agein the healthy volunteers was used to divide the
patient population with MCN into two groups (Figure
1). Group 1 was composed of 13 patients in whomthe age-adjusted GFR was within or above the normalrange; Group 2 was composed of the remaining 12subjects, in whom the age-adjusted GFR was de-pressed (Figure 1).
Physiologic Evaluation
Patients and volunteers consented to undergo dif-ferential solute clearances according to a protocolthat had been approved previously by the Institu-tional Review Board at the Stanford UniversitySchool of Medicine. Each was admitted to a clinicalresearch center on the morning of study. Antihyper-tensive agents were withdrawn 48 h before admis-sion in five patients with MCN who were receivingsuch therapy. Urine was voided spontaneously after
diuresis had been established with an oral water load(10 to 15 mL/kg). A priming dose of inulin (50 mgjkg) and para-aminohippuric acid (PAH; 12 ingJk�J
was then administered. In a subset of 19 volunteers(age 18 to 51 yr) and in 18 patients with MCN, thiswas followed by a priming infusion of dextran 40
(130 mg/kg per 10 mm). Dextran infusion was with-held in the remaining seven subjects with MCN be-cause each reported a previous episode of penicillinhypersensitivity, a phenomenon that we have foundto be predictive of anaphylactoid reactions to dcx-tran. Thereafter, inulin and PM! were given by con-
tinuous infusion to maintain levels in plasma con-stant at 20 and 1 .5 mg/dL, respectively. Dextran 40was infused constantly at half the rate calculated forinulln.
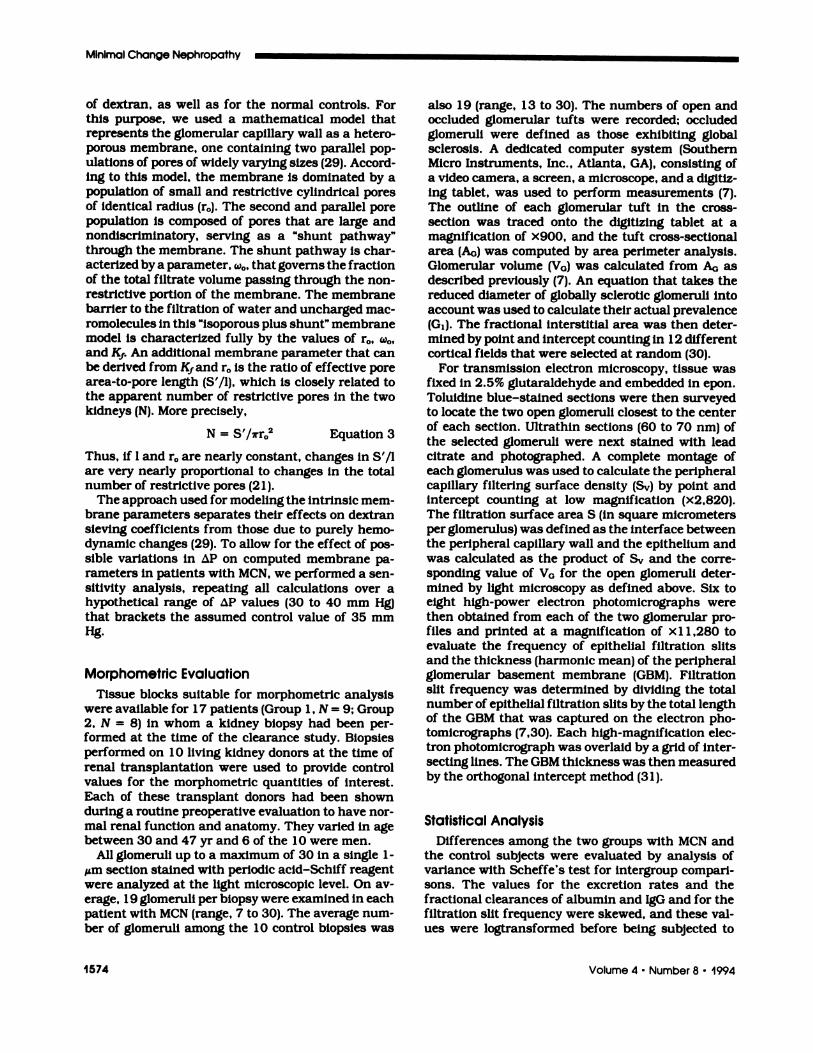
Age (years)
Figure 1. GFR In patients with MCN is plotted as a functionof age. The normal age-adjusted range (mean ± I SD perdecade) is based on determinations of Inulin clearance In101 healthy volunteers and is represented as a shadedband. Patients with MCN who fall either above or below ISD below the mean value have been assigned to Group I(circles) or 2 (triangles), respectively.

�E �#{176}�“ Hg
::::::::::::::::::::;;: mm Hg
40.
Lu
100�
80�
60�
40�
20�
01
Guasch and Myers
Journal of the American Society of Nephrology 1573
Sixty minutes after the priming infusion, arterial
blood pressure was determined and blood was sam-pled for an examination of plasma oncotic pressure(irA) and plasma protein concentration. Four timedurine collections were then made, each of which wasbracketed by a blood sample drawn from a peripheralvein. GFR was expressed as the average value for thefour timed inulin clearances. The rate of RPF wasestimated by dividing the corresponding clearance ofPAH by an estimate of the prevailing renal arterio-venous extraction ratio for PAH � We haveshown previously that reductions of GFR and peri-
tubular capillary protein concentration exert an ad-
ditive effect to lower EPAH in patients with gbomerulardisease (23). The relationship observed in that studybetween � and GFR, given either a normal or adepressed efferent arteriobar oncotic pressure (a sur-rogate measure for efferent protein concentration),is illustrated in Figure 2. It was used to select thevalue for � that was most representative for eachgroup. These were (to the first decimal place) 0.9 for
healthy controls and 0.8 and 0.7 for Groups 1 and 2MCN, respectively.
The filtration fraction (FF) was calculated by divid-ing the GFR by the estimated RPF. The efferentoncotic pressure (7E) was calculated by use of theequation
7�E 1t�A/(1 - FF) Equation 1
Equation 1 assumes that the removal of water byultrafiltration results in a linear increase in oncoticpressure as plasma flows axially along the gbomerubarcapillaries (24). Fractional dextran clearances (OD)
20 40 60 80 100 120 140
GFR (mi/mm/i .73 m2)
Figure 2. RelationshIp between � and GFR, given a normal(upper) or depressed (lower) level of efferent oncotic pres-sure. This relationship has been derived from measuredvalues for each parameter in I 3 subJects with normal kid-neys and 33 patients with chronic glomerular injury (seereference 23).
were calculated with the equation:
OD (U/P)D/(U/P)�fl Equation 2
where (U/P)D and (U/P)� refer to the urine-to-mid-
point plasma concentration ratio of dextran and in-sulin, respectively.
The concentrations of inulin and PM! were deter-mined by the use of an automated assay (25). Con-centrations of dextran were assayed with anthrone
after the component molecules of dextran 40 in urineand deproteinized plasma were separated into 2 A
fractions by gel permeation chromatography withprecabibrated Ultragel AcA44 columns (LKB, Pleas-
ant Hill, CA). Concentrations of albumin and immu-nogbobulin G (IgG) in serum and urine were deter-
mined by immunochemical methods, which havebeen described in detail elsewhere (26). Plasma on-cotic pressure was measured directly with a Wescor
4400 membrane osmometer (Wescor Inc. , Logan,Utah). Serum and urinary creatinine bevels were de-
termined by a rate-dependent modification of theJaffe reaction, with a Beckman Creatinine Analyzer(Model 2; Beckman Instruments, Fullerton, CA).
Theoretical Analysis of Filtration Data
A mathematical model for the gbomerubar filtrationof water (27) was used to calculate K�, which is de-fined in this study as the product of gbomerular hy-draulic permeability and the total filtration surfacearea of all gbomerular capillaries in the two humankidneys. The input values for the model included themeasured values of GFR, RPF, and IrA and an as-sumed value for the glomerular transcapillary hy-draubic pressure difference (�.P). The latter quantitycannot be measured directly in humans. However,using an indirect curve-fitting technique, we haveestimated that �P approximates 35 mm Hg in thehealthy human kidney and have assigned this valueto the control and each MCN group in this study (28).Micropuncture determinants in rodent analogs ofMCN indicate that �P can be elevated but is neverdepressed in this form of gbomerular injury (15-18).Given that human MCN is accompanied by arterialhypertension (vide infra), it is probable that a frac-tion of the increment in arterial pressure is trans-mitted into the gbomerular capillaries and that �P is
likely, if anything, to be elevated. Thus, an assump-tion that �P in MCN is the same as in healthy controlsis a conservative one and should provide an upper
bound for the prevailing bevel of K� in this disorder(27). We have accordingly designated the latter com-putation in MCN as “maximum” K� (K��).
We also used sieving profiles of uncharged andnonreabsorbabbe dextrans of broad size distributionto compute additional membrane parameters for the18 individuals with MCN who received an infusion
Minimal Change Nephropathy
1574 Volume 4 #{149}Number 8 ‘ 1994
of dextran, as well as for the normal controls. Forthis purpose, we used a mathematical model thatrepresents the glomerular capillary wall as a hetero-
porous membrane, one containing two parallel pop-ulations of pores of widely varying sizes (29). Accord-ing to this model, the membrane is dominated by a
population of small and restrictive cylindrical poresof identical radius (r0). The second and parallel porepopulation is composed of pores that are large andnondiscriminatory, serving as a �‘shunt pathway”through the membrane. The shunt pathway is char-acterized by a parameter, w�, that governs the fraction
of the total filtrate volume passing through the non-restrictive portion of the membrane. The membranebarrier to the filtration of water and uncharged mac-romolecules in this “isoporous plus shunt” membranemodel is characterized fully by the values of r0, w,�,
and K�. An additional membrane parameter that canbe derived from K� and r0 is the ratio of effective porearea-to-pore length (S’/l), which is closely related tothe apparent number of restrictive pores in the twokidneys (N). More precisely,
N = S’/irr02
Thus, if 1 and r0 are nearly constant, changes in S’/l
are very nearly proportional to changes in the totalnumber of restrictive pores (21).
The approach used for modeling the intrinsic mem-
brane parameters separates their effects on dextransieving coefficients from those due to purely hemo-dynamic changes (29). To allow for the effect of pos-
sible variations in �P on computed membrane pa-rameters in patients with MCN, we performed a sen-sitivity analysis, repeating all calculations over ahypothetical range of �P values (30 to 40 mm Hg)
that brackets the assumed control value of 35 mm
Hg.
Morphometric Evaluation
Tissue blocks suitable for morphometric analysiswere available for 1 7 patients (Group 1 , N = 9; Group2, N = 8) in whom a kidney biopsy had been per-formed at the time of the clearance study. Biopsiesperformed on 1 0 living kidney donors at the time of
renal transplantation were used to provide controlvalues for the morphometric quantities of interest.
Each of these transplant donors had been shownduring a routine preoperative evaluation to have nor-mal renal function and anatomy. They varied in agebetween 30 and 47 yr and 6 of the 10 were men.
All gbomeruli up to a maximum of 30 in a single 1-�m section stained with periodic acid-Schiff reagentwere analyzed at the light microscopic level. On av-
erage, 1 9 gbomeruli per biopsy were examined in eachpatient with MCN (range, 7 to 30). The average num-
ber of glomeruli among the 1 0 control biopsies was
also 19 (range, 13 to 30). The numbers of open andoccluded gbomerular tufts were recorded; occludedglomeruli were defined as those exhibiting globalsclerosis. A dedicated computer system (SouthernMicro Instruments, Inc. , Atlanta, GA), consisting ofa video camera, a screen, a microscope, and a digitiz-ing tablet, was used to perform measurements (7).The outline of each gbomerular tuft in the cross-
section was traced onto the digitizing tablet at amagnification of x900, and the tuft cross-sectionalarea (A0) was computed by area perimeter analysis.
Gbomerular volume (VG) was calculated from A� asdescribed previously (7). An equation that takes thereduced diameter of globally sclerotic gbomeruli into
account was used to calculate their actual prevalence(G1). The fractional interstitial area was then deter-mined by point and intercept counting in 1 2 differentcortical fields that were selected at random (30).
For transmission electron microscopy, tissue wasfixed in 2.5% glutaraldehyde and embedded in epon.Toluidine blue-stained sections were then surveyedto locate the two open gbomeruli closest to the centerof each section. Ultrathin sections (60 to 70 nm) of
Equation 3the selected gbomeruli were next stained with leadcitrate and photographed. A complete montage ofeach gbomerulus was used to calculate the peripheralcapillary filtering surface density (Sw) by point andintercept counting at low magnification (x2,820).The filtration surface area S (in square micrometersper gbomerulus) was defined as the interface betweenthe peripheral capillary wall and the epithelium andwas calculated as the product of S�, and the corre-
sponding value of V0 for the open gbomeruli deter-mined by light microscopy as defined above. Six toeight high-power electron photomicrographs were
then obtained from each of the two gbomerular pro-files and printed at a magnification of x 1 1 ,280 toevaluate the frequency of epithelial filtration slitsand the thickness (harmonic mean) of the peripheralgbomerular basement membrane (GBM). Filtrationslit frequency was determined by dividing the totalnumber of epithelial filtration slits by the total lengthof the GBM that was captured on the electron pho-tomicrographs (7,30). Each high-magnification dcc-tron photomicrograph was overlaid by a grid of inter-
secting lines. The GBM thickness was then measured
by the orthogonal intercept method (31).
Statistical Analysis
Differences among the two groups with MCN andthe control subjects were evaluated by analysis ofvariance with Scheffe’s test for intergroup compari-
sons. The values for the excretion rates and thefractional clearances of albumin and IgG and for thefiltration slit frequency were skewed, and these val-ucs were bogtransformed before being subjected to

Guasch and Myers
Journal of the American Society of Nephrology 1575
analysis of variance. Results are expressed as themean ± SE, except for those mentioned above withnon-Gaussian distributions, which are presented as
the median value and the range.
RESULTS
Clinical Features and Proteinuria
The patients of Group 2, in whom MCN was accom-panied by the depression of GFR, were significantlyolder than those of Group 1 . The respective medianages were 54 (range, 15 to 69) and 27 (range, 18 to62). The excretion rates and circulating levels ofalbumin and IgG were similar in the two groups(Table 1). The fact that glomerular permeability to
albumin and IgG was nevertheless greater in Group2 than in Group 1 MCN is suggested by the signifi-cantly higher values for the fractional clearance of
each protein (Table 1).
GFR and Determinants
The depressed GFR according to which Group 2MCN was selected averaged 46 ± 7 mL/min per 1.73m2, versus a corresponding level of 106 ± 3 in Group
TABLE I . Renal handling of proteina
1 MCN. Hypofiltration in Group 2 was associated witha higher serum creatinine level than in Group 1
subjects, 1 .47 ± 0.22 versus 0.80 ± 0.05, respectively
(P < 0.001). The two groups of patients also differedin that RPF was significantly lower in Group 2, 393± 68 versus 731 ± 44 mL/min per 1 .73 m2, respec-
tiveby (P < 0.001). Comparison to the controls revealsRPF to have been selectiveby elevated in Group 1 MCNand depressed less than in proportion to GFR inGroup 2 MCN (Table 2). As a result, the FF wassimilarly depressed in the two MCN groups, 0. 1 5 ±
0.01 and 0. 13 ± 0.02, respectively, versus 0. 19 ±0.01 mm Hg in controls.
In keeping with their hypoalbuminemia, TA wassimilarly depressed in Groups 1 and 2 MCN, 14.3 ±1 .0 and 1 3.4 ± 1 .7 mm Hg, respectively, versus acontrol value of 24.0 ± 0.2 mm Hg. Reflecting thelow FF, �‘E was even more subnormal than �A in eachgroup (Table 2). Averaging TA and TE in each individ-
ual, we estimate that the mean intraluminal oncotic
pressure (TOC) was depressed below the control valueby 10.8 and 1 1.5 mm Hg, on average, in Groups 1and 2 MCN, respectively (Figure 3). Because � isthe force opposing filtrate formation, this finding onits own should lead to an increase and not a decreasein GFR or FF in MCN. The mean arterial pressure
Controls Group I MCN(N= 101) (N= 13)
Group 2 MCN(N= 12)
AlbuminExcretionRate 6b 4,364c 3,778c(,�g/mIn) (2-32) (1 ,277-8,910) (1,920-12,684)
lgG Excretion Rate (�g/ 1b 93C I 88Cmin) , (0.1-4) (22-672)
Serum Albumin Concn 47 ± 1b 19 ± 2C(55-1,076)16 ± 3C
(g/l)Serum lgG Concn (g/l) 9.4 ± 0#{149}8b 5.4 ± 0.9c 4.5 ± 0.9c0 Albumin (x105) 03b 212C 827d
(0.1-1) (79-584) (78-8,880)0 IgG (x105) 1.3b 30C 268d
(1-4) (5-63) (7-9,367)
a Mean or median values that are not different are designated with the same letter (b. c. or d).
. Values are median (range). 0. fractional clearance.
TABLE 2. Determinants of GFR#{176}
Control Group I MCN Group 2 MCN(N= 101) (N= 13) (N= 12)
RPF (mi/mm per 1.73 m2) 549 ± 12b 731 ± 44C 393 ± 68dFF 0.19 ± 0#{149}01b o�f5 ± 0.OIC 0.13 ± 0.02cMean Arterial Pressure (mm Hg) 90 ± 1b 95 ± 5b 108 ± 4C
irA (mm Hg) 24.0 ± 0.2b 14.3 ± I.0c 13.4 ± 1.7cIrE (mm Hg) 29.6 ± 0.3b 17.5 ± f9C 17.0 ± 2.5c
0 Mean values that are not dIfferent are desIgnated with the same letter (b. c. or d).

0
U)U)0
0.
U
0C)C
0
CU
0.CU
0
CU
0
E0
0)
I
EE
C.)
40
35
30
25
20
15
10
5
�*-p=NS -�
� � *
35
30
25
20
15
10
5
EC’)
CUI
EE
E
E P1
Controls Group 1 MCN Group 2 MCN
*
Controls Group 1 MCN Group 2 MCN
Minimal Change Nephropathy
1576 Volume 4 ‘ Number 8 ‘ 1994
* P<O.05 vs Controls
Figure 3. Quartile box plots of computed glomerular capil-la� oncotic pressure (�) in healthy controls (left) and inthe two groups of patients with MCN (middle and right). Thehorizontal lines are the 25th, 50th, and 75th percentiles,and the vertical lines are the rest of the range. NS, notsignificant.
tended to exceed the control value in each group ofpatients with MCN, with the average excess of 18mm Hg reaching statistical significance in Group 2.This makes it likely that �P was also elevated inMCN, particularly in Group 2. On the basis of theconservative assumption of an equivalent value for
�P of 35 mm Hg in controls and each MCN group, wecompute the likely upper bound for K� (Kjm��) to bedepressed below the corresponding control value by55 and 86% on average in Group 1 and 2 MCN,respectively (Figure 4). As illustrated in Figure 4,there was little overlap of the individual values for
Kjmax among the three groups of subjects. Thus, ac-cording to this theoretical analysis, a K�boweringeffect of MCN in Group 1 is offset by the elevation ofRPF and the depression of �rA, with the result that
GFR is maintained in the normal range. In Group 2MCN, however, a more profound lowering of K� com-bines with a modest depression of RPF to lower GFR.notwithstanding the offsetting depression of irA.
Other Intrinsic Membrane Properties ofthe Glomerular Capillary Wall
The configuration of the sieving profile for dextran
molecules in the 26 to 60 A radius interval was
* p<0.05 vs Controls
t P<O.05 vs Group 1 MCN
Figure 4. QuartIle box plots of the computed upper boundfor K,(K,�) In controls (left) and Group I (middle) or Group2 (right) patients with MCN. A �P value of 35 mm Hg hasbeen assumed for K, calculations in all three groups.
similarly altered from control in each group of pa-tients with MCN (Figure 5). Sieving coefficients at the
bow radius end of the MCN profiles were markedlydepressed, whereas sieving coefficients for the larg-est dextran molecules examined were elevated. The
Group 2 MCN sieving profile differed from that inGroup 1 MCN in that it intersected the control profileat a lower radius (50 versus 58 A) and in that therewas greater enhancement of the passage of the larg-est dextrans examined (Figure 5).
The use of the isoporous plus shunt membranemodel to integrate the dextran sieving profiles reveals
a similar alteration of membrane-pore structure ineach MCN group (Table 3). Both pore density (S’/l)and restrictive pore radius were markedly reduced in
MCN. In contrast, as judged by the substantial en-
hancement of � shuntlike pores were, respectively,1 0- and 3-fold more prominent in Groups 2 and 1MCN than in controls.
Linear regression analysis revealed w� to be corre-
bated with the fractional clearances of both albumin(r = 0.70; P < 0.001) and IgG (r = 0.71; P < 0.001),suggesting that the impairment of barrier size selec-
tivity contributes to proteinuria. Further, w�, and S’/lwere inversely related (r = -0.70; P < 0.01). Thus,the greater membrane dysfunction seen in Group 2
than in Group 1 appears to reflect a greater reduction
1
0.1
0.01
0.001
0C
CU
0
C)C
CU
x0
CUC00
CU
U-
20
18
16
14
12
K�
(m�m#{252}�.mmHg�1 .73)
2
25 30 35 40 45 50 55 60 65
*
*
Guasch and Myers
Journal of the American Society of Nephrology 1577
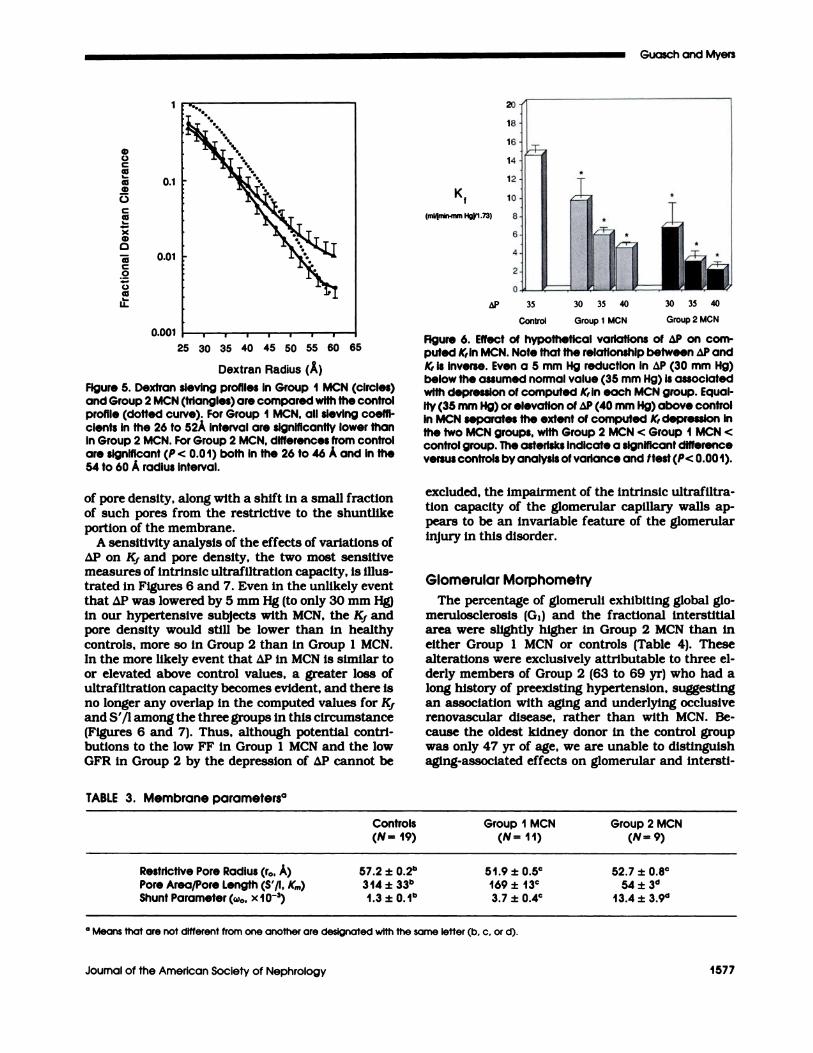
Dextran Radius (A)Figure 5. Dextran sieving profiles in Group I MCN (circles)and Group 2 MCN (triangles) are compared with the controlprofile (dotted curve). For Group I MCN, all sieving coeffi-dents In the 26 to 52A interval are significantly lower thanin Group 2 MCN. For Group 2 MCN, differences from controlare significant (P < 0.01) both in the 26 to 46 A and in the54 to 60 A radius interval.
of pore density, along with a shift in a small fractionof such pores from the restrictive to the shuntlike
portion of the membrane.A sensitivity analysis of the effects of variations of
�P on K� and pore density, the two most sensitivemeasures of intrinsic ultrafiltration capacity, is illus-trated in Figures 6 and 7. Even in the unlikely eventthat �P was lowered by 5 mm Hg (to only 30 mm Hg)in our hypertensive subjects with MCN, the K� andpore density would still be lower than in healthycontrols, more so in Group 2 than in Group 1 MCN.In the more likely event that �P in MCN is similar toor elevated above control values, a greater loss ofultrafiltration capacity becomes evident, and there isno longer any overlap in the computed values for K�
and S’/l among the three groups in this circumstance(Figures 6 and 7). Thus, although potential contri-butions to the low FF in Group 1 MCN and the lowGFR in Group 2 by the depression of �P cannot be
L�P 35 30 35 40 30 35 40
Control Group 1 MCN Group 2 MCN
Figure 6. Effect of hypothetical variations of �P on com-puted K,in MCN. Note that the relationship between �P andK, is inverse. Even a 5 mm Hg reduction in �P (30 mm Hg)below the assumed normal value (35 mm Hg) is associatedwith depression of computed K,in each MCN group. Equal-ity (35 mm Hg) or elevation of �P (40 mm Hg) above controlin MCN separates the extent of computed K, depression inthe two MCN groups, with Group 2 MCN < Group I MCN <
control group. The asterisks indicate a significant differenceversus controls by analysis ofvariance and ttest(P< 0.001).
excluded, the impairment of the intrinsic ultrafiltra-
tion capacity of the gbomerular capillary walls ap-pears to be an invariable feature of the gbomerularinjury in this disorder.
Glomerular Morphometry
The percentage of glomeruli exhibiting global gb-
meruboscberosis (G1) and the fractional interstitialarea were slightly higher in Group 2 MCN than ineither Group 1 MCN or controls (Table 4). These
alterations were exclusively attributable to three el-derby members of Group 2 (63 to 69 yr) who had along history of preexisting hypertension, suggesting
an association with aging and underlying occlusiverenovascular disease, rather than with MCN. Be-cause the oldest kidney donor in the control group
was only 47 yr of age, we are unable to distinguishaging-associated effects on gbomerular and intersti-
TABLE 3. Membrane parametersa
Controls(N= 19)
Group I MCN(N= 11)
Group 2 MCN(N=9)
Restrictive Pore Radius (r0, A) 57.2 ± 0.2b 51.9 ± 0.5c 52.7 ± 0.8cPore Area/Pore Length (S’/l, Km) 314 ± 33b 169 ± 13C 54 ± 3d
Shunt Parameter(w0, x103) 1.3 ± 0#{149}1b 37 ± 0.4c 13.4 ± 3,90
a Means that are not different from one another are designated with the same letter (b. c. or d).

400
350
300
250
S,Il‘I 200
(km)I 50
100
50
0
#{163}�P 35 30 35 40 30 35 40
Control Group 1 MCN Group 2 MCN
Figure 7. Effect of hypothetical variations of �P on com-puted pore density (S’/l) In MCN patients who receiveddextran: Group 1, N= 10; Group 2, N= 8. like K,(Flgure 6),the 5’/l is moderately depressed below control in Group Iand severely depressed in Group 2, regardless of whether� is depressed below (30 mm Hg), the same as (35 mmHg), or elevated above (40 mm Hg) the assumed controlvalues. The asterisks indicate a significant difference fromcontrols by analysis of variance with the Wilcoxon rank sumtest.
tial structure from those attributable to MCN per se
in these elderly individuals.The volume of patent gbomeruli tended to be larger
in MCN than in controls (Table 4). Thus, despite a
trend to lower filtration surface density (S� = 0. 1 3 ineach group versus 0. 1 5 in controls), the actual sur-face area of the interface between peripheral capil-lary walls and capillary lumen (5) was numericallylarger in both Groups 1 and 2 MCN than in the controlgroup, 279 ± 59 and 239 ± 19 versus 203 ± 23 �im2x 1 o�, respectively (Table 4). Given that the over-whebming majority of gbomeruli in patients with MCNwere patent, it follows that diminished hydraulic
permeability, rather than a boss of filtration surfacearea, might be implicated in the depression of cam-puted K� in this disorder.
Two structures along the filtration pathway thatinfluence hydraulic permeability are the GBM andthe interpodocytic diaphragms at the base of theepithelial filtration slits (32). The mean GBM thick-ness was 472 ± 35 nm in Group 1 and 459 ± 36 nmin Group 2 MCN, values that are not significantlydifferent from the control value of 388 ± 1 3 nm. Themost striking and the only statistically significantultrastructural alteration in MCN was a marked re-duction in filtration slit frequency, consequent uponthe broadening of the epithelial podocytes (Table 4).Of note, filtration slit frequency was more reducedin Group 2 than in Group 1 MCN patients, 307 ± 91versus 440 ± 39 slits/mm of GBM (P < 0.0 1 ; Table4). The logarithm of the filtration slit frequency wasrebated to the computed Kjmax across the two groupsof subjects with MCN (r = 0.65; P < 0.001 ; Figure 8).A weaker but significant correlation (not shown) wasalso observed between GFR and log filtration slitfrequency (r = 0.4; P < 0.01). Confounding effects of
C,)I.-
E�
1000
FSF(slits/mm PBM)
Figure 8. RelationshIp between K,,,,� and filtration slit fre-quency (FSF) across the two MCN groups. The solid line isthe regression line. PBM, peripheral GBM.
10 100
Minimal Change Nephropathy
1578 Volume 4 ‘ Number 8 . 1994
TABLE 4. Morphometric analyslsa
Controls(N=10)
Group I MCN(N=9)
Group 2 MCN(N=8)
Prevalence Globally Sclerosed Glomeruli (G1, %) 2 ± 1bf ± 1b 3 � 2b
Fractional Interstitial Area (%) 14.5 ± 1#{149}jb 12.5 ± 0.7b 18.1 ± 2.0cVolume Patent Glomeruli (V0. �m3 x 106) 1.37 ± 0#{149}14b 2.11 ± 043b 1.93 ± 0�j5b
Capillary Filtering Surface Area (5, �m2 x 10�) 203 ± 23b 279 ± 59b 239 ± 19b
Filtration Slit Frequency (slits/mm PBM length) I , 152b 4j jC 18 Id
GBM Thickness (nm)(1,523-1,016)
388 ± j3b
(616-292)472 ± 35b
(799-68)459 ± 36b
0 Means that are not different from one another are designated with the same letter (b. c. or d).
. Values are median (range).

Guasch and Myers
Journal of the American Society of Nephrology 1579
GFR determinants other than K1 could explain thestronger relationship between filtration slit fre-quency and � than between GFR and this mor-phometric measure of epithelial podocyte alterationinMCN.
Outcome of Glomerular Injury
Each patient with MCN was treated for 6 to 1 2 wkwith either prednisone or cycbosporine. Each memberof Group 1 exhibited a complete remission of protein-
uria. The proteinuria in 8 of the 1 2 members of Group2 also remitted completely in response to the abovetherapy. In each case, either the GFR or the serumcreatinine level was restored to normal after the pro-teinuria had remitted. One Group 2 patient with un-remitting proteinuria died of septicemia 3 wk after
the initiation of prednisone therapy. Proteinuriafailed to remit and GFR remained depressed after thecompletion of a full course of therapy in the remain-ing three nonresponders in Group 2. These includedthe two patients in whom the segmental collapse ofa single gbomerulus was observed in the biopsy (see
Methods) and who were aged 63 and 67 yr. respec-tiveby. Morphometric findings that distinguished
these two latter patients were the highest prevalenceof global gbomerulosclerosis (1 3 and 1 7%) and thelargest fractional interstitial areas (22 and 3 1 %) ob-served in this study. Thus, although we have attrib-uted these findings to unrelated occlusive renovas-cubar disease, we cannot exclude the possibility thattheir nephrotic illness was associated with focal andsegmental gbomerubosclerosis that was not detectedby our biopsy sample (22). There were no associateddiseases or unusual morphologic features in thefourth member of Group 2 who failed to respond to
therapy. This patient, a 20-yr-old woman, presentedwith a GFR of 18 mL/min per 1.73 m2 in June 1991and received treatment with first prednisone andthen cycbosporine for 3 mo each, but she has requireddialytic therapy for irreversible end-stage renal fail-ure since November 1991.
DISCUSSION
The finding in nephrotic patients of gbomeruli thatappear virtually normal by light microscopy was usedto diagnose MCN in this study. Among 25 consecutivepatients bearing this diagnosis, 12 were found tohave a depressed GFR. A morphometric analysis con-firmed that the overwhelming majority of gbomeruliwere patent and that the gbomerular capillary surfacearea available for filtration was preserved, if notslightly enhanced (Table 4). As stated previously, we
cannot exclude the possibility that three patients inGroup 2 whose proteinuria was unresponsive to a
full course of immunosuppression had undiagnosedfocal and segmental glomerubosclerosis. However,
our failure to detect any trace of this process in up toas many as 37 gbomeruli per patient makes it unlikelythat it could have been sufficiently extensive to sig-
nificantby compromise filtration surface area in theseindividuals. By exclusion, we infer that either re-
duced hydraulic permeability of glomerular capillarywalls or diminished ultrafiltration pressure (or somecombination of the two) must provide the basis for
the hypofiltration observed in this study (27).The net pressure for ultrafiltration represents the
imbalance between the gbomerular transcapibbary hy-
draulic pressure difference (h.P) and the opposing
oncotic pressure exerted by retained proteins asplasma transits axially along the glomerular capillar-ies (ir�). Although we were unable to determine thevalue for �P, our findings indicate that ir� must havebeen profoundly lowered in MCN. Not only was theoncotic pressure of plasma entering the gbomerulartuft (IrA) severely depressed, but the extent to whichintraluminal protein concentration, and hence on-cotic pressure, could rise during axial plasma flowwas severely limited by the low FF observed in thisdisorder (Table 2).
We have shown (24) that gbomerular capillary on-
cotic pressure in nephrotic humans rises in a linearfashion as water is removed by ultrafiltration; it fob-lows that ir�, the mean oncotic pressure prevailingalong the lumen of gbomerular capillaries, is thearithmetic mean of irA and irE. This estimate of ir�
was depressed in Groups 1 and 2 MCN to only 16.4± 1 .4 and 14.9 ± 2.0 mm Hg, respectively, versus acorresponding value of 27.7 ± 0.5 mm Hg in healthycontrols (Figure 3). A similar magnitude of ir� depres-
sion can be computed from the theoretical model ofgbomerubar ultrafiltration used in this study. Themodel calculates ir� from the intraluminal total pro-
tein concentration, which is predicted to increaseexponentially during axial plasma flow along the gb-merular capillaries (27). Dividing the GFR by thecomputed value for Kjm� yields the correspondingnet pressure for ultrafiltration in each group: 18.2 ±1 .3 and 20. 1 ± 2.0 mm Hg in Group 1 and 2 MCN,respectively, versus 8.6 ± 0.7 mm Hg in controls.Because L��P is assumed to be 35 mm Hg in all threegroups (see Methods), the excess above control of the
ultrafiltration pressure in Groups 1 and 2 MCN (9.6and 1 1 .5 mm Hg, respectively) can be attributedsolely to the extent to which ir� was lowered in MCN.Thus, at the bow FF observed in humans, the averagemagnitude of w� depression in MCN can be inferredto approximate 1 0 to 1 3 mm Hg, regardless ofwhether the actual axial rise in this quantity is linearor exponential.
Analyses of segmental vascular resistance in cx-
perimental models of MCN in the rat by the use ofthe micropuncture technique have revealed resist-
ance in afferent arterioles to be lowered in proportionto, or proportionately more than, that in efferent

Minimal Change Nephropathy
1580 Volume 4 ‘ Number 8 #{149}1994
arterioles (15-18). A comparable change in segmen-tal resistance in human MCN would facilitate thetransmission into gbomerular capillaries of arterialpressure, which we have found to be elevated in thepatients of this study (Table 2). The gbomerular cap-iblary hypertension, in turn, would serve to elevateand not depress �P. Although we cannot exclude a
species difference in segmental vascular resistancein humans with MCN, it is difficult to conceive of adecline in �P of sufficient magnitude to offset the
depression of the opposing ir� of 10 mm Hg or more.This is particularly true of Group 2 MCN, in whichthe arterial pressure was elevated by 1 8 mm Hg
(Table 2). We are accordingly bed to the conclusionthat net ultrafiltration pressure is likely to have beenelevated in Group 2 MCN and that the profound
depression of Kf was the proximate cause of thehypofiltration observed in these subjects.
We have already defined K� as the product of hy-
draulic permeability and the surface area availablefor filtration. As stated previously, the latter quantitywas numerically larger in MCN than in controls, a
consequence of a trend toward gbomerular hypertro-
phy in this disorder (7,33) (Table 4). By exclusion, areduction in hydraulic permeability due to alterations
along the extracelbubar pathway for transcapillarywater flux appears to be implicated as the predomi-nant cause of the computed depression of K�.
The GBM and the interpodocytic diaphragms haverecently been estimated to each account for approx-imately 50% of the hydraulic permeability of glomer-
ular capillary walls (32). The normal thickness of theGBM in MCN appears to point to the interpodocyticdiaphragms as the most likely site for increased re-sistance to transcapilbary water flow (34). The efface-ment of the podocytes severely curtails the frequencyof filtration slits and thus could be the basis of anincreased resistance to water flow. The diaphragmsat the base of each filtration slit are perforated byapertures (so-called “slit pores”) through which ul-trafiltrate must ultimately pass to gain access toBowman’s space (35). Inasmuch as the curtailmentof the slit diaphragms and the slit pores could lowerhydraulic permeability in MCN, our computationfrom dextran sieving coefficients that pore density is
reduced in parallel with computed K1 in MCN is con-
sistent with this interpretation (Figure 8).Of interest is that micropuncturists have observed
a direct relationship between irA and K1in the normalrat (36). The fact that these quantities may also berelated in humans with MCN is consistent with ourrecent observation that the remission of proteinuria
in this disorder is accompanied by a parallel increasein both TA and computed I(�(7). It is thus conceivable
that either hypoproteinemia per se or the associatedreduction in IA might contribute to the lowered hy-draulic permeability in MCN by aggravating the in-
jury to epithebial foot processes. The fact that this
may well be so is suggested by a recent report of footprocess broadening and effacement in children with
kwashiorkor, who exhibited hypoalbuminemia, butno proteinuria (37). Kwashiorkor has also beenshown in rats chronically deprived of dietary protein
to lower the K� (38). These latter findings raise thepossibility that some biophysical influence associ-ated with hypoproteinemia contributes to the ob-served alteration of foot process architecture andplays a role in the extent of K1 depression in MCN.
We conclude that broadening of the epitheliab po-docytes lowers K� in patients with MCN but that aprofound reduction in ir� serves to maintain a high
ultrafiltration pressure in this disorder. Under theconditions of hemodynamic stability and arterial hy-pertension that prevailed in this study, we estimatethat the epithebial cell alterations that typify MCNwould have to lower K� by much more than 50%before a measurable decline in GFR will eventuate.
On the other hand, a superimposed hemodynamicinsult could depress �P acutely, thereby permitting
GFR to fall at more modest bevels of K� depression.Because hemodynamic instability is expected to con-
tribute only transiently to hypofiltration in patientswith MCN (9, 1 1), we submit that the profounddepression of K�. along with a modest reduction inRPF, accounts for the sustained lowering of GFR thatis observed in some patients with this disorder.
ACKNOWLEDGMENTS
This study was supported by grants *DK29985-09, DK40800-03,
and GCRC grant MOl-RR0007O from the NIH.
REFERENCES
1 . Mendoza SA, Tune BM: Treatment of childhoodnephrotic syndrome. J Am Soc Nephrol 1992;3:889-894.
2. Meyrler A, Simon P, Perret G, Condamin-Mey-ijer M-C: Remission of idiopathic nephroticsyndrome with cycbosporin. BMJ 1986;292:789-792.
3. International Study of Kidney Disease In Chil-then: Nephrotic syndrome in children: Predic-tion of histopathobogy from clinical and labora-tory characteristics at time of diagnosis. KidneyInt 1978;13:159-165.
4. Nolasco F, Cameron JS, Heywood EF, Hicks J,ogg C, Williams DG: Adult-onset minimalchange nephrotic syndrome: A long-term follow-up. Kidneylnt 1986;29:1215-1223.
5. Gur A, Adefurn PY, Siegel NJ, Hayslett JP: Astudy of the renal handling of water in bipoidnephrosis. Pediatr Res 1 976� 10:197-201.
6. Koomans HA, Boer WI!, Dorhout Mees EJ:Renal function during recovery from minimallesions nephrotic syndrome. Nephron 1 988;47:173-178.
7. Guasch A, Hashimoto H, Sibley RK, Deen WM,Myers BD: Gbomerubar dysfunction in nephro-tic humans with minimal changes or focal gb-

Guasch and Myers
Journal of the American Society of Nephrology 1581
merulosclerosis. Am J Physiol 1 99 1 ;260:F728-F737.
8. Winetz JA, Robertson CR, Golbetz H, CarrierBC.!, Salyer WR, Myers BD: The nature of gb-merular injury in minimal change and focal scle-rosing glomerulopathies. Am J Kidney Dis 1981;1:91-98.
9. Smith JD, Hayslett JP: Reversible renal failurein the nephrotic syndrome. Am J Kidney Dis1992;19:201-213.
10. Chamberlam MJ, mingle A, Wrong OM: Oh-guric renal failure in the nephrotic syndrome. QJ Med 1966;138:215-235.
1 1 . Geers AB, Koomans HA, Roos JC, DorhoutMees EJ: Preservation of blood volume duringedema removal in nephrotic subjects. Kidney Int1985;28:652-657.
1 2. Meltzer JI, Keim HJ, Laragh JH, Sealey JE,Jan K-M, Chien S: Nephrotic syndrome: Vaso-constriction and hypervolemic types indicatedby renin-sodium profiling. Ann Intern Med1979;91 :688-696.
13. Lowenstein J, Schacht RG, Baldwin DS: Renalfailure in minimal change nephrotic syndrome.Am J Med 1981;70:227-233.
14. Esparza AR, Kahn SI, Garella S, Abuebo JG:Spectrum of acute renal failure in nephrotic syn-drome with minimal (or minor) gbomerular be-sions. Lab Invest 1981;45:510-521.
15. Bohrer MP, Baylis PC, Robertson CR, BrennerBM: Mechanisms of the puromycin-induced de-fects in the transgbomerular passage of waterand macromolecules. J Clin Invest 1977;60:152-161.
16. Anderson S, Diamond JR. Karnovsky MJ,Brenner BM: Mechanisms underlying transitionfrom acute gbomerular injury to late sclerosis ina rat model of nephrotic syndrome. J Cbin Invest1988;82: 1757-1768.
1 7. Scholey JW, Miller PL, Rennke HG, Meyer TW:Effect of converting enzyme inhibition on thecourse of adriamycin-induced nephropathy. Kid-ney mt 1989;36:816-822.
1 8. Ichikawa I, Rennke HG, Hoyer JR, et al.: Rolefor intrarenal mechanisms in the impaired saltexcretion of experimental nephrotic syndrome.J Clin Invest 1983;71:91-103.
19. Carrie BJ, Salyer WR, Myers BD: Minimalchange nephropathy: An electrochemical disor-der ol the gbomerubar membrane. Am J Med1981 ;70:262-268.
20. Robson AM, Giangiacomo J, Kienstra RA,Naqvi ST, Ingelfinger JR: Normal gbomerularpermeability and its modification by minimalchange nephrotic syndrome. J Clin Invest 1974;54:1190-1199.
2 1 . Chang RLS, Robertson CR, Deen WM, BrennerBM: Permselectivlty of the gbomerular capillarywall to macromolecules. I. Theoretical consider-ations. Blophys J 1975; 15:861-886.
22. Ben-Bassat M, Braslavsky D, Lotan D, Eisen-stein B, Davidowitz M, Stark H: Ultrastructuralchanges suggestive of focal segmental gbomeru-boscberosis in atypical minimal change nephrotic
syndrome. Ultrastruct Pathol 1988; 12:1-16.23. Battilana C, zhang H, Olshen R, Wexier L,
Myers BD: PAH extraction and the estimation ofplasma flow in the diseased human kidney. AmJ Physiol 1991;30:F726-F733.
24. Canaan-KUhI S, Venkatraman ES, Ernst SIB,Olshen RA, Myers BD: Relationships amongprotein and albumin concentrations and oncoticpressure in nephrotic plasma. Am J Physiol1993;264:F1052-F1059.
25. Shemesh 0, Ross JC, Deen WM, Grant GW,Myers BD: Nature of the glomerular capillaryinjury in human membranous gbomerubopathy.J Chin Invest 1986;77:868-877.
26. Nakamura Y, Myers BD: Charge-selectivity ofproteinuria in diabetic gbomerubopathy. Diabetes1988;37:1202-121 1.
27. Deen WM, Robertson CR, Brenner BM: A modelof gbomerular ultrafiltration in the rat. Am JPhysiol 1972;223:1 178-1183.
28. Myers BD, Peterson C, Molina CR, et al.: Roleof cardiac atria in the human renal response tochan�in� plasma volume. Am J Physiol 1988;254:l�562-F573.
29. Deen WM, Bridges CR, Brenner BM, Myers BD:Heteroporous model of size-selectivity: Applica-tion to normal and nephrotic humans. Am JPhysiol 1 985;249:F374-F389.
30. Guasch A, Sibley RK, Huie P, Myers BD: Extentand course of gbomerular injury in human mem-branous gbomerulopathy. Am J Physiol 1992;263:F1034-F1043.
3 1 . Hirose K, Osterby R, Nozawa M, GundersenHJG: Development of gbomerular lesions in cx-perimental long-term diabetes in the rat. KidneyInt 1982;21 :688-695.
32. Drumond MC, Deen WM: Structural determi-nants of glomerular capillary hydraulic perme-ability [Abstract]. J Am Soc Nephrol 1992;3:560.
33. Fogo A, Hawkins EP, Berry PL, et al.: Gbomer-ubar hypertrophy in minimal change disease pre-dicts subsequent progression to focal glomerularsclerosis. Kidney mt 1 990;38: 115-123.
34. Bohman SO, Jaremko G, Bohlin AB, Berg U:Foot process fusion and gbomerular filtrationrate in minimal change nephrotic syndrome.Kidney Int 1984;25:69�-70O.
35. Schneeberger EE, Levey RH, McCluskey RT,Karnovsky MJ: The isoporous substructure ofthe human �bomerular slit diaphragm. KidneyInt 1975;8:4�-52.
36. Baylis C, Ichikawa I, Willis WT, Wilson CB,Brenner BM: Dynamics of glomerular ultrafiltra-tion. IX. Effects of plasma protein concentration.Am J Physiol 1977;232:F58-F64.
37. Golden MHN, Brooks SEH, Ramdath DO, TaylorE: Effacement of glomerular foot processes inkwashiorkor. Lancet 1 990;336: 1472-1474.
38. Ichikawa I, Purkerson ML, Klahr S, Troy JL,Martinez-Maldonado M, Brenner BM: Mecha-nism of reduced gbomerular filtration rate inchronic malnutrition. J Clin Invest 1980;65:982-988.