Embed Size (px)
Citation preview

Determination and Use of Radiobiological Response
Parameters in Radiation Therapy Optimization
Panayiotis Mavroidis
Division of Medical Radiation Physics Department of Oncology-Pathology
Karolinska Institutet Stockholm 2001

Determination and use of radiobiological response parameters in radiation therapy optimization
2
Doctoral Dissertation 2001 Division of Medical Radiation Physics Department of Oncology-Pathology Karolinska Institutet Stockholm University All previously published papers were reproduced with permission from the publisher. Published and printed by Karolinska University Press Box 200, SE-171 77 Stockholm, Sweden © Panayiotis Mavroidis, 2001 ISBN 91-7349-092-X

Determination and use of radiobiological response parameters in radiation therapy optimization
3
To my family and
to my friends

Determination and use of radiobiological response parameters in radiation therapy optimization
4
Abstract
Optimization of radiation therapy is critically dependent on the use of patient related information. For this reason, radiobiological models describing the dependence of tumour and normal tissue responses on the irradiated volume and the dose-time-fractionation schedule should be introduced. In addition, the heterogeneity of the delivered dose distribution and tumour or normal tissue sensitivity variations have to be taken into account clinically. In the present study, a treatment optimization procedure is used that considers the shape and the structure of the target tissues and healthy organs at risk, their relative position and their dose-response relations for the individual patient.
Mathematical models largely based on the Poisson statistics and the linear-quadratic model of cell kill, have been used to quantify the radiobiological response of normal human tissues and tumours to radiation therapy. The presented models predict a decreasing probability of achieving complication free tumour control with increasing tumour size and increasing volume of normal tissues irradiated. The radiobiological parameters 50D , γ, s and refV of the Poisson and relative seriality models have been estimated for certain normal tissues and targets. The process for determining these dose-response relations was based on clinical materials where the treatment information and follow-up results of the individual patient were available. The statistical methods used, estimated and verified the parameters and their uncertainties. The clinical range of variability of the dose-response relations is important for their correct use in the clinical routine.
The clinical use of the derived dose-response relations is demonstrated using radiobiological parameters for different tumours and normal tissues that were also calculated based on data from clinical trials. A biological evaluation procedure is introduced and applied on clinical cases. This procedure uses the biological models and dose-response data of the involved organs and optimizes the dose level of the treatment technique under study. This is done by evaluating the plan using the P+ objective, which estimates the probability to achieve tumour cure without having severe complications to the healthy tissues. The clinical value of biologically based treatment planning was compared with alternative physical criteria (e.g. tolerance doses) and with the judgment of personnel on particular clinical cases.
It is demonstrated that the radiobiological objective functions allow a much higher conformity and a more clinically relevant scoring of the treatment outcome. The probability of achieving tumour control without fatal complications in normal tissues is increased and the dose delivery optimized. Recent developments can reduce or even eliminate the need for intracavitary treatment by delivering more conformal dose distributions using intensity modulated external dose delivery. In these cases the reliability of the patient setup becomes critical for the effectiveness of the treatment. It is realized that accurate information concerning the response of different organs to fractionated intensity modulated radiation therapy is the key to true optimization of the delivered dose distribution.

Determination and use of radiobiological response parameters in radiation therapy optimization
5
LIST OF PAPERS This thesis is based on the following papers, which will be referenced in the text by their Roman numerals. I. Mavroidis P, Laurell G, Kraepelien T, Fernberg J O, Lind B K and Brahme A
2001 Dose response parameters for esophageal stricture from head & neck radiotherapy (submitted to Int. J. Radiat. Oncol. Biol. Phys.)
II. Mavroidis P, Theodorou K, Lefkopoulos D, Nataf F, Karlsson B, Lax I, Kappas C
Lind B K and Brahme A 2001 Prediction of AVM obliteration after stereotactic radiotherapy using radiobiological modelling (submitted to Radiother. Oncol.)
III. Mavroidis P, Axelsson S, Hyödynmaa S, Rajala J, Pitkänen M A, Lind B K and
Brahme A 2001 Positioning uncertainty and breathing effects on dose delivery and radiation pneumonitis prediction in breast cancer (submitted to Acta Oncol.)
IV. Mavroidis P, Kappas C and Lind B K 1997 A computer program for evaluating
the probability of complication-free tumor control incorporated in a commercial treatment planning system J. Balcan Union Oncol. 3 257-64
V. Lind B K, Mavroidis P, Hyödynmaa S and Kappas C 1999 Optimization of the
dose level for a given treatment plan to maximize the complication free tumor cure Acta Oncol. 38 787-98
VI. Mavroidis P, Lind B K, Van Dijk J, Koedooder K, De Neve W, De Wagter C,
Planskoy B, Rosenwald J C, Proimos B, Kappas C, Danciu C, Benassi M, Chierego G and Brahme A 2000 Comparison of conformal radiation therapy techniques within the dynamic radiotherapy project �DYNARAD� Phys. Med. Biol. 45 2459-81
VII. Mavroidis P, Lind B K and Brahme A 2001 Biologically effective uniform dose
( D ) for specification, report and comparison of dose response relations and treatment plans Phys. Med. Biol. 46 2607-30
Determination and use of radiobiological response parameters in radiation therapy optimization
6
CONTENTS
1. Introduction 8
2. The need for biological objectives in treatment planning 11
3. Radiobiological models 12
3.1. NTCP modelling 13
3.1.1. Relative seriality model (s model) 13
3.1.2. The k model 14
3.1.3. The critical element model 16
3.1.4. The critical volume model 16
3.1.5. The Lyman & Kutcher model 17
3.1.6. The parallel architecture model 18
3.1.7. The Klepper & Klimanov model 20
3.2. TCP modelling 20
3.3. The complication free tumour control objective, P+ 21
4. Extraction of dose-response relations from clinical material 22
4.1. Normal tissues 24
4.2. Tumours or AVMs 26
4.3. Statistical analysis 28
5. Treatment planning 31
5.1. Fractionation correction 32
5.2. Volume overlapping 35
5.3. Clinical aspects of the target and risk volumes 35
5.4. The biologically effective uniform dose ( D ) concept 38
5.5. Radiation therapy optimization 42
5.5.1. Radiobiologically assessed conformal radiotherapy 42
5.5.2. Dose level optimization 46
5.5.3. Software development 48

Determination and use of radiobiological response parameters in radiation therapy optimization
7
6. Discussion and future perspectives 52
7. Conclusions 55
Acknowledgements 56
References 58
Papers I-VII

Determination and use of radiobiological response parameters in radiation therapy optimization
8
1. Introduction
Recent technological developments have introduced dramatic changes in the field of radiation therapy. Radiological imaging has become more advanced providing information at a cellular and functional level. This way, a better assessment of spread, cell density and radiosensitivity variation of the clonogenic tumour cells can be accomplished. For normal tissues, information on the location and distribution of radiation sensitive functional subunits can be accessed. Furthermore, the possibility of calculating the dose distribution delivered to the patient in a 3-dimensional mode gives a better view of the effectiveness of the applied treatment configuration. This abundance of information needs to be accurately used in order to achieve a close agreement between treatment planning and clinical outcome. The clinical introduction of radiobiological models and the derivation of their parameters based on clinical trials, can be used to predict very closely the result of a treatment and to maximize given treatment objectives.
The clinical outcome of a radiotherapy treatment in terms of tumour control and
normal tissue complications is nearly always linked to a degree of uncertainty. This is partly because two treatment fractions of the same beam configuration are not the same since the nature of radiation beams are stochastic at a microscopic level. Furthermore, the inter-patient and cellular radiosensitivity variations are generally unknown54,145,148. For these reasons, the expected outcome of a treatment is expressed as the probability of having a certain treatment effect. Radiobiological treatment planning estimates these probabilities for each target and organ at risk of a given clinical case based on dose-distributional and radiobiological data.
Clinical radiotherapy requires methods for treatment planning that maximize the
modern conformation of the delivered dose distribution to the target volume. This is achieved through three-dimensional intensity modulated treatment planning, which conforms the treatment to the individual shape of the target volume and the location of healthy organs at risk. Classical or �forward� treatment planning is generally a trial and error process, where dose plans are gradually improved by varying the configuration of incident beams. Usually, certain irradiation protocols, which are based on empirically registered tumour control and normal tissue complication rates (probabilities), are applied for certain cancer sites. However, these probabilities are valid only for the methodology followed by the clinic that derived them. The current practice in treatment plan optimization uses mainly the mean dose and the dose variance in the target volume or organs at risk as an objective function trying to maximize it. However, a true optimization of radiation therapy requires the use of true clinical treatment objectives that will provide a closer achievement of the desired treatment outcome.
The subject of the present study is to register and use radiobiological models in treatment planning systems in order to assess and subsequently improve the treatment outcome. A true optimization of radiation therapy requires formulation of the clinical

Determination and use of radiobiological response parameters in radiation therapy optimization
9
treatment objectives. In radiotherapy the objective functions can be either physical meaning that the aim of the optimization is to obtain maximal agreement between the desired and the resultant dose distribution or biological where the desired dose distribution is determined by the dose-response characteristics of the tumour and normal tissues so that the quality of life of the patient is maximized14,26,36,72,75,150,151. The principal aim of this thesis is to accurately quantify the radiobiological response of tumours and normal tissues to fractionated radiotherapy, using data that have been derived from clinical observations. These radiobiological objectives will allow the evaluation of different beams arrangements and they will identify the ones that for example maximize the probability to eradicate the tumour without inducing severe damage to normal tissues.
Radiobiological models require accurate estimation of the parameters describing
the dose-response relations of the different organs40,87,111,122,133. In Paper I, the radiobiological parameters of the relative seriality model are estimated for the clinical endpoint of radiation induced esophageal stricture. The uncertainties of the individual parameters and their effect on the corresponding dose-response relation are investigated. Furthermore, the clinical relevance of the radiobiological model and the volume effect of the endpoint are validated. The impact of the fractionation correction method applied on complex treatment plans is discussed.
Radiosensitivity of targets and normal tissues may depend on many different
factors, which have to be identified in order to describe closer their dose-response relations. In Paper II, the accuracy by which the linear-Poisson model predicts the probability of AVM obliteration and how the hemorrhage history, location and volume of the AVM influence its radiosensitivity is investigated. The parameters and their uncertainties characterizing the dose-response relation for AVM obliteration following single fraction stereotactic radiotherapy are also derived. Comparison of different radiobiological models and statistical validation of the results are performed.
A close assessment of treatment outcome depends strongly on the accuracy by
which the planned treatment is delivered to the patient. In Paper III, the effect of the positioning uncertainties and the breathing effects on the delivered dose distribution are investigated. Three different breast cancer cases, which require different treatment configurations are examined. A simulation of the true dose delivery is attempted. The impact of the deviation between the planned and the delivered dose distributions on the expected clinical outcome are validated using radiobiological modelling. The influence of the lung density changes during breathing is also examined.
Introduction of radiobiological treatment planning into the clinical practice requires not only accurate biological models and response parameters but also a tool that will help the clinical personnel estimate its clinical relevance. In Paper IV, the characteristics of a plan evaluation procedure are presented. This procedure involves a

Determination and use of radiobiological response parameters in radiation therapy optimization
10
treatment planning system (TPS) for the dosimetric information and a software for the biological evaluation of the plan. A broad description of the theoretical background concerning the radiobiological models used and the organ response parameters is included. Furthermore, the technical part together with the usefulness and the limitations of the procedure is discussed. This new procedure improves the dose distribution and helps the treatment planner find the beam orientations, the beam modalities and the spectral distribution of these modalities that are more appropriate. Established dose-response parameters for the tissues of interest are used to make the plan evaluation as clinically relevant as possible.
Different irradiation protocols recommend different prescription doses for certain clinical cases. However, optimum dose prescription is dose distribution dependent and can only be determined using radiobiological objectives. In Paper V, the software that was presented in paper I undergoes further development and is applied to two clinical cases to demonstrate its clinical utilization. The procedure was applied to cervix and head & neck cancer cases in a 3-dimensional treatment planning mode. A parallel evaluation of the plans from medical personnel and the biological procedure was carried out to illustrate the significance of the dose level optimization on the treatment outcome. Observing the treatment plans of the clinical examples a reduced tumour dose can be seen at the border facing sensitive organs at risk but an increased dose just inside the tumour border. The increased tumour dose has a desirable effect when the dose fall off is steeper in the vicinity of organs at risk.
The clinical value of radiobiological treatment planning can be demonstrated by evaluating and comparing different conformal and conventional treatment plans. In Paper VI, the results of the Dynarad project are presented. The aim of this project was to register the current practice of external radiotherapy and exploit the possibilities for improvement. The data provided by the participating radiotherapy centers and the irradiation procedure is described analytically. The treatment plans were evaluated both using standard and biological criteria to show that the biological evaluation does not contradict the physical one but it completes it by using patient specific information. The requirements imposed for achieving more conformal plans and their clinical aspects are also discussed providing the guidelines of future development in radiation therapy.
Most protocols prescribe the dose to the gross tumour for dose escalation.
However, in cases of internal target volumes of heterogeneous radiosensitivities this approach has limitations. In Paper VII, the concept of radiobiologically effective uniform dose is presented. The D is compared with other dosimetric quantities that are used for dose prescription. Its clinical use is demonstrated by applying it to two different treatment plans of a cervix cancer case. This concept makes the comparison of different treatment plans clear and easy by using a common dose scale even if the dose distributions delivered by the two plans differs significantly.

Determination and use of radiobiological response parameters in radiation therapy optimization
11
2. The need for biological objectives in treatment planning Presently, the evaluation of a treatment plan is based on the volumetric distribution of the absorbed dose within the patient. However, it is seldom possible to measure dose distribution directly in patients treated with radiation. Data on dose distributions are almost entirely derived from measurements in water phantoms (which are tissue and muscle equivalent materials) usually large enough in volume to provide full scatter conditions for a given beam. These basic data are used in a dose calculation system devised to predict dose distribution in an actual patient. So, during the treatment planning process the patient is simulated by a 3-dimensional representation. The dose distribution within the patient is calculated using the electron density distribution provided by the CT slices (Hounsfield numbers) and correcting for inhomogeneities existing within the patient such as bones and air cavities11,58,59. In the so-called �forward optimization� (trial and error) approach, which is mostly used nowadays, the planner changes the configuration of the beams and consequently the dose distribution within the patient trying to satisfy some predetermined criteria (usually tolerance doses for the normal tissues and prescribed doses for the targets). This is a trial and error process and depends very much on the clinical experience of the planner. Now, that the speed of the computers has increased dramatically many treatment planning systems have implemented the �inverse planning� approach, which uses these predetermined criteria as an input and finds the beam configuration that satisfy them most. However, to simulate the patient by a tissue equivalent computer representation is not clinically very accurate since the response of the various organs to radiation depends on many other factors that are currently not taken into account during the treatment planning process. Such factors are the volume dependence of the organs to radiation, the internal structural organization of the functional subunits for the normal tissues or the density of the clonogenic cells for the targets, the hypoxic cell fraction within the tumour and the fractionation regime, which affects a) the repair of sublethal damage; b) the reassortment of cells within the cell cycle; c) the repopulation and d) the reoxygenation of the cells. In order to take this information into account in the planning of the treatment one needs to use radiobiological models, which describe the response of the tumours and normal tissues to radiation according to their radiobiological characteristics.
Determination and use of radiobiological response parameters in radiation therapy optimization
12
3. Radiobiological models
Most of the radiobiological models that have been developed to describe the dose-response behaviour of different normal tissues and tumours122 are characterized by the some common features such as those that follow:
• Cell survival after irradiation is binomial and obeys binomial or Poisson statistics. • Response of an organ is determined by the death or survival of its target cells
(functional subunits for normal tissues and clonogens for tumours). • All the target cells respond identically. • Isoeffect relationships are independent of the level of response. • Equal effects are obtained from equal dose fractions if sufficiently separated in
time.
There are basically two levels where the response of clinical structures to radiation can be mathematically modelled. Microscopically, considering cellular survival, and macroscopically studying organ response.
The radiobiological model that is used presently most extensively for describing the dose-response relation for tumours and normal tissues is the linear-quadratic-Poisson model, which also accounts for the fractionation scheme applied:
( ) ( ) 250
0/ ln ln 2
( ) exp expD D e e nd ndP D N e e
γ γ α β − ⋅ − − −= − = −
(1)
where ( )P D is the probability to control the tumour or induce a certain injury to an organ that is irradiated uniformly with a dose D, /d D n= is the dose per fraction and n is the number of fractions. 50D is the dose which gives a response probability of 50% and γ is the maximum normalized value of the dose-response gradient. α and β are the fractionation parameters of the model and account for the early and late effects expected26,74,143. Both 50D and γ depend on 0N , the initial number of the clonogenic cells for tumours or the initial number of functional subunits for healthy tissues. Parameters
50D and γ (or α and β) are specific for every organ and specific for the kind of injury (endpoint) considered and can be calculated only from clinical data.
The radiation induced normal tissue complications have been described in terms of inactivation of functional subunits (FSU). The structural organization of FSUs can be categorized in the three following types: 1) critical element, 2) integral response, and 3) graded response. The critical element type is a serial organization of the FSUs, in which a complication appears when any of the FSUs is inactivated (such tissues are the spinal cord and the nerves). Another recommended FSU structure has been described in terms of serial organization, parallel and more generally, a combination of these two. The type

Determination and use of radiobiological response parameters in radiation therapy optimization
13
of FSU infrastructure of a tissue plays an important role in the expression of a clinical effect since it is related to the volume dependence (or effect) of the tissue. The volume effect describes how the tolerance dose increases with decreasing partial volume of normal tissues being irradiated. Calculating the probability of causing injury to normal tissues is quite different than for tumours since it is dependent on the internal structure and organization of the irradiated organ. To determine how damage to functional units leads to complications it is important to understand how organs are functionally structured in parallel and serial subunits. Many researchers have provided expressions for the probability of complications in which the volume effect is accounted for. 3.1. NTCP modelling Of the radiobiological models that are based on cell survival functions, the relative seriality model, the k � model, the critical element model and the critical volume model are briefly presented here. 3.1.1. Relative seriality model (s model)
In this model the volume effect is treated by a combination of both serial and parallel FSU organizations. Normal tissue complication probability IP is expressed as26,74,75,100,147,151,153:
( ) ( )( )1// ref
I I ref, 1 1 ,sV VsP D V P D V = − − (2)
For a heterogeneous dose distribution the response of normal tissues is given by
( ) ( )1/
I1
, 1 1 ( , )sM vis
i refi
P D V P D V∆
=
= − −
∏
r r (3)
where iv∆ (= ref/iV V∆ ) is the fractional irradiated subvolume of an organ compared to the reference volume, refV for which the values of 50D and γ were calculated and s is the relative seriality parameter that characterize the internal organization of the organ.
ref( , )iP D V is the probability of response of the organ having reference volume and being irradiated to dose iD as described by equation (1) and M is the total number of voxels in the organ.
Organs with serial infrastructure have small volume dependence since every subunit is vital for organ function. For organs with parallel infrastructure a strong volume dependence can be expected since the organ can maintain most of its function even when

Determination and use of radiobiological response parameters in radiation therapy optimization
14
a large portion of its subunits are damaged. A relative seriality close to zero ( 0s ≈ ) corresponds to a parallel organ like lung or liver, whereas 1s ≈ corresponds to a closely serial organ with minimal volume dependence like esophagus and spinal cord. The concept of reference volume is treated differently for normal tissues and tumours. Usually, the whole volume of the healthy organ is considered as reference volume and that is because the volume of an organ is related to the functional needs of the individual human being. In the case of tumours, reference volume is related to the characteristics of the clinical material from which the parameters 50D and γ were calculated.
Figure 1 illustrates the volumes for the dose calculation (upper part of the figure) and the model specific organization of the FSUs in the lower part as they are applied in a clinical case of cervix cancer. Each organ in the body of a patient is divided to a number of voxels, each of which has certain fractional volume iv∆ . At the planning process, a certain dose iD is attributed to each voxel and a certain relative seriality value s to each organ depending on the endpoint considered. This way, it is assumed that a uniform dose is given to the voxel whose response probability is calculated by equation (1), though the response of the whole organ is given by equations (2) and (3) where all its voxels are taken into account.
3.1.2. The k model
The k model is also using the Poisson survival function and it is expressed as follows74,100:
( ) ( ) ( )( )ref 50I
ln ln ln 2, exp
e k V V D D eP D V e
γ γ + − −= −
(4)
The biological parameters of this model are: 50D , γ and k . The last parameter accounts for the volume effect of the organ and it is equal to one for uniform tumours whereas it generally has a negative value of normal tissues. This model handles the decreased risk of causing injury when a smaller volume of normal tissue is irradiated in a radiobiologically comparable way to the decreased control probability when a larger effective clonogen number γ is assumed for a tumour.

Determination and use of radiobiological response parameters in radiation therapy optimization
15
Figure 1. Schematic view of the transition from the absorbed dose in the patient to the radiobiological response. At first, the spatial dose distribution in a three-dimensional mode is calculated, where the dose to each voxel (organ subvolume) iv is iD . Then the calculated dose distribution is applied to the radiobiological model to determine the complication probability of each organ. The model takes into account the internal organization of the FSUs in each organ since this affects significantly its response to radiation.
s=0.3
s=0s=0
s=0.7s=1
FSUThe internal organization of the FSUs(seriality) is different for each organ
and clinical endpoint
GT ITV
B
RSB
VrefThe reference volume is usually
equal to the volume of the whole organfor normal tissues
Dose Calculation (Di, vi)
Organs are represented by matricesof voxels which have a monotonicrelationship with the dose matrix

Determination and use of radiobiological response parameters in radiation therapy optimization
16
3.1.3. The critical element model
When setting s equal to one in the relative seriality model one receives a simplified case, which is called critical element model. The expression for normal tissue complication probability is as follows12,103:
( ) ( )( ) / refI I ref, 1 1 ,
V VP D V P D V= − − (5)
where ( )I ref,P D V value is given by equation (1). This model is based on the assumptions that:
• every element of an organ is identical, • the responses of different elements are not correlated, • every element of an organ is critical, that means the complication is induced
when at least one element is damaged.
When assuming that the organ consists of N FSUs and the probability of injury of each FSU equals IP , this probability is only a function of the dose delivered to the ith FSU. When taking into account the entire organ complication probability, the critical element model can be written as:
( ) ( )( ) / refI I, 1 1 ,1
V Vii
i
P D V P D= − −∏r r
(6)
where refiV V is the fractional irradiated volume of the organ, ( )I ,1iP D is the macroscopic probability of organ damage after whole organ irradiation with dose iD . 3.1.4. The critical volume model
This model, which was introduced by Niemierko has been discussed by many authors71,81,104,144. The probability that more than M of the functional subunits are killed is given by a formula based on binomial statistics known as the cumulative binomial probability:
( )FSU FSU1 1
1N N
N ttt
t M t M
NP P P P
t−
= + = +
= = −
∑ ∑ (7)
where N is the total number of FSUs in the organ and M is the minimum FSU number that can bring about functional failure of the organ if it gets eradicated. FSUP should be replace by the effective complication probability for one FSU:

Determination and use of radiobiological response parameters in radiation therapy optimization
17
( )effFSU FSU
1
1N p
ii
ip
P P DN =
= ∑ (8)
Due to the difficulties of calculating the cumulative binomial distribution a normal approximation suitable for numerical calculations is often used.
( ) ( )2FSU
FSU FSU 21 FSUFSU
11 exp22
N MN tt
t M
N x NPP P P dx
t σσ π−
−∞= +
− = − ≈ −
∑ ∫ (9)
where ( )FSU FSU FSU1NP Pσ = −
Such an approximation is most accurate for large ( )FSU FSU1NP P− values.
Of the phenomenological models, which are based on the macroscopic organ response, the Lyman & Kutcher model, the parallel architecture model and the Klepper & Klimanov model are described accordingly. 3.1.5. The Lyman & Kutcher model
This model is very extensively used and it is based on the error (or probit) function form for complication probability29,70,71,90,100,105:
( )2I
1 exp 22
tP t dtπ −∞
= −∫ (10)
where the upper limit of the normal probability function is defined as follows:
( ) ( )( )
50 ref
50 ref
,D D V V
t D VmD V V−
= (11)
and ( ) ( )( )50 ref 50 ref1 nD V V D V V −= (12)
This model contains four parameters to be estimated: refV , 50D , n and m. refV is the reference volume for 50D and refV V is the fraction of the organ irradiated relative to the reference volume. ( )50 1D is the tolerance dose for 50% complications for uniform whole organ irradiation, ( )50 ref/D V V is the 50% tolerance dose for uniform partial organ irradiation to the partial volume ref/V V . The volume dependence of the complication probability is determined by the parameter n, which shows the sensitivity of IP to the irradiated volume. The slope of the dose-complication probability curve is governed by
Determination and use of radiobiological response parameters in radiation therapy optimization
18
the value of the parameter m. The slope parameter m is inversely proportional to the parameter γ presented above through the relation / 8mγ π= . 3.1.6. The parallel architecture model
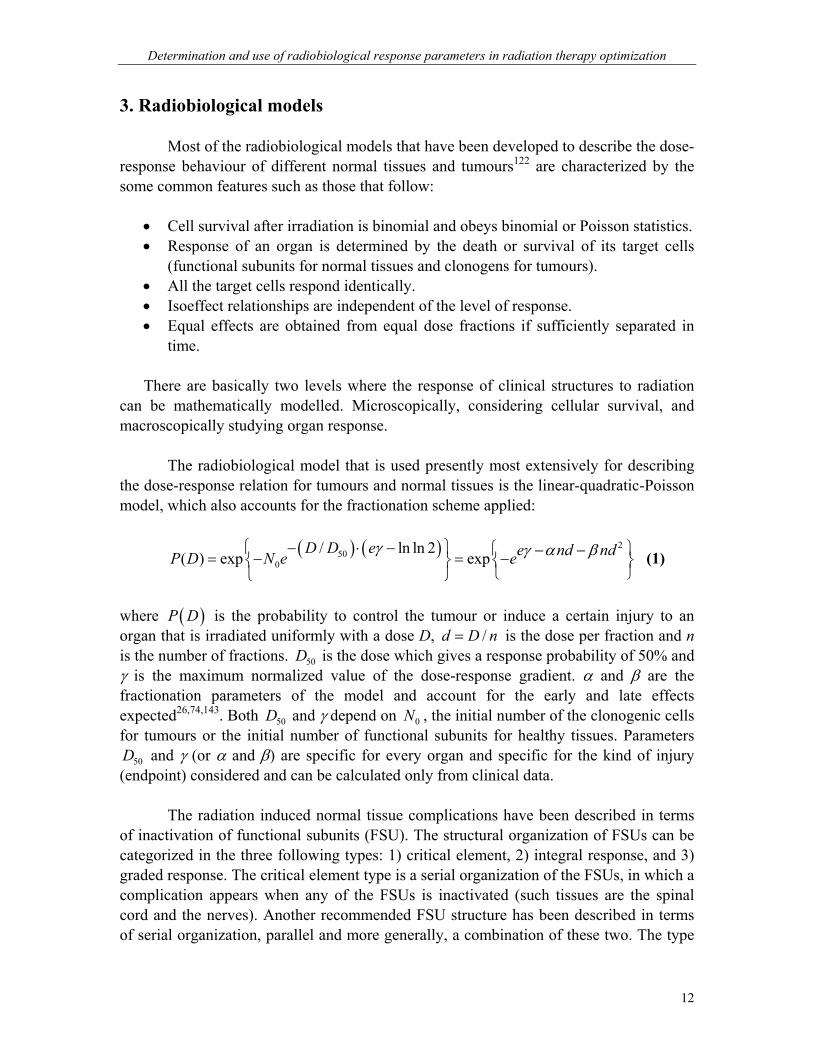
IP is here an increasing function of the number of FSUs inactivated by radiation. The probability that a dose D inactivates an FSU is given by the logit expression60,61:
( )( )50
11 kp D
D D=
+ (13)
The above sigmoid dose-response function ( )p D is assumed to describe the
probability of damaging a subunit at a given biologically equivalent dose. Apart from the assumption that biologically equivalent doses can be calculated from a linear-quadratic formula no connections of this probability with any underlying mechanism of radiation injury or identification of the subunits involved has been attempted. Instead it has been chosen to describe the subunit response phenomenologically, using a logistic function of dose parameterized in terms of the dose 50D at which 50% of the subunits are damaged, and the slope parameter k that determines the rate at which the probability of damaging a subunit increases with dose (k is related to γ through 4k γ= ).
For a given dose volume histogram (DVH) the fraction of inactivated FSUs is the sum over the dose bins: ( )i i
if v p D= ⋅∑ (14)
where iD and iv are the average dose and volume fraction in the ith histogram bin and f is called the fractional damage.
To fit the parallel architecture model to clinical data, expressions for both ( )p D and statistical distribution of functional reserves over the patient population are required. Normal tissue complication probability for a general DVH is calculated from the equation:
( )250
I 22 0
1 exp22
f v vP dv
σπσ
−= −
∫ (15)
in which it is assumed that the cumulative functional reserve distribution can be described as a displaced error function and specified by the mean value of the functional reserve 50v and the width of the functional reserve distribution σ .

Determination and use of radiobiological response parameters in radiation therapy optimization
19
0.0
0.2
0.4
0.6
0.8
PI
30 40 50 60 70 80 90 D / Gy
seriality model
100 %
66 %
33 %
30 40 50 60 70 D / Gy80 900.0
0.2
0.4
0.6
0.8
PI
100 %
66 %33 %
Klepper & Klimanov model
100 %
n = 0.10
0.0
0.2
0.4
0.6
0.8
PI
30 40 50 60 70 80 90 D / Gy
100 %
66 %
33 %
k = -2.2
30 40 50 60 70 80 90 D / Gy0.0
0.2
0.4
0.6
0.8
PI
100 %
66 %
33 %
k = -0.61
30 40 50 60 70 80 90 D / Gy0.0
0.2
0.4
0.6
0.8
PI
100 %
66 %
33 %
critical element model
30 40 50 60 70 80 90 D / Gy0.0
0.2
0.4
0.6
0.8
PI100 %
66 %
33 %
critical volume model
10 20 30 40 50 60 70 D / Gy0.0
0.2
0.4
0.6
0.8
PI100 %
66 %33 %
n = 0.50
30 40 50 60 70 80 90 D / Gy0.0
0.2
0.4
0.6
0.8
PI
100 %
66 %
33 %
parallel architecture model
30 40 50 60 70 80 90 D / Gy0.0
0.2
0.4
0.6
0.8
PI100 %
66 %
33 %
30 40 50 60 70 80 90 D / Gy0.0
0.2
0.4
0.6
0.8
PI
66 %
33 %
s = 0.18 s = 0.86
k - model
Lyman & Kutcher model
Figure 2. Dose-response curves and associated volume dependence from different NTCP models are demonstrated. For these calculations comparable response parameters were used to allow a qualitatively comparison of the different models.
Determination and use of radiobiological response parameters in radiation therapy optimization
20
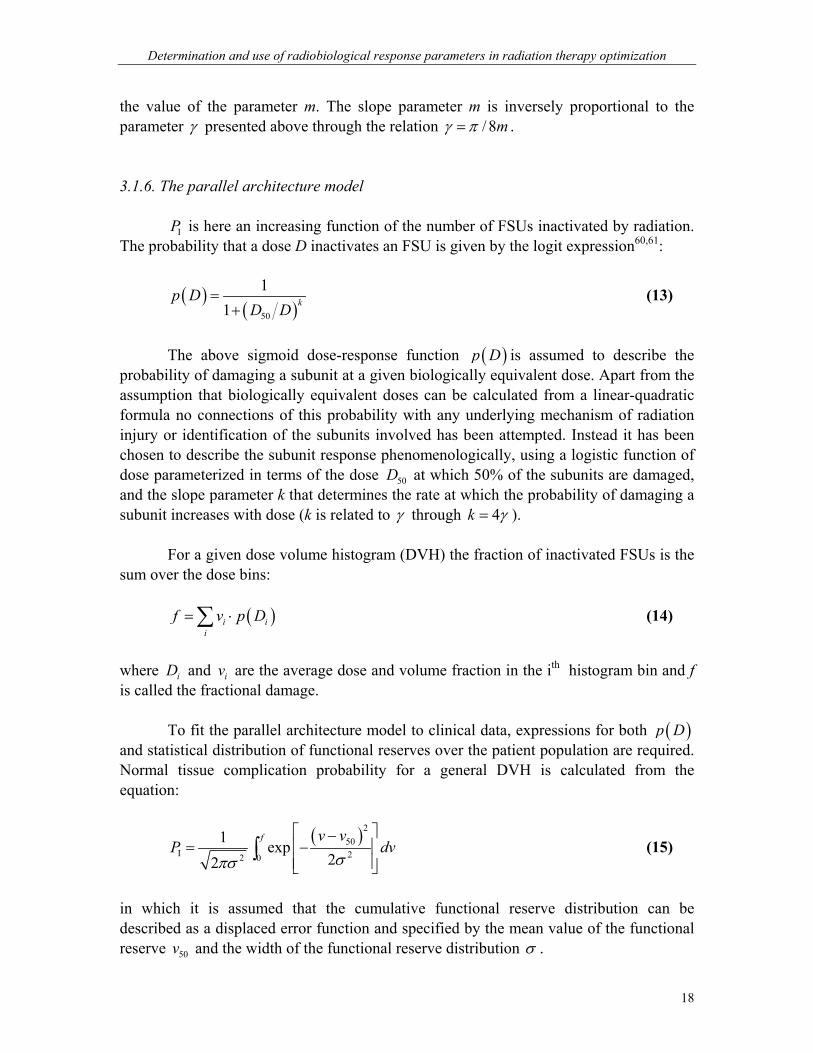
3.1.7. The Klepper & Klimanov model In this case, normal tissue complication probability is calculated on the basis of a modified Weibull function68:
( )2
I1
, 1 expAbDVP D V
A
= − −
(16)
The model contains three parameters: 1A , b and 2A that are to be obtained from clinical data. In figure 2, dose-response relations calculated by the different radiobiological models are presented. The dose-response relations were derived from comparable radiobiological parameters in order to demonstrate the volume dependence of the models examined. A more appropriate procedure to carry out such a comparison would require the use of a patient material with complete treatment information and follow-up results. From these clinical data, the radiobiological parameters of all the different models could be estimated and their corresponding dose-response relations could be compared accordingly. Most of the models developed to predict the normal tissue complication probability assume that sufficient time is allowed between fractions for complete repair of sublethal damage to take place after each dose. This full-repair interval is at least 6 hours but in some cases (e.g. spinal cord) it can approximate the length of a day. If the interfraction interval is reduced below this value, which is tissue dependent, the overall damage from the whole treatment will increase because of the interaction between residual unrepaired damage from one fraction and the damage from the next one. Consequently, additional effects such as incomplete repair does sometimes have to be accounted for by the NTCP models. 3.2. TCP modelling A tumour is assumed to have a parallel structural organization since the eradication of all its clonogenic cells is required. Consequently, the control response of tumours can be described by the relationship
( ) ( )1
,M
vii
i
P D V P D ∆
=
= ∏r r
(17)
Viable hypoxic cells are more resistant to radiation than well-oxygenated cells.
Such cells are common in many tumours and may lead to inhomogeneous distributions of

Determination and use of radiobiological response parameters in radiation therapy optimization
21
radiation resistance at cellular level and consequently to heterogeneous treatment response. Since it is generally not possible to target and treat individual cells by radiation therapy, local mean values of the number of clonogenic cells and the radiation resistance, taken over tissue volumes covering several cells, should be considered in biological treatment planning. The Poisson approximation of the probability for beneficial treatment can be generalized to take spatial dose, density and radioresistance heterogeneities into account. With a uniform dose iD in voxel i the probability of beneficial treatment BP in a heterogeneous tumour with k spatially distributed voxels can be very well approximated by:
/ 0,eff ,
B 0,eff ,1
expk D DN i i
ii
P e N e−
=
−= = −
∑ (18)
This formula can also be expressed as an integral over continuous spatial distributions of clonogen density and radiation resistance28,106,111. The repopulation of the clonogenic cells is taken into account in the LQ + time model. The inclusion of the effect of the produced cells during treatment modifies the tumour control probability at time t in the following way:
( )2pot
Bln 2
exp ke nd nd t T TP e
γ α β − − + −= −
(19)
where potT is the potential doubling time of the cells and kT is the time delay before significant repopulation is detectable. As pointed out by Tucker et al138, this model loses accuracy because it deviates from the pure Poisson distribution on which it is based. This is easily understood if equation (19) is written as B
kNP e−= where 2e nd ndN e γ α β− −= and
( ) potln 2 /kt T Tk e −= . If the number of surviving cells N is assumed to be Poisson distributed with mean N then the variance will also be N due to the properties of the Poisson distribution. But the mean of kN is kN and its variance is 2k N and thus kN cannot be Poisson distributed! Dose-response curves constructed from this model describe the response of individual tumours and have particularly steep slopes. Generally, dose-response curves for a population of tumours are considerably less steep, probably due to inter-tumour heterogeneity of the parameters, which determine tumour cure. 3.3. The complication free tumour control objective, P+ In order to judge the clinical merits of a given dose distribution it is important to be able to compare its advantages in terms of tumour control with its disadvantages in the form of normal tissue complications2. In the general case this is difficult, since the radiation effects in different tissues generally are incommensurable entities. However, for

Determination and use of radiobiological response parameters in radiation therapy optimization
22
fatal normal tissue injuries that cannot be salvaged by surgery a strict comparison is possible, as this endpoint is as undesirable as an irresectable tumour recurrence. The general expression for the probability of achieving complication free tumour control P+ is given by: B B IP P P+ ∩= − (20) Taking into account that a fraction δ of the patients are statistically independent, P+ may be approximated by: ( )B I I B1P P P P Pδ+ = − + − (21)
BP is defined as the probability of getting benefit from the treatment (i.e. tumour control) and IP as the probability of causing injury to normal tissues. The parameter δ specifies the fraction of patient where benefit and injury are statistically independent endpoints. For non-severe normal tissue endpoints a reduction operator may be applied on their individual response probabilities to consider their relative influence on the total treatment outcome. 4. Extraction of dose-response relations from clinical material The predictive strength of the different radiobiological models does not depend only on their capability of describing closely the radiotherapeutic biological mechanisms but also on the accuracy by which the radiobiological parameters of the models are known. The appropriate way to estimate those parameters is by using clinical materials with complete treatment and follow-up recordingI,II,43,49,51. This is a very complicated task because it depends on many factors that are not standardized among the different radiotherapy centers.
The shape of a dose-response relationship constitutes an association between the dose received by the tissue and the expression of a specified clinical effect45,64,65,109. The information concerning both radiation treatment and clinical outcome may be available for individual patients or for patient groups. The second case approximates the clinical practice where the clinical data (doses and follow-up results) are described in terms of average values for certain uniform groups of patients. Usually, a mean organ dose or DVH averaged over the patient group is used as the dose reference whereas the follow-up results are expressed as an incidence rate (number of events over the total patient population). This is the information that is used currently in the clinic where single doses inside the tissue (reference dose) is associated with a certain incidence rate. However, the use of a data reduction procedure always results in a loss in the information structure. In such an analysis, the use of the individual patient dose distributions and treatment
Determination and use of radiobiological response parameters in radiation therapy optimization
23
outcomes allow the variation of the inter-patient radiosensitivity or the volume effect of the tissue for a certain endpoint to be identified.
Modelling of normal tissue complication and tumour control requires reliable data from appropriately designed studies of specific clinical cases. This demand is met by studies based on retrospective data collection, which however may be subjected to potential methodological inaccuracies. Accurate assessment of the radiation exposure and treatment outcome are critical points in normal tissue complication and tumour control quantification and modelling. Although a considerable number of radiobiological models have been developed to describe the dose-response relations for different tumours and normal tissues, the precision and accuracy of the dosimetric (exposure) and the follow-up (outcome) information of the treatments have not been evaluated systematically. Generally, there is a lack of consistent revision of treatment related definitions and data measures used by the different models.
In the literature, many studies have determined dose-response relations and
tolerance doses for different tissues and clinical endpointsI,II,8,9. However, many of them are based on two-dimensional treatment plans and on approximate endpoint definitions and follow-up measures. Consequently, the development of models based on these data should be considered as approximative requiring the verification of the obtained results both in terms of the mathematical formalism of the models and of the estimated values of the model parameters. The quantification of dose-response relations from clinical material depends strongly on the accuracy of the clinical data used.
Radiobiological modelling is a complicated process even if the available clinical
data are accurate. This is because the available information usually covers only a limited part of the dose-response curve since the clinical data are derived from radiation treatments, which aim at achieving tumour control with minimum normal tissue complications (cf upper and lower diagrams of figure 5). This means that the part of the dose-response relation outside the region of the clinical data (therapeutical range) is based on the form of the model, which cannot be accurately verified by observations in that particular region. This limitation can be very important if these data are to be applied to other classical or modern intensity modulated treatment techniques, which may cover another dose range than that covered by the clinical data.
The dosimetric data (DVH or volumetric dose distribution) and the clinical outcome (clinical incidence or individual outcomes) are used as input in the determination of radiobiological parameters. Solely the dose distribution in the volume of interest is not sufficient to describe the effects of the radiation exposure. Radiobiological modelling should also include the influence of the applied fractionation schedule and the response type of the tissue to radiation (early or late). This information can be taken into account by applying the Biologically Effective Dose (BED) concept, which accounts for the isoeffect relationships in radiation therapy.
Determination and use of radiobiological response parameters in radiation therapy optimization
24
The final outcome of the modelling process is the determination of the model parameters (i.e. 50D , γ and s for the relative seriality model) for a specific clinical endpoint. These parameters determine the shape of the corresponding dose-response relation allowing the association of a certain dose distribution with the tissue complication or control probability. 4.1. Normal tissues
The manifestation of a specific radiation effect (complication for normal tissues) in a given tissue is known as clinical endpoint. Normal tissue endpoints are generally grouped in two categories. The first category is related to functional changes in the tissue (e.g. paralysis or death), which take place often over a narrow dose range and can be considered to be binary (presence or absence of the effect). In the second functional endpoint category extensive reactions or physiological changes (e.g. a degree of skin damage) are involved. These radiation effects cover a wide dose range since they are associated with non-fatal injuries of increasing, with dose, severity. The development of different radiation endpoints in the same tissue may depend on the eradication of different cell groups associated to different functionalities. The complication endpoints for normal tissues are generally classified as early or late and subjective or objective 117,127,132. Different radiotherapy centers apply different classification systems to record follow-up results 30,80,124,139. Such classification systems for normal tissue complications are the RTOG/EORTC and the LENT/SOMA107,125. The normal tissue complication endpoints are usually classified as binary or graded. Binary endpoints are related to increasing incidence rates with dose and not to increasing response intensity. On the contrary, graded endpoints consist of a number of data and symptoms (e.g. CT density measurements and diarrhea), which can be translated into graded responses.
Although the proper definition of the clinical endpoint is important from a clinical perspective it does not affect the basic process radiobiological modelling. This is because the estimated dose-response relation for a certain tissue is an association between the dose and the expression of the clinical endpoint irrespective of the definition and classification of this endpoint. However, the lack of a protocol based on well-defined and classified endpoints for the different normal tissues imposes strong limitations to the clinical introduction of the radiobiological models and to the comparison of treatment results between different clinics. In the derivation of radiobiological parameters from clinical material, a number of important factors have to be taken into account. Such a factor can be the identification of sources related to radiosensitivity variations. Usually, it is the effective dose-response
Determination and use of radiobiological response parameters in radiation therapy optimization
25
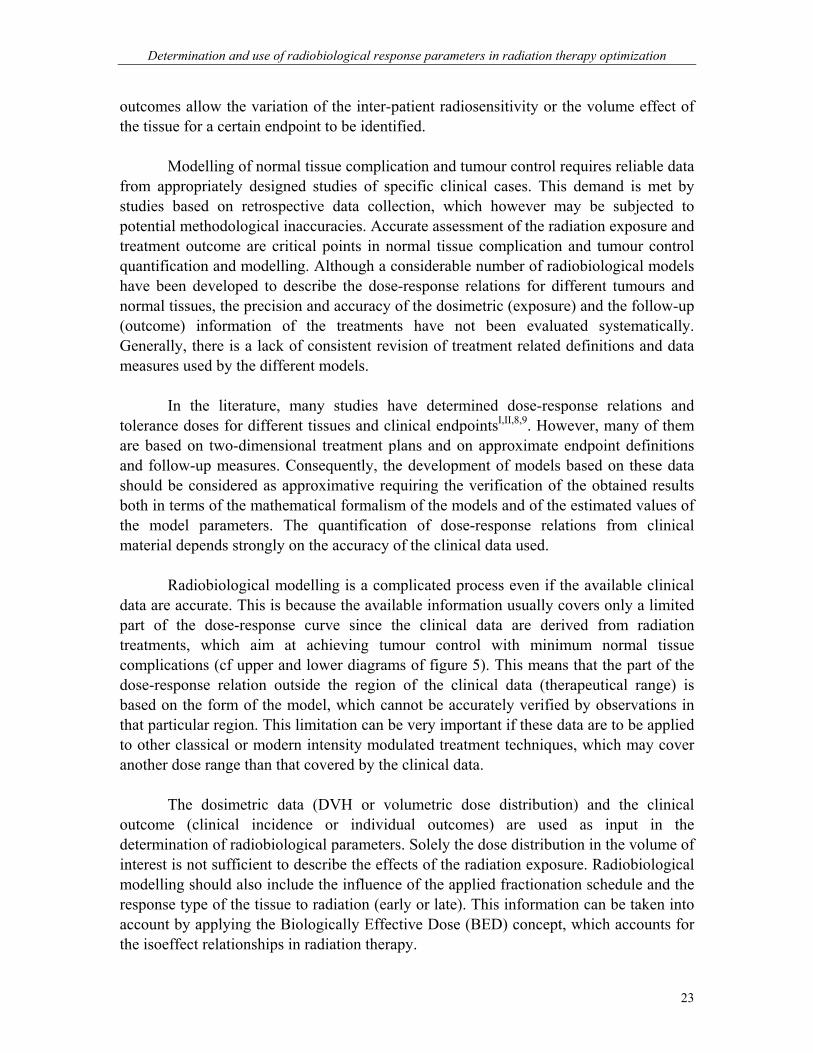
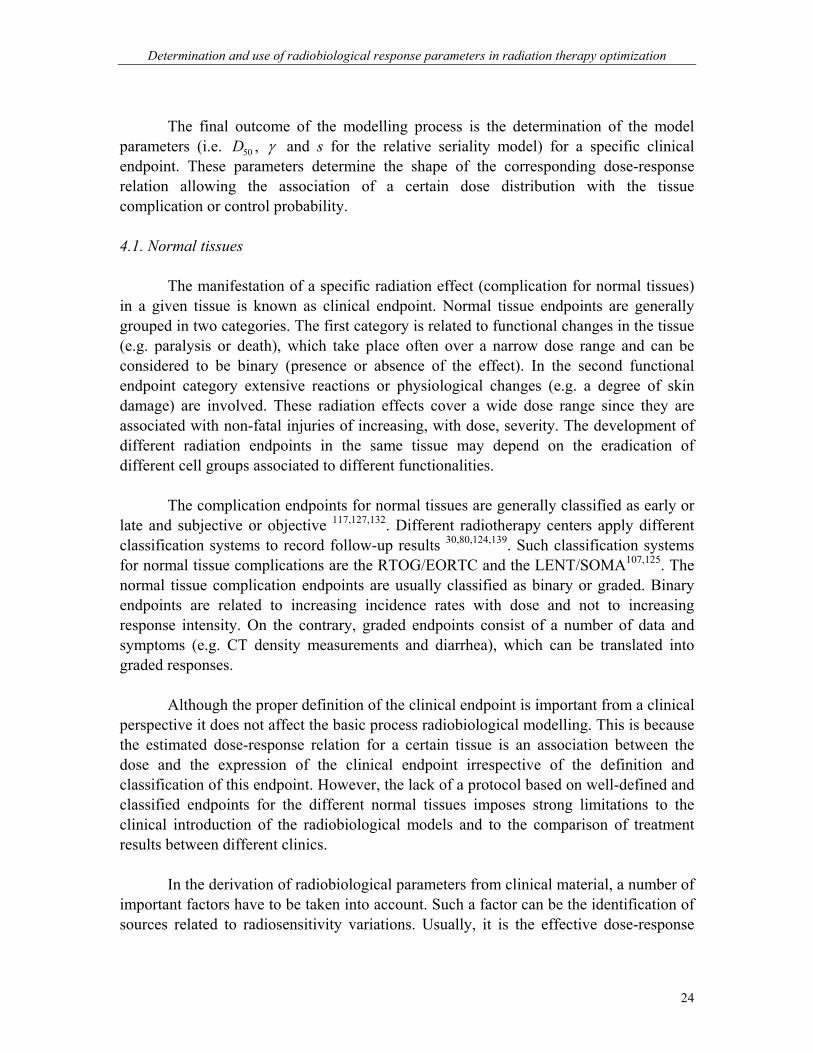
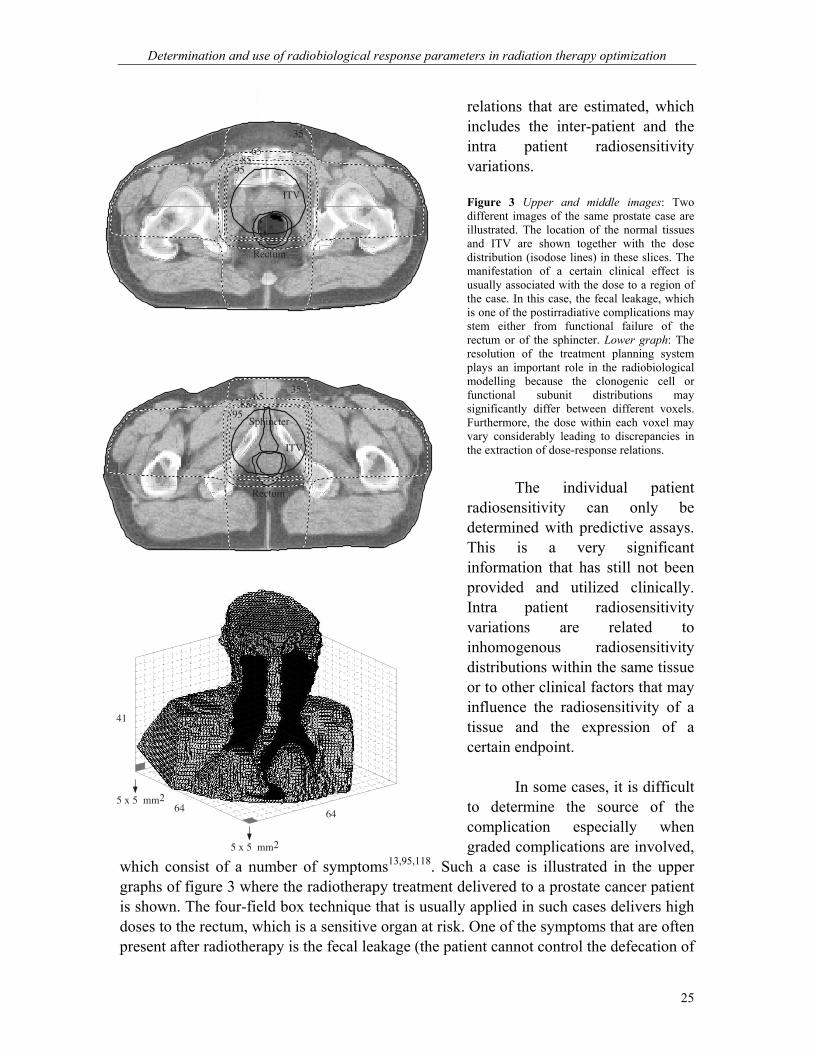
relations that are estimated, which includes the inter-patient and the intra patient radiosensitivity variations. Figure 3 Upper and middle images: Two different images of the same prostate case are illustrated. The location of the normal tissues and ITV are shown together with the dose distribution (isodose lines) in these slices. The manifestation of a certain clinical effect is usually associated with the dose to a region of the case. In this case, the fecal leakage, which is one of the postirradiative complications may stem either from functional failure of the rectum or of the sphincter. Lower graph: The resolution of the treatment planning system plays an important role in the radiobiological modelling because the clonogenic cell or functional subunit distributions may significantly differ between different voxels. Furthermore, the dose within each voxel may vary considerably leading to discrepancies in the extraction of dose-response relations. The individual patient radiosensitivity can only be determined with predictive assays. This is a very significant information that has still not been provided and utilized clinically. Intra patient radiosensitivity variations are related to inhomogenous radiosensitivity distributions within the same tissue or to other clinical factors that may influence the radiosensitivity of a tissue and the expression of a certain endpoint.
In some cases, it is difficult to determine the source of the complication especially when graded complications are involved,
which consist of a number of symptoms13,95,118. Such a case is illustrated in the upper graphs of figure 3 where the radiotherapy treatment delivered to a prostate cancer patient is shown. The four-field box technique that is usually applied in such cases delivers high doses to the rectum, which is a sensitive organ at risk. One of the symptoms that are often present after radiotherapy is the fecal leakage (the patient cannot control the defecation of
Rectum
ITV
35
6585
95
3565
8595
Rectum
ITV
Sphincter
41
64 64
5 x 5 mm2
5 x 5 mm2

Determination and use of radiobiological response parameters in radiation therapy optimization
26
the bowel). However, it is not clear if this symptom stems from radiation induced functional inhibition of the rectum or injury to the sphincter. Another such symptom is the frequent defecation urgencies of the patient for. Other factors related to the derivation of radiobiological parameters are the imaging information and the resolution of the imaging and dose delivery used. The accuracy by which the tissues are defined and the planned dose is delivered is primary importance. For example, the exact position and shape of the tissue (e.g. esophagus or rectum) should be known in all parts of the radiotherapy treatment. During treatment planning, the patient is simulated by a voxel representation as shown in the lower graph of figure 3. In each voxel a number of clonogenic cells for the tumours or FSUs for normal tissues and a dose value are assigned. The size of the voxels is a significant factor since the actual number of tumour cells or FSUs may significantly vary between different voxels and the dose distribution within each voxel may not be accurately represented by a single value. This detail may affect the accuracy by which estimated associations between dose and clinical effect are derived from clinical trials. Consequently, high resolution imaging and treatment modalities are desirable for the extraction of clinically valid dose-response relations. 4.2. Tumours or AVMs Contrary to the difficulties in defining the clinical endpoint of the treatment for normal tissues, the treatment outcome for tumours is a clear-cut (control or recurrency). The major difficulty in modelling the response of tumours and AVMs is their volume definition48,110,149. Although there are issued guidelines and recommendations (ICRU and NACP reports) the clinical practice differs between different radiotherapy centers18,31,63,77-79,131. This imposes a significant restriction in the comparison of different studies concerning the radiobiological modelling of similar tumours. Especially for the AVM case, the deviation of the estimated AVM volume from the actual one is large because of the standard two projection imaging technique used128,135,136.
Many studies have been carried out to determine the dose-response relations of different targets (tumours or AVM)46,56,66,67,76,96,97,121,123,137,142,150. However, most of these studies suffer from the last of critical information that would allow an even closer estimation of the dose-response relations of different targets and improvement of the mathematical formalism of the different radiobiological models. Such information should be the accurate determination of the hypoxic fraction of many tumours, the factors affecting the radiosensitivity of different targets (like the size and location) and the spread and density of the target cells to be eradicated.

Determination and use of radiobiological response parameters in radiation therapy optimization
27
Figure 4. Upper diagrams: The mean dose volume histograms of the patients with and without radiation effects for normal tissue and target (tumour or AVM) radiobiological modelling. It is apparent that the affected tissues received a higher integral dose in comparison to the non-affected ones. The mean and maximum or minimum doses respectively of the different patient groups are also provided. Middle diagrams: The hyper-surfaces of the corresponding log-likelihood spaces, which were used to calculate the uncertainties of the model parameters. The solid line represents the iso-surface that corresponds to the 68% probability of deviation from the maximum value of the likelihood. The hyper-
Log-Likelihood Hypersurface
logL
0.0
0.2
0.4
0.6
0.8
P
0 10 20 30 40 50 D / Gy
22.9 1.25
0.00
0.02
0.04
0.06
0.08
0.10
0.12
V/V0
10 15 20 25 30 35 40D / Gy
Obliterated AVMs
Non-obliteratedAVMs
Log-Likelihood Space
logL
50 60 70 80 90 D / Gy0.0
0.2
0.4
0.6
0.8
P
70.8 4.0 0.02
Determination and use of radiobiological response parameters in radiation therapy optimization
28
surface shows how the logarithm of the maximum likelihood function changes in the region around the best estimates of the radiobiological parameters. For the normal tissue case, the hyper-surface was calculated using the best estimate of s while varying the rest of the model parameters. The maximum point of the diagram corresponds to the best estimate of the parameters (maximum of the log-likelihood function). From the actual hyper-volume of the log-likelihood function (it is calculated using all the possible combinations of parameter values) the confidence interval of the estimated radiobiological parameters is calculated. Lower diagrams: The best estimates of the dose-response curves of the tissue are shown together with their 68% confidence intervals (defined by the thick lines). For the normal tissue case, a bundle of dose-response curves was derived from combinations of 50D and γ values (s was fixed to its best estimate) lying within their calculated confidence interval of 68%. The range in each case constitutes the confidence interval of the tissue survival curve representing mainly the variation of the inter-patient radiosensitivity and dosimetric discrepancies between the calculated and the delivered dose. 4.3. Statistical analysis The determination of the best estimates of the model parameters is done by fitting the radiobiological model to the clinical data (dose distributions, follow-up results). The shape of a dose-response relation is usually sigmoid, depending on the model used, and it is determined by the model parameters. The fitting method that is most often applied is the Maximum Likelihood method (denoted here as L)51,55,61. This method is applied on the data of each individual patient. Generally, a model that predicts the induction of a radiation effect consists of one set of parameters (model dependent, denoted as X
r)
describing the tissue radiosensitivity and one set of parameters describing the individual treatment effectiveness (dose distribution, denoted as θ
r). Given a set of N patients whose
treatment outcome is denoted as r (for simplicity it can be assumed a binary classification of the outcome, i.e. 1r = if the patient responds to the treatment and 0r = if the patient does not). The probability that a group of N patients manifests the observed outcome is mathematically expressed by the following formula.
( ) ( ) ( )( )1
1
| | 1 |N rr ii
i ii
L X P X P Xθ θ θ−
=
= ⋅ −∏r r rr r r
(22)
The same equation can be expressed in the following way:
( ) ( ) ( )( )1 1
| | 1 |m n
i ji j
L X P X P Xθ θ θ= =
= × −∏ ∏r r rr r r
(23)
where m and n represent the fractions of those patients who developed the radiation effect and those who did not, respectively. The best estimates of the parameters are those that maximize the value of the likelihood function. The value of L corresponds to the probability that the model reproduces the observed pattern of treatment outcome.

Determination and use of radiobiological response parameters in radiation therapy optimization
29
Figure 5. Upper diagram: The dose-response curve produced using the estimated radiobiological parameters and the relative seriality model (solid line) is shown for a normal tissue case. The unit of the dose axis is the biologically effective uniform dose, D . By using this dose unit the position of every patient of the study population can be found on the theoretical response curve (black circles for the patients with complications, white circles for the complications-free patients). A bin of 1 Gy around the D value of 66 Gy is observed where 2 patients of the 8 that lie in this region had complications (25.0%) The expected complication rate of those patients is 22.7%, which is fairly close to the clinical observation regarding the small number of patients selected. This was expected since the parameter values used were derived from the same study population. However, it is shown how these parameters should be applied in the clinic and how one could check if some published parameters are suitable for his treatment technique. Middle diagram: Using the estimated model parameters to calculate the expected complication probabilities of the patients and ordering them as in the upper diagram of the figure, a ROC curve could be constructed using different cutoff thresholds and calculating the corresponding TPR and FPR values. The area under the curve indicates a good agreement between the expected and the observed complication data. Lower diagram: The dose-response curve derived using the linear-Poisson model for an AVM case is shown. On the same diagram the points of the control probability of each patient have been drawn. Those points were calculated using the individual dose distribution delivered to each patient and the model parameters that were calculated. Several studies, which determined dose-response relation, using individual dose distributions and follow-up data, based on the maximum likelihood method. In this work, the search for the parameter values was performed by means of a minimization package, MINOS, which has been used in
0.0
0.1
0.2
0.3
0.4
P
55 60 65 70
PredictedComplications
Follow-upObservations
25.0%22.7%
0.0
0.2
0.4
0.6
0.8
P
50 60 70 80 90
0.0
0.8
0.2
0.6
0.4
TPR
0.0 0.2 0.4 0.6 0.8 FPR
Area under the curve = 0.8
TPR = FPR
ROC curve
0.0
0.2
0.4
0.6
0.8
P
10 15 20 25 30 35 40 45
PredictedObliterations
Follow-upResults
Determination and use of radiobiological response parameters in radiation therapy optimization
30
several other applications dealing with optimization problems101. MINOS uses a number of minimization strategies in order to convergence to the global minimum. However, this is not always guaranteed and a local minimum may instead be found. This can be overcome by using different starting values and investigating different regions in the parameter space. Usually, constrains are imposed on the estimated parameters to keep the parameters within clinically meaningful intervals.
The parameters estimated by modelling of tissue responses can be applied on the dosimetric data of an independent patient group to determine the corresponding response probabilities. The predicted response probability is associated with an uncertainty, which depends both on the clinical data and on the radiobiological model. The determination of the parameter uncertainties can provide information concerning the reliability of the model in describing the clinical data120. However, their interpretation is complicated due to the inevitable inherent uncertainties characterizing the input data sets and the intentionally limited interval of the dose-response curve that is covered by those data. In practice, a more relevant measure of the quality of the fit of the resulting parameter sets is obtained from the calculation of the uncertainties on the predicted response probabilityI,37,52,140.
As it is shown in figure 4, the appropriate way of quantifying the uncertainties of
the radiobiological parameters is by using the hyper-volume of the parameter space. In this figure, the information flow for determining dose-response relations of normal tissues and tumours is illustrated. In the upper diagrams, the treatment data in the form of individual DVHs and the follow-up results in terms of presence or absence of the radiation effect are taken into account (for demonstration purposes, the mean DVHs are used here). Subsequently, the parameter uncertainties are determined from the hyper-volume or the hyper-surface of the log-likelihood space. This is the most accurate way for pathological and non-linear functions as in these cases. Finally, the combined influence of the parameter uncertainties on the dose-response relations is applied providing the confidence intervals, which are important for their clinical use.
The validity of the calculated parameters can be examined by applying them to
other independent study materials. This way, the sets of parameters determined for a certain model can illustrate the clinical utility of the biological modelling and their clinical accuracy can be estimated. In figure 5 a statistical verification of estimated dose-response relations is illustrated. It can be seen that the predicted complications and control for the normal tissue and the target respectively are very close to the follow-up results for groups of patients receiving similar doses. The normal error distribution, the Pearson�s test and the ROC curves are three statistical methods widely used for evaluation of the clinical relevance of such data.
Doses within a certain dose-bin in figure 5 may refer to a certain classical
treatment technique. For such a technique only this part of a dose-response curve is of

Determination and use of radiobiological response parameters in radiation therapy optimization
31
interest. On the contrary, modern intensity modulated treatments require the information of the whole curve to evaluate the biological effectiveness of their strongly inhomogeneous dose distributions. Separate dose-response curves can be used for patient subgroups that have special characteristics influencing their response to dose. Further independent studies using the same tissue delineation method and clinical endpoint definition can be used to support the validity of the estimated data. 5. Treatment planning
One of the most important objectives of treatment planning is to deliver maximum dose to the tumour and minimum dose to the surrounding tissues. In addition, high dose within the tumour volume and sparing of critical organs are important considerations in judging a plan. Some of the useful strategies in achieving these goals are: a) using fields of appropriate size; b) increasing the number of fields or portals; c) selecting appropriate beam directions; d) adjusting beam weights (dose contribution from individual fields); e) using appropriate beam energy; and f) using beam modifiers such as wedge filters and compensators. Although obtaining a combination of these parameters and yielding an optimal plan is time consuming if done manually, treatment-planning computers that are available presently can carry out this task quickly and accurately. Some of these systems are highly interactive so that the user can almost instantly modify, calculate and examine various plans in order to select the one that is clinically superior.
Reduction of dose to subcutaneous tissue and normal tissue surrounding the tumour can be achieved by using a combination of many fields. By using multiple fields, the ratio of the dose to the tumour against the normal tissue dose, namely the therapeutic window, is increased. In actual practice, one may use a combination of parallel-opposed fields and multiple fields to achieve the desired dose distribution. Although multiple fields can provide good distribution, there are some clinical and technical limitations to these techniques. For example, certain beam angles are prohibited because of the presence of critical organs in those directions. Also, the setup accuracy of a treatment may be better with parallel opposed than with the multiple angled beam arrangement. It is therefore important to realize that the acceptability of a treatment plan depends not only on the planned dose distribution in the patient but also on the practical feasibility, setup accuracy, and reproducibility of the treatment technique.
The concept of an �optimum plan� is possibly misleading since it only has
meaning when the optimization criteria are specified. For example, from a purely practical viewpoint, an optimum treatment could be that with very few fields which can be executed quickly. An optimum plan for a given machine may not necessarily be the optimum if one could replace that machine with a different one, perhaps with different energy. However, when physicists speak of optimization what they generally mean is a method to achieve the best outcome for the patient in terms of predicted tumour control

Determination and use of radiobiological response parameters in radiation therapy optimization
32
and normal tissue complications and often these are reflected in the goal to obtain the best 3D dose distribution.
The physical optimization of a treatment plan, namely the optimization of the
physical quantities such as the dose distribution or the beam angles etc, can be demonstrated in many ways. Either through the isodose lines and the isodose surfaces (figure 6, upper left) or through the Dose Volume Histograms (DVH) (figure 6, middle left) of the treatment plans under evaluation. However, all of them carry similar information since they are derived from the spatial dose distribution in the patient, which is the fundamental information.
The isodose lines (or surfaces) are lines (or surfaces) passing through points of
equal dose. The lines are usually drawn at regular intervals of absorbed dose and expressed as a percentage of the dose at a reference point. The dose volume histograms are also based on the dose matrices where the information of the volumetric or planar variation in absorbed dose distribution has been stored. Each voxel of the dose matrix is given a weight proportional to the volume of this voxel. By summing up all the voxels having the same dose value the dose volume histogram builds.
The biological optimization of a treatment plan is carried out through the
biological objectives that are set by the physicist and the physician. In this work, the P+ objective, namely the complication free tumour control probability has extensively been used. P+ is a very good quantifier of the treatment plan since it describes the combined effectiveness of the plan in terms of tumour control and normal tissue complications. When comparing different plans using the biological optimization the one with the highest P+ value is the plan with the least expected complications for the same probability of tumour control or in other words is the plan with the highest control probability for the same risk of complications.
In order to apply the biological optimization both the physical information,
meaning the dose distribution or the dose volume histograms, and the biological information, meaning the radiobiological parameters of the involved organs, of the different treatment plans are needed. The information flow in the process of the biological optimization is illustrated in figure 6. On the left side of the figure, the flow of the physical data is illustrated. The volumetric absorbed dose distribution is used for the calculation of the isodose charts (upper left graph) and subsequently the dose volume histograms, (middle left diagram). On the right side of the figure, the radiobiological parameters of the organs (upper right table) involved in the clinical case are used by the model, which calculates their response probabilities for a range of doses, (middle right diagram). The physical and biological data are then combined to calculate the response probabilities for the dose distribution of the certain treatment plan, which in other words is called the radiobiological evaluation of the plan (lower diagram).

Determination and use of radiobiological response parameters in radiation therapy optimization
33
65.0
60.0
57.0
63.8
55.0
2.76
2.60
6.70
2.50
3.00
---
---
1.00
0.64
1.00
Tissue Stroma
Brain
Spinal Cord
Organs at Risk
Gross Tumour
Lymph Nodes
Targets
sD50
sD50
6 MV
Tissue Stroma
GT
LN
30
SC
5070
90100
head & neck case - 6 conformal photon fields
0.8
0.6
0.4
0.2
0.0
P
0 50 100 150
TS BR SC LN GT
0.8
0.6
0.4
0.2
0.0
V/V0
0 20 40 60 D/Dmax / %
dose volume histograms
0.8
0.6
0.4
0.2
0.0
P
706040 50 D / Gy80 90
dose response relations
GT
LN
BR
SC
TS
Figure 6. The flow of the physical and biological data in the radiobiological treatment plan optimization. From the dose plan of a certain treatment configuration, the dose volume histograms of the involved targets and normal tissues are extracted. This information is then combined with the biological information characterizing these organs and the evaluation of the plan based on the P+ index is carried out. One should notice how the shape of the dose-response curves change from the situation of uniform irradiation (middle right diagram) to the irradiation with the dose distribution under study (lower diagram). The radiobiological optimization of the treatment plan is carried out here in terms of dose level.

Determination and use of radiobiological response parameters in radiation therapy optimization
34
5.1. Fractionation correction Usually, the calculated radiobiological parameters describing the dose-response relation of an organ refer to a certain uniform dose per fraction. Consequently, the dose delivered to the patients has to be corrected to this dose per fraction before deriving these parametersI,16,47,93,134. The same procedure has also to be followed during the radiobiological evaluation of a treatment plan. When the treatment technique is simple, meaning one treatment configuration for all the fractions, the application of fractionation correction is straightforward. However, in complex field irradiations where two or more different treatment configurations are applied in different fractions, the fractionation correction is more complicated. In such cases, the different treatment arrangements should be corrected separately for the fractionation effects and then be combined to produce the summed dose distribution. To apply the fractionation correction after the summation of the different dose distributions can introduce significant errors in the calculated dose. In figure 7, it is shown that for the spinal cord this effect was significant because the delivered dose to this structure from the two field arrangements differed considerably. However, for the esophagus this effect was negligible since the dose distributions produced by the two dose plans were very similar. Consequently, the application of the appropriate fractionation correction on the dose volume histograms has to be considered seriously.
In this study, the fractionation correction was applied using the linear-quadratic model. Although this model is accurate for large doses it has not been validated for doses lower than 1 Gy. Consequently, the correction may be approximative in this dose region, which is more relevant to normal tissues. There are many indications that at this dose level the different tissues present a hypersensitivity and a modification of the classical formalism of the linear-quadratic model has to be made to account for this effect25.
Sum of the plans withoutfractionation correction
Fractionation correctionafter plan summation
Fractionation correctionbefore plan summation
D / Gy0 10 20 30 40 50
Plan 1Plan 2
Spinal Cord
0.0
0.2
0.4
0.6
0.8
V/V0
Sum of the plans withoutfractionation correction
Fractionation correctionbefore and after plan summation
Plan 1 Esophagus
0.0
0.2
0.4
0.6
0.8
V/V0
D / Gy0 10 20 30 40 50 60
Plan 2
Figure 7. Illustration of important features of fractionation correction in cases where different treatment configurations are delivered in different fractions producing a complex treatment plan. For the case of the spinal cord, the left diagram shows the cumulative dose volume histograms of the two treatment configurations and their combination: a) without any fractionation correction of the combined plan; b) with fractionation correction of the combined plan to 2 Gy per

Determination and use of radiobiological response parameters in radiation therapy optimization
35
fraction; and c) with fractionation correction of the separate plans to 2 Gy per fraction before the are combined. The last way is the correct one to make the fractionation correction and from the diagram it can be seen that it can have a significant effect in the final dose volume histogram. In the case of esophagus (right diagram), it is shown that making the fractionation correction before or after the combination of the treatment configurations does not have a significant effect because the two plans produce very similar dose distributions in the esophagus. 5.2. Volume overlapping
Another point to be considered in treatment planning is that of the accurate calculation of the different dose volume histograms in a clinical case. This is a problem that usually appears when the gross tumour and the lymph nodes are considered as different targets or when the microscopic spread covers part of an organ. Generally, a TPS calculates the dose volume histogram for an organ from the part of the dose matrix that is surrounded by the outer outline of the organ. However, in almost all of the cases the gross tumour is inside the lymph node volume. So, to get the true dose volume histogram of the lymph nodes, the doses that are attributed to the gross tumour have to be subtracted from the lymph node DVH provided by the TPS. The same has to be done with the body structure of the patient. The DVHs of all the organs and targets have to be subtracted from the DVH of the body structure since every other organ lies inside it. Although this problem may seem trivial, it is present in most treatment planning systems. It is present in the visual evaluation of treatment plans when using DVHs and it will be present, if not taken care, in a radiobiological evaluation of treatment plans that uses this information from the TPS.
Generally, it is not possible to add or subtract DVHs apart from the case where
one structure covers totally the other structure, which is the case mentioned above. This is because DVHs do not preserve the spatial information of the dose distribution. So, eventual additions or subtractions will not take place at the same point of the dose matrix.
When the microscopic spread covers part of an organ then another procedure has to be followed. The overlapping volume has to be attributed to both of the structures since there is a mixture of functional subunits and clonogenic cells in this volume. However, for both of them a density factor has to be applied to attribute the right proportion of the volume to the right structure. This can only be done by using the dose matrix throughout the evaluation procedure. 5.3. Clinical aspects of the target and risk volumes In clinical practice of radiation therapy, the concept of Planning Target Volume (PTV) is most often used to define the volume to be eradicated. According to ICRU report 5058 definition, the PTV is not defined in the local patient coordinate system and therefore does not strictly represent a volume in the patient. The PTV is defined for a given treatment technique and since it is used for beam selection it is most closely related

Determination and use of radiobiological response parameters in radiation therapy optimization
36
to the treatment unit coordinate system. Therefore, PTV is used as a practical concept for selecting planning contours in multiple beam irradiation techniques. The fact that the PTV is defined for a given treatment technique is a significant limitation since many different treatment configurations are usually examined in treatment planning, which means that for each one of them a different PTV has to be drawn.
The use of the Internal Target Volume (ITV) concept, instead of the PTV, is based on the fact that it is independent of the applied treatment techniqueVII,11,24,59.98. The ITV is defined by the outer boundary of the anatomically adjusted Internal Margins (IM) of the Clinical Target Volume (CTV). These IMs must be added to the CTV to compensate for expected physiological movements and variations in size, shape and position of the CTV during therapy in relation to an internal reference point and its corresponding coordinate system. The IM commonly asymmetric around the CTV is intended to compensate for all movements and all variations in site, size and shape of the organs and tissues contained in or adjacent to the CTV. They may result, e.g. from respiration, different fillings of the bladder, different fillings of the rectum, swallowing, heart beat, movements of the bowel. These internal variations are thus basically physiological ones, and they result in changes to the CTV. They cannot be easily controlled. They do not depend on external uncertainties in beam geometry, but could depend on patient day-to-day setup. The ITV therefore accounts for the movements of the CTV inside the local patient coordinate system. This volume contains or has a high probability of containing the CTV, and thus the target tissues, throughout all treatment sessions. Therefore, the ITV is the volume in the patient, which should receive the prescribed dose with a high degree of probability. Each CTV has its own ITV. The ITV is a geometrically defined volume fixed in the local patient coordinate system and it is specified in relation to internal and external reference points, which preferably should be rigidly related to each other through bony structures.
Although ITV is the volume that should be irradiated with the prescribed dose,
Setup Margins (SM) should also be added to account for uncertainties in the positioning of the patient and inaccuracies in the alignment of the therapeutic beams between dose planning and patient irradiation through all treatment sessions. These SMs are external margins, which account for the relative movement of the local patient coordinate system and thus the ITV in relation to the radiation beams. The SMs are considered during treatment planning to ensure that the prescribed dose is really delivered to the whole ITV. The SMs for different beams have to be defined separately and in general they depend on the treatment technique39. The SM has to be accounted mainly for uncertainties in (i) patient positioning (inter-fractional movements), (ii) movements of the patient during each treatment fraction (intra-fractional movements) and (iii) dose planning and treatment technique through the geometrical resolution of the treatment planning system. SMs are not included in the ITV. The SMs are defined in the treatment unit coordinate system as margins to be added to the beams to account for the uncertainty in beam patient

Determination and use of radiobiological response parameters in radiation therapy optimization
37
alignment. The setup uncertainty may be determined clinically by portal verification techniques.
ITV
Lung
Tissue Stroma
ITV
LungTissue Stroma
1030
5070
90100
ITV
Lung
Tissue Stroma
PTV
10
305070
90100
20100
90Lung
Tissue Stroma
ITV
PTV
z / mmy / mm
fP
y / mmz / mm
fP+B
-20 -15 -10 -5 0 5 10 15 20
0.02
0.04
0.06
0.08
f (y)
0.00
Positioningdistribution
CC direction
z / mm
0.02
0.04
0.06
0.08
f (y)
0.00-20 -10 0 10 20
Positioning distribution
AP direction
Breathing distribution
Convolution
y / mm
PTV
PRV
ITV
IRV
SM
SM
ITV
IRV
AP - direction
Figure 8. The treatment techniques that are usually applied in the breast cancer cases of resection-negative node involvement (left graph) and of ablation (right graph) are demonstrated in a 3-dimensional view. In these graphs, the geometrical relation between the irradiating beams and the patient is shown. This geometrical relation influences strongly the effect of the patient setup errors and the breathing effects on the delivered dose distribution. The joint 3-

Determination and use of radiobiological response parameters in radiation therapy optimization
38
dimensional uncertainty distributions imposed by patient setup errors and breathing effects are composed by the separate error distributions in the anteroposterior (AP) and the craniocaudal (CC) directions. The distribution in the AP direction is the result of a convolution of the patient positioning and breathing uncertainties. In the schematic presentation of the different volumes and margins, it is shown that the Setup Margins are different for the two treatment techniques.
The Internal Risk Volume (IRV) is defined by the outer boundary of the anatomically adjusted Internal Margin of the Risk Volume (RV) and therefore it accounts for the movements of the RV in the local patient coordinate system. The IRV is a geometrically defined volume fixed in the local patient coordinate system and it is specified in relation to internal and external reference points.
The relations between the different clinical volumes presented are demonstrated
in figure 8 where the treatment techniques of two different clinical cases related to breast cancer are shown19,50,57,108,116,119. The CTVs and consequently the corresponding ITVs are different between the two cases. However, for each on them, a number of different treatment plans have to be produced before the best one is selected. In these plans the ITVs are the same (since ITV is defined in the local patient coordinate system) whereas the PTVs are different since different treatment configurations are generally associated with different setup margins. In figure 8, even though the ITVs of the two cases are different, the influence of the beam geometry on the PTV definition is well demonstrated. The same statement holds also for the risk volumes. According to this analysis it is apparent that the definition of the different clinical volumes before treatment planning is not a simple task. It seems that is more appropriate the ITVs and IRVs to be drawn from the oncologists since they have a better insight of the CTV and the involved organ motions whereas the corresponding PTVs and PRVs to be drawn from the medical physicists since they are more involved with the applied treatment configuration and the related setup errors.
5.4. The biologically effective uniform dose ( D ) concept
For the evaluation of a treatment plan, the mean dose of the dose distribution delivered to the tumour or the ITV and its standard deviation are mainly used clinically. However, these data do not take into account the biological characteristics of the tumour. On the other hand, when different plans are compared to be classified one cannot also compare the effect of the treatment to the rest of the organs by using the mean dose to the tumour because the comparison does not use a common basis for all the plans.
Solutions, to this problem of dose prescription and reporting, have been
recommended by many scientists38,62. One of them is the effective uniform dose effD proposed by Brahme in the Nordic Association of Clinical Physics11,20,23,24. The

Determination and use of radiobiological response parameters in radiation therapy optimization
39
mathematical expression of effD for one tumour or one normal tissue is given by the following formulae respectively.
( )2
B,eff 12
D DDP D
γ σ = −
, ( )( )
2
I,eff 12 1
D DDP D
γ σ = + − (24)
where D is the mean delivered dose γ is the slope of the tissue dose-response curve,
/ Dσ is the relative standard deviation and ( )P D is the probability of local control or complication at the dose level D . These expressions show clearly that the effective dose decreases below D for tumours (or increases above D for normal tissues) as soon as the relative standard deviation of the dose distribution increases. Another similar concept, which was introduced by Niemierko35,102 is the equivalent uniform dose (EUD), which assumes that any two dose distributions are equivalent if they cause the same radiobiological effect in terms of controlling a tumour.
( ) ( )refref 2 2
1
1EUD ln lnN
D Di
iD SF SF
N =
=
∑ (25)
where refD (= 2 Gy) is the dose to which the surviving fraction 2SF is related. N is the number of dose calculation points. Both of these suggestions provide the biological information in the dose reporting, which was absent in the past. Moreover, they provide a fairly common base for all the treatment plans under comparison. That is because the response of the tumour has an almost monotonic relationship with each of these two concepts and depends only on the radiobiological parameters of the tumour. This way in a Response/( effD , EUD) diagram if one uses the same control probability for two plans, the response probabilities of the normal tissues give an indication on which of the plans is superior. However, both of them have limitations that can become important under certain conditions and none of these concepts can deal with a case that involves more than one target or organ at risk (in case the focus goes to the complications). The latter problem was studied in Mavroidis et alVII where the mathematical expressions of effD and EUD were generalized to deal with multiple target or normal tissue cases.
The biologically effective uniform dose ( D ) that was introduced in Paper VII is the dose that causes the same tumour control or normal tissue complication probability as the real dose distribution on a complex patient-caseV,VI,VII. This is based on the assumption that any two dose distributions are equivalent if they cause the same probability for tumour control or normal tissue complication.
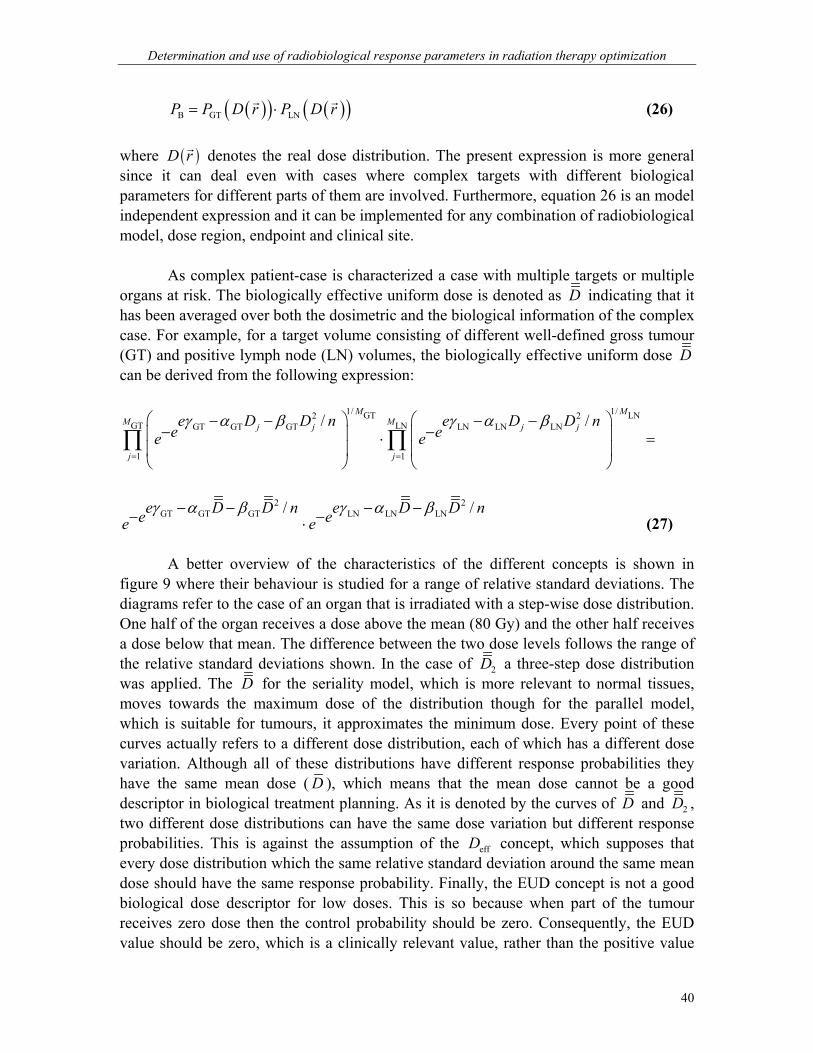
Determination and use of radiobiological response parameters in radiation therapy optimization
40
( )( ) ( )( )B GT LNP P D r P D r= ⋅r r (26)
where ( )D rr denotes the real dose distribution. The present expression is more general since it can deal even with cases where complex targets with different biological parameters for different parts of them are involved. Furthermore, equation 26 is an model independent expression and it can be implemented for any combination of radiobiological model, dose region, endpoint and clinical site.
As complex patient-case is characterized a case with multiple targets or multiple
organs at risk. The biologically effective uniform dose is denoted as D indicating that it has been averaged over both the dosimetric and the biological information of the complex case. For example, for a target volume consisting of different well-defined gross tumour (GT) and positive lymph node (LN) volumes, the biologically effective uniform dose D can be derived from the following expression:
1/ 1/GT LN2 2GT LNGT GT GT LN LN LN
1 1
/ /M M
M Mj j j j
j j
e D D n e D D ne ee e
γ α β γ α β
= =
− − − −− − ⋅ =
∏ ∏
2 2
GT GT GT LN LN LN/ /e D D n e D D ne ee eγ α β γ α β− − − −− −⋅ (27)
A better overview of the characteristics of the different concepts is shown in figure 9 where their behaviour is studied for a range of relative standard deviations. The diagrams refer to the case of an organ that is irradiated with a step-wise dose distribution. One half of the organ receives a dose above the mean (80 Gy) and the other half receives a dose below that mean. The difference between the two dose levels follows the range of the relative standard deviations shown. In the case of 2D a three-step dose distribution was applied. The D for the seriality model, which is more relevant to normal tissues, moves towards the maximum dose of the distribution though for the parallel model, which is suitable for tumours, it approximates the minimum dose. Every point of these curves actually refers to a different dose distribution, each of which has a different dose variation. Although all of these distributions have different response probabilities they have the same mean dose ( D ), which means that the mean dose cannot be a good descriptor in biological treatment planning. As it is denoted by the curves of D and 2D , two different dose distributions can have the same dose variation but different response probabilities. This is against the assumption of the effD concept, which supposes that every dose distribution which the same relative standard deviation around the same mean dose should have the same response probability. Finally, the EUD concept is not a good biological dose descriptor for low doses. This is so because when part of the tumour receives zero dose then the control probability should be zero. Consequently, the EUD value should be zero, which is a clinically relevant value, rather than the positive value
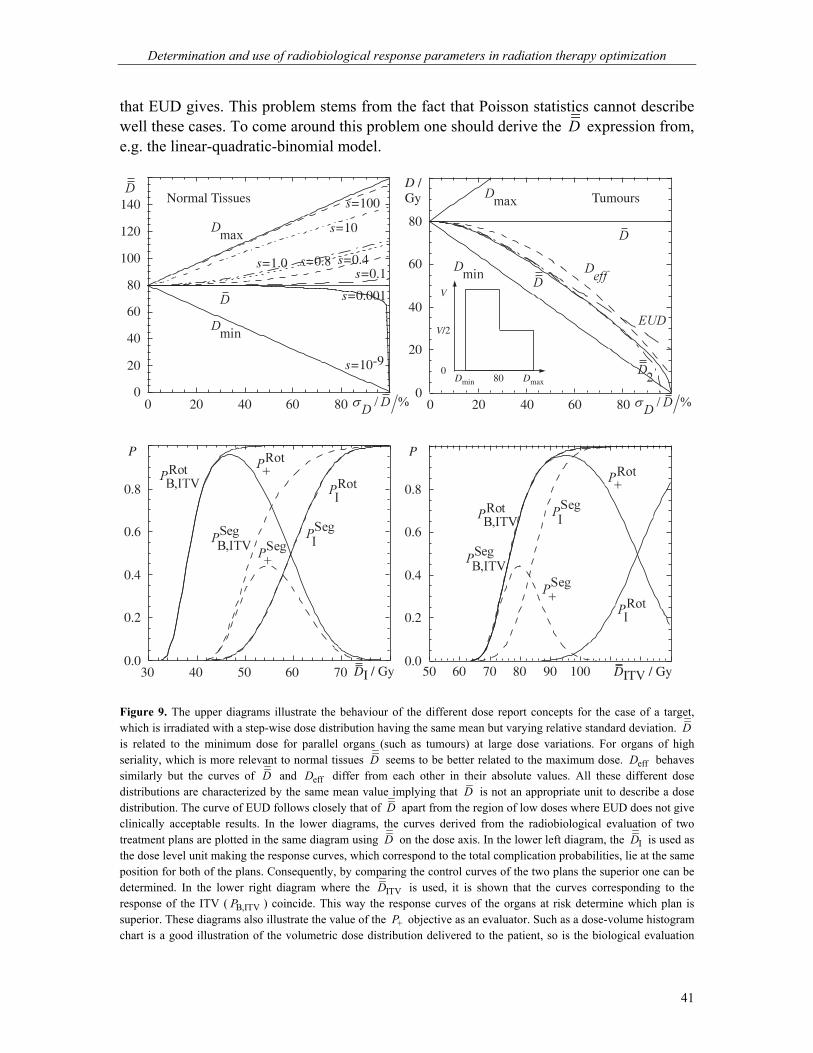
Determination and use of radiobiological response parameters in radiation therapy optimization
41
that EUD gives. This problem stems from the fact that Poisson statistics cannot describe well these cases. To come around this problem one should derive the D expression from, e.g. the linear-quadratic-binomial model.
0
20
40
60
80
100
120
140
0 20 40 60 80
s=0.4s=0.8s=1.0
Normal Tissues
s=0.001
s=10-9
s=0.1
s=10
s=100
0
20
40
60
80
D /Gy
0 20 40 60 80
Tumours
80Dmin Dmax
V
V/2
0
0.0
0.2
0.4
0.6
0.8
P
50 60 70 80 90 DITV / Gy10030 40 50 60 70 DI / Gy0.0
0.2
0.4
0.6
0.8
P
Figure 9. The upper diagrams illustrate the behaviour of the different dose report concepts for the case of a target, which is irradiated with a step-wise dose distribution having the same mean but varying relative standard deviation. D is related to the minimum dose for parallel organs (such as tumours) at large dose variations. For organs of high seriality, which is more relevant to normal tissues D seems to be better related to the maximum dose. effD behaves similarly but the curves of D and effD differ from each other in their absolute values. All these different dose distributions are characterized by the same mean value implying that D is not an appropriate unit to describe a dose distribution. The curve of EUD follows closely that of D apart from the region of low doses where EUD does not give clinically acceptable results. In the lower diagrams, the curves derived from the radiobiological evaluation of two treatment plans are plotted in the same diagram using D on the dose axis. In the lower left diagram, the ID is used as the dose level unit making the response curves, which correspond to the total complication probabilities, lie at the same position for both of the plans. Consequently, by comparing the control curves of the two plans the superior one can be determined. In the lower right diagram where the ITVD is used, it is shown that the curves corresponding to the response of the ITV ( B,ITVP ) coincide. This way the response curves of the organs at risk determine which plan is superior. These diagrams also illustrate the value of the +P objective as an evaluator. Such as a dose-volume histogram chart is a good illustration of the volumetric dose distribution delivered to the patient, so is the biological evaluation

Determination and use of radiobiological response parameters in radiation therapy optimization
42
plot of a dose plan a good illustration of the expected clinical outcome. Dose-response diagrams together with the corresponding dosimetric diagrams give a more complete picture of the delivered treatment. To illustrate the significance of the presented D concept in plan reporting and comparison, it was applied to a clinical case of cervix cancer for which two different treatment plans were produced. The two plans were selected on the grounds of their dose distribution characteristics. The first treatment plan is much more conformal than the second one and its dose distribution in the ITV is much more inhomogeneous. The treatment plans were evaluated using their dose distributions to the patients and the dose-response relations of the organs involved in this clinical case. The radiobiological parameters of the organs were used to estimate the normal tissue tolerance and the optimum target dose. Plotting the curves of BP , IP and +P of the two plans in the same diagram it can be seen that the corresponding curves of ITV for the two plans coincide (figure 9, lower right diagram). Since this is the case, the curves of the IP are the ones that decide which plan is superior from the radiobiological point of view. This is also shown by the curve of +P , which confirms that +P is an objective that depicts the quality of a treatment plan. It has to be mentioned that the curves of BP of the two plans coincide because ITVD has been used as the unit of the dose axis. That is because D is derived in a way, which depends only on the radiobiological characteristics of the targets involved in the clinical case. In the lower left diagram of figure 9, the ID was used to make the total response curves of the organs at risk coincide for the two plans. Then, for the same complication rate the treatment configuration achieving better total control can be found accordingly. From the above it is shown that D provides the proper dose prescription basis for comparing treatment plans through the evaluation of the biological effects of the delivered dose distribution. 5.5. Radiation therapy optimization The beneficial aspects of the clinical use of the dose-response relations of tumours and normal tissues can be demonstrated by applying them on test cases and observing the margin between the modern intensity modulated treatments and the classical practice22,25,145,146. 5.5.1. Radiobiologically assessed conformal radiotherapy
An effort to assess the current status of conformal radiotherapy was made through an intercomparison of the most frequent irradiation techniques in use or recently introduced6. To fulfill this task several wooden phantoms were fabricated depicting a cervix cancer case with regional lymph node involvement. The task of the participating radiotherapy centers was to irradiate the phantom according to either their standard
Determination and use of radiobiological response parameters in radiation therapy optimization
43
technique in use to day, or according to their research or state of the art techniques. The irradiation should be performed according to the protocol of irradiation with a film inserted in the phantom. Subsequently, the film together with calibration strips should be used for evaluation33,42. The distributions of the optical density in the irradiated films was converted to dose distribution using a method described in Mavroidis et al5.
As mentioned above the test case that was chosen was that of a patient with cancer of the cervix extended to parametria. The radiobiological procedure implemented in this study, estimates the probability of complication free tumour control based on knowledge about the dose-response relations of the targets and the surrounding normal tissues. The evaluation is based on an accurate delineation of the internal target volume and possible organs at risk. It makes use of volume and dose-response relations to compare the incident beam profiles and directions of different treatment plans. The information about the dose-response relations is gradually improving for many tumours and most normal tissues. The new data allow therefore an accurate evaluation of the delivered dose distributions. Some of the plans that were produced for the comparison were fairly conventional whereas other were more sophisticated34,113-115,129,130 and they are illustrated in Paper VI together with their biological evaluation. For the technique shown in figure 10, a 6MV Linac was used as the radiotherapy unit with gravity oriented devices. In this plan two 360 degrees rotational fields were applied. The width of the first field was 14 cm at the isocenter (SAD = 100 cm). The width of the second field was 6 cm at the isocenter to boost the dose to the gross tumour. The isocenter was at the same position in the phantom for both fields. It was located on the sagital axis of symmetry of the cross section and at a depth of 9.8 cm from the anterior skin. The protectors that were used as the gravity oriented devices were made of lead shots (bladder protector) and seroben (rectum protector). For this technique, after the dose level optimization the maximum P+ value is 95.2% for a mean dose to the target 94.9 GyD = , associated relative standard deviation
/ 13%D Dσ = and biologically effective uniform dose D of 93.9 Gy. In this plan the isodose line of 60% covers the ITV and the 70% the GTV. The
bladder and the rectum are spared very well. The small bowel receives fairly low dose, which is distributed almost uniformly throughout its volume. The femurs are also spared. The mean doses in the organs at risk are low (42.5-49.2 Gy) ensuring low levels of expected complications. At the same time the mean dose to the targets is high enough to cause control of them (85.2-104.6 Gy). The minimum dose in the lymph nodes appear to be at good levels (62.7-81.9 Gy). From the diagram of the dose volume histograms it can be seen that the curves of the organs at risk are well separated from the ones of the targets which is exactly what it can be seen in the diagram showing the results of the radiobiological evaluation (figure 10, upper right diagram). This confirms the fact that organs that receive low doses have low probabilities of response and vice-versa.
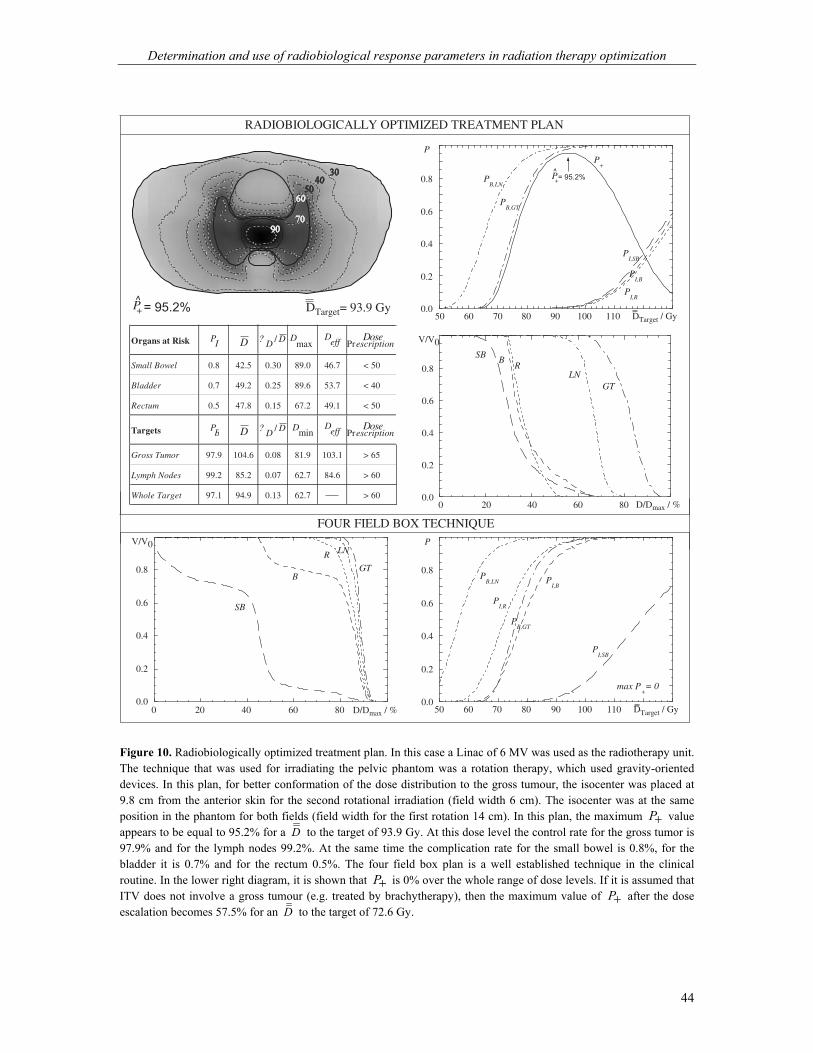
Determination and use of radiobiological response parameters in radiation therapy optimization
44
P+^ = 95.2% = 93.9 Gy DTarget
PI,SB
PI,B
PI,R
PB,LN
PB,GT
P+
0.0
0.2
0.4
0.6
0.8
P
50 60 70 80 90 100 110 DTarget / Gy
P+
^= 95.2%
SBB
RLN
GT
0.0
0.2
0.4
0.6
0.8
V/V0
0 20 40 60 80 D/Dmax / %
RADIOBIOLOGICALLY OPTIMIZED TREATMENT PLAN
PrescriptionDosePB D ? D D/ D
effDmin
PrescriptionDosePI D ? D D/ max
D DeffOrgans at Risk
Small Bowel 0.8 42.5 0.30 89.0 46.7 < 50
Bladder 0.7 49.2 0.25 89.6 53.7 < 40
Rectum 0.5 47.8 0.15 67.2 49.1 < 50
Targets
Gross Tumor 97.9 104.6 0.08 81.9 103.1 > 65
Lymph Nodes 99.2 85.2 0.07 62.7 84.6 > 60
Whole Target 97.1 94.9 0.13 62.7 > 60
0.0
0.2
0.4
0.6
0.8
V/V0
0 20 40 60 80 D/Dmax / %
SB
B
R
GT
LN
0.0
0.2
0.4
0.6
0.8
P
PI,SB
PI,B
PI,R
PB,GT
PB,LN
max P+= 0
50 60 70 80 90 100 110 DTarget / Gy
FOUR FIELD BOX TECHNIQUE
Figure 10. Radiobiologically optimized treatment plan. In this case a Linac of 6 MV was used as the radiotherapy unit. The technique that was used for irradiating the pelvic phantom was a rotation therapy, which used gravity-oriented devices. In this plan, for better conformation of the dose distribution to the gross tumour, the isocenter was placed at 9.8 cm from the anterior skin for the second rotational irradiation (field width 6 cm). The isocenter was at the same position in the phantom for both fields (field width for the first rotation 14 cm). In this plan, the maximum P+ value appears to be equal to 95.2% for a D to the target of 93.9 Gy. At this dose level the control rate for the gross tumor is 97.9% and for the lymph nodes 99.2%. At the same time the complication rate for the small bowel is 0.8%, for the bladder it is 0.7% and for the rectum 0.5%. The four field box plan is a well established technique in the clinical routine. In the lower right diagram, it is shown that P+ is 0% over the whole range of dose levels. If it is assumed that ITV does not involve a gross tumour (e.g. treated by brachytherapy), then the maximum value of P+ after the dose escalation becomes 57.5% for an D to the target of 72.6 Gy.

Determination and use of radiobiological response parameters in radiation therapy optimization
45
A standard four-field box technique consists of a pair of parallel opposed fields with width of the order of 14 cm each and a pair of lateral opposed fields with width of the order of 11 cm each. Such a treatment plan showed 0% of P+ for all the range of dose levels. In the lower diagrams of figure 10 it is shown that although the rectum and the gross tumour receive similar doses their response curves differ. It can be seen that the curve of the gross tumour is always to the right of the curve of the rectum implying that control of the gross tumour will mean rectal complications in any case. This is the reason of the non-positive P+ values. However, if it is assumed that ITV does not include the resistant gross tumour (e.g. treated by brachytherapy) then the limiting normal tissue will again be the rectum but in this case tumour control can be achieved with many probabilities of escaping the rectal complications.
The analysis of the treatment plans had three purposes. First, to reason the results
obtained using the radiobiological models. Second, to summarize the physical parameters that characterize the plans such as the dose volume histograms and the isodose levels. Third and foremost to show that the radiobiological evaluation expresses the results of the physical evaluation and furthermore it provides even more clinical information concerning the expected clinical outcome. This implies the need that the physicians and the medical physicists move from the deterministic interpretation of the dosimetric parameters to a stochastic mode, which is more clinically relevant because of the stochastic nature of radiation at the microscopic level.
By analyzing the main dose characteristics of the presented treatment plans, it can be observed that the sparing of the organs at risk is achieved through the very steep dose gradient at the borders of the organs at risk proximal to the ITV. In some of the plans the dose gradient can be very steep but it is very important to be correctly located towards the inner side of the borders of the ITV otherwise the dose to the target and consequently the control probability will be reduced. The steep gradient should be present at the borders towards all the organs at risk otherwise the organ that is spared less will be the dominant factor in the treatment outcome. Better conformity means that the dose falls off exactly at the borders of the ITV. In some cases a decreased dose gradient can lead to increased injury rates.
Treatment plans may use many different beam portals to distribute the dose to a large volume of the normal tissue stroma taking advantage of its low relative seriality. When an ITV (usually consisting of a gross tumour and the involved lymph nodes) is assumed to have homogeneous radiosensitivity, treatment plans try to deliver the same high uniform dose to the whole ITV. However, when high levels of cellular inhomogeneity in the ITV are present, treatment plans are designed taking the different radiosensitivity of the gross tumour and the lymph nodes into account by delivering a higher dose to the more resistant gross tumour. In these cases the dose variation inside the ITV follows the changes of the target radiosensitivity optimizing the effectiveness of the dose distribution. Consequently, the more conformal plans can deliver a higher dose level

Determination and use of radiobiological response parameters in radiation therapy optimization
46
to the target than the less conformal ones. This is equivalent to achieving increased control rates for the same or even a reduced risk for complications. This is radiobiologically equivalent to having a high uniform dose within the target and a steep fall off of the dose at the border to organs at risk so that they receive much lower dose than the target. 5.5.2. Dose level optimization The clinical value of the above described procedure is demonstrated by applying it in two clinical cases. The treatment plans were three-dimensional. The first clinical case is a head & neck target with the locally involved lymph nodes (LN) of a larynx tumour (GT). In this patient geometry the local normal tissue stroma (NT), the brain (BR) and the spinal cord (SC) are the principal organs at risk (figure 11, upper diagrams). The second target is an advanced cervical cancer with the locally involved lymph nodes. In this case the organs at risk were the small bowel (SB), the bladder (B) and the rectum (R). The gross cervical tumour and the involved local lymph nodes are regarded as separate biological structures and therefore they are associated with different radiosensitivities. In this work, it is demonstrated that P+ can be a valuable parameter in the optimization of the treatment planning process. The treatment plans presented were produced by experienced medical staff using the same treatment planning system for all the cases. In practice, when the planner produces the different treatment plans it is difficult to choose with certainty the best one to be approved for application. It is shown in this work, how the complication free cure can be used to select the best possible dose level but also the best possible plan. In the head & neck case, two different treatment plans are compared. It can be noticed that the most conformal treatment plan shows a higher value of P+
20,21,27,73,82-85,141. For the cervix cancer case, also two different treatment plans were produced, trying to achieve a dose distribution as close as possible to the criteria of acceptance used in the plan evaluation process. Again, it appears that the most conformal treatment plan generates a higher value of P+ . For these clinical cases the evaluations of the medical physicist and the physician agreed with those of the biological models. However, in cases of treatment plans whose conformities do not differ substantially, the clinical personnel may not identify the most effective one. This is because the evaluation of the treatment plans by the clinical personnel is mainly based on physical quantities such as the shape of the isodose levels and dose-volume histograms89,103 whereas the use of radiobiological data is limited.

Determination and use of radiobiological response parameters in radiation therapy optimization
47
Figure 11. Upper diagrams: The dose-response curves of the organs at risk and targets corresponding to two treatment plans of a head & neck cancer case are shown. On the horizontal axis, the biologically effective uniform dose of the target volume ITVD , representing the dose prescription is used. The ITVD was calculated from the internal target control (using the responses of the gross tumour and the lymph nodes). On the upper axis, the biologically effective uniform dose to the gross tumour, GTD is given separately. The vertical line CLIND indicates the clinical dose
Determination and use of radiobiological response parameters in radiation therapy optimization
48
prescription. It can be seen that the clinically prescribed dose (64 Gy to the gross tumour) is far from the optimal one achieved using radiobiologically modelling. However, it ensures a lower incidence of complications. Middle diagrams: The dose-response curves of the normal tissues and targets from two treatment plans of a cervix cancer case are shown. It is again noted that the clinically recommended dose prescription (65 Gy) is not the optimal one. Lower diagrams: The behaviour of dose escalation in the case of a multitarget ITV, which is irradiated with a step-wise dose distribution having the same mean but varying inter-target and intra-target relative standard deviations ( /D Dσ and /D Dσ respectively) is demonstrated. The variations of the control probability and the D of the ITV are also shown. It is assumed that the dose variation within the two targets, Dσ is the same for all the range of relative standard deviations delivered to the two targets ( Dσ ).
In figure 11 the importance of dose level optimization is demonstrated clearly. An interesting question that may arise in dose level optimization is whether it is possible, by sacrificing some small amount of the complication free tumour control probability, to achieve a significant reduction of the normal tissue injury. This is reasonable proposal since at maximum P+ the rate of increase of BP and IP are very similar whereas in the dose region around the maximum P+ the gradient of the two curves ( BP and IP ) can differ significantly. This means that by changing the treatment configuration, it may be possible to find a more clinically acceptable combination of tumour cure and fatal complications while only sacrificing a minimal amount of complication free cure. This new index is mathematically expressed as ( ) ( )( )max
I min|P P P P++ + += − ∆ that is, minimize
the overall normal tissue complication probability under the constraint that the probability for uncomplicated tumour control is greater than or equal to P P+ +− ∆ .
The complication free cure can be used to select the best possible dose level but also the best possible treatment plan. It is not unusual that evaluations of treatment plans performed by the medical physicists and the physicians differ from those calculated by the biological models in some aspects. This is more obvious when they classify plans whose dose distributions do not differ dramatically. This is because it is not possible for someone to quantify the differences of two dose distributions on a biological level by only looking at their dose volume histograms or isodose charts. In other words the different radiobiological behaviour of each of the different organs involved is affected differently by the dose distributions and their uniformity. So, if the planner evaluates a plan based only on the physical criteria, like it is done in the current clinical practice, he may choose a less effective plan for the patient. According to this analysis, it is obvious that P+ is a valuable parameter in the optimization of the treatment planning process. It can become the reference point in using the patient special characteristics instead of just optimizing physical functions. 5.5.3. Software development The large amount of calculations taking place during the plan optimization brought about the need for software that would make this process faster, easier and more reliable. For this reason a computer program under the name JP+ was developed (J is used to denote that it has been written in Java programming language)IV,1,4,7. This

Determination and use of radiobiological response parameters in radiation therapy optimization
49
software works as an external module to treatment planning systems using a communication interface. With this interface the program accesses the data of the treatment plan under evaluation. These physical data are combined with the biological data of the organs, which are already stored in a library in the program and the evaluation of the plan is carried out.
The program has the possibility of using a number of different biological models. Furthermore, it allows optimization of the applied dose level and the fractionation scheme of the treatment. These are two very important parameters and they can affect the clinical outcome very much. In figure 12 different parts of the program are illustrated. In the upper part, the standard evaluation of a plan (in terms of isodose lines) is illustrated together with the biological evaluation (in terms of response curves). At the point of the evaluation the biological parameters of the organs have been read, the dose level optimization has been performed as well as the calculation of the P+ index and the response probability of each organ (middle part). At the lower part, a schematic demonstration of the biological evaluation and optimization over a range of dose levels is presented.
In the beginning of the process, the program reads from the TPS the dose
distribution within each organ. This can be done either by reading from the dose matrix only the part that refers to the organ or by reading the dose volume histogram of the organ. The second way is faster and easier to implement though the first way is suitable when a treatment involves more than one plan and the fractionation correction has to be performed individually for each plan before they are summed together. Subsequently, for each organ the corresponding biological parameters are read. After the calculations have finished the control probability, the complication probabilities and the P+ value are provided together with the optimum dose level to be applied. The calculations are done �on the fly� which means that if the user is not satisfied with the plan he can produce another one and the JP+ program will be updated automatically giving the evaluation of the new plan.
The radiobiological evaluation of the treatment plans allows consideration of the variation in the radiosensitivity of the patient. The parallel presentation of the radiobiological evaluation together with the physical data intends to show their close relation. The use of radiobiological parameters is necessary to make the quantification of a treatment plan as clinically relevant as possible. These parameters incorporate into the evaluation the information that is carried by the clinical part of the treatment, the patient. The radiobiological plan evaluation combines the physical criteria that most medical physicists use in their evaluation with the biological criteria that the physicians may be more familiar with. Consequently, the medical personnel may benefit from the radiobiological models introducing new clinical ways of thinking.
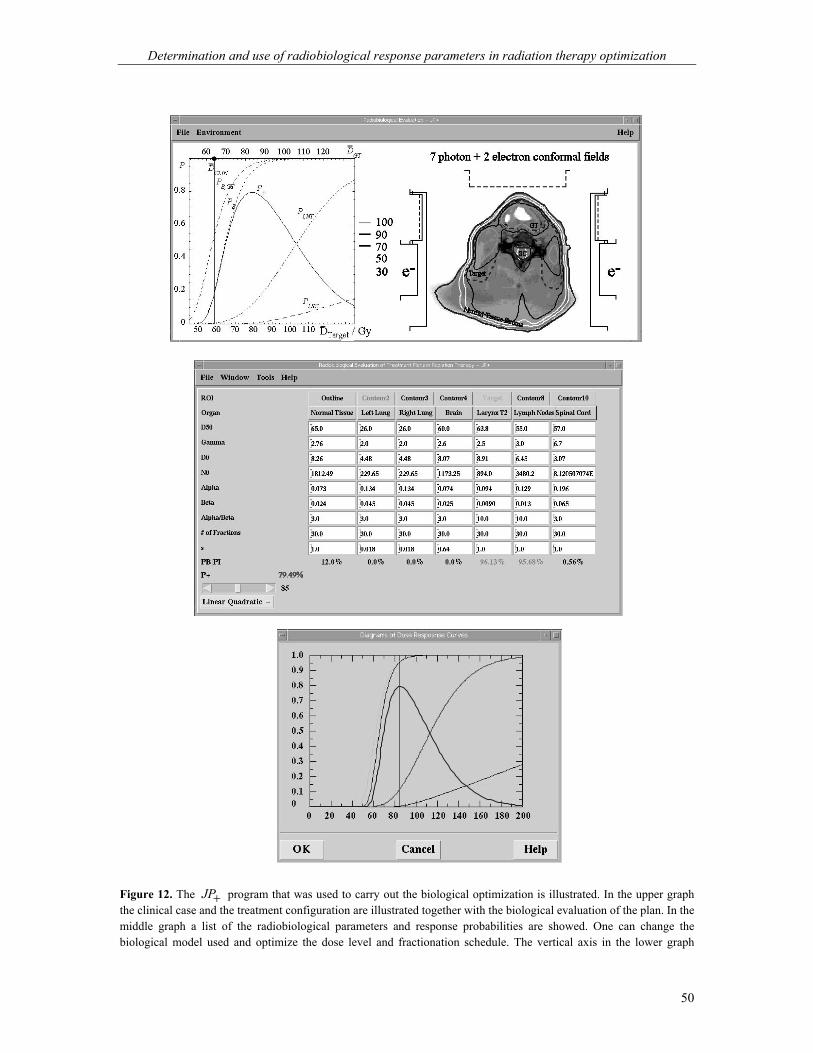
Determination and use of radiobiological response parameters in radiation therapy optimization
50
Figure 12. The JP+ program that was used to carry out the biological optimization is illustrated. In the upper graph the clinical case and the treatment configuration are illustrated together with the biological evaluation of the plan. In the middle graph a list of the radiobiological parameters and response probabilities are showed. One can change the biological model used and optimize the dose level and fractionation schedule. The vertical axis in the lower graph

Determination and use of radiobiological response parameters in radiation therapy optimization
51
corresponds to the probabilities of injury and control though the horizontal axis corresponds to the dose level (which is normalized to the mean dose in the ITV). The optimization of the dose level becomes more critical as the width of the therapeutic window becomes smaller.
JP+ has also an educational aspect since it lets the user change the models and
the radiobiological data of the organs and observe the changes since all the relative parameters updates automatically. This way he can perceive a feeling about how the models behave learning simultaneously more about their theoretical background. Finally, it is a tool, which can help the clinical personnel see that the better and more conformal treatment plans receive correspondingly good biological results depicting the quality of the plan. This way they may carefully start trusting and implementing the biological models more and more in the clinical routine based on accurate radiobiological parameters.
Determination and use of radiobiological response parameters in radiation therapy optimization
52
6. Discussion and future perspectives
Patient datasets, consisting of individual complication and dose distribution data can be fitted by different radiobiological models. The radiobiological parameters of these models describe the dose-response relations of different tumours and normal tissues. They can also express the volume dependence of the complication probabilities after radiotherapy. The derivation of the model parameters can be performed by different means such as a maximum likelihood fitting. This way the best estimates and the confidence intervals of the parameters can be determined. In these calculations a reference volume is used corresponding usually to the mean tissue volume of the study population or the organ size for most normal tissues. The estimated dose-response relations show that the probability of tissue response after radiotherapy may depend on several factors like the tissue location and size. The goodness of fit can be evaluated by different statistical methods.
Radiobiological treatment plan evaluation may allow a fairly accurate prediction of tumour control or normal tissue complications taking into account the variations in inter-patient radiosensitivity. This variation is partly expressed through the confidence intervals of the corresponding dose-response relations. The use of radiobiological modelling is necessary if a clinically relevant quantification of a dose plan is needed. These parameters incorporate into the treatment plan evaluation the biological (clinical) information, which is needed to relate the dose delivered to a patient with the clinical findings that will follow. However, introduction of such parameters into the clinical routine needs cautiousness.
Radiobiological treatment plan evaluation provides a closer association of the delivered treatment with the clinical outcome. In a given case, this is achieved by taking into account the dose-response characteristics of the irradiated targets and normal tissues involved. In radiobiological treatment planning, biological tissue information and physical data have a complementary relation in analyzing dose plans. A proper dose prescription basis for comparing treatment plans requires a concept that evaluates the biological effects of the delivered dose distribution. This basis is provided by the D concept, which stems from basic radiobiological principles. D is a simple mean for reporting and comparing different dose plans during treatment planning. The D can provide a better dose prescription for single and multiple ITV targets than several other strictly dosimetric measures commonly used by having a closer association with the radiotherapy treatment outcome. The definition of the biologically effective uniform dose can be applied on any radiobiological model and can be used as a suitable dose axis in dose-response diagrams. These diagrams can be considered as the radiobiological version of the extensively used DVH diagrams.
A prerequisite for applying a conformal treatment technique is a precise and accurate setup process. The effectiveness of a dose distribution is very much dependent

Determination and use of radiobiological response parameters in radiation therapy optimization
53
on the correct alignment of the patient to the beam. The importance of this point increases with the conformity of the applied treatment plan. In these techniques the dose distribution is so well matched with the radiosensitivity map of the clinical case that a small misalignment in the setup can very much reduce the effectiveness of the therapy85,91. The values of P+ drop much more dramatically in the directions where the organs at risk have their proximal borders closer to the target. The setup of the patient becomes more critical for the more conformal treatment plans. One should bear in mind that a less conformal technique could be more effective and trustworthy in case that a reliable positioning procedure is not available. The quality of a treatment does not depend only on the conformity of the applied technique but also on the quality of the supporting services.
Positioning uncertainties and organ motions can introduce significant deviations
between the planned and the delivered dose distribution to the patient during radiotherapy15,17,32,41,44,92,94,99,112. These effects can be accounted for either by using a high quality treatment verification technique, which usually means access to more sophisticated technology or by simulating the true dose delivery by using a number of fields of different weights and entry points during treatment planning53,69,88,126. These inaccuracies in the delivered dose to the patient may lead to a significant underestimation or overestimation of the expected tumour control or normal tissue probabilities respectively. The consequences of positioning uncertainties and organ motions on different treatment techniques, clinical structures and cancer sites can be estimated by using an extended patient material since the impact of these factors stems from the dynamic geometrical relation of the beam configuration against the body or the irradiated site.
From the treatment plans presented in this work the progression and development of the technological capabilities in delivering better treatments can be observed. The simple plans that use only open fields were substituted by the plans that use wedges and blocks which, in turn have been furthermore substituted by the ones that use multilief collimators, dynamic blocking and pencil beams. MLCs, pencil beams and other techniques are capable of delivering much more conformal dose distributions than the treatments applied a few years ago. Conformal distributions can be produced by intensity modulated external radiation treatments resulting in good treatment outcomes eliminating the need for more unpleasant intracavitary applications. However, the classical techniques like the four-field box technique that are still in use are satisfactory only when combined with brachytherapy.
Here, it is claimed that biological objective functions allow a much higher conformity. However, the dose distribution becomes more conformal only through the use of technological capabilities. The biological objective functions help the dose distribution to conform to the sensitivity map of the case. The complete dose distribution (in 3-dimensions) together with the fractionation schedule applied contain the most

Determination and use of radiobiological response parameters in radiation therapy optimization
54
detailed information of a treatment plan. However, solely this information does not suffice to describe the quality of the plan. Physicians use biological data in their evaluation criteria (e.g. tolerance dose, fractionation protocols, tumour stage etc). The radiobiological evaluation that is used in this work (it has been used in many other studies as well) provides just better and more complete description of the biological data already used clinically. It is based on data derived by patients, which have been treated in the past and whose follow-up results are available. Soon a quite reliable library will be available for this kind of evaluations taking into account the individuality of the patient. One needs both the complete dosimetric data and the biological description of each individual case to evaluate the quality of a treatment plan.
It is indicated that a software like JP+ and an objective like the complication free tumour control probability, P+ can be very useful for the treatment planning procedure. The fact that organs and tumours of different radiosensitivities are affected differently by the applied dose distributions shows the need for a radiobiologically based evaluation of the treatment plans. When the integral injury of the organs after irradiation, IP and the associated influence on the tumour control probability, BP have been calculated, they can be used in a scalar measure that quantifies the efficiency of the given treatment plan. This way the selection of the best treatment plan is simply reduced to a comparison of scalar probabilities such as IP , BP and P+ values. The accuracy of such a treatment optimization depends on the validity of the radiobiological models used, the accuracy of the response parameters of tumours and normal tissues and on the accurate delineation of the target and normal tissue volumes.
The development of radiobiological dose-response models and tumour imaging techniques will be of great importance for the future improvement of radiation therapy. As better and more accurate radiobiological data for tumours and normal tissues are continuously being collected the biological plan evaluation and optimization will become more trustworthy, which will help its clinical implementation. So, indices that will use the specific radiobiological data of the different organs and that will judge how good quantitatively and qualitatively a certain treatment plan is, becomes a necessity. On the other hand, these indices should be incorporated into a system, which must be easy to be used providing a friendly interface. The flexibility of the system to conform to the requirements of the different hospitals and clinical institutions and its educational options are some other aspects and possibilities that such a system should have. However, a strict association of a delivered dose distribution to the actual patient specific treatment outcome is a desirable future target10. From the above analysis it is shown that a treatment planning evaluation using both physical and biological criteria can help medical physicists and physicians to overcome difficult clinical situations and to come up with good and reliable treatment plans that would provide better survival probabilities for the patient and perhaps a better quality of life.

Determination and use of radiobiological response parameters in radiation therapy optimization
55
7. Conclusions
The present thesis shows that the use of appropriate radiobiological models for treatment plan evaluation can closely predict the clinical outcome of radiation treatments allowing a significant improvement of the delivered therapy. More specifically, the results of this research indicate the following:
• Accurate dose-response relations can be derived both for tumours and normal tissues by fitting the radiobiological models to patient datasets consisting of individual dose distributions and associated follow-up data.
• Radiobiological treatment plan evaluation may allow a fairly accurate prediction
of tumour control and normal tissue complications in the clinic particularly when the inter-patient radiosensitivity variations are taken into account.
• The importance of a reliable patient setup procedure increases with the
conformity of the applied treatment plan. In intensity modulated techniques, the dose distribution fits so well the radiosensitivity map of the patient that a small misalignment in the setup can reduce dramatically the effectiveness of the treatment.
• Biological objective functions can be used as guidelines in classical, inverse and
not least biologically optimized treatment planning to deliver dose distributions that are highly conformal to the internal target volume.
• Dose level optimization for a given treatment plan may significantly improve its
effectiveness in terms of tumour control and normal tissue complications. Treatment plans with different degrees of conformality are generally associated with quite different optimal dose levels.
• Conformal dose distributions produced by intensity modulated external radiation
treatments can achieve a good treatment outcome eliminating the need for unpleasant intracavitary treatments and sometimes more complex surgical procedures.
• A proper basis for dose prescription when comparing treatment plans requires a
concept that describes the biological effect of the delivered dose distribution. Such a quantifier is provided by the D concept, which is the dose that causes the same tumour control or normal tissue complication probability as the delivered dose distribution.

Determination and use of radiobiological response parameters in radiation therapy optimization
56
Acknowledgments At first, I would like to express my gratitude to my supervisor Dr. Bengt K Lind who helped me through his scientific skills to develop my scientific skills. I would like also to thank him for his support and above all for the friendly and warm relationship he offered me. Furthermore, I would like to thank: Professor Anders Brahme who inspired me through his deep theoretical knowledge and taught me how to present my thoughts in a nice and comprehensive way. Dr. Bo Nilsson for the very nice discussions we had, for being so kind and helpful whenever I needed him and for the great educational work he caries out at our department. Dr. Constantin Kappas for his friendship most of all, scientific guidance and the opportunities he offered me. My co-authors Sofie Axelsson MSc, Prof. Anders Brahme and Dr. Bengt K Lind from the Department of Medical Radiation Physics, Karolinska Institutet and Stockholm University, Sweden; Thomas Kraepelien MSc and Dr. Ingmar Lax from the Department of Hospital Physics, Radiumhemmet, Dr. Bengt Karlsson from the Department of Neurosurgery, Dr. Göran Laurell from the Department of Otolaryngology, Head and Neck Surgery and Dr. Jan-Olof Fernberg from the Department of Oncology, Radiumhemmet, Karolinska Hospital, Stockholm, Sweden; Dr. Claudia Danciu, Dr. Constantin Kappas, Prof. Basil Proimos and Dr. Kyriaki Theodorou from the Department of Medical Physics, Patras University, Hellas; Dr. Simo Hyödynmaa, Dr. Maunu A Pitkänen and Dr. Juha Rajala from the Department of Radiation Therapy, Tampere University Hospital, Finland; Prof. Jean-Claude Rosenwald from the Department of Medical Physics of Curie Institute, Dr. Dimitrios Lefkopoulos from the Department of Radiation Physics, Dr. Michel Schlienger from the Department of Radiation Oncology, Tenon Hospital and Dr. Francois Nataf from the Department of Neurosurgery, Ste Anne Hospital, Paris, France; Dr. Jan Van Dijk and Dr. Kees Koedooder from the Department of Radiotherapy of Academic Medical Center of Amsterdam University, The Netherlands; Dr. Wilfried De Neve and Dr. Carlos De Wagter from the Division of Radiotherapy of Gent University Hospital, Belgium; Dr. Beate Planskoy from the Department of Medical Physics and Bioengineering of London University College, United Kingdom; Dr. Marcello Benassi from the Laboratory of Medical Physics of Regina-Elena National Cancer Institute, Rome, Italy; and Dr. Giorgio Chierego from the Department of Medical Physics of Borgo Trento Hospital, Verona, Italy for their important contribution to this study.

Determination and use of radiobiological response parameters in radiation therapy optimization
57
The entire staff of the Department of Medical Radiation Physics for creating a scientific environment, particularly the secretaries Ann-Charlotte Ekelöf, Lil Engström and Ida Strindberg the managers of the computer systems Anders Eklöf, Bengt K Lind, Olof Sjörs and Johan Nilsson and all the tutors, the research students and guests during these years (Albert, Alexandra, Ali H, Ali M, Anders G, Anders L, Anna, Annelie, Annica, Bartosz, Björn C, Björn L, Brigida, Bruno, Cathrine, Christian, Daniel, Dzevad, Erik, Gereon, Janina, Johan L, Johan U, Irena, Kestin, Linda, Jonas, Jounes, Katsumasa, Kiarash, Magda, Malin, Margareta, Maria, Marianne, Marilyn, Mats, Mattias, Nina, Olof, Patrik, Paul, Pedro, Riham, Roger, Rudiger, Sara, Sharif, Shahrokh, Stefan, Svante, Victoria, Åsa). The staff of the Department of Hospital Physics, Radiumhemmet, Karolinska Hospital (especially Anna-Karin, Aris, Bengt-Inge, Giovanna, Peder). The medical physicists Zeta Malataras and Theodoros Skouras from the Department of Radiotherapy, Patras University Hospital, Hellas and the oncologists Catarina Beskow and Jan Fagerberg from the Department of Radiotherapy, Mats Beckman from the Department of Radiology, Karolinska Hospital, Stockholm, Sweden, for their assistance during the work. My parents, for the continuous and unlimited love and support they offered me during all my life and for helping me achieve higher goals. My wife Dimitra, for her friendship, love, support, encouragement and for being a large part of myself; my beautiful daughter Margarita for making me realize and feel true love. My brother and sisters, for filling my life with warmth and my thoughts with calm. My close friends, for being always there for me turning the world colourful and for making me a better person. A part of this study was done within the Conformal Therapy Group of DYNARAD, which was part of a EU project (BIOMED I). In this sense, the work was partially supported financially by this project. This work has been mainly supported by grants from Cancerföreningen i Stockholm, Konung Gustav V:s Jubileumfond; the Research Center for Radiation Therapy; and the Center of Excellence of the Swedish National Board for Industrial and Technical Development.

Determination and use of radiobiological response parameters in radiation therapy optimization
58
References Further publications by the author on the subject of the thesis 1Mavroidis P 1996 Development of a radiobiology-based procedure for evaluating and increasing the
probability of complication free tumour control in radiation therapy MSc Thesis University of Patras, Hellas
2Mavroidis P, Lind B K and Kappas C 1996 An index for evaluating and increasing the probability of
complication-free tumor control in radiation therapy (abstr.) J. Balcan Union Oncol. 1 39 3Mavroidis P, Bengt K L 1997 A dosimetric report for the determination of absorbed dose from high-
energy photon and electron beams (Task Group 21, AAPM). Basic steps in the application of the protocol. Development of a software for easier and reliable clinical implementation of the protocol 1st summer school of Balcan Union of Oncol. (B.U.ON.) pp 1-35
4Mavroidis P and Lind B K 1997 Software for assessing optimal complication free tumor control, dose
level and fractionation schedule Proc. of the 11th Int. Conf. on Medical Physics, World Congr. on Medical Physics and Biomedical Engineering, Nice, France
5Mavroidis P, Lind B K, Proimos B, Kappas C and Brahme A 1999 Dosimetric information from films
irradiated in the conformal therapy test phantom of the �Dynarad� project Proc. of the 6th Int. Conf. on Medical Physics ed Kappas C, del Guerra A, Kolitsi Z, Dimilakis G and Theodorou K (Bolognia: Monduzzi Editore) pp 127-34
6Mavroidis P, Lind B K, Proimos B and Brahme A 1999 Comparison of conformal radiation therapy
techniques within the dynamic radiotherapy project DYNARAD (abstr.) Phys. Med. 15 188 7Mavroidis P 2000 Use of radiobiological models for treatment evaluation and clinical outcome
optimization PhLic Thesis University of Stockholm, Sweden 8Mavroidis P, Theodorou K, Lefkopoulos D, Schlienger M, Lind B K and Kappas C 2000 Extraction of
biological parameters for AVM stereotactic radiotherapy treatment Proc. of the 12th Int. Conf. on Medical Physics, World Congr. on Medical Physics and Biomedical Engineering, Chicago, USA
9Laurell G, Kraepelien T, Mavroidis P, Lind B K, Fernberg J O, Beckman M and Lind M G 2001 Long-
term effects on the proximal esophagus after irradiation to head and neck cancer patients. Stricture and absorbed dose (submitted to Laryngoscope)
10Mavroidis P, Lind B K and Brahme A 2001 Clinical implementation of radiobiological treatment
planning (Acta Oncol. to be submitted)
Determination and use of radiobiological response parameters in radiation therapy optimization
59
Other publications on which the thesis is based 11Aaltonen P, Brahme A, Lax I, Levernes S, Näslund I, Reitan J B and Turesson I 1997 Specification of
dose delivery in radiation therapy. Recommendations by the Nordic Association of Clinical Physics (NACP) Acta Oncol. 36 (suppl 10) 1-32
12Alber M and Nusslin F 1999 An objective function for radiation treatment optimization based on local biological measures Phys. Med. Biol. 44 479-93
13Anseline P F, Lavery I C, Fazio V W, Jagelman D G and Weakley F L 1981 Radiation injury of the rectum Ann. Surg. 194 716-24
14Archambeau J O and Shymko R M 1988 Tissue population configuration as a modifier of organ response Int. J. Radiat. Oncol. Biol. Phys. 15 727-34
15Balter J M, Ten Haken R K, Lawrence T S, Lam K L and Robertson J M 1996 Uncertainties in CT-based radiation therapy treatment planning associated with patient breathing Int. J. Radiat. Oncol. Biol. Phys. 36 167-74
16Barendsen G W 1982 Dose fractionation, dose rate and iso-effect relationships for normal tissue responses Int. J. Radiat. Oncol. Biol. Phys. 11 1751-57
17Bel A, van Herk M, Bartelink H and Lebesque J V 1993 A verification procedure to improve patient set-up accuracy using portal images Radiother. Oncol. 29 253-60
18Betti O, Munari C and Rossler R 1989 Stereotactic radiosurgery with the linear accelerator: treatment of arteriovenous malformations Neurosurgery 24 311-21
19Bonadonna G, Hortobagyi G N and Gianni A M 1997 Textbook of Breast Cancer (Great Britain: Martin Dunitz)
20Brahme A 1984 Dosimetric precision requirements in radiation therapy Acta Radiol. Oncol., 23, 379-91 21─ 1987 Optimization of conformal and moving beam radiation therapy techniques Proceedings of the 9th
Int. Conf. on the Use of Computers in Radiation Therapy ed Bruinvis I A D, van der Giessen P H and van Kleffens H J (Amsterdam: Elsevier) pp 227-30
22─ 1994 Which parameters of the dose distribution are best related to the radiation response of tumours and normal tissues? Proc. of the Interregional Seminars for Europe, the Middle East and Africa Organized by the IAEA (Leuven) pp 37-58
23─ 1995 Treatment optimization using physical and biological objective functions Radiation Therapy Physics ed Smith A R (Berlin: Springer) pp 209-46
24─ 1997 The need for accurate target and dose specifications in conventional and conformal radiation therapy � An introduction Acta Oncol. 36 789-92
25─ 2000 Development of radiation therapy optimization Acta Oncol. 39 579-95 26Brahme A, Ågren A-K 1987 Optimal dose distribution for eradication of heterogeneous tumors Acta
Oncol. 26 377 27Brahme A, Lind B K, Källman P 1990 Inverse radiation therapy planning as a tool for 3D dose
optimization Med. Phys. 6 53-68 28Brown J M 1990 Management and significance of hypoxic cells. Annual meeting of ASTRO, Miami,
Florida 29Burman C, Kutcher G J, Emami B and Goitein M 1991 Fitting of normal tissue tolerance data to an
analytic function Int. J. Radiat. Oncol. Biol. Phys. 21 123-35 30Chabora B M, Hopfan S and Wittes R 1977 Esophageal complications in the treatment of oat cell
carcinoma with combined irradiation and chemotherapy Radiology 123 185-7 31Colombo F, Pozza F, Chierego G, et al 1994 Linear accelerator radiosurgery for cerebral arteriovenous
malformations. An update Neurosurgery 34 14-21 32Creutzberg C L, Althof V G M, Huizenga H, Visser A G and Levendag P C 1993 Quality assurance using
portal imaging: the accuracy of patient positioning in irradiation of breast cancer Int. J. Radiat. Oncol. Biol. Phys. 25 529-39
33Danciu C and Proimos B 1997 A proper film for delivering dose distributions in photon beam therapy. Medical Biol Engineering and Computing J 35 Suppl 2 I32-PS1.27 p.902
34De Neve W, De Wagter C, De Jaeger K, Thienpont M, Colle C, Derycke S and Schelfhout J 1996 Planning and delivering high doses to targets surrounding the spinal cord at the lower neck and
Determination and use of radiobiological response parameters in radiation therapy optimization
60
upper mediastinal level: static beam-segmentation technique executed with a multileaf collimator Radiother. Oncol. 40 271-9
35Deasy J O 1997 Inter-patient and intra-tumor radiosensitivity heterogeneity Volume and Kinetics in Tumor Control and Normal Tissue Complications (Madison, WI: Medical Physics Publishing) 363-81
36Dutreix J, Tubiana M and Dutreix A 1988 An approach to the interpretation of clinical data on the tumor control probability-dose relationship Radiother. Oncol. 11 239-48
37Eadie W T, Drijard D, James F E, Roos M and Sadoulet B 1971 Statistical methods in experimental physics (CERN: North-Holland Publishing Company)
38Ebert M A 2000 Viability of the EUD and TCP concepts as reliable dose indicators Phys. Med. Biol. 45 441-57
39Ekberg L, Holmberg O, Wittgren L, Bjelkengren G and Landberg T 1998 What margins should be added to the clinical target volume in radiotherapy treatment planning for lung cancer? Radiother. Oncol. 48 71-7
40Emami B, Lyman J, Brown A, Coia L, Goitein M, Munzenrider J E, Shank B, Solin L J and Wesson A M 1991 Tolerance of normal tissue to therapeutic irradiation Int. J. Radiat. Oncol. Biol. Phys. 21 109-22
41Engelsman M, Damen E M F, de Jaeger K, van Ingen K M and Mijnheer B J 2001 The effect of breathing and set-up errors on the cumulative dose to a lung tumor Radiother. Oncol. 60 95-105
42Engler M J, Herskovic A M and Proimos B 1984 Dosimetry of rotational photon fields with gravity-oriented eye blocks Int. J. Radiat. Oncol. Biol. Phys. 10 431-38
43Eriksson F, Gagliardi G, Liendberg A, Lax I, Lee C, Levitt S, Lind B and Rutqvist L-E 2000 Long-term cardiac mortality following radiation therapy for Hodgkin�s disease: analysis with the relative seriality model Radiother. Oncol. 55 153-62
44Fein D A, McGee K P, Schultheiss T E, Fowble B L and Hanks G E 1996 Intra- and interfractional reproducibility of tangential breast fields: a prospective on-line portal imaging study Int. J. Radiat. Oncol. Biol. Phys. 34 733-40
45Flickinger J 1989 The integrated logistic formula and prediction of complications from radiosurgery Int. J. Radiat. Oncol. Biol. Phys. 17 879-85
46Flickinger J C, Pollock B E, Kondziolka D, et al 1996 A dose-response analysis of arteriovenous malformation obliteration after radiosurgery Int. J. Radiat. Oncol. Biol. Phys. 36 873-9
47Fowler J F 1992 Brief summary of radiobiological principles in fractionated radiotherapy Semin. Radiat. Oncol. 2 16-21
48Friedman W, Bova F and Mendenhall W 1995 Linear accelerator radiosurgery for arteriovenous malformations: the relationships of size to outcome J. Neurosurg. 82 180-9
49Gagliardi G 1998 Modeling heart and lung complication data in radiation therapy of the breast PhD Thesis University of Stockholm, Sweden
50Gagliardi G, Lax I and Rutqvist L E 1992 Radiation therapy of stage I breast cancer: analysis of treatment technique accuracy using three-dimensional treatment planning tools Radiother. Oncol. 24 94-101
51Gagliardi G, Bjöhle J, Lax I, Ottolenghi A, Eriksson F, Liedberg A, Lind P and Rutqvist L-E 2000 Radiation pneumonitis after breast cancer irradiation: Analysis of the complication probability using the relative seriality model Int. J. Radiat. Oncol. Biol. Phys. 46 373-81
52Hanley J A and McNeil B J 1982 The meaning and use of the area under a receiver operating characteristic (ROC) curve Radiology 143 29-36
53Hanley J, Debois M M, Mah D, Mageras G, Raben A, Rosenzweig K et al 1999 Deep inspiration breath-hold technique for lung tumors: the potential value of target immobilization and reduced lung density in dose escalation Int. J. Radiat. Oncol. Biol. Phys. 45 603-11
54Hendry J H and Thames H D 1986 The tissue-rescuing unit Br. J. Radiol. 59 628-30 55Herring D F 1980 Methods for extracting dose-response curves from radiation therapy data, I: A unified
approach Int. J. Radiat. Oncol. Biol. Phys. 6 225-32 56Hladky J P, Sleiman M, Leclerc X, et al 1997 Linac stereotactic radiosurgery in AVMs: analysis of a
series of 181 patients Stereotac. Func. Neurosurg. 67 95 (abstract) 57Holli K and Pitkänen M 1995 Tangential breast irradiation with or without internal mammary chain
irradiation: results of randomized trial Radiother. Oncol. 36 172-6

Determination and use of radiobiological response parameters in radiation therapy optimization
61
58International Commission on Radiation Units and Measurements 1993 Prescribing, recording, and reporting photon beam therapy ICRU Report 50 (Bethesda, MD: ICRU Publications)
59International Commission on Radiation Units and Measurements 1999 Prescribing, recording and reporting photon beam therapy ICRU Report 62 (Bethesda, MD: ICRU Publications)
60Jackson A, Kutcher G J and Yorke E D 1993 Probability of radiation-induced complications for normal tissues with parallel architecture subject to non-uniform radiation Med. Phys. 20 613-25
61Jackson A, Ten Haken R K, Robertson J M, et al 1995 Analysis of clinical complication data for radiation hepatitis using a parallel architecture model Int. J. Radiat. Oncol. Biol. Phys. 31 883-91
62Jones L C and Hoban P W 2000 Treatment plan comparison using equivalent uniform biologically effective dose (EUBED) Phys. Med. Biol. 45 159-70
63Karlsson B 1996 Gamma knife surgery of cerebral arteriovenous malformations PhD Thesis Karolinska Institute, Sweden
64Karlsson B, Lax I and Söderman M 1997 Factors influencing the risk of complications following gamma knife radiosurgery of cerebral arteriovenous malformations Radiother. Oncol. 43 275-80
65Karlsson B, Lindquist C, Johansson A and Steiner L 1997 Annual risk for the first hemorrhage from untreated cerebral arteriovenous malformations Phys. Med. Biol. 40 40-6
66Karlsson B, Lindquist C and Steiner L 1997 Prediction of obliteration after Gamma Knife surgery for cerebral arteriovenous malformations Neurosurgery 40 425-31
67Karlsson B, Lax I and Söderman M 1999 Can the probability for obliteration after radiosurgery for arteriovenous malformations be accurately predicted? Int. J. Radiat. Oncol. Biol. Phys. 43 313-9
68Klepper L Y and Klimanov A 2000 Calculation of radiation complication probabilities in organs and tissues on the basis of a modified Weibull�s function for usage in optimisation algorithms Manuscript
69Kubo H D and Hill B C 1996 Respiration gated radiotherapy treatment: a technical study Phys. Med. Biol. 41 83-91
70Kutcher G J and Burman C 1989 Calculation of complication probability factors for non-uniform normal tissue irradiation: the effective volume method Int. J. Radiat. Oncol. Biol. Phys. 16 1623-30
71Kwa S L, Theuws J C M, Wagenaar A et al 1998 Evaluation of two dose-volume histogram reduction models for the prediction of radiation pneumonitis Radiother. Oncol. 48 61-9
72Källman P 1992 Optimization of radiation therapy planning using physical and biological objective functions PhD Thesis University of Stockholm, Sweden
73Källman P, Lind B K, Brahme A 1988 Shaping of arbitrary dose distributions by dynamic multileaf collimation Phys. Med. Biol. 33 1291-1300
74Källman P, Lind B K and Brahme A 1992 An algorithm for maximizing the probability of complication free tumor control in radiation therapy Phys. Med. Biol. 37 871-90
75Källman P, Ågren A-K and Brahme A 1992 Tumor and normal tissue responses to fractionated non uniform dose delivery Int. J. Radiat. Biol. 62 249-62
76Lax I and Karlsson B 1996 Prediction of complications in gamma knife radiosurgery of arteriovenous malformations Acta Oncol. 35 49-55
77Lefkopoulos D, Schlienger M and Touboul E 1993 A 3-D radiosurgical methodology for complex arteriovenous malformations Radiother. Oncol. 2 233-40
78Lefkopoulos D, Schlienger M, Merienne L, Levrier M and Touboul E 1994 The associated targets methodology and the multi-isocenters radiosurgery treatment planning system ARTEMIS-3D Bull Cancer Radiother. 81 111-25
79Lefkopoulos D, Schlienger M, Touboul E, Plazas M C and Merienne L 1994 3-D dosimetric methodology in multiple isocenters radiosurgery: the influence of dose-volume histograms on the choice of the reference isodose Med. Biol. Eng. Comput. 32 440-6
80Lepke R A and Libshitz H I 1993 Radiation-induced injury of the esophagus Radiology 148 375-8 81Levin-Plotnik D, Niemierko A and Akselrod S 2000 Effect of incomplete repair on normal tissue
complication probability in the spinal cord Int. J. Radiat. Oncol. Biol. Phys. 46 631-8 82Lind B K 1990 Properties of an algorithm for solving the inverse problem in radiation therapy Inverse
Problems 6 415-26 83Lind B K 1991 Radiation therapy planning and optimization studied as inverse problems PhD Thesis
University of Stockholm, Sweden
Determination and use of radiobiological response parameters in radiation therapy optimization
62
84Lind B K and Brahme A 1987 Optimization of radiation therapy dose distributions with scanned photon beams in Proceedings of 9th Int. Conf. on the Use of Computers in Radiation Therapy, edited by A. D. Bruinvis, P. H. van der Giessen and H. J. van Kleffens (Amsterdam: Elsevier) 235-39
85Lind B K, Källman P, Sundelin B and Brahme A 1993 Optimal radiation beam profiles considering uncertainties in beam patient alignment Acta Oncol. 32 331-42
86Lind B K, Mavroidis P, Hyodynmaa S and Kappas C 1999 Optimization of the dose level for a given treatment plan to maximize the complication free tumor cure Acta Oncol. 38 787-98
87Lindborg L, Brahme A 1990 Influence of microdosimetric quantities on observed dose-response relationships in radiation therapy Rad. Res. 124 S23-28
88Lujan A E, Larsen E W, Balter J M and Ten Haken R K 1999 A method for incorporating organ motion due to breathing into 3D dose calculations Med. Phys. 26 715-20
89Lyman J T 1985 Complication probabilities as assessed from dose-volume histograms, Radiat. Res., 104, S13-19
90Lyman J T and Wolbarst A 1987 Optimization of radiation therapy, III: A method of assessing complication probabilities from dose-volume histograms Int. J. Radiat. Oncol. Biol. Phys. 13 103-9
91Löf J, Lind B K and Brahme A 1995 Optimal radiation beam profiles considering the stochastic process of patient positioning in fractionated radiation therapy Inverse Problems 11 1189-1209
92Mageras G 1999 Respiratory motion-induced treatment uncertainties Proc. of the 6th Int. Conf. on Medical Physics ed Kappas C, del Guerra A, Kolitsi Z, Damilakis Y and Theodorou K (Bologna: Monduzzi Editore) pp 33-8
93Mah K, van Dyk J, Keane T and Poon P Y 1987 Acute radiation-induced pulmonary damage. A clinical study on the response to fractionated radiation therapy Int. J. Radiat. Oncol. Biol. Phys. 13 179-88
94Mah D, Hanley J, Rosenzweig K et al 1999 The deep inspiration breath-hold technique for the treatment of lung cancer: the first 200 treatments Int. J. Radiat. Oncol. Biol. Phys. 45 205
95Massoud A, Helgason A R, Ågren A-K, Svensson C, Nilsson S and Steineck G 2001 Long-term symptoms after external beam radiation therapy for prostate cancer with three and four fields Acta Oncol. (to be submitted)
96Meder J F, Oppenheim C, Blustajn J, Nataf F, Lefkopoulos D, Laurent A, Merland J J, Schlienger M and Fredy D 1997 Cerebral arteriovenous malformations: the value of radiologic parameters in predicting response to radiosurgery Am. J. Neuroradiol. 18 1473-83
97Merienne L, Laurent A, Meder J F et al 1991 Irradiation stéréotaxique de 46 angiomes cérébraux: Analyse des résultats angiographiques deux ans et demi après traitement Neurochirurgie 37 185-95
98Mijnheer B 1997 Current clinical practice versus new developments in target volume and dose specification procedures: A contradiction? Acta Oncol. 36 785-88
99Mitine C, Dutreix A and van der Schueren E 1991 Tangential breast irradiation: influence of technique of set-up on transfer errors and reproducibility Radiother. Oncol. 22 308-10
100Moiseenko V, Battista J and van Dyk J 2000 Normal tissue complication probabilities: dependence on choice of biological model and dose-volume histogram reduction scheme Int. J. Radiat. Oncol. Biol. Phys. 46 983-93
101Murtagh B A and Saunders M A 1995 MINOS 5.4 User�s guide, technical report SOL 83-20R, Department of operations research (Standford: Standford University)
102Niemierko A 1997 Reporting and analysing dose distributions: A concept of equivalent uniform dose Med. Phys. 24 103-10
103Niemierko A and Goitein M 1991 Calculation of normal tissue complication probability and dose-volume histogram reduction schemes for tissues with a critical element architecture Radiother. Oncol. 20 166-76
104Niemierko A and Goitein M 1992 Modelling of normal tissue response to radiation: the critical volume model Int. J. Radiat. Oncol. Biol. Phys. 25 135-45
105Niemierko A, Urie M and Goitein M 1992 Optimization of 3D radiation therapy with both physical and biological end-points and constraints Int. J. Radiat. Oncol. Biol. Phys. 23 99-108
106Nilsson J, Lind B K and Brahme A 2001 Modeling tumor hypoxia and the dose-response relation for heterogeneous tissues Int. J. Radiat. Biol. (submitted)

Determination and use of radiobiological response parameters in radiation therapy optimization
63
107Pavy J J, Denekamp J, Letschert J, Littbrand B, Mornex F, Bernier J et al 1995 Late effects toxicity scoring: the SOMA scale Radiother. Oncol. 35 11-5
108Pitkänen M A, Holli K A, Ojala A T and Laippala P 2001 Quality assurance in radiotherapy of breast cancer. � Variability in planning target volume delineation Acta Oncol. 40 50-5
109Pollock B, Kondziolka D, Lunsford L D, Bissonette D and Flickinger J 1996 Factors that predict the bleeding risk of celebral arteriovenous malformations Stroke 27 1-6
110Pollock B E, Flickinger J C, Lunsford L D et al 1998 Factors associated with successful arteriovenous malformations radiosurgery Neurosurgery 42 1239-47
111Porter E H 1980 The statistics of dose/cure relationships for irradiated tumors. Part I Br. J. Radiol. 53 210-27
112Pouliot J and Lirette A 1996 Verification and correction of setup deviations in tangential breast irradiation using EPID: gain versus workload Med. Phys. 23 1393-8
113Proimos BS 1960 Synchronous field shaping in rotational megavolt therapy Radiology 74 753-57 114Proimos B 1966 Beam-shapers oriented by gravity in rotational therapy Radiology 87 928-32 115Proimos B and Goldson A 1981 Dynamic dose-shaping by gravity-oriented absorbers for total lymph
node irradiation Int. J. Radiat. Oncol. Biol. Phys. 7 973-7 116Rajala J, Järvenpää R, Lahtela S L, Holli K, Ojala A and Pikänen M 1999 Lung reactions after
postoperative radiotherapy of breast cancer; correlation of reaction grade to dose-volume histograms Proc of the Nordic Symposium of Radiation Oncology (Tampere)
117Read P E, Ash D V, Thorogood J and Benson E A 1987 Short-term morbidity and cosmesis following lumpectomy and radical radiotherapy for operable breast cancer Clin. Radiol. 38 371-3
118Roswit B 1974 Complications of radiation therapy: The alimentary tract Semin. Roentgenol. 9 51-63 119SBU Report 1996 Strålbehandling vid cancer, Volym 2 (Stockholm: Litteraturgranskning, SB Offset
AB) 120Schilstra C and Meertens H 2001 Calculation of the uncertainty in complication probability for various
dose-response models, applied to the parotid gland Int. J. Radiat. Oncol. Biol. Phys. 50 147-58 121Schlienger M, Atlan D, Lefkopoulos D et al 2000 Linac radiosurgery for cerebral arteriovenous
malformations: results in 169 patients Int. J. Radiat. Oncol. Biol. Phys. 46 1135-42 122Schultheiss T E, Oorton C G and Peck R A 1983 Models in radiotherapy, Volume effects Med. Phys. 10
410-15 123Schwartz M, Sixel K, Young C et al 1997 Prediction of obliteration of arteriovenous malformations after
radiosurgery: The obliteration prediction index Can. J. Neurol. Sci. 24 106-9 124Silvain C, Barrioz T, Besson I, Babin P, Fontanel J P, Daban A, Matuchansky C and Beauchant M 1993
Treatment and long-term outcome of chronic radiation esophagitis after radiation therapy for head and neck tumors Digestive Diseases and Sciences 38 927-31
125Steel G 1997 Basic clinical radiobiology (Great Britain: The Bath Press) 126Stroom J C, de Boer H C, Huizenga H and Visser A G 1999 Inclusion of geometrical uncertainties in
radiotherapy treatment planning by means of coverage probability Int. J. Radiat. Oncol. Biol. Phys. 43 905-19
127Sur R K, Kochhar R and Singh D P 1994 Oral sucralfate in acute radiation oesophagitis Acta Oncol. 33 61-3
128Söderman M 2000 Volume determination and predictive models in the management of cerebral arteriovenous malformations PhD Thesis University of Stockholm, Sweden
129Söderström S 1995 Radiobiologically based optimization of external beam radiotherapy techniques using a small number of fields PhD Thesis University of Stockholm, Sweden
130Takahashi S 1964 Conformation radiotherapy: Rotation techniques as applied to radiography and radiotherapy of cancer Acta Radiologica Suppl 242
131Talairach J and Tournoux P 1992 Coplanar stereotaxic atlas of human brain (Stuttgart: Thieme) 132Teo P, Tai T H, Choy D and Tsui K H 1988 A randomized study on palliative radiation therapy for
inoperable non small cell carcinoma of the lung Int. J. Radiat. Oncol. Biol. Phys. 14 867-71 133Thames H D 1985 An �incomplete repair� model for survival after fractionated and continuous
radiations Int. J. Radiat. Biol. 47 319-39 134Thames H D and Hendry J H 1987 Radiation induced injury to tissues Fractionation in radiotherapy ed
Thames H D and Hendry J H (Philadelphia: Taylor & Francis) pp 1-21
Determination and use of radiobiological response parameters in radiation therapy optimization
64
135Theodorou K, Kappas C, Gaboriaud G, Mazal A D, Petrascou O and Rosenwald J C 1997 A simple method for 3D lesion reconstruction from two projected angiographic images: implementation to a stereotactic radiotherapy treatment planning system Radiother. Oncol. 43 281-4
136Theodorou K, Rosenwald J C, Siamplis D, Karnabatidis D and Kappas C 1999 A simple method for the correction of distorted digital angiographic images for stereotactic target localization Cancer Radiother. 3 489-93
137Touboul E, Al Halabi A, Buffat L et al 1998 Single fraction stereotactic radiotherapy: a dose-response analysis of arteriovenous malformations obliteration Int. J. Radiat. Oncol. Biol. Phys. 41 855- 61
138Tucker S L, Thames H D, Taylor J M G 1990 How well is the probability of tumor cure after fractionated irradiation described by Poisson statistics? Rad. Res. 124 273-82
139Vanagunas A, Jacob P and Olinger E 1990 Radiation-induced esophageal injury: A spectrum from esophagitis to cancer American J. Gastroenterol. 85 808-12
140Venkatraman E S and Begg C 1996 A distribution-free procedure for comparing receiver operating characteristic curves from a paired experiment Biometrika 83 835-48
141Webb S 1989 Optimization of conformal radiotherapy dose distributions by simulated annealing Phys. Med. Biol. 34 1349-69
142Wigg R D 1999 A radiobiological basis for the treatment of arteriovenous malformations Acta Oncol. 38 (suppl 14) 3-29
143Withers H R, Taylor J M G and Maciejewski B 1988 Treatment volume and tissue tolerance Int. J. Radiat. Oncol. Biol. Phys. 14 751-59
144Withers H R and Taylor J M G 1992 Critical volume model Int. J. Radiat. Oncol. Biol. Phys. 25 151-2 145Wolbarst A B 1984 Optimization of radiation therapy II: The critical-voxel model Int. J. Radiat. Oncol.
Biol. Phys. 10 741-45 146Wolbarst A B, Chin L M and Svensson G K 1982 Optimization of radiation therapy: integral response of
a model biological system Int. J. Radiat. Oncol. Biol. Phys. 8 1761-69 147Yaes R J 1990 The biological effect of inhomogeneous dose distributions in fractionated radiotherapy
Int. J. Rad. Onc. Biol. Phys. 19 203-7 148Yaes R J, Kalend A 1988 Local stem cell depletion model for radiation myelitis Int. J. Rad. Onc. Biol.
Phys. 14 1247-59 149Yamamoto Y, Coffey R J, Nichols D A and Shaw E G 1995 Interim report on the radiosurgical treatment
of cerebral arteriovenous malformations: The influence of size, dose time and technical factors on obliteration rate J. Neurosurg. 83 832-7
150Ågren A-K 1995 Quantification of the response of heterogeneous tumors and organized normal tissues to fractionated radiotherapy PhD Thesis University of Stockholm, Sweden
151Ågren A-K, Brahme A and Turesson I 1990 Optimization of uncomplicated control for head and neck tumors Int. J. Radiat. Oncol. Biol. Phys. 19 1077-85
152Ågren-Cronqvist A K, Källman P, Turesson I and Brahme A 1995 Volume and heterogeneity dependence of the dose-response relationship for head and neck tumours Acta Oncol. 34 851-60
153Ågren A-K, Källman P and Brahme A 1997 Determination of the relative seriality of a tissue from its response to non-uniform dose delivery Modelling in clinical radiobiology ed Baltas D (Germany: Albert Ludwigs University Freiburg) pp 127-41