Embed Size (px)
Citation preview

Determination of a European Standard for Key Performance Indicators (KPIs) in Vocational Training Models of Construction Industry (KPIsVTMCon PROJECT)
2014-1-TR01-KA202-012537
KPIsVTMCon PROJECT – 4th MEETING, 28th-29th April 2016, Vilnius
Project Aim & Methodology
AIM:
Determination of The KPIs of Vocational Training ofConstruction Industry
METHODOLOGY:√Comprehensive literature survey >>> Determination of KPIs
√Data Collection: Workshops (Germany, Netherlands, Turkeyand Lithuania) >>> Rating of determined KPIs
√Data Analyzes : Fuzzy AHP (FAHP) model
Outline
�KPIs for vocational education and training (VET) institutions
� Financial perspective� Trainee perspective (Customer)� Internal process perspective
� Learning and growth perspective
�Research Methodology (FAHP)
�Data Collection
�Analyzes
�Related Comments
KPIs for vocational education and training (VET) institutions
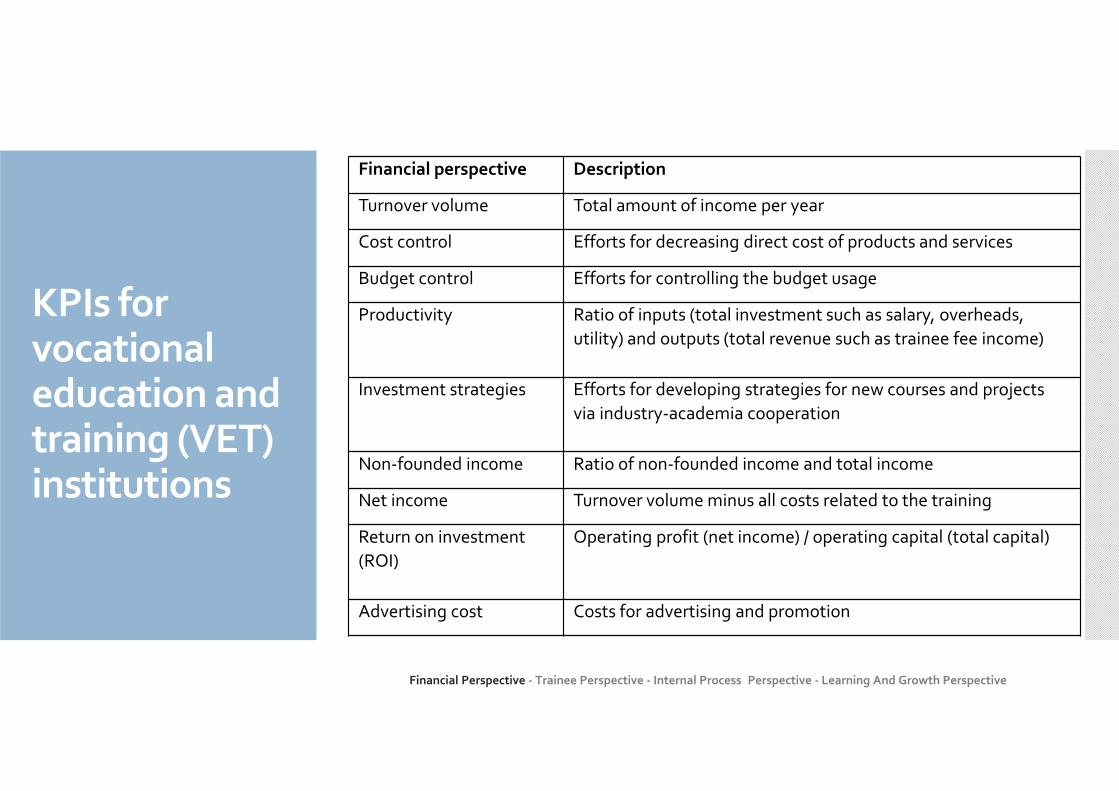
Financial perspective Description
Turnover volume Total amount of income per year
Cost control Efforts for decreasing direct cost of products and services
Budget control Efforts for controlling the budget usage
Productivity Ratio of inputs (total investment such as salary, overheads, utility) and outputs (total revenue such as trainee fee income)
Investment strategies Efforts for developing strategies for new courses and projects via industry-academia cooperation
Non-founded income Ratio of non-founded income and total income
Net income Turnover volume minus all costs related to the training
Return on investment (ROI)
Operating profit (net income) / operating capital (total capital)
Advertising cost Costs for advertising and promotion
Financial Perspective - Trainee Perspective - Internal Process Perspective - Learning And Growth Perspective
KPIs for vocational education and training (VET) institutions
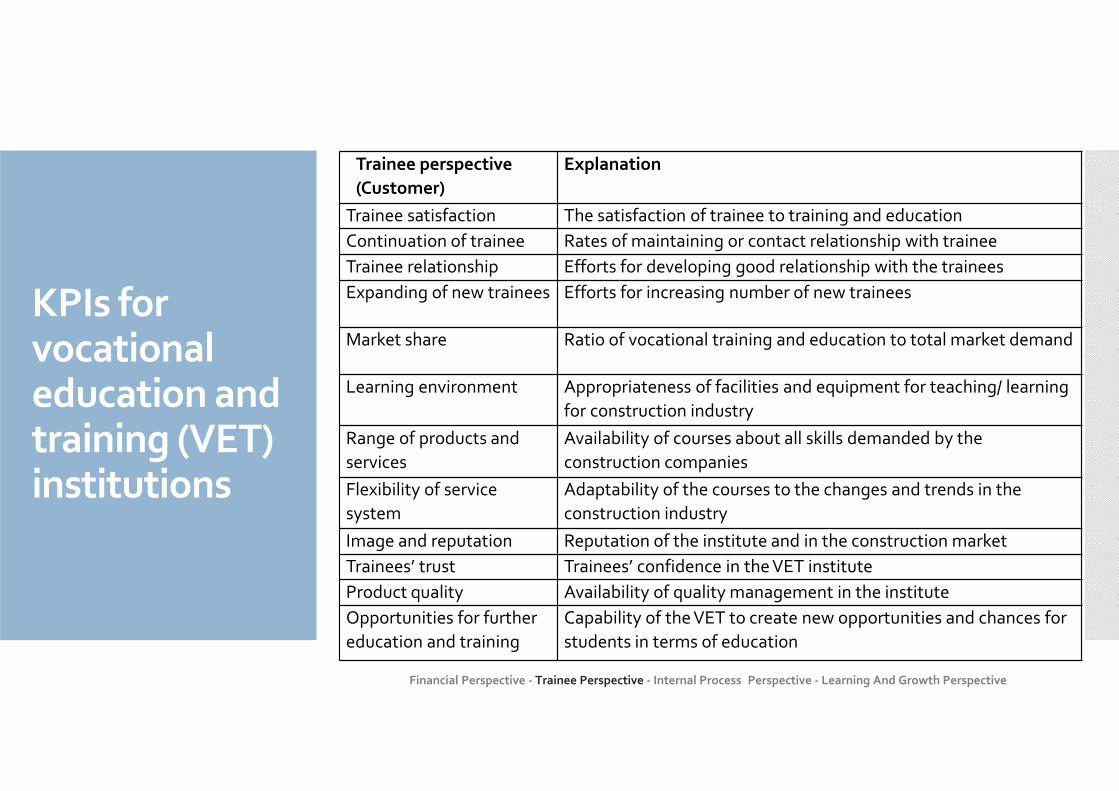
Trainee perspective
(Customer)
Explanation
Trainee satisfaction The satisfaction of trainee to training and education
Continuation of trainee Rates of maintaining or contact relationship with trainee
Trainee relationship Efforts for developing good relationship with the trainees
Expanding of new trainees Efforts for increasing number of new trainees
Market share Ratio of vocational training and education to total market demand
Learning environment Appropriateness of facilities and equipment for teaching/ learning for construction industry
Range of products and services
Availability of courses about all skills demanded by the construction companies
Flexibility of service system
Adaptability of the courses to the changes and trends in the construction industry
Image and reputation Reputation of the institute and in the construction market
Trainees’ trust Trainees’ confidence in the VET institute
Product quality Availability of quality management in the institute
Opportunities for further education and training
Capability of the VET to create new opportunities and chances for students in terms of education
Financial Perspective - Trainee Perspective - Internal Process Perspective - Learning And Growth Perspective
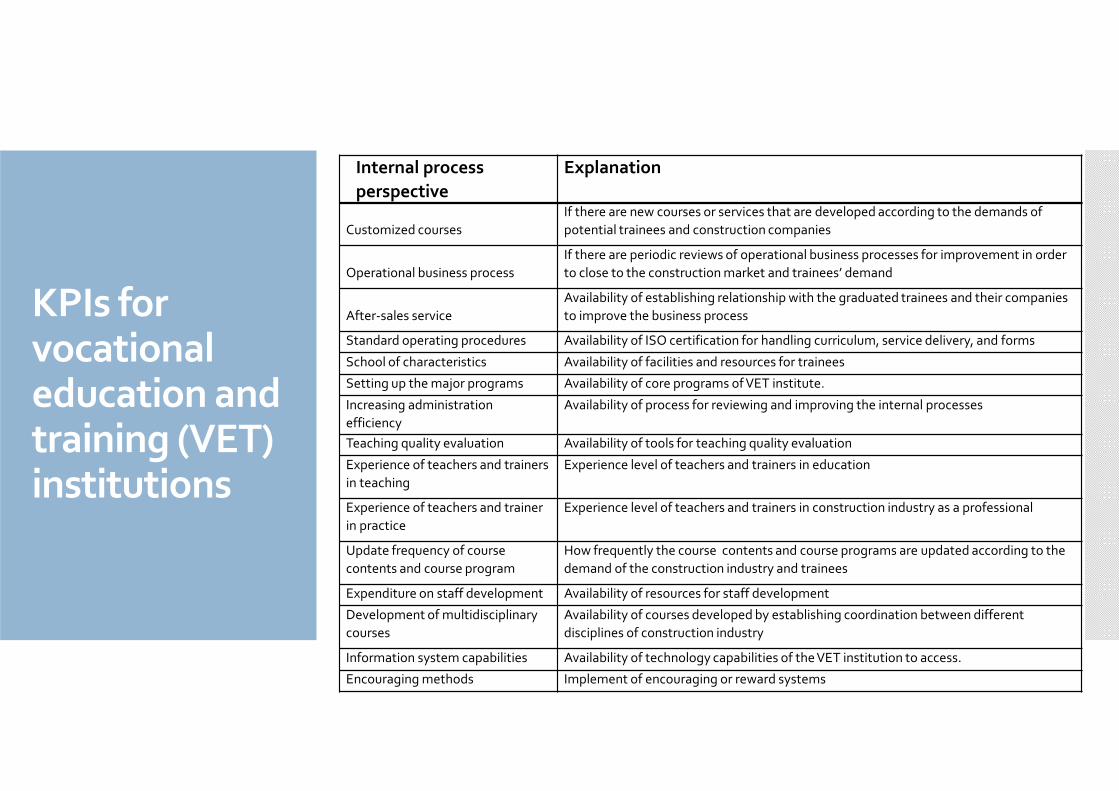
KPIs for vocational education and training (VET) institutions
Customized coursesIf there are new courses or services that are developed according to the demands of potential trainees and construction companies
Operational business processIf there are periodic reviews of operational business processes for improvement in order to close to the construction market and trainees’ demand
After-sales serviceAvailability of establishing relationship with the graduated trainees and their companies to improve the business process
Standard operating procedures Availability of ISO certification for handling curriculum, service delivery, and forms
School of characteristics Availability of facilities and resources for trainees
Setting up the major programs Availability of core programs of VET institute.
Increasing administration efficiency
Availability of process for reviewing and improving the internal processes
Teaching quality evaluation Availability of tools for teaching quality evaluation
Experience of teachers and trainers in teaching
Experience level of teachers and trainers in education
Experience of teachers and trainer in practice
Experience level of teachers and trainers in construction industry as a professional
Update frequency of course contents and course program
How frequently the course contents and course programs are updated according to the demand of the construction industry and trainees
Expenditure on staff development Availability of resources for staff development
Development of multidisciplinary courses
Availability of courses developed by establishing coordination between different disciplines of construction industry
Information system capabilities Availability of technology capabilities of the VET institution to access.
Encouraging methods Implement of encouraging or reward systems
Internal process
perspective
Explanation
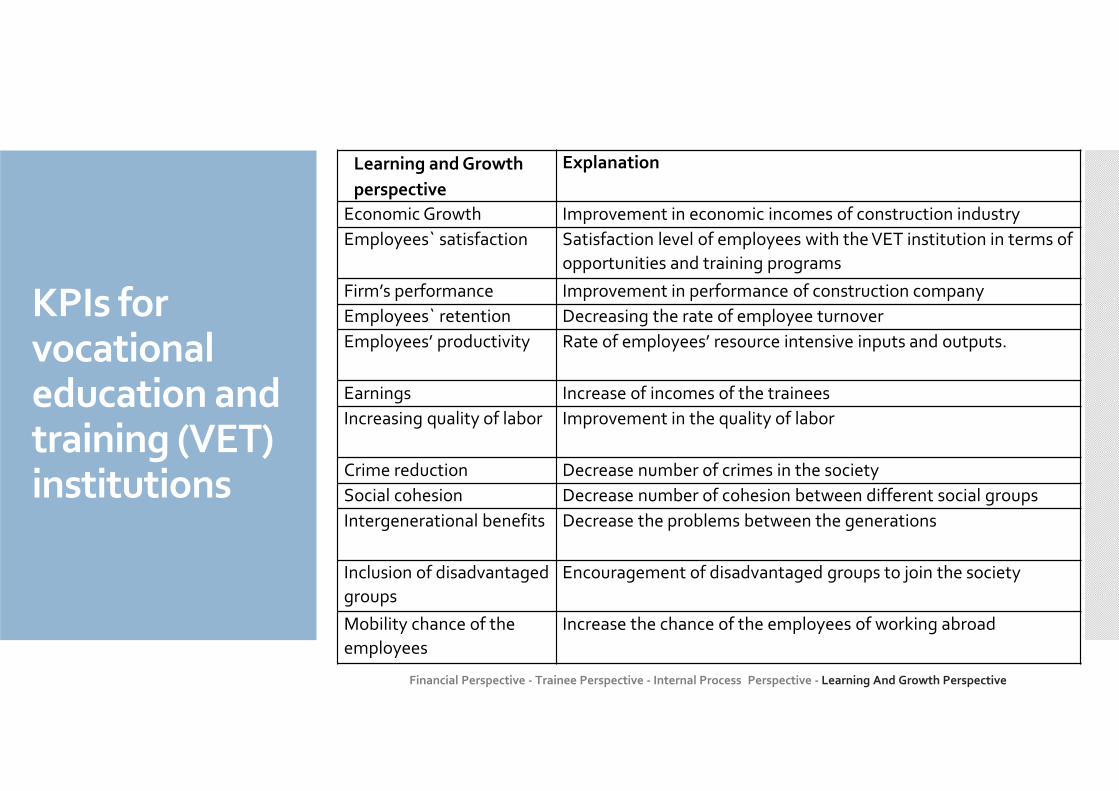
KPIs for vocational education and training (VET) institutions
Learning and Growth
perspective
Explanation
Economic Growth Improvement in economic incomes of construction industry
Employees` satisfaction Satisfaction level of employees with the VET institution in terms of opportunities and training programs
Firm’s performance Improvement in performance of construction company
Employees` retention Decreasing the rate of employee turnover
Employees’ productivity Rate of employees’ resource intensive inputs and outputs.
Earnings Increase of incomes of the trainees
Increasing quality of labor Improvement in the quality of labor
Crime reduction Decrease number of crimes in the society
Social cohesion Decrease number of cohesion between different social groups
Intergenerational benefits Decrease the problems between the generations
Inclusion of disadvantaged groups
Encouragement of disadvantaged groups to join the society
Mobility chance of the employees
Increase the chance of the employees of working abroad
Financial Perspective - Trainee Perspective - Internal Process Perspective - Learning And Growth Perspective
FuzzyAnalyticHierarchyProcess
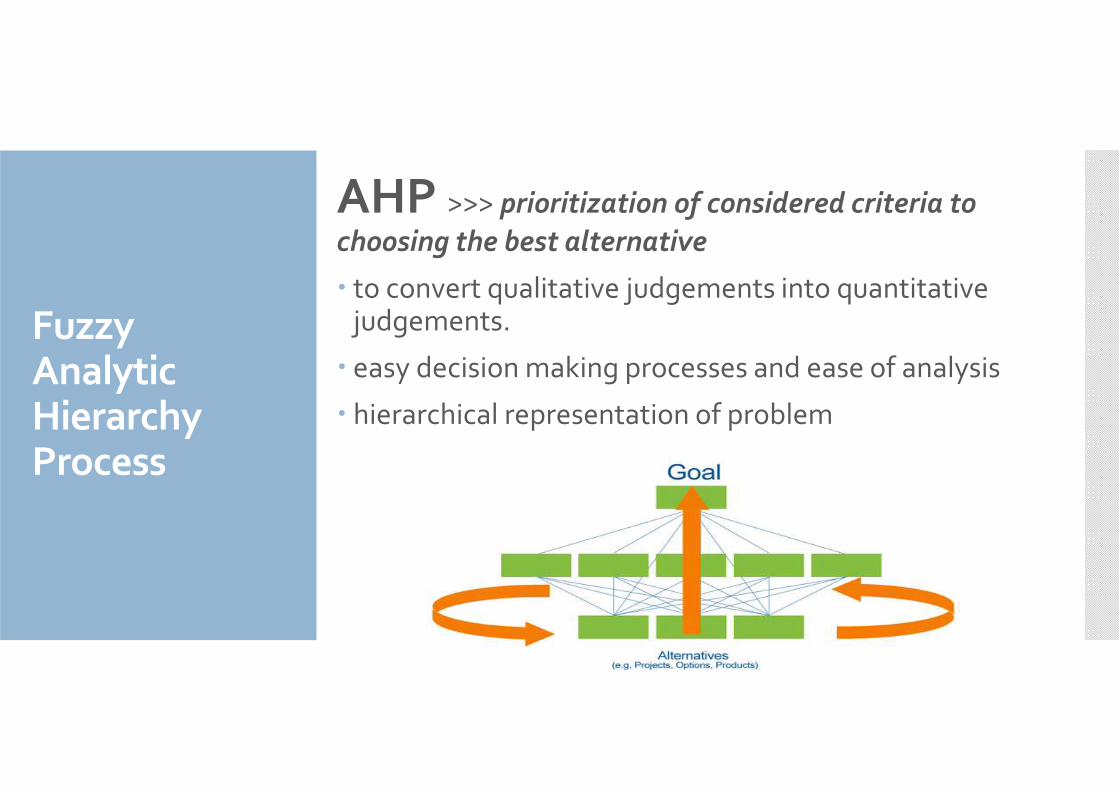
AHP >>> prioritization of considered criteria to
choosing the best alternative
� to convert qualitative judgements into quantitative judgements.
� easy decision making processes and ease of analysis
� hierarchical representation of problem
FuzzyAnalyticHierarchyProcess
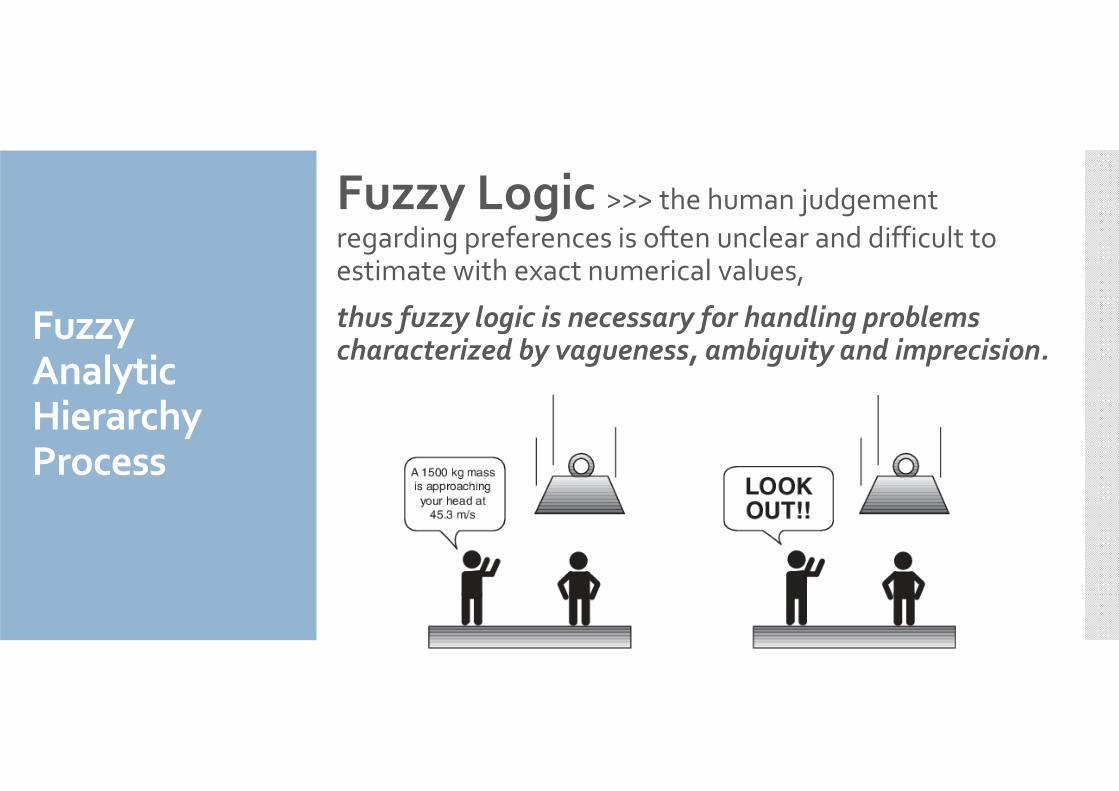
Fuzzy Logic >>> the human judgementregarding preferences is often unclear and difficult to estimate with exact numerical values,
thus fuzzy logic is necessary for handling problems characterized by vagueness, ambiguity and imprecision.
Data Collection
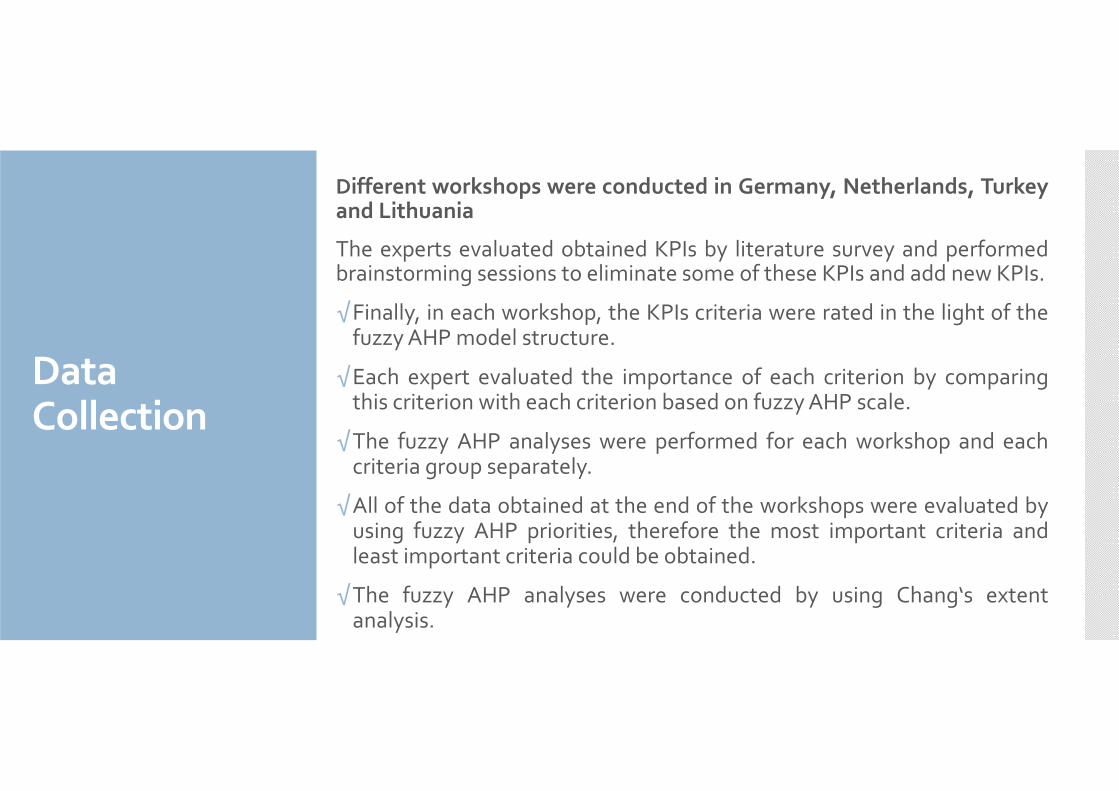
Different workshops were conducted in Germany, Netherlands, Turkeyand Lithuania
The experts evaluated obtained KPIs by literature survey and performedbrainstorming sessions to eliminate some of these KPIs and add new KPIs.
√Finally, in each workshop, the KPIs criteria were rated in the light of thefuzzy AHP model structure.
√Each expert evaluated the importance of each criterion by comparingthis criterion with each criterion based on fuzzy AHP scale.
√The fuzzy AHP analyses were performed for each workshop and eachcriteria group separately.
√All of the data obtained at the end of the workshops were evaluated byusing fuzzy AHP priorities, therefore the most important criteria andleast important criteria could be obtained.
√The fuzzy AHP analyses were conducted by using Chang‘s extentanalysis.
Data Collection
Preferences Expressed In
Linguistic Variables
Numeric Variables
Triangle Fuzzy Scale
Triangle Fuzzy
Reciprocal Scale
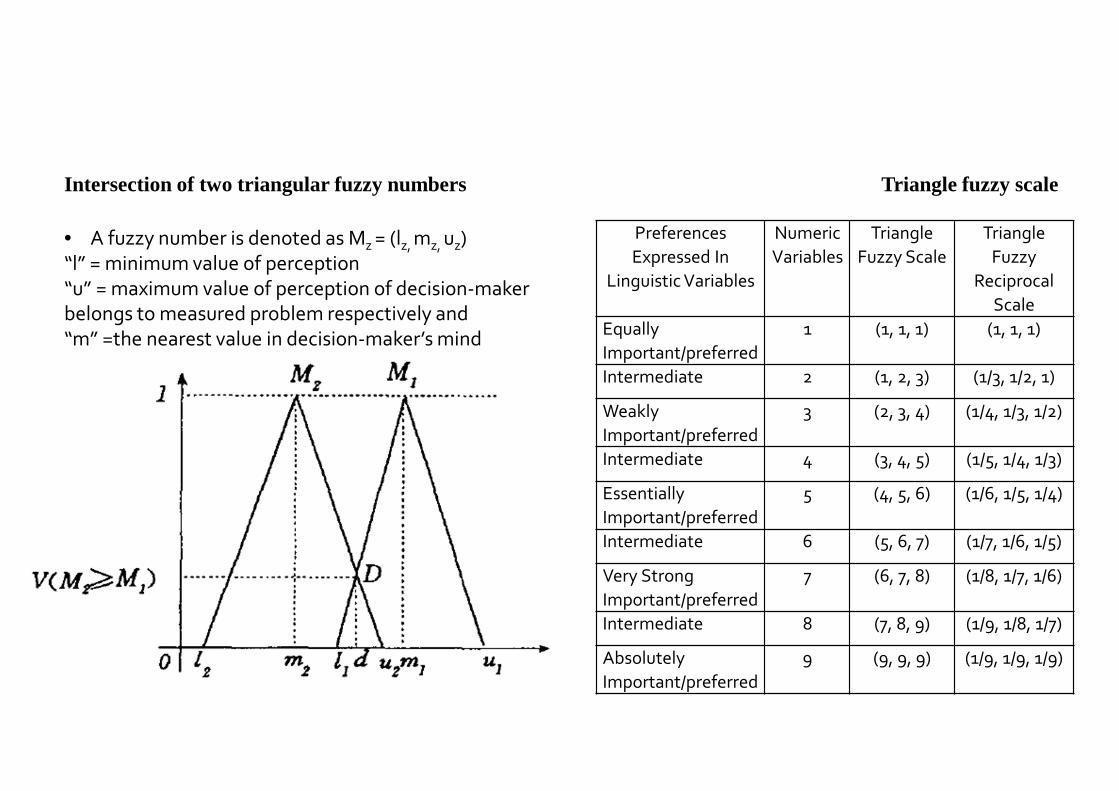
Equally Important/preferred
1 (1, 1, 1) (1, 1, 1)
Intermediate 2 (1, 2, 3) (1/3, 1/2, 1)
Weakly Important/preferred
3 (2, 3, 4) (1/4, 1/3, 1/2)
Intermediate 4 (3, 4, 5) (1/5, 1/4, 1/3)
Essentially Important/preferred
5 (4, 5, 6) (1/6, 1/5, 1/4)
Intermediate 6 (5, 6, 7) (1/7, 1/6, 1/5)
Very Strong Important/preferred
7 (6, 7, 8) (1/8, 1/7, 1/6)
Intermediate 8 (7, 8, 9) (1/9, 1/8, 1/7)
Absolutely Important/preferred
9 (9, 9, 9) (1/9, 1/9, 1/9)
Triangle fuzzy scale Intersection of two triangular fuzzy numbers
• A fuzzy number is denoted as Mz = (lz, mz, uz)“l” = minimum value of perception “u” = maximum value of perception of decision-maker belongs to measured problem respectively and “m” =the nearest value in decision-maker’s mind
Chang‘s ExtentAnalysis
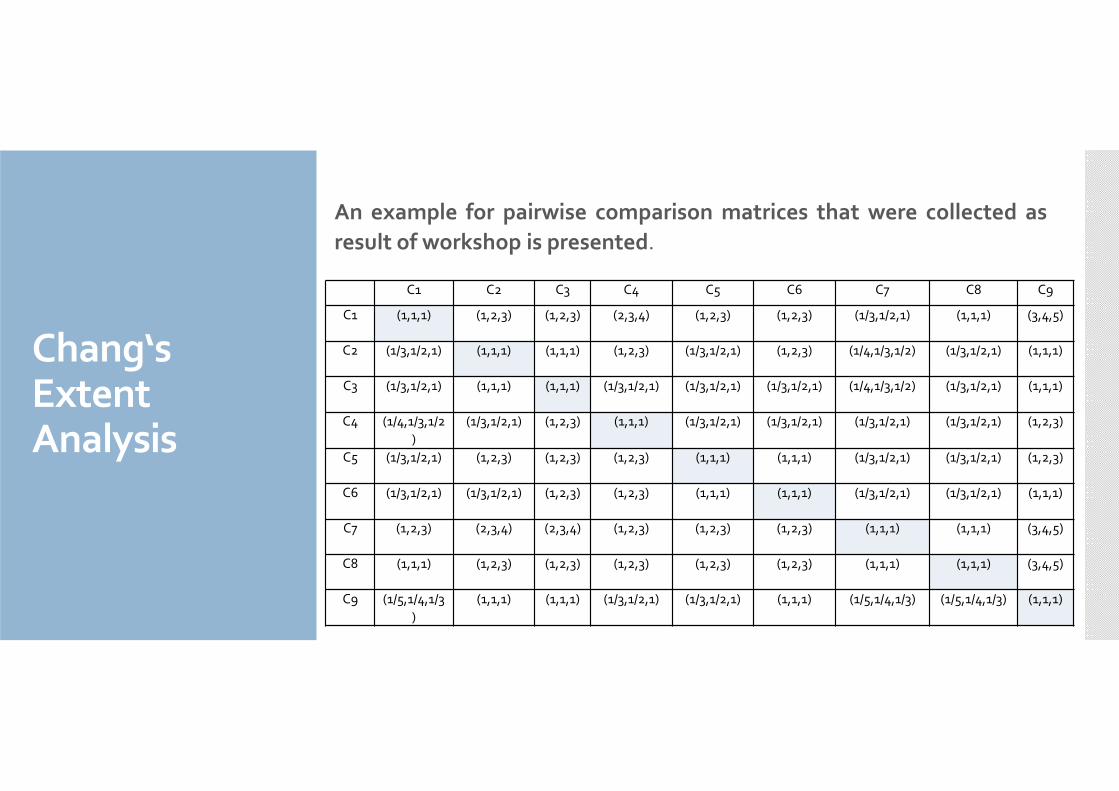
An example for pairwise comparison matrices that were collected as
result of workshop is presented.
C1 C2 C3 C4 C5 C6 C7 C8 C9
C1 (1,1,1) (1,2,3) (1,2,3) (2,3,4) (1,2,3) (1,2,3) (1/3,1/2,1) (1,1,1) (3,4,5)
C2 (1/3,1/2,1) (1,1,1) (1,1,1) (1,2,3) (1/3,1/2,1) (1,2,3) (1/4,1/3,1/2) (1/3,1/2,1) (1,1,1)
C3 (1/3,1/2,1) (1,1,1) (1,1,1) (1/3,1/2,1) (1/3,1/2,1) (1/3,1/2,1) (1/4,1/3,1/2) (1/3,1/2,1) (1,1,1)
C4 (1/4,1/3,1/2)
(1/3,1/2,1) (1,2,3) (1,1,1) (1/3,1/2,1) (1/3,1/2,1) (1/3,1/2,1) (1/3,1/2,1) (1,2,3)
C5 (1/3,1/2,1) (1,2,3) (1,2,3) (1,2,3) (1,1,1) (1,1,1) (1/3,1/2,1) (1/3,1/2,1) (1,2,3)
C6 (1/3,1/2,1) (1/3,1/2,1) (1,2,3) (1,2,3) (1,1,1) (1,1,1) (1/3,1/2,1) (1/3,1/2,1) (1,1,1)
C7 (1,2,3) (2,3,4) (2,3,4) (1,2,3) (1,2,3) (1,2,3) (1,1,1) (1,1,1) (3,4,5)
C8 (1,1,1) (1,2,3) (1,2,3) (1,2,3) (1,2,3) (1,2,3) (1,1,1) (1,1,1) (3,4,5)
C9 (1/5,1/4,1/3)
(1,1,1) (1,1,1) (1/3,1/2,1) (1/3,1/2,1) (1,1,1) (1/5,1/4,1/3) (1/5,1/4,1/3) (1,1,1)
Chang‘s ExtentAnalysis
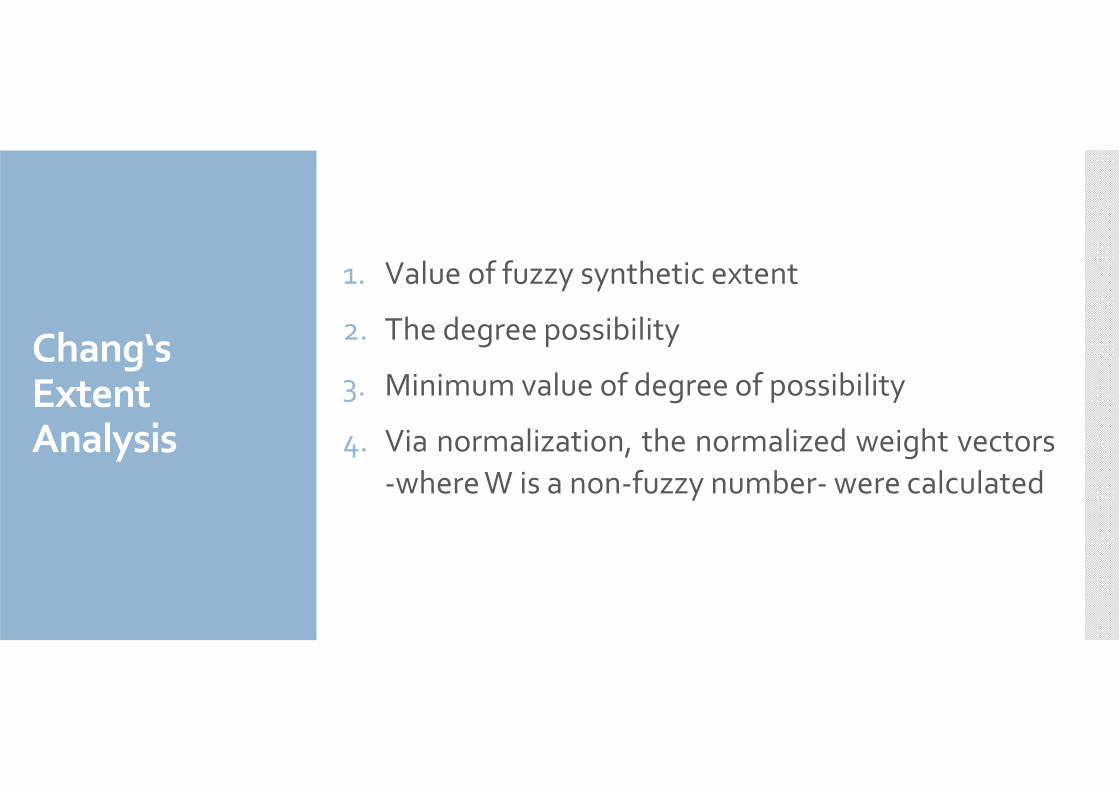
1. Value of fuzzy synthetic extent
2. The degree possibility
3. Minimum value of degree of possibility
4. Via normalization, the normalized weight vectors-where W is a non-fuzzy number- were calculated
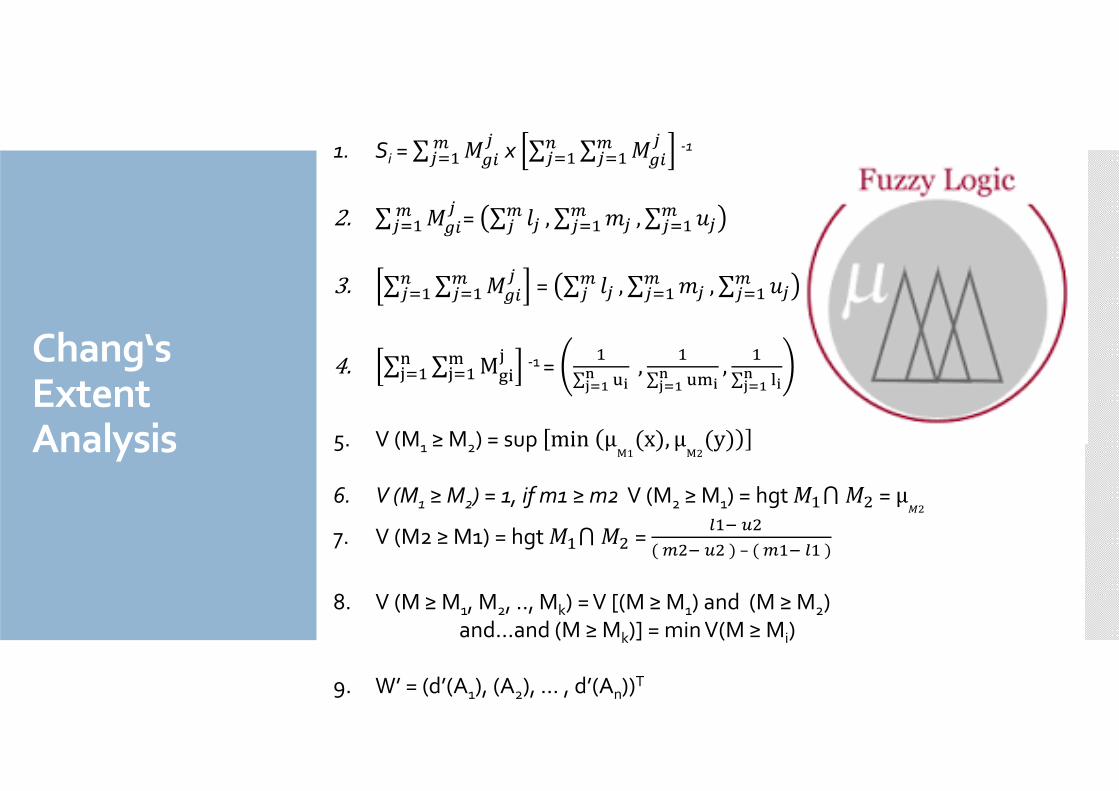
Chang‘s ExtentAnalysis
1. Si = ∑ �����
�� x ∑ ∑ �����
����
-1
2. ∑ �����
�� = ∑ ��� , ∑ ��
��� , ∑ ��
���
3. ∑ ∑ �����
���� = ∑ �
�� , ∑ ��
��� , ∑ ��
���
4. ∑ ∑ M����
�����
-1 =
∑ ������
,
∑ �������
,
∑ ������
5. V (M1 ≥ M2) = sup min μ$(x), μ
$((y)
6. V (M1 ≥ M2) = 1, if m1 ≥ m2 V (M2 ≥ M1) = hgt�⋂�( = μ+(
7. V (M2 ≥ M1) = hgt�⋂�( = ,-.(
(�(-.()–(�-,)
8. V (M ≥ M1, M2, .., Mk) = V [(M ≥ M1) and (M ≥ M2) and…and (M ≥ Mk)] = min V(M ≥ Mi)
9. W’ = (d’(A1), (A2), … , d’(An))T
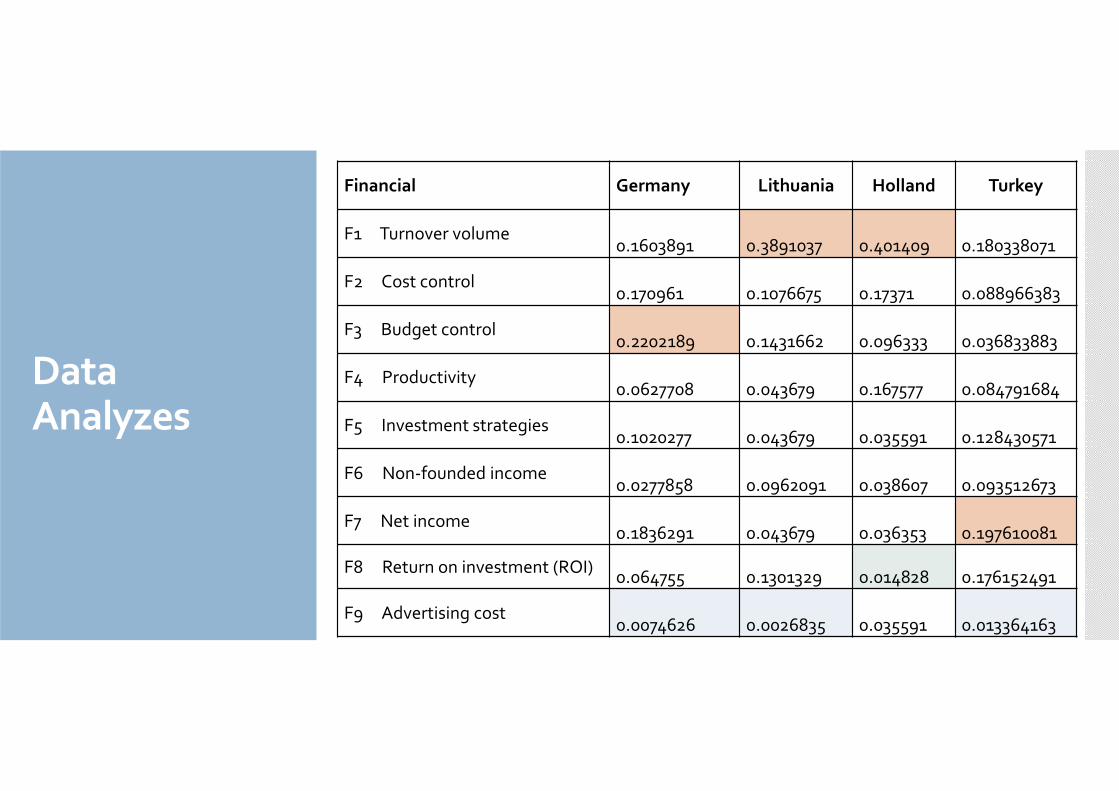
Data Analyzes
Financial Germany Lithuania Holland Turkey
F1 Turnover volume0.1603891 0.3891037 0.401409 0.180338071
F2 Cost control0.170961 0.1076675 0.17371 0.088966383
F3 Budget control0.2202189 0.1431662 0.096333 0.036833883
F4 Productivity0.0627708 0.043679 0.167577 0.084791684
F5 Investment strategies0.1020277 0.043679 0.035591 0.128430571
F6 Non-founded income0.0277858 0.0962091 0.038607 0.093512673
F7 Net income0.1836291 0.043679 0.036353 0.197610081
F8 Return on investment (ROI)0.064755 0.1301329 0.014828 0.176152491
F9 Advertising cost0.0074626 0.0026835 0.035591 0.013364163

Related Comments
According to the FAHP analysis results among financialindicators;
• “Turnover volume (F1)” has thehighest importance relatively in allfour countries in comparison withother financial indicators.
• “Advertising cost (F9)” has the leastimportance in all four countries incomparison with other financialindicators.
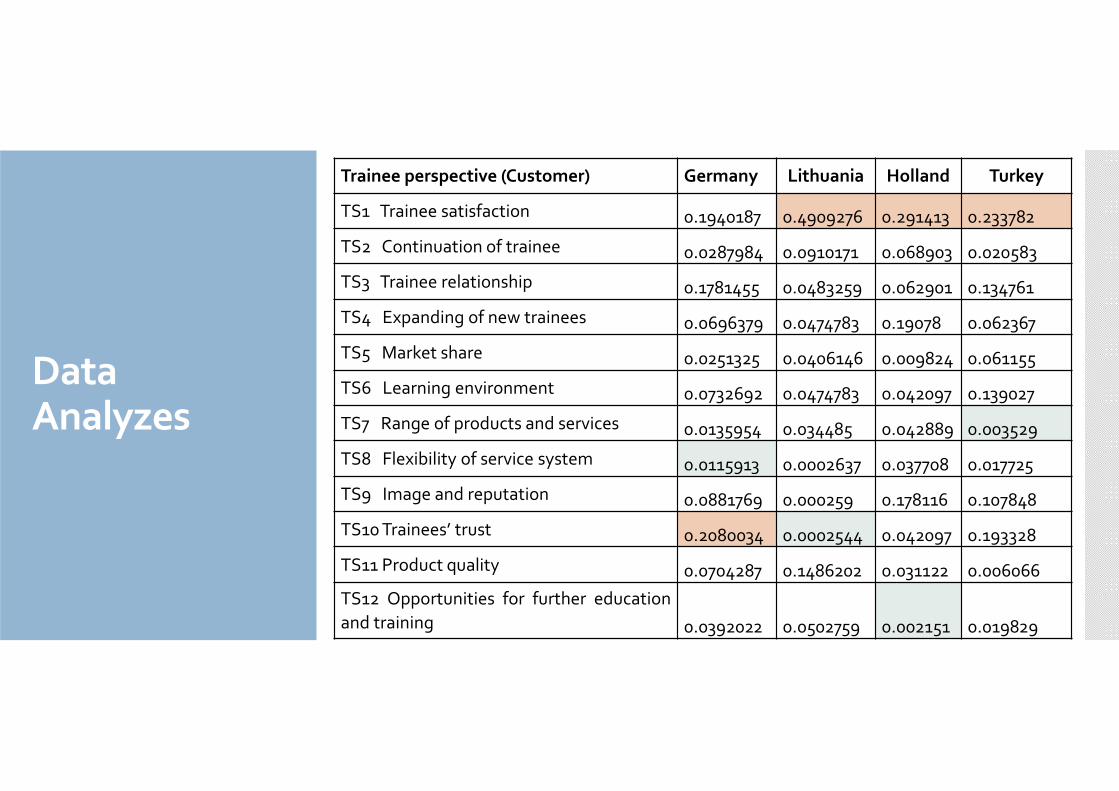
Data Analyzes
Trainee perspective (Customer) Germany Lithuania Holland Turkey
TS1 Trainee satisfaction 0.1940187 0.4909276 0.291413 0.233782
TS2 Continuation of trainee 0.0287984 0.0910171 0.068903 0.020583
TS3 Trainee relationship 0.1781455 0.0483259 0.062901 0.134761
TS4 Expanding of new trainees 0.0696379 0.0474783 0.19078 0.062367
TS5 Market share 0.0251325 0.0406146 0.009824 0.061155
TS6 Learning environment 0.0732692 0.0474783 0.042097 0.139027
TS7 Range of products and services 0.0135954 0.034485 0.042889 0.003529
TS8 Flexibility of service system 0.0115913 0.0002637 0.037708 0.017725
TS9 Image and reputation 0.0881769 0.000259 0.178116 0.107848
TS10 Trainees’ trust 0.2080034 0.0002544 0.042097 0.193328
TS11 Product quality 0.0704287 0.1486202 0.031122 0.006066
TS12 Opportunities for further educationand training 0.0392022 0.0502759 0.002151 0.019829
Related Comments
According to the FAHP analysis results among traineesatisfaction (customer) cluster;
• “Trainee satisfaction (TS1)” has the highest importancerelatively in all four countries in comparison with otherindicators in trainee satisfaction (customer) cluster.
Data Analyzes
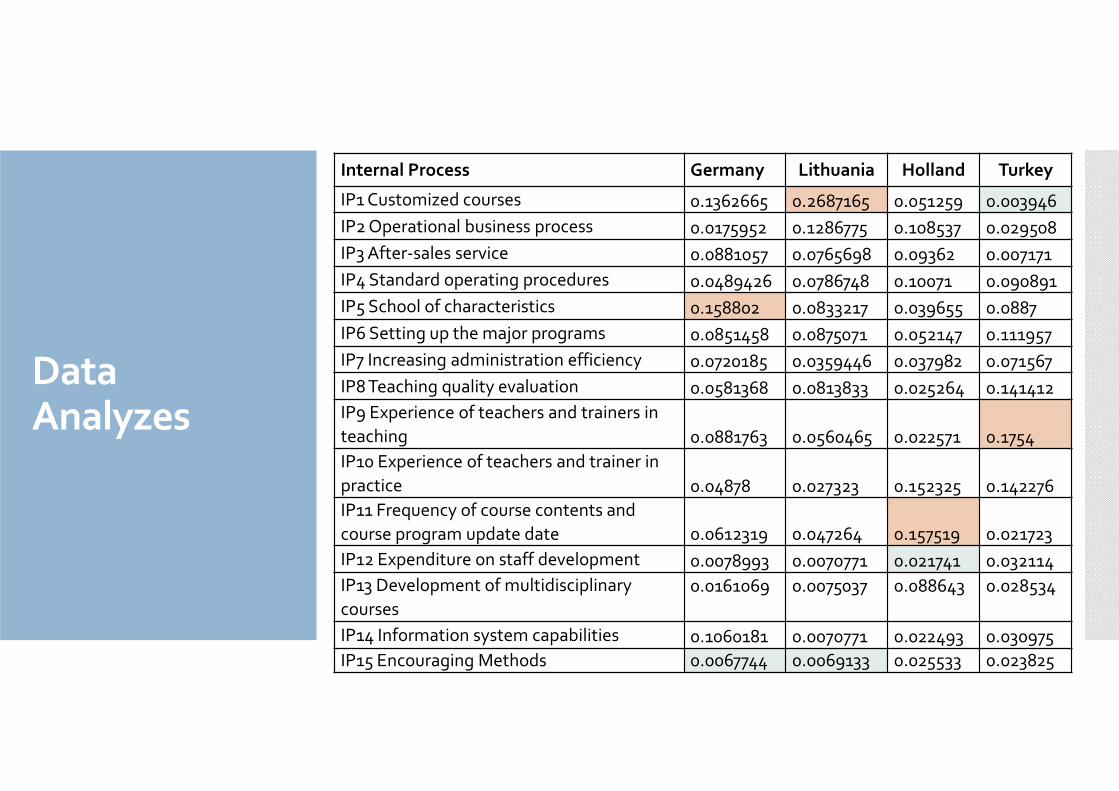
Internal Process Germany Lithuania Holland Turkey
IP1 Customized courses 0.1362665 0.2687165 0.051259 0.003946
IP2 Operational business process 0.0175952 0.1286775 0.108537 0.029508
IP3 After-sales service 0.0881057 0.0765698 0.09362 0.007171
IP4 Standard operating procedures 0.0489426 0.0786748 0.10071 0.090891
IP5 School of characteristics 0.158802 0.0833217 0.039655 0.0887
IP6 Setting up the major programs 0.0851458 0.0875071 0.052147 0.111957
IP7 Increasing administration efficiency 0.0720185 0.0359446 0.037982 0.071567
IP8 Teaching quality evaluation 0.0581368 0.0813833 0.025264 0.141412IP9 Experience of teachers and trainers in teaching 0.0881763 0.0560465 0.022571 0.1754IP10 Experience of teachers and trainer in practice 0.04878 0.027323 0.152325 0.142276IP11 Frequency of course contents and course program update date 0.0612319 0.047264 0.157519 0.021723
IP12 Expenditure on staff development 0.0078993 0.0070771 0.021741 0.032114IP13 Development of multidisciplinary courses
0.0161069 0.0075037 0.088643 0.028534
IP14 Information system capabilities 0.1060181 0.0070771 0.022493 0.030975IP15 Encouraging Methods 0.0067744 0.0069133 0.025533 0.023825
Related Comments
According to the FAHP analysis results among internal processcluster;
• Germany and Lithuania reported that “customized courses (IP1)”has the highest importance in comparison with other indicators.
• Turkey reported that “experience of teachers and trainers in
teaching (IP9)” and “experience of teachers and trainers in
practice (IP10)” have the highest importance respectively
• Netherlands reported that “frequency of course
contents and course program update date
(IP11)” and “experience of teachers and
trainers in practice (IP10)” have much moreimportance in comparison with other indicators.
Data Analyzes
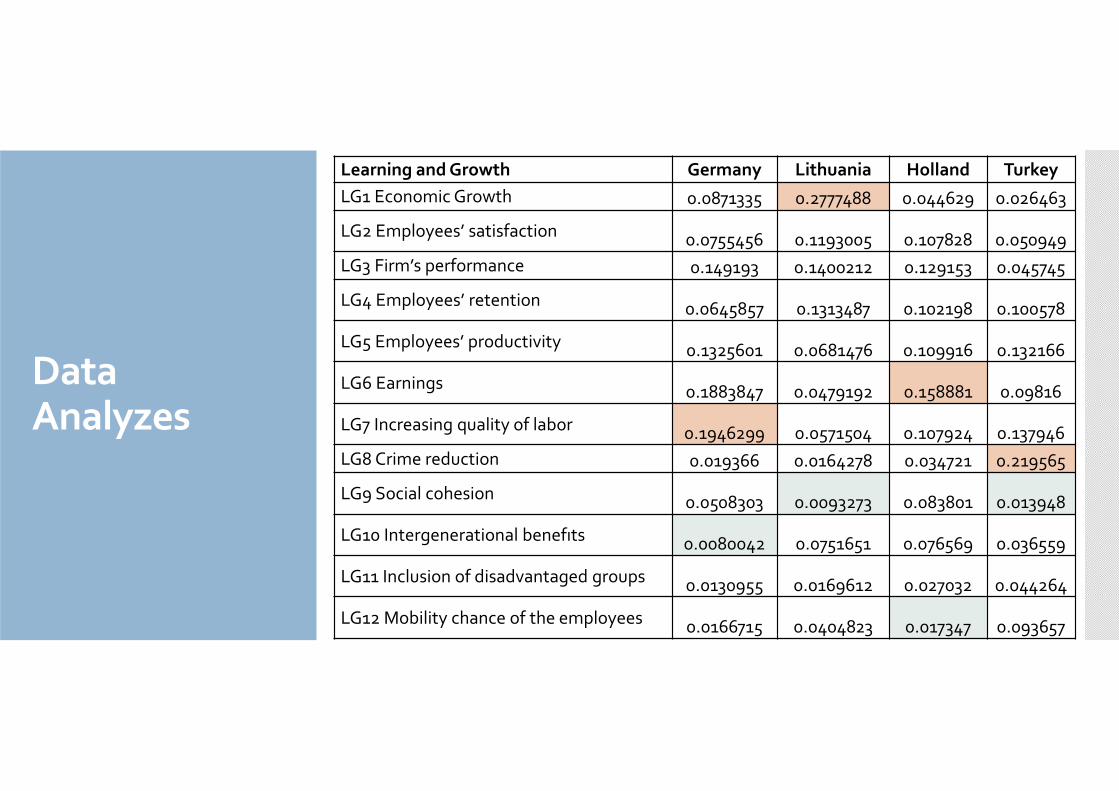
Learning and Growth Germany Lithuania Holland Turkey
LG1 Economic Growth 0.0871335 0.2777488 0.044629 0.026463
LG2 Employees’ satisfaction 0.0755456 0.1193005 0.107828 0.050949
LG3 Firm’s performance 0.149193 0.1400212 0.129153 0.045745
LG4 Employees’ retention 0.0645857 0.1313487 0.102198 0.100578
LG5 Employees’ productivity 0.1325601 0.0681476 0.109916 0.132166
LG6 Earnings 0.1883847 0.0479192 0.158881 0.09816
LG7 Increasing quality of labor 0.1946299 0.0571504 0.107924 0.137946
LG8 Crime reduction 0.019366 0.0164278 0.034721 0.219565
LG9 Social cohesion 0.0508303 0.0093273 0.083801 0.013948
LG10 Intergenerational benefıts 0.0080042 0.0751651 0.076569 0.036559
LG11 Inclusion of disadvantaged groups 0.0130955 0.0169612 0.027032 0.044264
LG12 Mobility chance of the employees 0.0166715 0.0404823 0.017347 0.093657
Related Comments
According to the FAHP analysis results among learning andgrowth cluster;
• “Crime Reduction (LG8)” has the highestimportance in comparison with otherindicators in learning and growth cluster forTurkey.
• Lithuania reported that “economic
growth (LG1)” has the highestimportance in comparison withother indicators and also“economic growth (LG1)” has ahuge variety in rankings incomparison with other countries’results.