Embed Size (px)
Citation preview
Journal of Food and Drug Analysis, Vol. 10, No. 2, 2002, Pages 127-134
* Author for correspondence. Tel: 02-26531262;Fax: 02-26531256; E-mail:[email protected]
127
Determination of Butachlor and Pencycuron Residues inVegetables and Rice: Application of the Macroporous
Diatomaceous Earth Column SU-HSIANG TSENG*, PI-CHIOU CHANG AND SHIN-SHOU CHOU
National Laboratories of Foods and Drugs, Department of Health,
Executive Yuan, 161-2, Kuen Yang Street, Nankang, 11513, Taipei, Taiwan, R.O.C.
(Received: April 18, 2001; Accepted: August 28, 2001)
ABSTRACT
Butachlor and pencycuron are commonly used pesticides in Taiwan, but still lack official methods for determining butachlor and pen-cycuron residues in agricultural products. An analytical method using a macroporous diatomaceous earth (MDE) column and florisil car-tridge for cleanup procedure was developed for determination of butachlor and pencycuron in vegetables and rice. Butachlor and pency-curon were extracted from crops with acetone and the concentrated extract was transferred into the MDE column, eluted with n-hexane.The eluate was concentrated and applied on a florisil cartridge. The cartridge was washed with 5% diethyl ether in n-hexane (E/H), andthen eluted with 15% E/H (fraction I) and 15% ethyl acetate in n-hexane (EA/H) (fraction II). Butachlor residue in fraction I was deter-mined by GC-ECD. Pencycuron residue in fraction II was determined by HPLC-UV at 248 nm. Chinese mustard and rice samples werefortified with butachlor and pencycuron at levels of 0.25~0.75 ppm and analyzed. The recoveries of butachlor and pencycuron werebetween 84.9~94.9% and 88.3~94.8%, respectively. The detection limits of both pesticides in Chinese mustard and rice were 0.05 ppm.
MDE liquid/liquid extraction cartridges provide a means of simplifying and speeding up multiple liquid/liquid extractions.
Key words: butachlor, pencycuron, vegetable, rice, macroporous diatomaceous earth column, florisil cartridge
INTRODUCTION
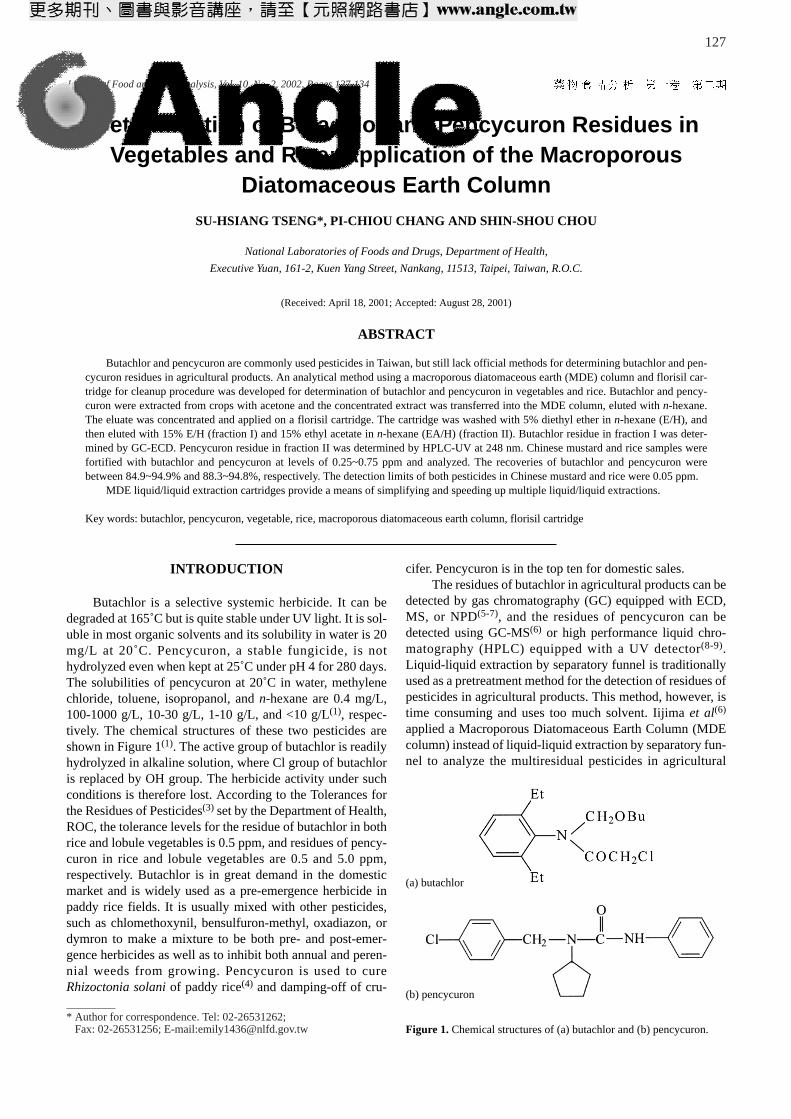
Butachlor is a selective systemic herbicide. It can bedegraded at 165˚C but is quite stable under UV light. It is sol-uble in most organic solvents and its solubility in water is 20mg/L at 20˚C. Pencycuron, a stable fungicide, is nothydrolyzed even when kept at 25˚C under pH 4 for 280 days.The solubilities of pencycuron at 20˚C in water, methylenechloride, toluene, isopropanol, and n-hexane are 0.4 mg/L,100-1000 g/L, 10-30 g/L, 1-10 g/L, and <10 g/L(1), respec-tively. The chemical structures of these two pesticides areshown in Figure 1(1). The active group of butachlor is readilyhydrolyzed in alkaline solution, where Cl group of butachloris replaced by OH group. The herbicide activity under suchconditions is therefore lost. According to the Tolerances forthe Residues of Pesticides(3) set by the Department of Health,ROC, the tolerance levels for the residue of butachlor in bothrice and lobule vegetables is 0.5 ppm, and residues of pency-curon in rice and lobule vegetables are 0.5 and 5.0 ppm,respectively. Butachlor is in great demand in the domesticmarket and is widely used as a pre-emergence herbicide inpaddy rice fields. It is usually mixed with other pesticides,such as chlomethoxynil, bensulfuron-methyl, oxadiazon, ordymron to make a mixture to be both pre- and post-emer-gence herbicides as well as to inhibit both annual and peren-nial weeds from growing. Pencycuron is used to cureRhizoctonia solani of paddy rice(4) and damping-off of cru-
cifer. Pencycuron is in the top ten for domestic sales. The residues of butachlor in agricultural products can be
detected by gas chromatography (GC) equipped with ECD,MS, or NPD(5-7), and the residues of pencycuron can bedetected using GC-MS(6) or high performance liquid chro-matography (HPLC) equipped with a UV detector(8-9).Liquid-liquid extraction by separatory funnel is traditionallyused as a pretreatment method for the detection of residues ofpesticides in agricultural products. This method, however, istime consuming and uses too much solvent. Iijima et al(6)
applied a Macroporous Diatomaceous Earth Column (MDEcolumn) instead of liquid-liquid extraction by separatory fun-nel to analyze the multiresidual pesticides in agricultural
Figure 1. Chemical structures of (a) butachlor and (b) pencycuron.
(a) butachlor
(b) pencycuron
products. This method is worthy of trying. In this study, theMDE column and solid phase extraction (SPE) cartridgewere used as tools for sample cleanup and the low toxic sol-vents were selected to research the analytical conditions. Ananalytical method needs to be developed which is time effi-cient, environmentally friendly, and has high recovery, satis-factory reproducibility, and high sensitivity in detection lim-its. The developed method could be a reference for relatedauthorities to establish the standard inspection method.
MATERIALS AND METHODS
I. Materials
The Chinese mustard and rice samples were purchasedfrom supermarkets or traditional markets. MDE column(Chem Elut, 20 mL) was made by Varian (USA) and florisilSPE cartridge (1000 mg, 6 mL) was purchased from J&WScientific (CA, USA).
II. Reagents
Acetone and n-hexane used in this study were residualgrades. Methanol and ethyl acetate was LC grade and diethylether was reagent grade. The standards of butachlor and pen-cycuron (of purity 99%) were purchased from Riedel-deHaen AG (Germany).
III. Instruments and Analytical Conditions
(I) GC
A Varian 3400 GC equipped with an ECD, a DB-1 orDB-5 capillary column (30 m × 0.53 mm i.d., J&WScientific, CA, USA), and a Shimadzu C-R4A integrator wasused in this study. The temperatures of oven, injection port,and detector were 210˚C, 250˚C, and 300˚C, respectively.The sample volume of 1 µL was injected. The flow rate ofcarrier gas, nitrogen, was 10 mL/min.
(II) HPLC
A Hitachi (Japan) HPLC system equipped with aHitachi L-6200 pump, a HyPURITYTM Elite C18 analyticalcolumn (25 cm × 4.6 mm i.d., 5 µm, Hypersil, Runcon, UK),a Hitachi L-4250 UV detector, and a Shimadzu C-R4A inte-grator was used. The UV detector was set at 248 nm. Themobile phase system was methanol: water (72: 28, v/v)pumped at 1.0 mL/min. The injection volume was 20 µL.
(III) Gas Chromatography / Electron Impact MassSpectrometer (GC / EIMS)
A HP-5890 series II GC equipped with a HP 5970 Bquadruple mass selective detector (MSD) and a J&W Rtx-5analytical column (30 m × 0.25 mm i.d.) was used. A HP59944A MS ChemStation software in HP 340C computer
was used as the data analysis system. The oven temperaturewas programmed at 150˚C for 3 min followed by rising up to250˚C at 10˚C/min. The injection port and MSD interfacetemperatures were 250˚C and 280˚C, respectively. The injec-tion volume was 1 µL. The carrier gas was helium and thehead pressure was set at 8 psi. The ionization energy was setat 70eV.
IV. Methods
(I) Preparation of Standard Solutions
Butachlor (100 mg) was accurately weighed into a 100-mL volumetric flask and n-hexane was then added to the vol-ume to be a stock solution. A series of standard solutionswere prepared by diluting the stock solution with n-hexane.Pencycuron (100 mg) was accurately weighed into a 100-mLvolumetric flask and methanol was then added to the volumeto make a stock pencycuron solution. The stock solution wasthen pipetted and diluted with methanol as needed to preparea series of standard solutions.
(II) Preparation of Sample Solutions
1. Extraction
The rice sample was ground into powder and 10 g ofwhich was then mixed with 18 mL of water and kept standingfor 1 hr, then extracted with 100 mL acetone for 3 min. TheChinese mustard sample was homogenized and 20 g of whichwas then sampled and extracted with 100 mL of acetone for3 min. The extraction solution was then filtered under suc-tion. The residues and container were then washed withanother 50 mL of acetone, which was then filtered. The fil-trates were combined into an evaporation vessel and evapo-rated at 35~40˚C under vacuum. The concentrate (~18 mL)was applied onto a MDE column (Chem Elut, 20 mL, Varian,USA) and kept standing for 10 min allowing the concentratesevenly dispersed in MDE column. The concentrate in MDEcolumn was eluted with 100 mL of n-hexane, evaporated todryness, and then dissolved in 5 mL of n-hexane.
2. Solid Phase Extraction for Sample Cleanup
The above concentrate (2 mL) was loaded into a florisilcartridge (1000 mg, 6 mL, J&W Scientific, CA, USA), whichwas rinsed with n-hexane prior to applying samples. The con-centrate in cartridge was then eluted stepwise with 10 mL of5% diethyl ether in n-hexane (5% E/H), 15 mL of 15%diethyl ether in n-hexane (15% E/H), and 15% ethyl acetatein n-hexane (15% EA/H). The above eluents were separatelycollected. The eluent 15% E/H was evaporated to dryness,dissolved in 2 mL of n-hexane, and analyzed with GC-ECDfor detection of butachlor. The eluent 15% EA/H was evapo-rated to dryness, dissolved in 2 mL of methanol, filteredthrough a 0.45 µm nylon membrane, and analyzed withHPLC-UV at 248 nm for detection of pencycuron. A flow
Journal of Food and Drug Analysis, Vol. 10, No. 2, 2002
128
preparation of sample solution was as described. Recoveriesfor butachlor and pencycuron were calculated after GC orHPLC analysis.
(V) Detection Limit Test
A suitable amount of butachlor and pencycuron wasspiked to a homogenized sample. The test sample solutionwas prepared as described. The detection limit was estimatedon the basis of signal to noise (S/N) ratio greater than 3.
RESULTS AND DISCUSSION
I. Preparation of Sample Solutions
(I) The Elution of Butachlor and Pencycuron from MDEColumn
In this study, a macroporous diatomaceous earth (MDE)column, which is a commercialized liquid/liquid extractioncartridge, was used to replace the traditional separatory fun-nel for liquid/liquid extraction. MDE column is a polypropy-lene (PP) cartridge packed with highly pure and inert macro-porous diatomaceous earth. The high surface area makes highefficiency in interaction between sample and extraction sol-vent without emulsion. MDE column is easy to use and theextraction process can be done without any suction, onlyrelying on gravity. The column is packed with a phase-sepa-ration filtering material to protect the organic eluents frombeing contaminated with aqueous matrix. The advantages ofusing MDE column are as follows: 1. The device is simpleand easy to use. 2. Several samples can be processed simulta-neously. 3. Emulsion would not happen by using MDE col-umn. 4. It is not necessary to dehydrate the eluent by anhy-drous sodium sulfate. To bring the liquid/liquid extractionefficiency into full play, the sample was loaded into MDEcolumn and kept standing for 10 min allowing sample solu-tory to evenly disperse in column. A stopcock was installedupon column to control the elution speed at 3~5 mL/min afterapplying extraction solution. This could increase recoveryand reproducibility.
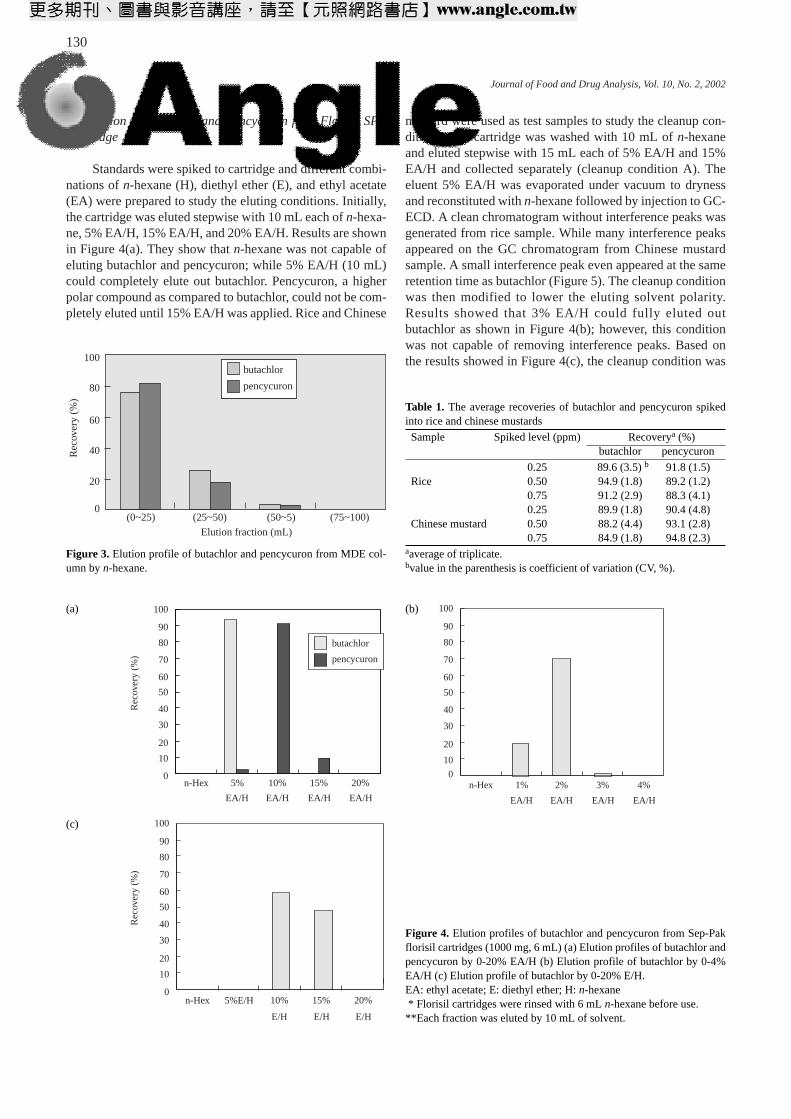
According to literature(6), n-hexane was used as elutingsolvent for MDE column application. The recovery of stan-dards was researched by collecting and analyzing each frac-tion of eluent (25 mL). The results are shown in Figure 3. Thefirst fraction of eluent could give about 80% recovery forboth butachlor and pencycuron. The standards could be fullyrecovered when 75 mL of eluent was collected. Practically,100 mL of n-hexane was used as elution solvent and about 80mL of eluent was collected that could result in a satisfactoryrecovery (Table 1). The MDE column operation was compa-rable to the traditional liquid/liquid extraction by using sepa-ratory funnel in terms of recovery. Moreover, MDE columnis easy to use, time economical, and no emulsion problem.The eluent from an MDE column is clearer than when theextraction solution is processed by a separatory funnel.
Journal of Food and Drug Analysis, Vol. 10, No. 2, 2002
129
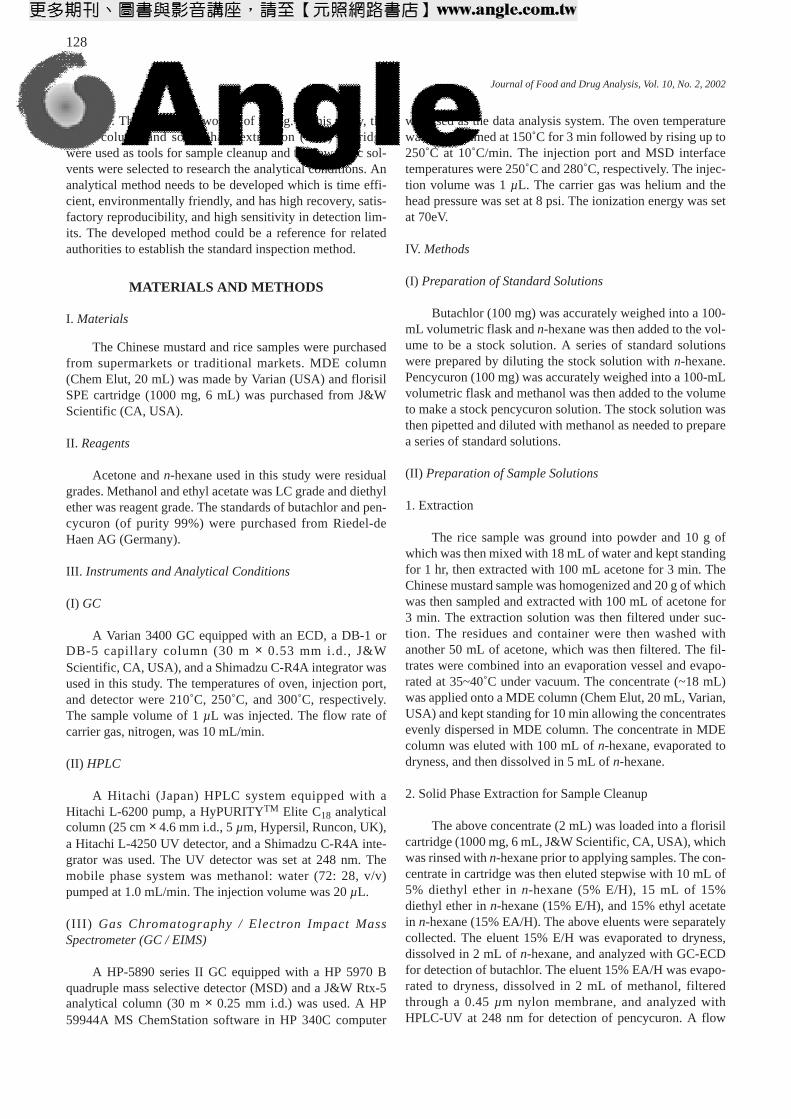
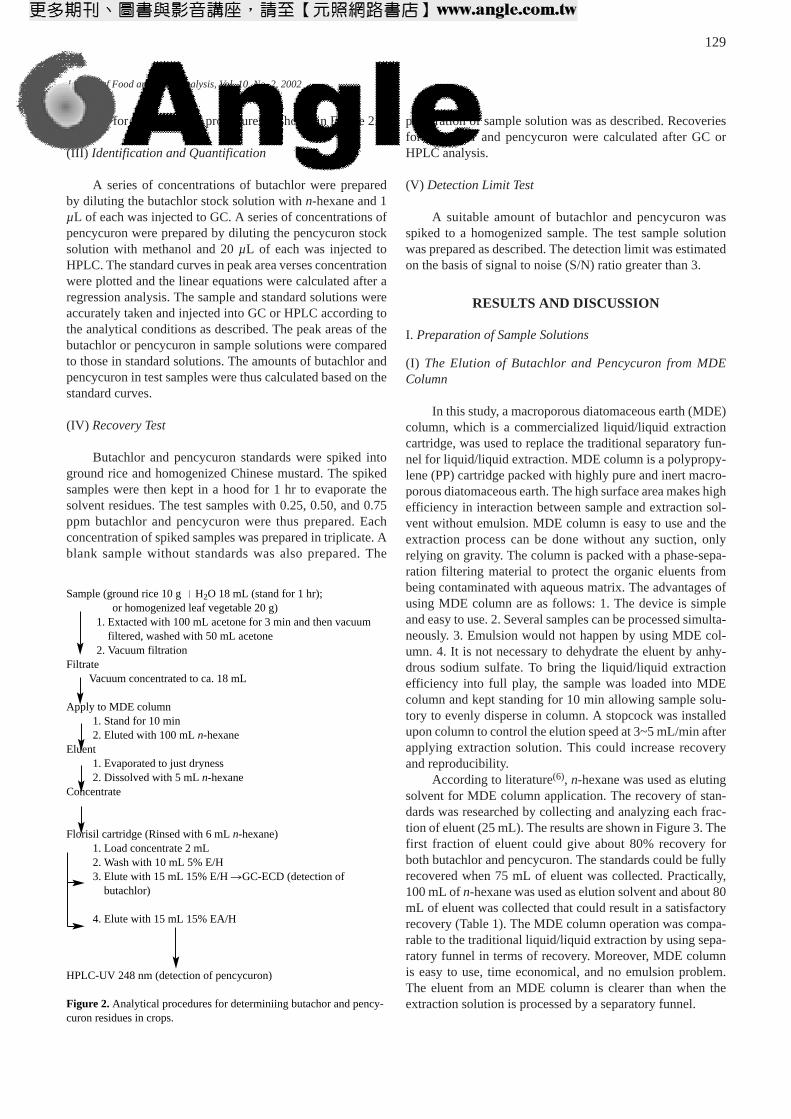
diagram for the analytical procedures is shown in Figure 2.
(III) Identification and Quantification
A series of concentrations of butachlor were preparedby diluting the butachlor stock solution with n-hexane and 1µL of each was injected to GC. A series of concentrations ofpencycuron were prepared by diluting the pencycuron stocksolution with methanol and 20 µL of each was injected toHPLC. The standard curves in peak area verses concentrationwere plotted and the linear equations were calculated after aregression analysis. The sample and standard solutions wereaccurately taken and injected into GC or HPLC according tothe analytical conditions as described. The peak areas of thebutachlor or pencycuron in sample solutions were comparedto those in standard solutions. The amounts of butachlor andpencycuron in test samples were thus calculated based on thestandard curves.
(IV) Recovery Test
Butachlor and pencycuron standards were spiked intoground rice and homogenized Chinese mustard. The spikedsamples were then kept in a hood for 1 hr to evaporate thesolvent residues. The test samples with 0.25, 0.50, and 0.75ppm butachlor and pencycuron were thus prepared. Eachconcentration of spiked samples was prepared in triplicate. Ablank sample without standards was also prepared. The
Sample (ground rice 10 g H2O 18 mL (stand for 1 hr); or homogenized leaf vegetable 20 g)
1. Extacted with 100 mL acetone for 3 min and then vacuumfiltered, washed with 50 mL acetone
2. Vacuum filtrationFiltrate
Vacuum concentrated to ca. 18 mL
Apply to MDE column1. Stand for 10 min2. Eluted with 100 mL n-hexane
Eluent1. Evaporated to just dryness2. Dissolved with 5 mL n-hexane
Concentrate
Florisil cartridge (Rinsed with 6 mL n-hexane)1. Load concentrate 2 mL2. Wash with 10 mL 5% E/H3. Elute with 15 mL 15% E/H �GC-ECD (detection of
butachlor)
4. Elute with 15 mL 15% EA/H
HPLC-UV 248 nm (detection of pencycuron)
Figure 2. Analytical procedures for determiniing butachor and pency-curon residues in crops.
Journal of Food and Drug Analysis, Vol. 10, No. 2, 2002
130
(II) Elution of Butachlor and Pencycuron from Florisil SPECartridge
Standards were spiked to cartridge and different combi-nations of n-hexane (H), diethyl ether (E), and ethyl acetate(EA) were prepared to study the eluting conditions. Initially,the cartridge was eluted stepwise with 10 mL each of n-hexa-ne, 5% EA/H, 15% EA/H, and 20% EA/H. Results are shownin Figure 4(a). They show that n-hexane was not capable ofeluting butachlor and pencycuron; while 5% EA/H (10 mL)could completely elute out butachlor. Pencycuron, a higherpolar compound as compared to butachlor, could not be com-pletely eluted until 15% EA/H was applied. Rice and Chinese
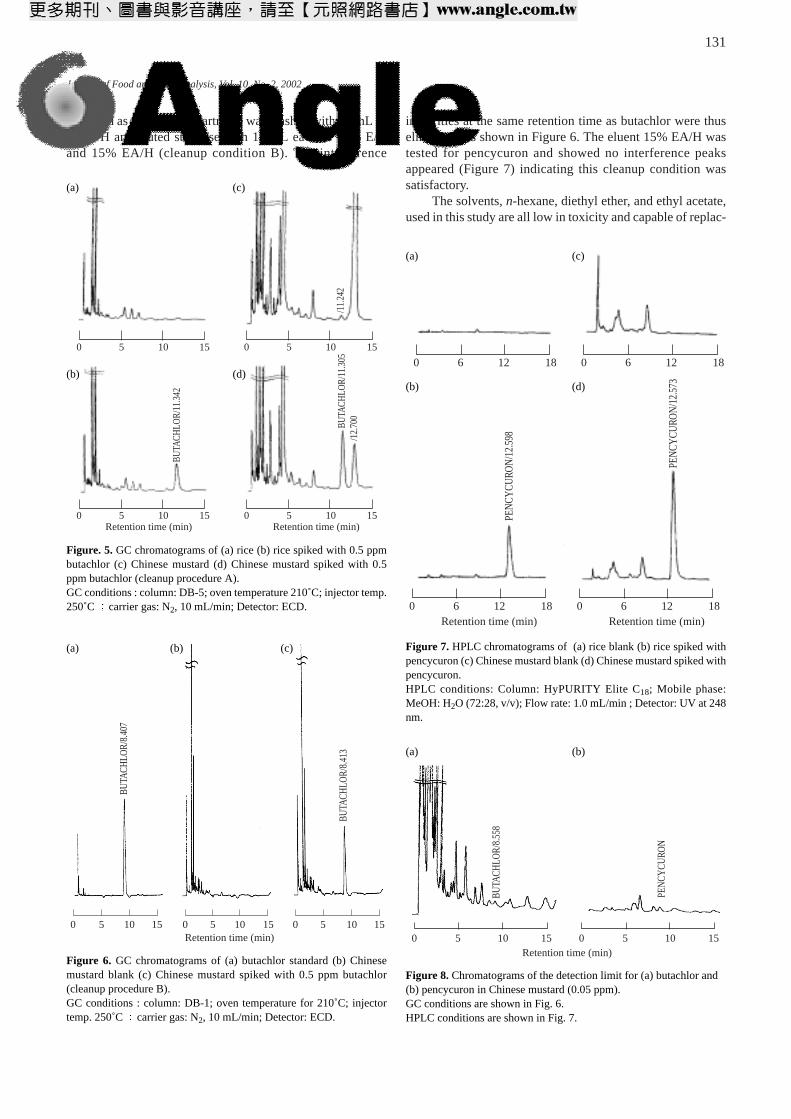
mustard were used as test samples to study the cleanup con-ditions. The cartridge was washed with 10 mL of n-hexaneand eluted stepwise with 15 mL each of 5% EA/H and 15%EA/H and collected separately (cleanup condition A). Theeluent 5% EA/H was evaporated under vacuum to drynessand reconstituted with n-hexane followed by injection to GC-ECD. A clean chromatogram without interference peaks wasgenerated from rice sample. While many interference peaksappeared on the GC chromatogram from Chinese mustardsample. A small interference peak even appeared at the sameretention time as butachlor (Figure 5). The cleanup conditionwas then modified to lower the eluting solvent polarity.Results showed that 3% EA/H could fully eluted outbutachlor as shown in Figure 4(b); however, this conditionwas not capable of removing interference peaks. Based onthe results showed in Figure 4(c), the cleanup condition was
0n-Hex 1% 2%
EA/H EA/H EA/H EA/H
3% 4%
20
30
10
40
50
60
70
80
90
100
0n-Hex 5%E/H 10%
E/H E/H E/H
15% 20%
20
30
10
40
50
60
70
80
90
100
butachlor
pencycuron
0n-Hex 5% 10%
EA/H EA/H EA/H EA/H
15% 20%
20
30
10
40
50
60
70
80
90
100
Rec
over
y (%
)R
ecov
ery
(%)
Figure 4. Elution profiles of butachlor and pencycuron from Sep-Pakflorisil cartridges (1000 mg, 6 mL) (a) Elution profiles of butachlor andpencycuron by 0-20% EA/H (b) Elution profile of butachlor by 0-4%EA/H (c) Elution profile of butachlor by 0-20% E/H.EA: ethyl acetate; E: diethyl ether; H: n-hexane* Florisil cartridges were rinsed with 6 mL n-hexane before use.**Each fraction was eluted by 10 mL of solvent.
(a) (b)
(c)
Table 1. The average recoveries of butachlor and pencycuron spikedinto rice and chinese mustards
Sample Spiked level (ppm) Recoverya (%)butachlor pencycuron
0.25 89.6 (3.5) b 91.8 (1.5)Rice 0.50 94.9 (1.8) 89.2 (1.2)
0.75 91.2 (2.9) 88.3 (4.1)0.25 89.9 (1.8) 90.4 (4.8)
Chinese mustard 0.50 88.2 (4.4) 93.1 (2.8)0.75 84.9 (1.8) 94.8 (2.3)
aaverage of triplicate.bvalue in the parenthesis is coefficient of variation (CV, %).
butachlor
pencycuron
(0~25)0
20
40
60
80
100
Rec
over
y (%
)
(25~50) (50~5) (75~100)Elution fraction (mL)
Figure 3. Elution profile of butachlor and pencycuron from MDE col-umn by n-hexane.
Journal of Food and Drug Analysis, Vol. 10, No. 2, 2002
131
modified as follows: the cartridge was washed with 10 mL of5% E/H and eluted stepwise with 15 mL each of 15% E/Hand 15% EA/H (cleanup condition B). The interference
impurities at the same retention time as butachlor were thuseliminated as shown in Figure 6. The eluent 15% EA/H wastested for pencycuron and showed no interference peaksappeared (Figure 7) indicating this cleanup condition wassatisfactory.
The solvents, n-hexane, diethyl ether, and ethyl acetate,used in this study are all low in toxicity and capable of replac-
0 5 10Retention time (min)
15 0 5 10Retention time (min)
15
0 5 10
BUTA
CHLO
R/11
.342
BUTA
CHLO
R/11
.305
/12.
700
/11.
242
15 0 5 10 15
Figure. 5. GC chromatograms of (a) rice (b) rice spiked with 0.5 ppmbutachlor (c) Chinese mustard (d) Chinese mustard spiked with 0.5ppm butachlor (cleanup procedure A).GC conditions : column: DB-5; oven temperature 210˚C; injector temp.250˚C carrier gas: N2, 10 mL/min; Detector: ECD.
(a) (c)
(b) (d)
0 5 10Retention time (min)
15 0 5 10 15 0 5 10 15
BUTA
CHLO
R/8.
407
BUTA
CHLO
R/8.
413
Figure 6. GC chromatograms of (a) butachlor standard (b) Chinesemustard blank (c) Chinese mustard spiked with 0.5 ppm butachlor(cleanup procedure B). GC conditions : column: DB-1; oven temperature for 210˚C; injectortemp. 250˚C carrier gas: N2, 10 mL/min; Detector: ECD.
(a) (c)(b)
0 6 12Retention time (min)
18 0 6 12Retention time (min)
18
0 6 12 18 0 6 12 18
PEN
CYCU
RON
/12.
573
PEN
CYCU
RON
/12.
598
Figure 7. HPLC chromatograms of (a) rice blank (b) rice spiked withpencycuron (c) Chinese mustard blank (d) Chinese mustard spiked withpencycuron.HPLC conditions: Column: HyPURITY Elite C18; Mobile phase:MeOH: H2O (72:28, v/v); Flow rate: 1.0 mL/min ; Detector: UV at 248nm.
(a) (c)
(b) (d)
0 5 10Retention time (min)
15 0 5 10 15
BUTA
CHLO
R/8.
558
PEN
CYCU
RON
Figure 8. Chromatograms of the detection limit for (a) butachlor and(b) pencycuron in Chinese mustard (0.05 ppm).GC conditions are shown in Fig. 6. HPLC conditions are shown in Fig. 7.
(a) (b)
Journal of Food and Drug Analysis, Vol. 10, No. 2, 2002
132
ing chloroform and methylene chloride, the carcinogenic andhighly polluting agents, for pesticide analysis.
II. Recovery Test
The recoveries of butachlor and pencycuron from riceand Chinese mustard spiked with 0.25~0.75 ppm standardsare listed in Table 1. The recoveries of butachlor and pency-curon from rice were 89.6~94.9% with 1.8~3.5 coefficient ofvariation and 88.3~91.8% with 1.2~4.1% coefficient of vari-ation, respectively. While the recoveries of butachlor and
pencycuron from Chinese mustard were 88.2~89.9% with1.8~4.4% coefficient of variation and 90.4~94.8% with2.3~4.8% coefficient of variation, respectively. Above datashows both satisfactory recovery and reproducibility wereachieved.
III. Detection Limit Test
The detection limits of both butachlor and pencycuronwere all determined to be 0.05 ppm. Chinese mustard wasused as test sample because the rice sample could generate
1.80e+07
Abundance
1.60e+071.40e+071.20e+071.00e+078.00e+066.00e+064.00e+062.00e+060.00e+00
6 8 10 12 14 16 18 20Time (min.)
Mass/charge
Scan 897 (13.820 min) or butachlor.d
22 24
18000001600000140000012000001000000
800000600000400000200000
0
57
77 117148
Abundance
140000012000001000000
800000
600000400000200000
0
Abundance
010000002000000
30000004000000500000060000007000000
Abundance
TIC of butachlor.d
Filesdirectory / chem / msd
Graphics Integration Reports spectra Library Search Help
176
188
237238
278 311
280200 24016012080
6 8 10 12 14 16 18 20Time (min.)
Mass/charge140 180 20016012080 10060
Filesdirectory / chem / msd
Graphics Integration Reports Spectra Library Search Help
Scan 436 (8.801 min) or pencycuron.d
TIC of pencycuron.d
6377
8999
125
140 152
180
183
208
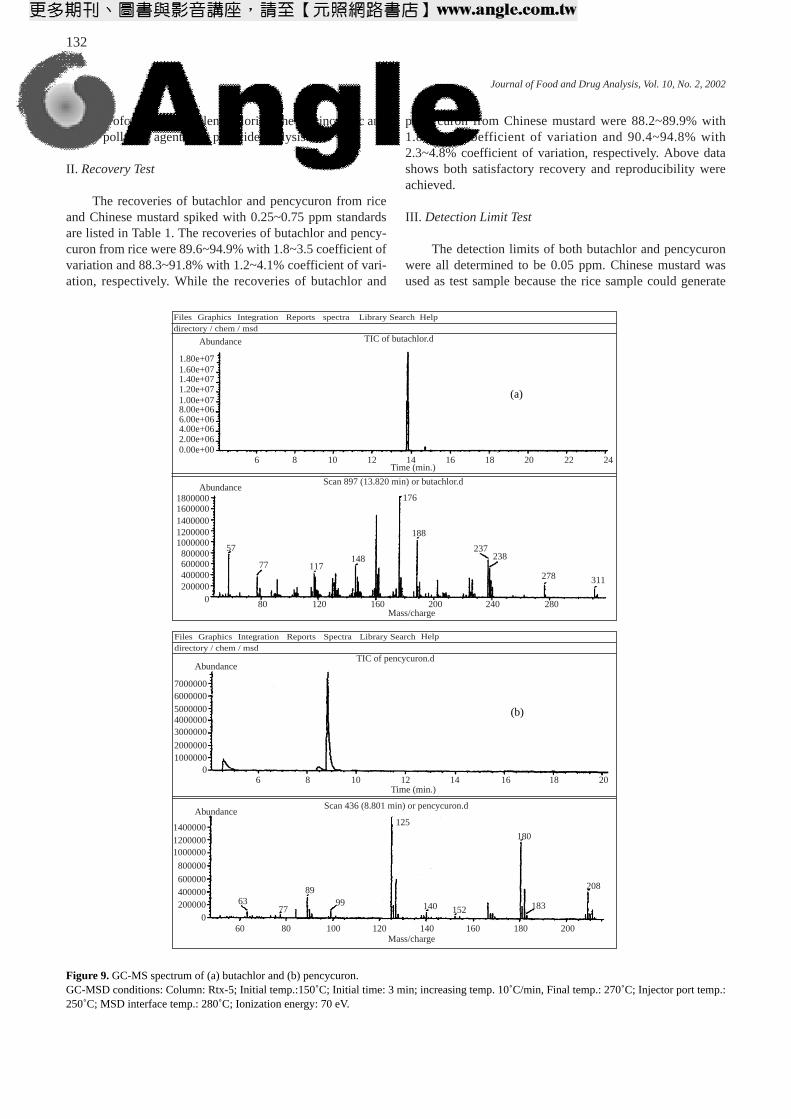
Figure 9. GC-MS spectrum of (a) butachlor and (b) pencycuron.GC-MSD conditions: Column: Rtx-5; Initial temp.:150˚C; Initial time: 3 min; increasing temp. 10˚C/min, Final temp.: 270˚C; Injector port temp.:250˚C; MSD interface temp.: 280˚C; Ionization energy: 70 eV.
(a)
(b)
3. Department of Health, Executive Yuan. 2000. Tolerancesfor Residues of Pesticides. Ordinance No. 0890036186.(in Chinese)
4. Hsin, C. Y. 2000. Application of pesticides in Taiwan. In“The Proceedings of the ROC-Japanese Symposium onEndocrine Disrupting Chemicals”. Nov.11-12. pp.77-80.Chen, C. Y. and Huang, K. C. ed. (in Chinese)
5. Nakamura, Y., Yoshii, K., Tsumura, Y. Tonogai, Y. andShibata, Y. 1998. Application and improvement of thebulletin method on the analysis of quintozene, triflurarin,isoprothiolane and butachlor. Shokuhin Eiseigaku Zasshi39: 51-59.
6. Iijima, K., Saka, M., Odanaka, Y. and Matano, O. 1997.Multiresidue analytical method of pesticides by GC-MS:application of macroporous diatomaceous earth columnand silica gel cartridge. Nippon Noyaku Gakkaishi 22:17-26.
7. Nagayama, T., Kobayashi, M., Shioda, H., Ito, M.,Tamura, Y. and Tamura, Y. 1991. Comparison for deter-mination method of 9 kinds of herbicides containingnitrogen in agricultural products between by GC andHPLC. Eisei Kagaku 37: 480-488.
8. Taeko, K., Kazunori, O., Yuzo, Y. and Osamu, T. 1997.Studies on simultaneous determination of pesticides byHPLC. Miyazaki-ken Eisei Kankyo Kenkyusho Nenpo8:63-67.
9. Rolle, S. D. and De-Cormis L. 1989. High performanceliquid chromatography for the determination of pency-curon residues in several vegetables. J. Agric. FoodChem. 37: 975-978.
Journal of Food and Drug Analysis, Vol. 10, No. 2, 2002
133
less interference peaks on chromatogram. Chromatograms ofthe detection limit for butachlor and pencycuron in Chinesemustard spiked with 0.05 ppm standards are shown in Figure8. Based on S/N greater than 3, their detection limits weredetermined to be 0.05 ppm.
IV. GC Analysis
The GC-MS spectra of butachlor and pencycuron areshown in Figure 9. The fragment m/e 311 is the parent ion ofbutachlor indicating the molecule of butachlor is partlyretained after impacted by electron. However, the parent ionof pencycuron can not be found on mass spectrum because itis heat-labile compound. The GC-MS spectra of standardscan be used as references for further compound confirmation.
ACKNOWLEDGEMENTS
We would like to thank Dr. C. W. Chen for his transla-tion work.
REFERENCES
1. Royal Society of Chemistry. 1991.The AgrochemicalsHandbook. 3 rd ed. Unwin Brothers Limited, Old work-ing. Surrey, The United Kingdom.
2. Lo, C. C. 1989. Preparation of pesticides and water quali-ty:1.Acidity and basic capacity. Issue Report No. 14.Taiwan Agricultural Chemical and Toxic SubstancesResearch Institute, Council of Agriculture (TACTRI/COA). (in Chinese)
Journal of Food and Drug Analysis, Vol. 10, No. 2, 2002
134
*
April 18, 2001 August 28, 2001
butachlor pencycuronMacroporous Diatomaceous Earth
Column; MDE column florisil cartridge for solid phase extraction;butachlor pencycuron
5%diethyl ether/n-hexane; E/H 15% E/H 15% ethyl acetate/hexane; EA/H
15% E/H I 15% EA/H II IGC-ECD II HPLC-UV 248 nm
0.25~0.75 ppm 84.9~94.9%88.3~94.8% 0.05 ppm