Embed Size (px)
Citation preview

ISGSR2007 First International Symposium on Geotechnical Safety & Risk Oct. 18~19, 2007 Shanghai
Tongji University, China
Determination of characteristic values for marine clay G. Yoon Korea Ocean Research & Development Institute, Ansan, Korea, [email protected] Y. Yoon Inha University, Incheon. Korea H. Kim Korea Ocean Research & Development Institute, Ansan, Korea ABSTRACT: Recently, limit state design (LSD) in geotechnical engineering has been developed through LRFD in North America and Eurocode 7 in Europe. LRFD is an approach that estimates resistance by design model and that multiplies resistance factor by calculated resistance to reflect the uncertainty of materials and design models. Whereas, Eurocode 7 employs the partial resistance factor applied directly to each variable in resistance equation that individual soil properties such as cohesion and angle of internal friction are applied. Current methods of estimating characteristic value were discussed with the marine clay of Korea within the framework of characteristic value which has globally argued during the processing of development of Eurocode 7 for geotechnical design. Estimation of characteristic value, an issue of this dispute, affects not only determination of design value applied directly to design of geotechnical structures, but also economic feasibility and stability following results of design. In this paper, the characteristic values for main marine clay were calculated and compared with using some methods proposed. As a result, it was appeared that most of the computed values were close to mean value and less conservative in the order of Student/Ovesen, Schneider and EN 1990. In case of EN 1990 approach, however, it was inappropriate to assess geotechnical design value being calculated less than zero with statistical variability. Also, it was found that current methods have trend of estimating more conservative characteristic values when larger in ground variability. 1 INTRODUCTION Recently, limit state design has been developed from centering around LRFD and Eurocode. Also, new design codes based on limit state and performance theory are being developed among North-east Asia such as China, Japan and Korea. It may be an international trend to establish and standardize more reasonable and optimized codes by considering uncertain of random variables, that is, statistical variability. Whereas, Allowable stress design which have been used over the past decades has deterministically chosen representative values based on a designer’s intention or mean values, as a design values.
LRFD of the North America, developed as a leader in structural engineering, is an approach that estimates resistance by design model and that multiplies resistance factor by calculated resistance to reflect the uncertainty of materials and design models. Whereas, Eurocode of the Europe employs the partial resistance factor applied directly to each variable in the resistance equation that individual soil properties such as cohesion and angle of internal friction are applied. In here, it would be discussed with the marine clay of Korea within the framework of characteristic value which has globally argued through processing of development of Eurocode 7 for geotechnical design even to the present. Because the estimation of characteristic value, an issue of this dispute, affects not only determination of design value applied directly to design of geotechnical structures, but also economic feasibility and stability following results of design. In this paper, characteristic values were estimated using
549

each method which has been suggested to estimate them, and the applicability of them were reviewed. The data to estimate characteristic values were those which had been collected to develop reliability based design of port & harbour structure and to research uncertainty of marine clay from large-scale port & harbour construction projects in Korea. 2 EVALUATION OF GEOTECHNICAL DESIGN VARIABLES Representative values for applying to geotechnical design calculation have always been selected by designers. But, it is not discussed in most of current design codes how to choose them and to apply them how much conservatively. It presents not only significancy for determination of partial factor and characteristic value to calculate design value in Eurocode, but also difficulty in definition of the methods to estimate characteristic value. Eurocode 7 has mentioned the values of four-level as a procedure to gain design value of geotechnical parameters that is, measured value, derived value, characteristic value and design value. Fig.1 shows basic concepts of these values. 2.1 Measured Value Measured value is defined as a value measured from many kinds of laboratory and In-situ test. For example, there are ground water level, N-value from SPT, stress and strain from triaxial compressive test and so on. 2.2 Derived Value Derived value is defined as a value which presents property of geomaterials which are estimated at the measured value based on theoretic, empirical or statistical correlation. Derived value offers a basis to choose characteristic value. As examples of the derived value, there are c’ and φ’ from triaxial compressive test using Mohr-Coulomb theory, Cu from FVT using torque theory, φ’, E and Dr of sand from SPT blowcounts using empirical correlations and so on. 2.3 Characteristic Value Characteristic value is a representative value which is evaluated as the most adequate value to estimate occurrence of limit state in the problem based on structure-foundation-ground system on
Measured ValuesMeasured Values
Derived ValuesDerived Values
Characteristic ValuesCharacteristic Values
Design ValuesDesign Values
by Theory,Empirical Relation,
or Correlation
by ConsideringVariations
(Uncertainties)
by ApplyingPartial Factor
(from Results of Field or Lab. Test)
(Parameter Values)
(Representative Values of Parameter)
(Values to be Used for the Design Calculation)
Direct Assessment(Alternative Method)
Fig.1 Procedure to determine design value (Orr et al., 1999)
550
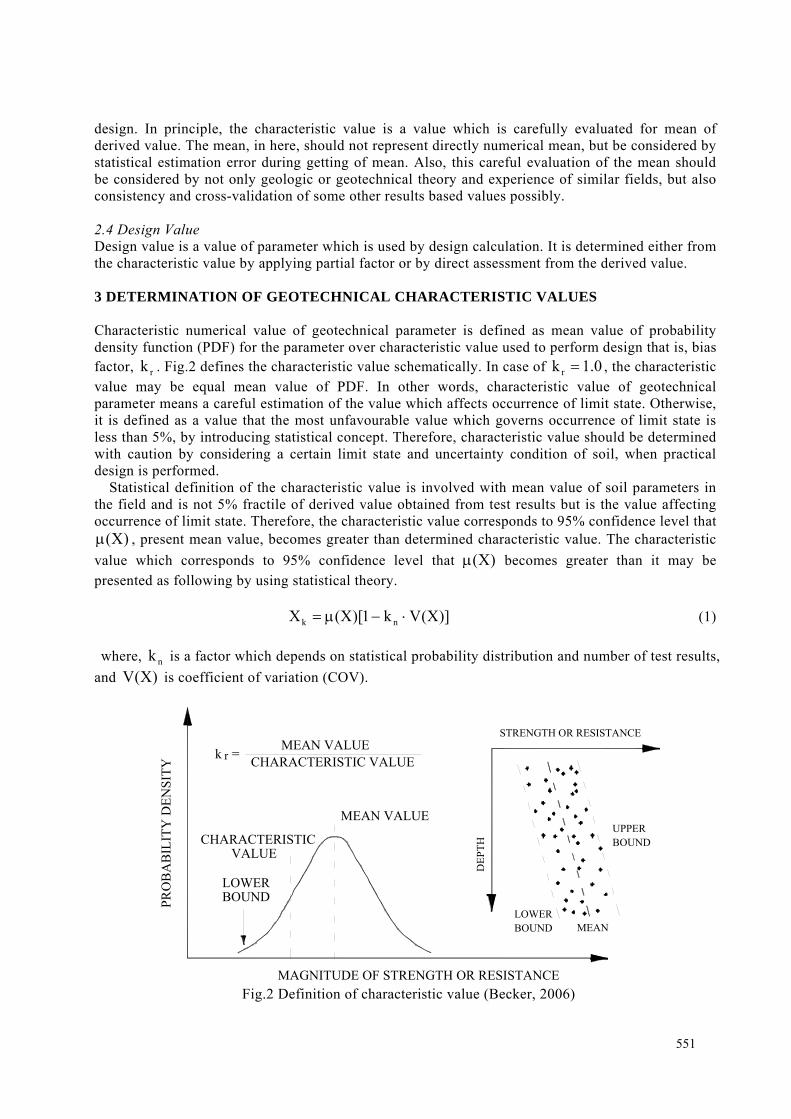
design. In principle, the characteristic value is a value which is carefully evaluated for mean of derived value. The mean, in here, should not represent directly numerical mean, but be considered by statistical estimation error during getting of mean. Also, this careful evaluation of the mean should be considered by not only geologic or geotechnical theory and experience of similar fields, but also consistency and cross-validation of some other results based values possibly. 2.4 Design Value Design value is a value of parameter which is used by design calculation. It is determined either from the characteristic value by applying partial factor or by direct assessment from the derived value. 3 DETERMINATION OF GEOTECHNICAL CHARACTERISTIC VALUES Characteristic numerical value of geotechnical parameter is defined as mean value of probability density function (PDF) for the parameter over characteristic value used to perform design that is, bias factor, rk . Fig.2 defines the characteristic value schematically. In case of 0.1kr = , the characteristic value may be equal mean value of PDF. In other words, characteristic value of geotechnical parameter means a careful estimation of the value which affects occurrence of limit state. Otherwise, it is defined as a value that the most unfavourable value which governs occurrence of limit state is less than 5%, by introducing statistical concept. Therefore, characteristic value should be determined with caution by considering a certain limit state and uncertainty condition of soil, when practical design is performed.
Statistical definition of the characteristic value is involved with mean value of soil parameters in the field and is not 5% fractile of derived value obtained from test results but is the value affecting occurrence of limit state. Therefore, the characteristic value corresponds to 95% confidence level that
)X(μ , present mean value, becomes greater than determined characteristic value. The characteristic value which corresponds to 95% confidence level that )X(μ becomes greater than it may be presented as following by using statistical theory.
)]X(Vk1)[X(X nk ⋅−μ= (1)
where, nk is a factor which depends on statistical probability distribution and number of test results,
and )X(V is coefficient of variation (COV).
LOWERBOUND
CHARACTERISTICVALUE
MEAN VALUE
MAGNITUDE OF STRENGTH OR RESISTANCE
PRO
BA
BIL
ITY
DEN
SITY
STRENGTH OR RESISTANCE
DEP
TH
LOWERBOUND MEAN
UPPERBOUND
MEAN VALUECHARACTERISTIC VALUEk =r
Fig.2 Definition of characteristic value (Becker, 2006)
551

According to EN 1990, as a value of either material or property of goods having prescribed probability which is not obtained from hypothetical unlimited tests, it is defined that characteristic value corresponds to any prescribed confidence level in the statistical distribution assumed as a specific property. Also, it has been mentioned that characteristic value should be defined using concept of 5% fractile. Characteristic value might be presented as following assuming this condition as normal distribution.
)]X(V645.11)[X()X(645.1)X(Xk −μ=σ−μ= (2)
where, )X(μ is mean, )X(σ is standard deviation (SD), and )X(V is COV of unlimited tests. X and 1.645, factor, show 5% confidence level.
Definition and equation characteristic value in EN 1990, mentioned above, are appropriate for design involved with structural materials whereas, those are inappropriate for geomaterials. It is due to property of variables governing geotechnical parameters. For example, failure within ground is not a strength of respective element in test, but mean strength for the failure plane. Thus, it is not 5% fractile of test results, but 5% fractile of mean strength which takes place along required failure plane corresponding to 95% confidence value of the mean strength. Another reason is that generally so limited number of test results are only available in geotechnical design that need to look out statistically. Student(1908) suggested 95% fractile of mean as following.
)X(Nt)X(Xk σ−μ= (3)
where, t is a parameter depending on number of test results, N.
In order to obtain characteristic value with great number of results of shear strength, Ovesen(1995) employed more simple equation as equation (4). Equation (4) is the result which was applied to numberless N, at equation (3).
)X(N
645.1)X(Xk σ−μ= (4)
On the other hand, Schneider(1997) presented to more simple equation (5).
)X(5.0)X(Xk σ−μ= (5)
When nk equals to 0.5 in equation (1) that is, N equals to 11 at equation (4), Schneider presented to estimation of favourably approximate value for kX , through comparative study. Equation (5) represents the case of determining lower 50% of SD for mean. 4 DETERMINATION OF CHARACTERISTIC VALUES FOR MARINE CLAY Characteristic values of marine clay in Korea were estimated using four different methods suggested by EN 1990, Student (1908), Ovesen (1995) and Schneider (1997). Also, those were compared and analyzed in this paper. Soil parameters were sorted over physical, strength and consolidation characteristic, respectively. Table 1 shows maximum number of test data with each characteristic group. 4.1 Physical Soil Characteristics Characteristic values of parameters for physical characteristic were estimated by using test data which were collected from Busan and Gwangyang, representative port & harbour areas in Korea and
552

Table 1 Maximum number of test data with geographical locations of the site in Korea
Gwangyang Busan
Physical characteristic 2,089 2,116
Strength characteristic 1,341 2,007
Consolidation characteristic 1,259 1,897
were processed statistically. Fig.3 shows results for comparison among mean and each approach. As a result for estimation of characteristic values of soil parameter in physical characteristic, Student’s approach of four approaches presented most close to mean. In case of many test data as a this study, it is showed that Student’s and Ovesen’s approach are similar with each other. It is caused that t-value is convergent to 1.645 within 95% confidence level, in case that it is larger than any number of data, even though t-value depends on the number of test data. Thus, in that case, Ovesen’s equation equals to Student’s. Then EN 1990’s approach shows very small values in comparison with mean, typically, though those are different with dispersion of a population.
0
10
20
30
40
50
60
70
80
90
G.Y 81.80 80.95 80.95 72.29 50.52
B.S 57.85 57.28 57.28 49.89 31.68
[Mean] Student Ovesen Schneider EN19902.60
2.62
2.64
2.66
2.68
2.70
2.72
G.Y 2.71 2.71 2.71 2.70 2.67
B.S 2.70 2.69 2.69 2.68 2.64
[Mean] Student Ovesen Schneider EN1990
(a) Water content (%) (b) Specific gravity
0
2
4
6
8
10
12
14
16
18
G.Y 15.23 15.18 15.18 14.69 13.44
B.S 16.45 16.38 16.38 15.56 13.54
[Mean] Student Ovesen Schneider EN1990
0.0
0.5
1.0
1.5
2.0
2.5
G.Y 2.27 2.25 2.25 2.01 1.41
B.S 1.63 1.61 1.61 1.46 1.07
[Mean] Student Ovesen Schneider EN1990
(c) Total unit weight (kN/m3) (d) Void ratio
Fig.3 Comparison of characteristic values for physical characteristic
Gwangyang
Busan
Seoul
553

0
10
20
30
40
50
60
70
80
90
G.Y 79.02 78.33 78.33 71.31 53.65
B.S 65.24 64.66 64.66 58.03 41.50
[Mean] Student Ovesen Schneider EN1990
0
5
10
15
20
25
30
G.Y 28.47 28.27 28.27 26.24 21.12
B.S 27.63 27.46 27.46 25.32 20.03
[Mean] Student Ovesen Schneider EN1990
(e) Liquid limit (%) (f) Plastic limit (%)
0
10
20
30
40
50
60
G.Y 50.48 49.87 49.87 43.68 28.10
B.S 37.58 37.15 37.15 31.94 19.04
[Mean] Student Ovesen Schneider EN1990
0.0
0.2
0.4
0.6
0.8
1.0
1.2
G.Y 1.10 1.08 1.08 0.88 0.40
B.S 0.86 0.85 0.85 0.71 0.36
[Mean] Student Ovesen Schneider EN1990
(g) Plasticity index (%) (h) Liquidity index
0
10
20
30
40
50
60
70
80
90
100
G.Y 91.48 90.90 90.90 86.33 74.51
B.S 88.83 88.29 88.29 82.68 68.57
[Mean] Student Ovesen Schneider EN19900
5
10
15
20
25
30
35
40
45
G.Y 39.91 39.24 39.24 33.06 17.36
B.S 31.64 31.20 31.20 26.09 13.40
[Mean] Student Ovesen Schneider EN1990
(i) No. 200 Seive Passing (%) (j) Percent clay finer than 2μm
0.0
0.2
0.4
0.6
0.8
1.0
1.2
1.4
1.6
G.Y 1.49 1.46 1.46 1.14 0.33
B.S 1.26 1.24 1.24 0.91 0.09
[Mean] Student Ovesen Schneider EN1990
(k) Activity
Fig.3 Comparison of characteristic values for physical characteristic(continued)
554

4.2 Strength Characteristics Fig.4 shows estimation of mean and characteristic values for soil parameters related to strength characteristic. In parameters for strength characteristic, Student and Ovesen’s approach, also, was most close to mean. In the next place, those were more close to mean in the order Schneider and EN 1990’s approach. Especially, EN 1990’s approach estimated values less than zero, in case of tests having large COV.
-10
0
10
20
30
40
50
G.Y 22.57 21.75 21.75 13.50 -7.26
B.S 38.97 37.91 37.91 24.82 -7.59
[Mean] Student Ovesen Schneider EN1990
-8
-6
-4
-2
0
2
4
6
8
10
12
G.Y 6.42 6.11 6.11 3.52 -3.13
B.S 10.61 10.21 10.21 5.77 -5.33
[Mean] Student Ovesen Schneider EN1990
(a) Unconfined compressive strength, qu (kPa) (b) qu of remolded sample (kPa)
-5
0
5
10
15
20
25
G.Y 11.76 11.33 11.33 7.04 -3.77
B.S 19.47 18.94 18.94 12.40 -3.81
[Mean] Student Ovesen Schneider EN19900
1
2
3
4
5
6
G.Y 5.21 5.06 5.06 3.81 0.60
B.S 4.93 4.83 4.83 3.69 0.86
[Mean] Student Ovesen Schneider EN1990
(c) Undrained shear strength from qu/2 (d) Sensitivity from qu
-1500
-1000
-500
0
500
1000
1500
2000
G.Y 1408.70 1310.84 1310.84 953.70 -88.24
B.S 622.88 516.01 516.01 73.56 -1184.38
[Mean] Student Ovesen Schneider EN1990
-10
-5
0
5
10
15
20
25
30
G.Y 15.05 14.58 14.58 9.92 -1.82
B.S 24.48 23.83 23.83 15.67 -4.50
[Mean] Student Ovesen Schneider EN1990
(e) Elastic modulus (kPa) (f) Strain at failure (%)
Fig.4 Comparison of characteristic values for strength characteristic
555

-10
-5
0
5
10
15
20
25
30
G.Y 15.05 14.58 14.58 9.92 -1.82
B.S 24.48 23.83 23.83 15.67 -4.50
[Mean] Student Ovesen Schneider EN19900
5
10
15
20
25
G.Y 23.45 23.26 23.26 21.57 17.25
B.S 22.61 22.32 22.32 19.97 13.93
[Mean] Student Ovesen Schneider EN1990
(g) Undrained shear strength from UU test (kPa) (h) Effective friction angle (°)
0.00
0.05
0.10
0.15
0.20
0.25
0.30
0.35
G.Y 0.30 0.29 0.29 0.27 0.21
B.S 0.25 0.25 0.25 0.23 0.18
[Mean] Student Ovesen Schneider EN19900.00
0.05
0.10
0.15
0.20
0.25
0.30
0.35
0.40
G.Y 0.36 0.35 0.35 0.32 0.24
B.S 0.29 0.29 0.29 0.26 0.18
[Mean] Student Ovesen Schneider EN1990
(i) Rate of strength increase by Skempton (j) Rate of strength increase by Hansbo
0. 00
0. 05
0. 10
0. 15
0. 20
0. 25
0. 30
G. Y 0. 28 0 . 28 0. 28 0. 27 0 . 23
B . S 0. 28 0 . 28 0. 28 0. 26 0 . 20
[ M ean] Studen t Oves en Schne i de r EN1990 -5
0
5
10
15
20
25
30
35
G.Y 13.91 13.43 13.43 8.85 -2.75
B.S 29.40 28.42 28.42 20.67 0.67
[Mean] Student Ovesen Schneider EN1990
(k) Rate of strength increase by φ’ (l) Undrained shear strength from FVT (kPa)
-10
-5
0
5
10
15
20
25
30
G.Y 11.36 10.73 10.73 6.44 -4.82
B.S 26.99 25.62 25.62 19.16 1.21
[Mean] Student Ovesen Schneider EN1990-1
0
1
2
3
4
5
G.Y 3.75 3.63 3.63 2.47 -0.46
B.S 4.52 4.38 4.38 3.40 0.85
[Mean] Student Ovesen Schneider EN1990
(m) Corrected undrained shear strength from FVT (kPa) (n) Sensitivity from FVT
Fig.4 Comparison of characteristic values for strength characteristic(continued)
556

4.3 Consolidation Characteristics For parameters related to consolidation characteristic, variability in Gwangyang area has trends larger than Busan. As shown Fig.5, Student’s approach was most close to mean in estimation of characteristic values and, in the next, was close in the order Schneider and EN 1990’s approach.
0.0
0.2
0.4
0.6
0.8
1.0
1.2
G.Y 1.02 0.99 0.99 0.80 0.32
B.S 0.63 0.61 0.61 0.51 0.24
[Mean] Student Ovesen Schneider EN1990
-0.4
-0.2
0.0
0.2
0.4
0.6
0.8
1.0
1.2
G.Y 1.12 1.09 1.09 0.72 -0.194
B.S 1.11 1.07 1.07 0.72 -0.18
[Mean] Student Ovesen Schneider EN1990
(a) Compression index, Cc from oedometer test (b) Cc from Rowe cell, CRS & long term test
-40
-20
0
20
40
60
80
100
G.Y 48.87 47.21 47.21 31.02 -9.88
B.S 86.61 84.25 84.25 55.49 -15.78
[Mean] Student Ovesen Schneider EN1990
-0.4
-0.2
0.0
0.2
0.4
0.6
0.8
1.0
1.2
G.Y 1.12 1.09 1.09 0.72 -0.194
B.S 1.11 1.07 1.07 0.72 -0.18
[Mean] Student Ovesen Schneider EN1990
(c) Pre-consolidaton pressure, Pc from oedometer test (d) Pc from Rowe cell, CRS & long term test
-0.4
-0.2
0.0
0.2
0.4
0.6
0.8
1.0
1.2
G.Y 1.12 1.09 1.09 0.72 -0.194
B.S 1.11 1.07 1.07 0.72 -0.18
[Mean] Student Ovesen Schneider EN1990
-0. 30
-0. 20
-0. 10
0. 00
0. 10
0. 20
0. 30
G. Y 0. 22434 0 . 20972 0. 20972 0 . 09639 -0. 19660
B . S 0. 15314 0 . 14711 0. 14711 0 . 10067 -0. 01950
[ M ean] Studen t Oves en Schne i de r EN1990
(e) Over Consolidation Ratio (f) mv (kPa)
Fig.5 Comparison of characteristic values for consolidation characteristic
557

0.00
0.05
0.10
0.15
0.20
0.25
0.30
0.35
0.40
0.45
G.Y 0.14724 0.12811 0.12841 0.10597 0.01144
B.S 0.41129 0.35425 0.35718 0.34151 0.18171
[Mean] Student Ovesen Schneider EN1990-0.002
-0.001
0.000
0.001
0.002
0.003
0.004
0.005
0.006
G.Y 0.00260 0.00246 0.00246 0.00140 -0.00134
B.S 0.00559 0.00535 0.00535 0.00349 -0.00134
[Mean] Student Ovesen Schneider EN1990
(g) mh (kPa) (h) Cv (cm2/sec)
-0.06
-0.05
-0.04
-0.03
-0.02
-0.01
0.00
0.01
0.02
0.03
G.Y 0.02462 0.01394 0.01411 0.00158 -0.05118
B.S 0.01610 0.01073 0.01101 0.00953 -0.00550
[Mean] Student Ovesen Schneider EN1990-3.0E-07
-2.0E-07
-1.0E-07
0.0E+00
1.0E-07
2.0E-07
3.0E-07
4.0E-07
G.Y 3.24E-07 3.05E-07 3.05E-07 1.54E-07 -2.361E-07
B.S 2.74E-07 2.68E-07 2.68E-07 2.14E-07 7.61E-08
[Mean] Student Ovesen Schneider EN1990
(i) Ch (cm2/sec) (j) Kv (cm/sec)
-4.0E-06
-3.0E-06
-2.0E-06
-1.0E-06
0.0E+00
1.0E-06
2.0E-06
3.0E-06
4.0E-06
G.Y 1.72E-06 9.88E-07 9.99E-07 1.40E-07 -3.477E-06
B.S 3.59E-06 2.03E-06 2.11E-06 1.68E-06 -2.7143E-06
[Mean] Student Ovesen Schneider EN19900.00
0.02
0.04
0.06
0.08
0.10
0.12
0.14
G.Y 0.10 0.10 0.10 0.08 0.04
B.S 0.12 0.12 0.12 0.10 0.04
[Mean] Student Ovesen Schneider EN1990
(k) Kh (cm/sec) (l) Swelling index
-0.002
-0.001
0.000
0.001
0.002
0.003
0.004
0.005
0.006
0.007
0.008
0.009
G.Y 0.00809 0.00778 0.00778 0.00539 -0.00078
B.S 0.00692 0.00684 0.00684 0.00619 0.00453
[Mean] Student Ovesen Schneider EN1990
(m) Secondary compression index
Fig.5 Comparison of characteristic values for consolidation characteristic(continued)
558

5 CONCLUDING REMARKS Characteristic values for main marine clay in Korea were estimated by using four approaches suggested to calculate characteristic value. Their comparison and analysis from those approaches are summarized as following.
1) Characteristic values estimated for marine clay of Korea represented close to mean in the
order Student/Ovesen, Schneider and EN 1990’s approaches. 2) EN 1990’s approach represents the smallest characteristic values and estimates less than zero
with statistical variability, so that is inappropriate to estimate geotechnical design value. 3) In comparison with Student and Ovesen’s approach, Ovesen’s approach is estimated slightly
larger in small number of samples, but values from both approaches become equal in case of large number of samples. Because the larger number of samples are, the smaller degree of decrease of it is, even though t-value in student’s approach decreases with increase of number of samples. In that case, t-value is convergent any value.
4) When N equals to 11, Ovesen’s equation becomes equal to Schneider’s and estimates same value both of them. Schneider asserted that an approximate value was favourably estimated for characteristic value at this time.
5) Four approaches used to estimate characteristic value through mean value minus a constant rate of variability. The variability is a value ( nk ) which is multiplied by SD and a factor varying with probability distribution and the number of sample. The characteristic value is always estimated at less than mean. And it has trends to be estimated more conservatively with increase of variability in soil.
6) Uneconomic design of structure may be occurred without considering soil variability so large due to insufficient test data. Therefore, it is necessary to insure more sufficient data as possible. Mean value of high confidence level, also, should be chosen from all of the data through filtering process. And the confidential value should be supposed through other approaches such as simulation when collection of sufficient data is impossible. Eurocode 7 has prescribed it should be used carefully by considering comparable experience and practical design condition in case of estimating characteristic value using a statistical approach. Thus, it is thought that it may be necessary to determine appropriate characteristic value using other statistical approaches such as Bayesian approach.
REFERENCES Dennis E. Becker (2006) Limit State Design Based Codes for Geotechnical Aspects of Foundation in Canada. International Symposium on New Generation Design Codes for Geotechnical Engineering Practice-Taipei 2006 Harrison M. Wadsworth (1990) HANDBOOK of Statistical Methods for Engineers and Scientists. McGraw-Hill, Inc. Trevor L.L. Orr and Eric R. Farrell (1999) Geotechnical Design to Eurocode 7. Springer Trevor L.L. Orr (2006) Development and implementation of Eurocode 7. International Symposium on New Generation Design Codes for Geotechnical Engineering Practice-Taipei 2006 Yoon, Gil (2005) Development of next generation port & harbour design (V). Ministry of maritime affairs & fisheries (In Korean)
559

560