Embed Size (px)
Citation preview

Determination of CYP27a1 in biological samples using nano liquid chromatography mass spectrometry
Kristina Erikstad Sæterdal
Master’s degree in chemistry Department of Chemistry
The Faculty of Mathematic and Natural Sciences
UNIVERSITY OF OSLO
May 2016

II
© Kristina Erikstad Sæterdal
Year: 2016
Title: Determination of CYP27a1 in biological samples using nano liquid chromatography
mass spectrometry
Author: Kristina Erikstad Sæterdal
http://www.duo.uio.no/

III
Preface
The work of this master thesis was performed at the Department of Chemistry in the group
Bioanalytical Chemistry and at the Rikshospitalet in the group Unit for Cell Signaling. My
supervisors were PhD candidate Tore Vehus, PhD candidate Hanne Røberg-Larsen, Professor
Stefan Krauss, Professor Elsa Lundanes and Associate Professor Steven R.H. Wilson.
First, i would like to thank all of my supervisors for their guidance and motivation throughout
the two years of my master thesis, and I would like to express my gratitude to all of my co-
workers in the Unit for Cell Signaling for their patience and help with my attempts to work
with molecular biology, and for including me in their group. Also I would like to thank the
entire Bioanalytical Chemistry group for providing a great social environment.
Oslo, Norway, May 2016
Kristina Erikstad Sæterdal

IV

V
Table of contents
Preface .......................................................................................................................................III
1 Abbreviations and definitions ............................................................................................ 1
1.1 Abbreviations .............................................................................................................. 1
1.2 Definitions ................................................................................................................... 6
2 Abstract .............................................................................................................................. 9
3 Introduction ...................................................................................................................... 11
3.1 Background................................................................................................................ 11
3.1.1 Cancer................................................................................................................. 11
3.1.2 Oxysterols........................................................................................................... 11
3.1.3 CYP27a1 ............................................................................................................ 12
3.2 Targeted proteomics .................................................................................................. 13
3.2.1 Targeted proteomics ........................................................................................... 13
3.2.2 Mass spectrometry.............................................................................................. 16
3.2.3 Electrospray ionization....................................................................................... 21
3.2.4 Liquid chromatography ...................................................................................... 23
3.3 Preparation of biological samples ............................................................................. 25
3.3.1 Cell culturing ...................................................................................................... 25
3.3.2 Transfection........................................................................................................ 25
3.3.3 Immunoprecipitation .......................................................................................... 26
3.3.4 Sodium dodecyl sulfate polyacrylamide gel electrophoresis ............................. 27
4 Aim of study ..................................................................................................................... 29
5 Materials and methods ..................................................................................................... 31
5.1 Materials .................................................................................................................... 31
5.1.1 Chemicals (KI) ................................................................................................... 31
5.1.2 Chemicals (OUS) ............................................................................................... 31
5.1.3 Equipment/instrumentation (KI) ........................................................................ 34
5.1.4 Equipment/instrumentation OUS ....................................................................... 35
5.2 Solutions .................................................................................................................... 36
5.2.1 KI........................................................................................................................ 36
5.2.2 OUS .................................................................................................................... 36
5.3 Biological methods .................................................................................................... 38
5.3.1 Cell culturing ...................................................................................................... 38

VI
5.3.2 Immunoprecipitiation ......................................................................................... 39
5.3.3 Transformation ................................................................................................... 40
5.3.4 Transfection........................................................................................................ 40
5.3.5 Western blotting ................................................................................................. 41
5.4 Sample preparation prior to LC-MS/MS ................................................................... 42
5.4.1 Gel electrophoresis ............................................................................................. 42
5.4.2 Protein digestion................................................................................................. 42
5.4.3 Off- line SPE ....................................................................................................... 43
5.5 LC-MS/MS ................................................................................................................ 44
5.5.1 LC ....................................................................................................................... 44
5.5.2 MS ...................................................................................................................... 44
5.5.3 Data processing .................................................................................................. 44
6 Results and discussion...................................................................................................... 47
6.1 CYP27a1 – its abundance in different cell lines ....................................................... 48
6.2 Producing a CYP27a1 standard ................................................................................. 49
6.3 Immunoprecipitation ................................................................................................. 52
6.4 How to connect biology and chemistry for analysis of biologically prepared
samples? ............................................................................................................................... 56
6.5 Beta-catenin; does the IP method work for other targets? ........................................ 57
6.6 LC-MS data for CYP27a1 ......................................................................................... 61
6.6.1 Signature peptide determination......................................................................... 61
6.6.2 The liquid chromatography system .................................................................... 66
6.6.3 Detection of CYP27a1 in cell samples............................................................... 71
6.7 Can an analytical chemist help? My personal view on analytical biology. ............... 76
7 Conclusion........................................................................................................................ 79
7.1 Future of the work ..................................................................................................... 80
8 References ........................................................................................................................ 81
9 Appendix .......................................................................................................................... 89
9.1 Additional background .............................................................................................. 89
9.1.1 Cell culturing ...................................................................................................... 89
9.1.2 Transfection........................................................................................................ 90
9.2 Tables ........................................................................................................................ 92
9.3 Western blot raw files................................................................................................ 99

1
1 Abbreviations and definitions
1.1 Abbreviations
ABC Ammonium bicarbonate
ACN Acetonitrile
AFFL Automated filtration/filter backflush
AGC Automatic gain control
AMP Ampicillin
ATCC American Type Culture Collection
BCA Bicinchoninic acid
BSA Bovine serum albumin
CA Citric acid extract
Chir-IP Chromatin immuno precipitation
CRM Charge residue model
CYP Cytochrome P450
DMEM Dulbeco’s modified eagle medium
dMS/MS Data dependent tandem mass spectrometry
DMSO Dimethyl sulfoxide
DQ Direct-Q®
DTT Dithiothreitol

2
E. coli Escherichia coli
ECL Enhanced chemiluminescence
EDTA Ethylenediaminetetraacetic acid
EGFP Enhanced green fluorescent protein
ELISA Enzyme-linked immunosorbent assay
EMEM Eagle’s minimum essential medium
ESI Electrospray ionization
ESP Enhanced signature peptide
FA Formic acid
FBS Fetal bovine serum
FFT Fast Fourier transformation
GC Gas chromatography
GE Gel electrophoresis
H Human embryonic kidney 293 lysate
HEK293 Human embryonic kidney 293
Hh Hedgehog
HPLC High pressure liquid chromatography
HRP Horseradish peroxidase
i.d. Inner diameter
IAM Iodoacetoamide
IEM Ion evaporation model

3
Ig Immunoglobin
IP Immunoprecipitation
IT Injection time
ITS Insulin-transferring-selenium
KI Department of Chemistry
LB Lysogny broth
LC Liquid chromatography
LC-MS Liquid chromatography mass spectrometry
M MDA-MB-231 lysate
m/z Mass/charge
MALDI Matrix-assisted laser desorption
MCF7 Michigan Cancer Foundation 7
MIK Department of Microbiology
MP Mobile phase
MS Mass spectrometry
MS/MS Tandem mass spectrometry
NCE Normalized collision energy
NP-40 Nonyl phenoxypolyethoxylethanol
OHC Hydroxycholesterol
OHP Overhead projector
ON Overnight supernatant

4
OUS Oslo university hospital
P/S Penicillin/streptomycin
PAGE Polyacrylamide gel electrophoresis
PBS Phosphate-buffered saline
PBS-T Phosphate-buffered saline with 0.1 % Tween® 20
PRIDE Proteomics identifications database
PRM Parallel reaction monitoring
PS-DVB Polystyrene divinylbenzene
PVDF Polyvinylidene fluoride
RP Reversed phase
RPMI Roswell Park Memorial Institute
RSD Relative standard deviation
S Standard deviation
S/N Signal to noise
SDS Sodium dodecyl sulfate
SERM Selective estrogen receptor modulator
Sigma Sigma Aldrich
SILAC Stable isotope labelling with amino acids in cell culture
SP Stationary phase
SPE Solid phase extraction
TBS-T Tris buffered saline tween

5
TFA Trifluoroacetic acid
Thermo Thermo Scientific
tMSMS Targeted tandem mass spectrometry
Tr Human embryonic kidney 293 transfected lysate
W1 Wash no. 1 supernatant
W3 Wash no. 3 supernatant
WB Western blot

6
1.2 Definitions
Full MS The MS scan the precursor ions, and no fragments
are formed
Precursor ion The entire ion that entered the mass analyser. Form
fragment ions when fragmented
Fragment ion The resultant ion after fragmentation of the
precursor ion in the collision cell
Tandem MS (MS/MS) The MS fragments the precursor ion, and scan the
fragment ions
Data dependent MS/MS The MS fragments precursor ions meeting a set of
demands (e.g. intensity)
Cell lysis Disruption of the cell membrane
Cell The basic biological unit of all living organisms
Cytochrome P450 A group of enzymes
Mycoplasma A bacteria that is a contaminant in laboratory cell
work
Confluence Describes the proportion of growing area the cells
cover
Injection time The time the Orbitrap collects ions before scanning
Automatic gain control The amount of ions the Orbitrap collect before
scanning
MS – scheduling Defining a retention time window for a precursor
ion

7
Parallel reaction monitoring Defining a list of precursor ions to monitor when
applying an Orbitrap MS (tMS/MS)
Resolution The ability of a mass spectrometer to separate ions
by m/z. Is calculated by dividing the observed m/z
value by the smallest difference in m/z for two ions
that can be separated
Retention time The time a compound uses from it is injected on the
column and until it reaches the detector
Cell culturing Growing cells in an artificial environment in a
laboratory

8

9
2 Abstract
The cytochrome P450 enzyme, CYP27a1, converts cholesterol into 27-hydroxycholesterol,
and both the metabolite and the enzyme are associated with breast cancer, promoting
proliferation and metastasis. CYP27A1 is enriched in cancer tissues, and the amount of
CYP27a1 correlates to tumor grade. Hence, CYP27a1 is a potential biomarker, and a method
for determination and quantification is needed. Antibody assays shows limited performance,
and therefore the goal of this work was to develop a nano liquid chromatography mass
spectrometry (LC-MS) method for determination of CYP27a1. A sample preparation
workflow for CYP27a1 in cell samples was investigated. CYP27a1 was identified by nano LC-
MS in MDA-MB-231 breast cancer cells by fractionating cell lysates using gel electrophoresis.
Enrichment of CYP27a1 in cell samples using immunoprecipitation, an antibody based
method for protein extraction, did not provide adequate identification. However the former
method works when looking at other proteins, and this confirms that there are limitations in
using antibody based methods for determination and quantification of CYP27a1.

10

11
3 Introduction
3.1 Background
3.1.1 Cancer
Breast cancer – proliferation and metastasis
Breast cancer is one of the cancer types women are most exposed to; in 2014, 3324 women
were diagnosed with breast cancer in Norway [1, 2] (Textbox 1), and 1.7 million were
diagnosed worldwide in 2012. Today, detection and diagnosis of breast cancer are based on
image scanning by mammography. However, mammography is a method prone to false
positives [3, 4]. The majority of breast cancers are estrogen receptor positive, meaning that
the cancer cells have receptors sensitive to the hormone estrogen. When hormones bind to the
receptors on the cell it promotes proliferation. These receptors are selective to estrogen, but
other endogenous ligands, such as oxysterol 27-hydroxycholesterol (27-OHC), are found to
be selective estrogen receptor modulators (SERM) [5, 6]
3.1.2 Oxysterols
Oxysterols are cholesterols with an additional OH-group. The oxidation (addition of OH-
group) is either non enzymatic (autoxidation [8, 9]) or catalysed by the cytochrome P450-
family (CYP enzymes). Where the OH-group is located on the cholesterol branch depends on
the CYP catalysing the reaction, and the OH-location is important for the metabolic activity
[10-12]. Oxysterols are closely connected to the Hedgehog signalling pathway (Textbox 2)
Textbox 1 Breast cancer in Norway
Breast cancer in Norway
Breast cancer is the most abundant cancer type among women in Norway. It is a risk of 8.4 % to
develop breast cancer before the age of 75 years for women (0.1 % for men). The relative survival
rate is now up to 90 %, an increase from 70 % in 1979 [2]. Today, women are offered a regularly
mammogram from the age of 55. In an evaluation of the mammogram program performed by The
Research Council of Norwegian [7], they concluded that the program reduced the risk of death by
breast cancer by 30 %. But the evaluation also reported an overdiagnosis estimate of 20 % [7].

12
which is central in numerous cancers [13-16]. 27-OHC and its enzyme are also closely
related to breast cancer and this has been the focus in this thesis.
27-Hydroxycholesterol (27-OHC) is an endogenous oxysterol with the OH-group located on
the cholesterol side-chain (Figure 1). Its systematic name is 25R-26-Hydroxycholestrerol, but
in medicine the name 27-OHC is the most used [17], and is the name to be used in this thesis.
27-OHC increases the risk of breast cancer [18, 19]. The metabolite promotes proliferation
(growth) and metastasis (spreading) of breast cancer, by binding to the estrogen receptor or
the liver X receptor, respectively, in breast cancer cells [18-20]. 27-OHC is therefore a
potential biomarker for breast cancer and can be determined in cancer cells at
femtomol/10 000 cells-levels, using an automated (LC-MS) method [21].
Figure 1 Formation of 27-hydrocholesterol. 27-hydroxycholesterol is formed by adding an OH-
group to the side-chain of cholesterol. The oxidation is either autoxidation or catalysed by CYP27a1.
27–OHC binds to the liver X receptor and to the estrogen receptor, promoting metastasis and
proliferation of breast cancer, respectively.
3.1.3 CYP27a1
The enzyme CYP27a1 (also called sterol 27-hydroxylase, see Table (AP) 4 for protein
sequence) [22] catalyses the oxidation of cholesterol to the oxysterol 27-OHC (and 3β-
hydroxy-5-cholestenoic acid) [23, 24]. As 27-OHC increases the risk of breast cancer,
CYP27a1 must also be addressed. In cancerous tissues (e.g. macrophages [18, 25]) the
amount of CYP27a1 correlates to tumor grade [18], and interfering with the CYP27a1
conversion of cholesterol to 27-OHC, may be a way to treat or prevent breast cancer [18].
Hence, CYP27a1 can be an important biomarker for breast cancer and methods for measuring
the enzyme are called for [20].

13
3.2 Targeted proteomics
3.2.1 Targeted proteomics
How are proteins measured? The proteome [29-31] refers to the entire protein content, and
proteomics [32, 33] is the large-scale study of proteins. In “targeted proteomics” [34, 35], the
aim is to detect specific proteins in a sample, e.g. for diagnostic purposes.
Western blotting
Today the dominant methods for protein quantification are ELISA (enzyme-linked
immunosorbent assay) [36] and western blot (WB) [37] which rely on antibodies (Textbox 3)
for protein detection (“immunoassays”).
In WB (Figure 2) proteins are electrophoretically separated [38] on a gel according to their
size [39, 40] (see section 3.3.4). Following separation, an applied voltage is used to transfer
the proteins from the gel and onto a membrane made of nitrocellulose or polyvinylidene
fluoride (PVDF).
Signaling Pathways – the Hedgehog signaling pathway
A signaling pathway is a part of the communication system of the body. During a cascade
of protein activations, a signal is sent to the cell, which responds by proliferation. If a
signaling pathway is exposed to mutations or other external influences, like metabolites, it
could lead to inhibited cell growth (cancer) due to overexpression in the cell.
The Hedgehog (Hh) signaling pathway [26] is highly important in embryonic development
and cell growth [27]. An irregulation in Hh signaling is associated with diseases and
development of numerous cancers [13-16, 28]. Oxysterols are suggested to play a role in
promoting cancer development by activating the Hh signaling pathway [13, 14]. The
correlation between 27-hydroxycholesterol and CYP27a1 with Hh signaling has not been
proven, but the preliminary goal of this thesis was to investigate it as preliminary research
showed an regulation of 27-OHC in tumor initiating cancer cells [21].
Textbox 1 The Hedgehog signaling pathway

14
Figure 2 WB procedure. During a WB procedure, proteins are electrophoretically separated on a gel,
before they are transferred to a membrane. The membrane is subsequently exposed to primary, and
secondary, antibody solutions, for detection of selected protein(s).
After several steps in which the membrane is incubated, it is possible to visualize the protein,
and the amount: During the first incubation the membrane is covered with a solution
containing proteins to prevent nonspecific binding of the antibody on the membrane. This
liquid can be a bovine serum albumin (BSA) solution or milk. A diluted antibody solution (a
primary antibody that is specific for the target protein) is then added on the membrane, and it
binds to the target protein. However, neither the protein nor the antibody exhibit features
making it visible (e.g. luminescence), so the membrane is finally incubated in a secondary
antibody solution. This antibody is specific towards the primary antibody, e.g. if a rabbit-
antibody is used as primary antibody, the secondary antibody must be an anti-rabbit antibody,
enabling it to bind to the primary antibody (Textbox 3). The addition of a labeled secondary
antibody enables detection (e.g. labeling with horseradish peroxidase (HRP) enables detection
by chemiluminescence [41]).

15
WB is dependent on the selectivity of an antibody for protein detection (Figure 3). Many
proteins however, e.g. CYP27a1, do not have a specific antibody ensuring a selective
detection. Unselective antibodies recognize other proteins in addition to the ones being
targeted. In addition the sensitivity provided by antibodies is variable; some antibodies
provide an outstanding sensitivity, but for the most of them, the sensitivity is poor. In the past
years a “reproducibility crisis” [42] has evolved, referring to that many antibody based
experiments are not
reproducible due to the
antibodies [42]. Therefor there
is a need for more selective
methods. By developing a
targeted LC-MS method more
selectivity can be achieved.
Figure 3 WB showing using a CYP27a1 antibody. Several
bands appear, but only the lower band is appearing at the
correct mass for CYP27a1.
16
3.2.2 Mass spectrometry
One solution to the issue with selectivity in WB is to use a mass spectrometer (MS). With
MS, ions are detected based on their mass/charge (m/z) value, and are visualized in a mass
spectrum. Either the intact molecular ion (precursor ion) could be detected (MS-mode), or it
could be fragmented into fragment ions (tandem-MS (MS/MS)). MS/MS can provide
enhanced selectivity, as the MS/MS fragment ions provides additional information of the
compounds identity.
Antibodies
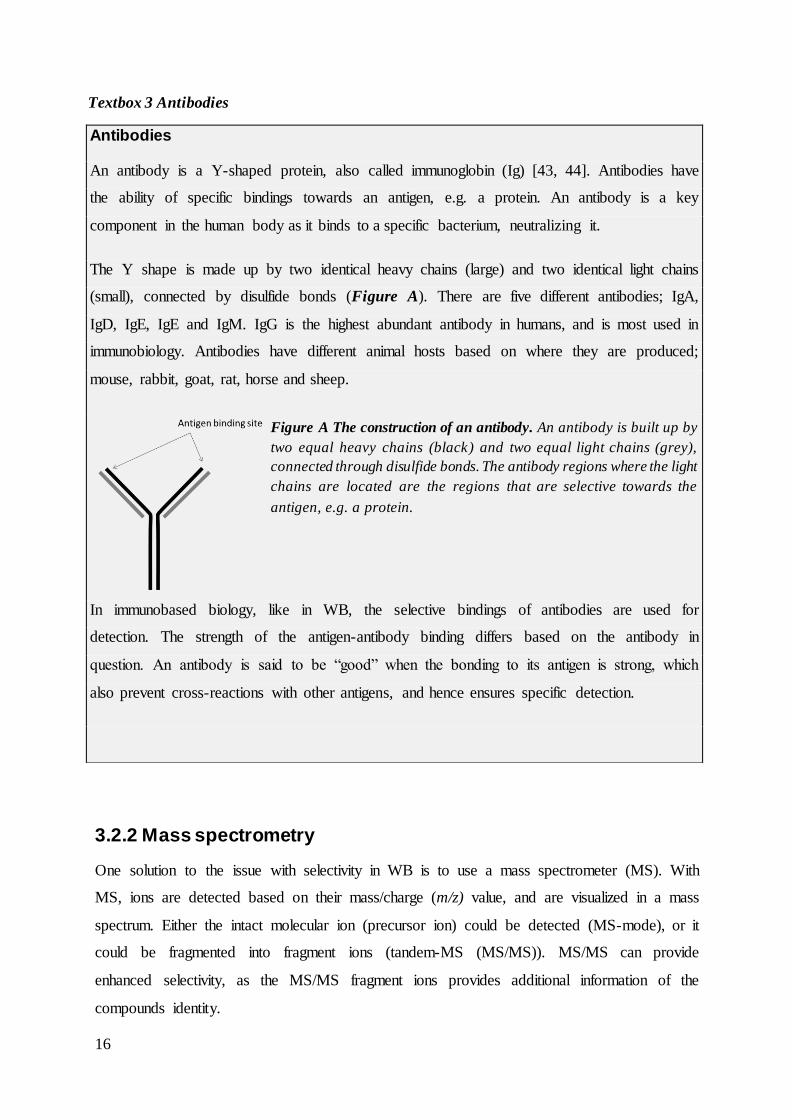
An antibody is a Y-shaped protein, also called immunoglobin (Ig) [43, 44]. Antibodies have
the ability of specific bindings towards an antigen, e.g. a protein. An antibody is a key
component in the human body as it binds to a specific bacterium, neutralizing it.
The Y shape is made up by two identical heavy chains (large) and two identical light chains
(small), connected by disulfide bonds (Figure A). There are five different antibodies; IgA,
IgD, IgE, IgE and IgM. IgG is the highest abundant antibody in humans, and is most used in
immunobiology. Antibodies have different animal hosts based on where they are produced;
mouse, rabbit, goat, rat, horse and sheep.
In immunobased biology, like in WB, the selective bindings of antibodies are used for
detection. The strength of the antigen-antibody binding differs based on the antibody in
question. An antibody is said to be “good” when the bonding to its antigen is strong, which
also prevent cross-reactions with other antigens, and hence ensures specific detection.
Figure A The construction of an antibody. An antibody is built up by
two equal heavy chains (black) and two equal light chains (grey),
connected through disulfide bonds. The antibody regions where the light
chains are located are the regions that are selective towards the
antigen, e.g. a protein.
Textbox 3 Antibodies
17
Several mass spectrometers are applicable for the study of proteins (e.g. time of flight, triple
quadrupoles and Orbitrap). The quadrupole Orbitrap instrument used in this work will be
described below.
In the Orbitrap, ions are trapped in an orbit around an electrode, and the time-domain signals
are converted into mass to charge spectra using a fast Fourier transformation (FFT) [45]. The
Q Exactive [46], which is used in this thesis, is equipped with a quadrupole situated before the
Orbitrap to achieve mass filtration of the precursor ions. A quadrupole consists of four
parallel cylindrical rods with applied voltage. These rods prevent ions other than those with a
chosen m/z-ratio to pass. By varying the voltage applied, the operator can scan for a range of
m/z-values. In full scan MS all ions enter the Orbitrap to be scanned, while in MS/MS mode
ions are fragmented in the collision cell prior to the Orbitrap. The Q Exactive ensures high
resolution (up to 140 000) and high mass accuracy [46].
Parallel reaction monitoring
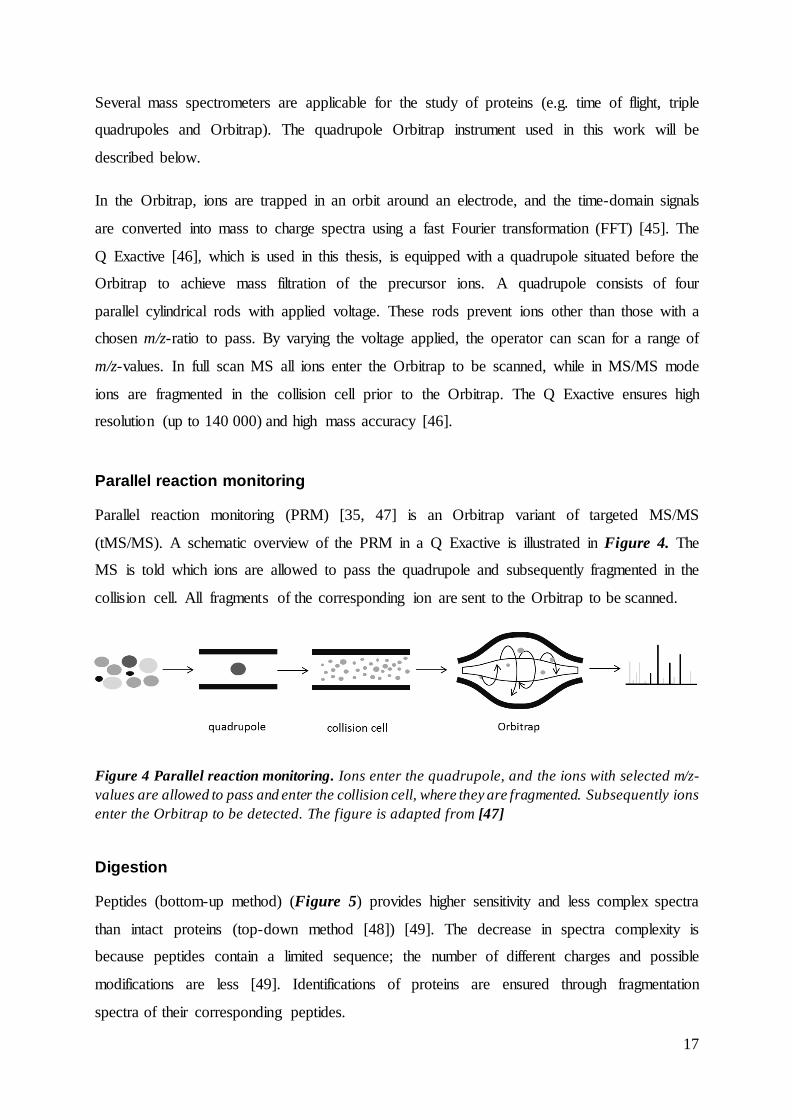
Parallel reaction monitoring (PRM) [35, 47] is an Orbitrap variant of targeted MS/MS
(tMS/MS). A schematic overview of the PRM in a Q Exactive is illustrated in Figure 4. The
MS is told which ions are allowed to pass the quadrupole and subsequently fragmented in the
collision cell. All fragments of the corresponding ion are sent to the Orbitrap to be scanned.
Figure 4 Parallel reaction monitoring. Ions enter the quadrupole, and the ions with selected m/z-
values are allowed to pass and enter the collision cell, where they are fragmented. Subsequently ions
enter the Orbitrap to be detected. The figure is adapted from [47]
Digestion
Peptides (bottom-up method) (Figure 5) provides higher sensitivity and less complex spectra
than intact proteins (top-down method [48]) [49]. The decrease in spectra complexity is
because peptides contain a limited sequence; the number of different charges and possible
modifications are less [49]. Identifications of proteins are ensured through fragmentation
spectra of their corresponding peptides.

18
Figure 5 The bottom-up methods used in proteomics. Proteins are cleaved into peptides before LC-
MC determination.
Trypsin is a protease that cleaves proteins at the carboxyl side of the amino acids lysine (K)
and arginine (R), except when they are followed by proline (P) [50]. The cleavage reaction
(hydrolysis) is illustrated in Figure 6. Trypsin is commonly used in bottom-up proteomics
[49] due to its selectivity [50] and appropriate size of the resulting peptides.
Figure 6 Hydrolysis of proteins by trypsin. When a protein is exposed to trypsin, trypsin cleaves the
protein at the carboxyl side of the amino acids lysine and arginine by hydrolysis.
19
Peptide fragmentation
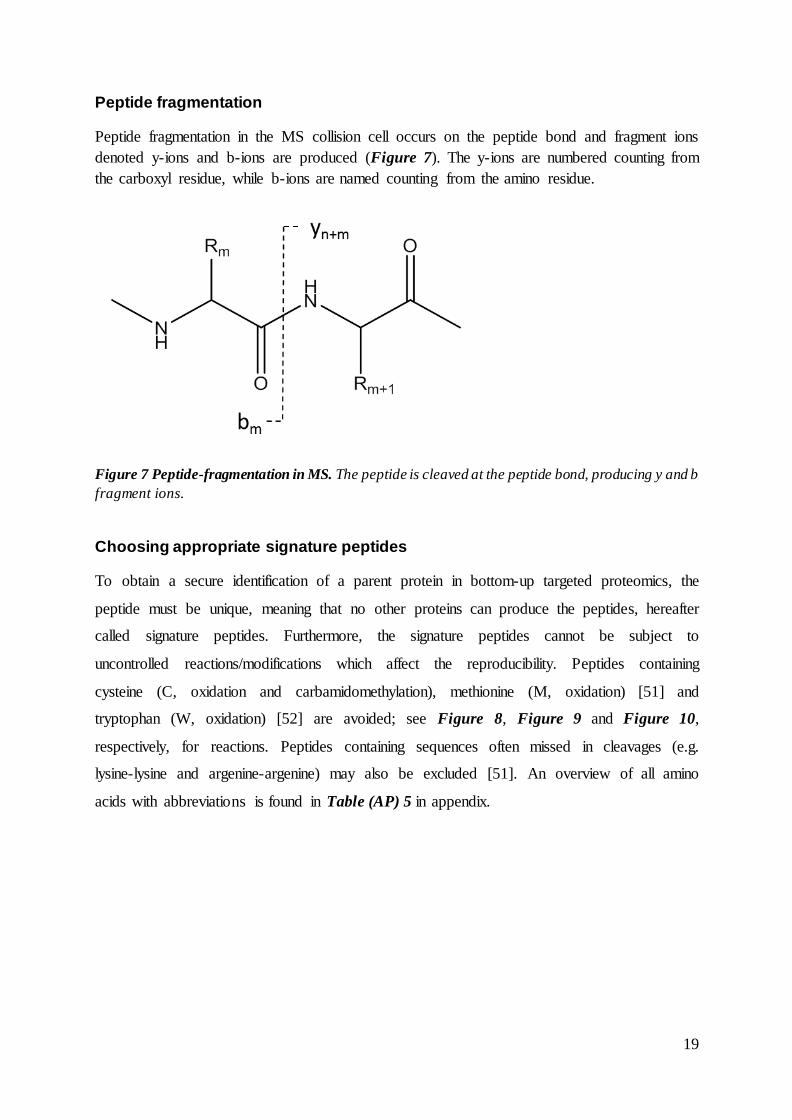
Peptide fragmentation in the MS collision cell occurs on the peptide bond and fragment ions
denoted y-ions and b-ions are produced (Figure 7). The y-ions are numbered counting from
the carboxyl residue, while b-ions are named counting from the amino residue.
Figure 7 Peptide-fragmentation in MS. The peptide is cleaved at the peptide bond, producing y and b
fragment ions.
Choosing appropriate signature peptides
To obtain a secure identification of a parent protein in bottom-up targeted proteomics, the
peptide must be unique, meaning that no other proteins can produce the peptides, hereafter
called signature peptides. Furthermore, the signature peptides cannot be subject to
uncontrolled reactions/modifications which affect the reproducibility. Peptides containing
cysteine (C, oxidation and carbamidomethylation), methionine (M, oxidation) [51] and
tryptophan (W, oxidation) [52] are avoided; see Figure 8, Figure 9 and Figure 10,
respectively, for reactions. Peptides containing sequences often missed in cleavages (e.g.
lysine-lysine and argenine-argenine) may also be excluded [51]. An overview of all amino
acids with abbreviations is found in Table (AP) 5 in appendix.

20
Figure 8 The oxidation of methionine to methionine sulfoxide.
Figure 9 The oxidation of cysteine to cystine

21
Figure 10 The oxidation of tryptophan to kynurenine.
In addition to the theoretical properties as discussed above, the peptides practical assets must
be considered; they should give chromatographic separation and high MS sensitivity. While
laboratory analysis could give answers to these questions, several databases list in-silico
cleaved peptides known to meet the practical demands. Examples of such databases are
PeptideAtlas [53-55] and the proteomics identifications database (PRIDE) [56, 57]. The
enhanced signature peptide (ESP)-predictor [58] was developed to predict peptides providing
high MS-response [59], while the open-source software for targeted proteomics, SKYLINE
[60], is a database for establishment of methods (choosing peptides and transition
optimization) and analysis of data [61].
3.2.3 Electrospray ionization
The MS demands the analyte ion to be in gaseous phase, something that could be a challenge
as proteins and peptides are large, non-volatile species. To solve this problem electrospray
ionization (ESI) is used (Figure 11). ESI converts analyte ions from liquid into gas phase, and
is easily coupled to a liquid chromatography system, making it a preferred choice when
analysing complex protein/peptide samples. The ions remain intact, i.e. are not fragmented,
hence it is a soft ionization method.
In ESI, the mobile phase (MP) with analyte is sprayed out of a capillary outlet, where a
potential is applied. Small droplets with high charge are produced, giving an electrically

22
charged spray. From the Taylor cone, which the capillary liquid tip is called, droplets fissions
into smaller and smaller droplets. Two main models are used to describe what is happening at
the end of the spray, where the droplet ions are converted to gas phase ions; the ion
evaporation model (IEM) [62] and the charge residue model (CRM) [63]. The IEM
explanation is that when the droplet reaches a certain size, the repulsive forces between the
ions in the droplet becomes greater than the surface tension of the droplet. When this is the
case, a droplet containing one analyte ion leaves the “parent” droplet, and gas phase ions are
formed after final evaporation. This model favour small molecules. CRM explains the gas
formation with fission; droplet evaporates to a certain size and then fissions into smaller
droplets. This continues until single – ion droplets are formed, that can evaporate giving gas –
phase ions.
Figure 11 Electrospray ionisation (ESI) in positive mode. A voltage is applied to the needle (positive
in positive mode), attracting the negative ions to the walls, and to the MS-inlet (negative in positive
mode), attracting the positive ions. A spray is formed at the end of the Taylor cone, and droplets
fissions into smaller and smaller droplets. Two different theories describe the gas-formation taking
place at the end of the spray; the ion evaporation model and the charge residue model.
A challenge with the ESI interface is possible ion suppression. Ion suppression happens when
several ions compete to be at the droplet surface. If an ion is high-abundant, surface-active
and enters the ESI with the analyte, this ion will hinder the analyte ion to be at the droplet
surface, and hence suppress the formation of analyte gas-phase ions. ESI-MS is a

23
concentration sensitive detector and flow dependent, meaning that if the liquid sample enters
the spray with a low flow, a higher amount of the ions will be transferred into the gaseous
phase, increasing sensitivity [64-66].
3.2.4 Liquid chromatography
Even though MS provides high selectivity, analytes must be separated in order to avoid ion
suppression (giving better sensitivity) and to increase selectivity when analysing complex
samples.
In column chromatography, compounds are separated on a column, which is filled with a
stationary phase (SP). Based on their affinity toward the SP, the compounds (analytes) will be
retained. Analytes with high SP affinity will use more time before it reaches the detector.
Based on the properties of the analytes, liquid or gas chromatography is used. With gas
chromatography (GC), the MP which transport the analytes through the column, is a gas.
When using GC, analytes must be volatile and thermally stable, as they are brought to gas
phase before entering the column. Analytes not suitable for GC, such as peptides, are
separated using liquid chromatography (LC), which is used in this thesis. The MP is a liquid
and analytes are kept in the liquid phase when separated on the column, before transferred to
the gaseous phase in the electrospray.
In reversed-phase (RP) LC, the SP is hydrophobic (and MP is aqueous) and the analytes are
retained on the column based on their hydrophobicity. Analytes with high hydrophobicity will
spend more time on the column and have a longer retention time than more hydrophilic
analytes. The most used stationary phase is silica based C18 particles. In conventional LC
(inner diameter (i.d.) 2-5 mm) the particle size ranges between 1.7 and 5 µm, and column
lengths are between 5 to 30 cm.
Nano LC
When analyte abundance is low, a high sensitivity is needed. As ESI sensitivity/ion
suppression is flow dependent, a chromatographic system with lower flow could provide
improved detection; nano LC. Nano LC is a miniaturized chromatographic system with a
column i.d. of 50-100 µm and a MP flow rate of 20-500 nL/min, compared to 2-5 mm and
0.5-2.5 mL/min for conventional systems. Particle size and length are the same as with
conventional columns; 2.4-5 µm and 5-30 cm, respectively. Nano columns give a lower radial

24
dilution [66] (Figure 12), enhancing the sensitivity for concentration sensitive detectors, such
as the ESI-MS. The back pressure and time of analysis is the same as for conventional system
due to same linear flow rate, but the MP consumption is less.
Figure 12 Sample dilution using conventional LC and nano LC. Samples applied to a nano LC
system, where the column inner diameter is reduced by approximately a 20 fold compared to a
commercial LC-system, are less diluted by the mobile phase, providing enhanced sensitivity for
concentration sensitive detectors. Colour intensity indicates concentrations of an analyte. Figure is
adapted from [66].
WB has in the past been the superior compared to LC-MS regarding protein quantification,
but questions are now raised, concluding that “it is time to turn the tables” [67]. Where WB is
very much dependent on the specificity of one antibody and the intensity of the band, LC-MS
depends on several parameters; retention time and m/z-ratio of both precursor and fragment
ions. In addition several peptides could be detected per protein. The WB method is still useful
(and used in this thesis), also in LC-MS method development when the detection of the
protein is not established. WB is also a good tool for verifying the success of e.g. a protein
enrichment step.
Established techniques
The role of CYP27a1 as a novel participant in human cancer is established, but methods for
the determination of CYP27a1 levels, needed to understand e.g. the development of ER+
breast cancer are not fully assessed, as should be. Most published work relies on the
determination of CYP27a1 products (e.g. 27-OHC [68]), the use of immunobased methods
(e.g. WB [68, 69]), or other methods (e.g. luciferase activity [70] and RNA measurements

25
[71]). Determination of CYP27a1 by LC-MS has been established for analysis of human
retina [72], where the protein is quantified based on two signature peptides, but not for cells.
3.3 Preparation of biological samples
Even though todays chemical methods ensure sensitive and selective analysis of complex
biological samples, sample clean-up is still necessary. Biological experiments, e.g. using
antibodies, are important tools during development of a sample preparation method for MS
analysis. In this work several cell and bioanalytical experiments were used and all of them are
described in this section.
3.3.1 Cell culturing
When targeting proteins (or other components of a cell), growing cells in vitro – cell culturing
– is a way to produce the analyte outside its natural environment, providing a non-invasive
availability of the analyte. By growing cells outside their natural environment, a cells
behavior and response to controlled influences could be studied. Different cell lines are used
based on the goal of the study; e.g. when studying breast cancer, the breast cancer cell lines
Michigan Cancer Foundation 7 (MCF7) and MDA-MDB-231 are often used. A breast cancer
cell line is derived from the breast cancer tissue and the cells remains with the same traits as
they possessed in their natural environment (the MCF7 cell line was isolated from a woman in
1970 [73]). A more detailed description of the practical cell culturing work is described in
section 9.1.1 in appendix.
3.3.2 Transfection
When the protein abundance is low, or the antibodies show poor selectivity, transfection
could be applied in the workflow. Transfection, first described in the mid-60s [74, 75], is a
method for transporting nucleic acids, RNA or DNA as in this study, into a cell [76].
Modified cells are produced during cell division; hence the cells are forced to produce the
protein coded for by the DNA. The implemented DNA used in this work codes for the target
protein, CYP27a1, tagged with an extra amino acid sequence, DYKDDDDK1 (Figure 13)
(called FLAG-tag) [77]. This tag enables the use of immuno-based methods when the
performance of the antibodies of the targeted peptides are limited [78].
1 Amino acids are aspartic acid (D), tyrosine (Y) and lysine (K).

26
Figure 13 The CYP27a1–FLAG protein. By using transfection, DNA encoding for a protein is
implemented into a cell. When cells divide, regulated cells are produced, containing the new protein
or elevated levels of an existing protein, based on the implemented DNA. In this thesis the DNA coding
for the CYP27a1-protein with an additional amino acid sequence (DYKDDDDK), called FLAG, was
used.
If the DNA is integrated in the cell nucleus, stable transfection is achieved, and will survive
even during cell division. However, if the DNA is only implemented in the cell, but not the
cell nucleus, a transiently transfection is achieved; during proliferation, the DNA amount will
be diluted, making the transfection effect to only be present for a certain amount of time. How
to produce the DNA and insert it into the cells is described in section 9.1.2 in appendix.
3.3.3 Immunoprecipitation
Protein samples are often complex, and a clean-up step is beneficial to reduce sample
complexity. Immunoprecipitation (IP) [79] uses antibodies (Textbox 3) coupled to magnetic
beads (agarose, a polymer, could also be used when sample volume is larger than 2 mL) to
“fish” the target protein from the sample. Figure 14 shows an overview of the IP procedure.
The magnetic beads are covered with protein A [80] or G [81, 82] based on the origin of the
antibody. The proteins binds specific to an antibody based on the origin and type of antibody
(e.g. IgG or IgM). For example, protein G has higher affinity for an IgG antibody produced in
rabbit, compared to an IgG antibody produced in rat [81, 82]. When an antibody is added to
the magnetic beads, the heavy chain-only part of the antibody binds to the protein A or G, and
hence to the magnet. This leaves the antigen binding site of the antibody exposed for protein
binding. Also, other targets than a single protein could be addressed; e.g. Co-IP which is used
for protein complexes (when binding to the protein, the entire complex is precipitated), and
chromatin IP (Chir-IP) which targets DNA-binding proteins to be able to precipitate the DNA
which the protein is in a complex with.

27
Figure 14 The procedure for immunoprecipitation. The antibodies are first coupled to the magnetic
beads, before the protein sample is added. The antibodies subsequently connect to the target protein,
giving a bead-antibody-protein-complex. By using an external magnet the rest of the protein sample
can be removed, leaving only the complex containing the target protein in the tube. The target protein
is then subsequently eluted from the antibody-bead-complex.
3.3.4 Sodium dodecyl sulfate polyacrylamide gel electrophoresis
Another sample-clean up step, which is not dependent on antibodies, is gel electrophoresis
(GE, the first step in WB). This method separates proteins (also DNA and RNA, but will not
be described in this thesis) based on their size. In order to do so, the protein samples are
applied on a porous gel. The sodium dodecyl sulfate polyacrylamide gel electrophoresis
method (SDS-PAGE [83-85]), is widely used
for separating proteins, and is applied in this
thesis. In SDS-PAGE, the gel is made up by
polyacrylamide (when applying other GE
methods, e.g. agarose could be used as gel),
and SDS is added to the samples prior to
application on the gel. SDS is a detergent (
Textbox 2) that makes adducts with the
proteins giving all proteins the same charge
/size ratio and that will move with the same
speed at the applied voltage. However due to
the pores in the gel the proteins will be
separated according to their size. The speed of
Detergents
A compound that functions like soap; it
is amphiphilic (has one polar and one
unipolar side), and in reaction with
proteins the non-polar side binds to the
protein, leaving the polar, charged end
of the detergent exposed. This gives rise
to a total charge, which is taken
advantage of in e.g. gel electrophoresis.
Examples of detergents are SDS and
urea.
Textbox 2 Detergents

28
the proteins is inversely proportional to the size, making smaller proteins travel further
through the gel holes than the larger ones, at a defined period of time.

29
4 Aim of study
Originally this study aimed at studying the role of Gli 1, Gli 2 and Gli 3 and the oxysterol
related CYP enzymes CYP27a1, CYP46a1 and OH25 in the Hedgehog signaling pathway.
However, preliminary investigations showed that it was difficult to identify these proteins by
the available methods; hence the focus was shifted towards only CYP27a1 and its relation to
breast cancer. Thus, the aim of the thesis is to investigate sample preparation procedures of
cell samples and subsequently establish a nano LC-MS method for detection of CYP27a1.

30

31
5 Materials and methods
Laboratory work was performed at both Oslo University Hospital (OUS) and the Department
of Chemistry (KI), where equipment and chemicals are different or have different suppliers.
Sections where this is of importance are marked with either KI or OUS. Where it is needed in
order to find the correct product, the catalogue number is mentioned.
5.1 Materials
5.1.1 Chemicals (KI)
Acetonitrile (ACN) HiPerSolv Chromanorm® for LC-MS was from VWR (Radnor, PA,
USA). Formic acid (FA, for MS, ̴ 98 %), trifluoroacetic acid (TFA, for HPLC (high pressure
liquid chromatography), ≥ 99.0 %), ammonium bicarbonate (ABC, ReagentPlus®, ≥ 99.9
%), DL-dithiothreitol (DTT, Bioultra, ≥ 99.0 % ), iodoacetoamide (IAM, Bioultra, ≥ 99.0 %)
and urea (98 %) were all from Sigma Aldrich (Sigma, St. Louis, Missouri, USA). Optima®
LC-MS water used for mobile phases was from Thermo Scientific (Thermo, Waltham,
Massachusetts, USA). Type 1 water was produced using the Milli-Q® integral water
purification system connected to a Q-POD® element with a Millipak® express 40 filter (0.22
µm), all from Millipore (Billerica, Massachusetts, USA). Trypsin/Lys-C-mixture (V5071)
was from Promega Biotech AB (Madison, Wisconsin, USA).
5.1.2 Chemicals (OUS)
RPMI (Roswell Park Memorial Institute) 1640 growth medium (R8758) was from Sigma.
Gibco® Dulbeco’s modified eagle medium F12 (DMEM, 21041-025) was from Thermo.
Eagle’s minimum essential medium (EMEM) was from ATCC® (American Type Culture
Collection, 30-2003TM, Manassas, Virginia, USA). Gibco® fetal bovine serum (FBS, 10270)
and Gibco® insulin-transferring-selenium (ITS, 100x) were both from Thermo, and
penicillin/streptomycin (P/S) was from Sigma. The phosphate-buffered saline (PBS) was
prepared by the Department of Microbiology at Ullevål University Hospital (MIK, Oslo,
Norway). Tween® 20 (P1379, viscous liquid), trypsin-ethylenediaminetetraacetic acid
(EDTA)-solution (T3924) and dimethyl sulfoxide (DMSO, BioReagent, for microbiology, ≥
99.9 %) were from Sigma. Information about cells lines used and associated information is
shown in Table 1 below. All cell lines were from ATCC®.

32
Table 1 Overview of cell lines. Six different cell lines were used in this work, with their different
origin and growth medium.
Cell line ATCC® product
number
Origin Growth
medium
BxPC-3 CRL-1687 TM Human pancreatic adenocarcinoma RPMI 1640
HEK293 CRL-1537TM Human embryonic kidney (no
disease) RPMI 1640
RKO CRL-2577TM Human colon carcinoma EMEM
MCF7 HTB-22TM
Human mammary gland, breast,
adenocarcinoma
Estrogen receptor positive
DMEM
MDA-MB-
231 HTB-26TM
Human mammary gland, breast,
adenocarcinoma
Estrogen receptor negative
DMEM
1 M tris (pH 8) was from MIK. Tris-HCl (RES098T), sodium chloride, EDTA (99.995 %
trace metals basis), glycerol (for molecular biology, ≥ 99 %), trizma® base ( ≥ 99 %, T1503),
glycine (ReagentPlus®, ≥ 99 %, HPLC), SDS (≥ 98.5 %, L3771), citric acid monohydrate
(C1919), urea (electrophoresis reagent) and bromophenol blue sodium salt (B5525) were all
from Sigma. Gibco® 2-mercaptoethanol (50 mM) was from Thermo and water was purified
by a Direct-Q® (DQ) water purification system from Millipore. Technical methanol
(20903.368) was from VWR. The protease inhibitor cocktail tablets (cOmplete mini,
EASYpack) were from Roche (Basel, Switzerland). The magnetic bead solution
(Dynabeads® protein G, 10003D) used in IP and NP-40 (nonyl phenoxypolyethoxylethanol)
used in cell lysis buffer (FNN0021) were from Thermo. The Coomassie brilliant blue R-250
staining solution was from Bio Rad. The Emsure® acetic acid (glacial) 100 % was from
Merck. Antibodies used in IP and WB with relevant information are listed in Table 2 below.

33
Table 2 Overview of antibodies. List of antibodies used in this work, with origin, supplier, product
number, concentration and application. Concentrations are listed only for antibodies used for IP.
Antibody Origin Number Supplier concentration Used in
CYP27a1 Goat
polyclonal SC-14835
Santa Cruz
Biotechnology Inc, Santa
Cruz, California, USA)
200 µg/mL IP
CYP27a1 Mouse
polyclonal ab-89781
Abcam, Cambridge,
United Kingdom 1000 µg/mL IP
CYP27a1 Rabbit
polyclonal APO6773PU-N Acris Antibodies. 1000 µg/mL IP, WB
Beta-
catenin
Mouse
polyclonal 610153
BD transduction
laboratoriesTM. BD
Biosciences, Franklin
Lakes, New Jersey, USA
250 µg/mL IP, WB
Anti-flag Rabbit
polyclonal F7425 Sigma 800 µg/mL IP, WB
Anti-rabbit Donkey
polyclonal Sc-2313 Santa Cruz WB
Anti-mouse Donkey
polyclonal Sc-2314 Santa Cruz WB
Actin Rabbit
polyclonal A2066 Sigma WB
Normal
goat IgG
Goat Sc-2028 Santa Cruz 400 µg/mL IP
Normal Rabbit IgG
Rabbit Sc-2027 Santa Cruz 400 µg/mL
IP
Normal
mouse IgG
Mouse SC-2025 Santa Cruz 400 µg/mL
IP

34
The CYP27a1-FLAG plasmid (VB150311-10002) was from Cyagen Biosciences (Santa
Clara, California, USA), and the pEGFP-C1 plasmid (6084-1, enhanced green fluorescent
protein, EGFP) was from Clontech Laboratories Incorporated (Mountain View, CA, USA,
member of Takara Bio Incorporated, Kusatsu, Shiga, Japan). Both the lysogny broth (LB)
culture dish with ampicillin (AMP) and the LB-medium with AMP were from MIK-OUS.
JETSTAR 2.0 midi-prep kit from Genomed Gmbh (Löhne, Germany) was used for DNA
extraction. The Fugene® HD transfection reagent was from Promega. Opti-MEM® reduced
serum medium, the 3-8 % tris-acetate gels (NuPAGE®), the PageRulerTM prestained protein
ladder and the tris-acetate SDS running buffer (NuPAGE®, 20x, LA0041) were from
Thermo. Non-fat dried milk (A0830,0500) was from AppliChem, and the tris buffered saline
tween (TBS-T) tablets were from Medicago AB (Uppsala, Sweden). WB-bands were
visualized using ECLTM (enhanced chemiluminescence) prime western blotting detection
reagent (RPN2236, Ge Healthcare)
5.1.3 Equipment/instrumentation (KI)
The Speed-Vac™ SC110 concentrator was from Savant (now Thermo). 1.5 mL vials, protein
LoBind tubes 1.5 mL and centrifuge (5415 R) were all from Eppendorf (Hamburg, Germany),
while the thermoshaker (PSC-20) was from Grand Instruments (Cambridge, United
Kingdom). To desalt peptides, a 100 mg and 3 mL C18 isolute solid phase extraction (SPE)
column from Biotage (Uppsala, Sweden) was used. Protein concentrations were measured
using NanoDrop 2000 UV-Vis spectrophotometer (Thermo) at 205 nm. All LC-experiments
were performed on an EASY nanoLC 1000 pump from Thermo. 0.3 mL plastic snap ring
vials (548-0120) with belonging snap ring caps (548-0893), used in the auto injector, were
from VWR. The fused silica capillary with 20 µm i.d. was from Polymicro Technologies
(Phoenix, Arizona, USA). Precolumns used were; an Acclaim PepMapTM 100 precolumn (75
µm x 2 cm, NanoViper, C18, 3 µm particle size, and 100 Å pore size) from Thermo, a silica-
based C8 monolithic precolumn (5 cm x 50 µm) produced in-house by Tone Smetop [86] and
a polystyrene divinylbenzene (PS-DVB) precolumn (5 cm x 50 µm) produced in-house by
Tore Vehus [87]. The C18 analytical column, 15 cm fused silica (Polymicro technologies)
with 50 µm i.d. and 2.6 µm Accucore particles (80 Å pore size) from Thermo, was packed in-
house by Henriette Sjånes Berg [88]. The LC-column was coupled to a Q Exactive™ Hybrid
Quadrupole Orbitrap mass spectrometer, equipped with a nanoFlex nanospray ion source,
using a stainless steel nanobore emitter (ES542) with 20 µm i.d., both from Thermo. An

35
Upchurch PEAK microtight® fitting from Sigma was used to connect the column and the
emitter. Both data processing programs, Proteome Discoverer (v1.4) and XCalibur (v2.1)
were from Thermo.
5.1.4 Equipment/instrumentation OUS
All cell work was performed in a Scanlaf Mars Safety Class 2 (Labogene, Lynge, Denmark)
hood. Cells were grown at 37° in a humidified atmosphere containing 5 % CO2 (Forma Steri-
cycle CO2 Incubator), using NuncTM cell culture treated EasYFlasksTM, both from Thermo.
The Falcon™ 6 well tissue culture plate used for transfection was from Corning Incorporated
(Corning, NY, USA). For cell storing, CryoTube™ vials and Mr. Frosty™ freezing container
(both Thermo) were used. Both the Axiovert 25 microscope used for cell culturing work and
the Axiovert 200M equipped with AxioCam (pictures taken using AxioVision) used for
transfection evaluation were from Zeiss (Oberkochen, Germany). The water bath was from
Julabo (Seelbach, Germany), and the TCTM automated cell counter was from Bio Rad
(Hercules, California, USA). The centrifuge (5810 R) used was from Eppendorf, but for
centrifugation at 12000 g, a microcentrifuge (type 157) from Ole Dich Instrumentmakers ApS
(Hvidovre, Denmark) was used. The magnet used for IP was from Invitrogen, Thermo. 1.5
mL vials (Labdesk, 20170-038) and 15 and 50 mL tubes were from VWR. The rotators used
for IP incubation were from Labinco B.V (when room temperature, 20170-038, Breda, the
Netherlands) and Bibby Scientific (when 4 °C, S83, Stuart, Stone, Staffordshire, United
Kingdom). The roller used for WB was also from Stuart. Incubation at 37 ℃ was performed
in an incubator from Termaks (Bergen, Norway). DNA concentration was measured using
Ultrascpec 2100 pro from Amersham Biosciences (now GE Healthcare, Buckinghamshire,
UK). Protein concentration was measured using BCA (bicinchoninic acid) protein assay kit
(PierceTM, Thermo), on a FLUOstar Omega microplate reader (Isogen Life Science, De
Meern, the Netherlands). The electrophoresis chamber (Novex® Midi Cell) was from
Thermo. Pipette tips with a microcapillary tip (732-0508) were from VWR. Proteins were
transferred to a 0.2 µm polyvinylidene fluoride (PVDF) membrane (Immobilon®-PSQ,
ISEQ00010, Merck) using filter paper (extra thick block paper, 1703960) and a trans-blot SD
semi-dry transfer cell from Bio-Rad. Bands were visualized on an overhead projector (OHP)
transparency film (Nobo, integrated part of ACCO Brands Corporation, Lake Zurich, Illinois,
United States) in a ChemidocTM touch imaging system (Bio-Rad). WB raw-files were
processed in Image lab software (Bio Rad).

36
5.2 Solutions
If nothing else is mentioned, the water used is type 1 water (KI) or DQ water (OUS).
5.2.1 KI
25 mM ABC was made by dissolving 0.10 g ABC powder in 50 mL water. 50 mM ABC was
made by dissolving 0.20 g ABC in 50 mL water. These solutions were freshly made before
each use. 8 M urea was made by dissolving 48.05 g urea (mm = 60.06 g/mole) powder in 100
mL type 1 water. 500 mM IAM and DTT were made by dissolving 0.23 g IAM (mm = 184.96
g/mole) powder and 0.19 g (mm = 154.25 g/mole) DTT powder, respectively, in 2.5 mL 8 M
urea each. Before use, 4 µL of 500 mM DTT or IAM were added to 196 µL 25 mM ABC,
giving 10 mM DTT/IAM-solutions. A 20 ng/µL trypsin/Lys-C solution was made by adding 1
mL of ABC to a volumetric glass flask containing 20 µg of the trypsin/Lys-C mix. Aliquots of
100 µL of the IAM, DTT and trypsin/Lys-C-solutions were frozen at -80 °C. These solutions
were thawed right before use, and any leftovers were thrown. To make 0.1 % TFA solutions,
100 µL TFA were dissolved in the respective liquid, type 1 water or ACN, to a total of 100
mL. 2 % ACN in 0.1 % TFA was made by mixing 2 mL ACN and 100 µL TFA with type 1
water to a total of 100 mL. MP A consisted of 0.1 % FA in LC-MS water, and MP B
consisted of 0.1 % FA in ACN. Both were made by adding 100 µL of FA in 50 µL of water or
ACN and adjusted to a total volume of 100 mL. The 5 % FA + ACN (1 + 2) solution was
made by adding 100 µL of FA and 9.9 mL of water to a 50 mL tube, and subsequently filling
it to the 30 mL mark with ACN.
5.2.2 OUS
All cell growth media (500 mL) were supplemented with 50 mL PBS (10 %) and 10 mL P/S
(2 %). RPMI 1640 medium was also supplemented with 500 µL ITS. PBS with 0.1 %
Tween® 20 (PBS-T) used for IP was made by adding 50 µL of Tween® 20 to a 50 mL vial
followed by 50 mL PBS and vortexing. This solution was stored at room temperature. TBS-T
used in WB was made by adding 10 TBS-T tablets into a 5 L glass flask and filling it to the 5
L mark with water. 5 % and 1 % milk-solutions were made by adding 25g and 5 g,
respectively, of dried milk powder to a 500 mL glass flask, and filling to the 500 mL mark
with TBS-T-solution. These solutions were stored at 4 °C for a few weeks (until the milk
started to smell). When making diluted antibody solutions, antibody was added to the vial

37
before adding the designated milk solution, see Table 3. For example, when making a 6 mL
1:500 of antibody in 1 % milk in TBS-T-solution, 12 µL of the antibody solution was added
to a 50 mL vial followed by 6 mL 1 % milk in TBS-T. The antibody solutions were kept at -
20 °C and were reusable.
Table 3 Antibody dilution factors and solutions used in WB.
Antibody Dilution factor Diluted in
CYP27a1 500 1 % milk in TBS-T.
anti-FLAG 500 1 % milk in TBS-T.
anti-actin 2000 5 % milk in TBS-T.
Beta-catenin 10 000 5 % milk in TBS-T.
anti-rabbit 10 000 5 % milk in TBS-T.
anti-mouse 10 000 5 % milk in TBS-T.
NP-40 lysis buffer was made by mixing the components (Table (AP) 1) in a 50 mL vial. It
was frozen at -20 °C in 10 mL aliquots. When needed, one 10 mL aliquot was thawed, and a
protease inhibitor tablet was added before vortexing, and aliquoting into 1 mL vials, which
were stored at – 20 ℃ (stable for a few months). As long as the NP-40 lysis buffer with
protease inhibitor solution was kept on ice when thawed, it was reusable.
To make the 5x loading buffer to be mixed with samples before doing electrophoretic
separation, the components (Table (AP) 2) were mixed using set amounts. It was frozen at –
20 °C in 500 µL aliquots. Before use it was thawed and diluted to 1x by adding it to the
samples.
The 10x transfer buffer used in WB to transfer proteins from the gel to the membrane was
made by mixing components and their respective amounts (Table (AP) 3). When making 1x
buffer, 100 mL of the 10x buffer were mixed with 200 mL methanol and 700 mL water. Both
buffers were stored at room temperature.

38
Fixation buffer for gels prior to gel digestion contained 50 % methanol, 10 % acetic acid and
40 % water. The buffer was made by adding 500 µL of methanol to 300 mL of water. 100 mL
of acetic acid was added to the solution and water was used to adjust the total volume to 1L.
5.3 Biological methods
5.3.1 Cell culturing
When starting a new cell line, frozen cells were thawed, followed by centrifugation (800g,
5min) to pellet cells so solvent could be removed. Cell pellet were suspended in the cell
growth medium, transferred to the culturing flask and diluted with growth medium. See Table
4 for more details about flask type used based on number of cells, and respective liquid
amounts. When confluent, the cells were first washed with PBS, by carefully swirling the
flask. PBS solution was then removed, and trypsin/EDTA solution was added to the flask,
covering the cells, to loosen them from the flask. Cells were then incubated at 37 °C in a
humidified atmosphere containing 5 % CO2 until cells were loose from flask surface, and
subsequently mixed by re-suspension. Cells in trypsin solution were then split, growing
further the small part, and freezing the large part. The small part was added to the cell
culturing flask and growth medium was added to the total volume suited for flask size. Before
freezing the large part, medium was added to cell solution (how much is not important,
normally 3-10 mL) to terminate the trypsination. The number of cells was measured by
pipetting 10 µL of the solution onto a cell counter glass, which was inserted into the cell
counter, which reported the number of cells per mL cell solution. Subsequently, the remaining
cell solution was centrifuged to make cell pellet. All liquid was removed and the cell pellet
was re-suspended in PBS, before further centrifugation. This washing step was repeated once
more before cell pellet was resolved in suitable amount of NP-40 lysis buffer and frozen at -
80 °C for further analysis. When freezing down cells suited for further growth later, the PBS-
washed cell pellet was diluted in 900 µL medium with 100 µL DMSO in a CryoTube™ vial.
This was stored in a Mr. Frosty™ freezing container at -80 °C for a day to ensure slow
freezing, before the tube was transferred to a nitrogen tank (-200 °C).

39
Table 4 Amount of components for cell culturing based on number of cells. Three different cell
culturing flask sizes were used based on number of cells that were in culture. Amount of PBS,
Trypsin/EDTA solution and growth medium was based on flask size. aNumber of cells when confluent
will vary according to cell types. The listed values are approximate values.
Number
of cells
when
seeding
Cell flask
culture area
Number of cells
at confluencya
PBS Trypsin/EDTA Medium
0.7 * 106 25 cm2 2.8 * 106 3 mL 3 mL 3-5 mL
2.1 * 106 75 cm2 8.4 * 106 5 mL 5 mL 8-15 mL
4.6 * 106 175 cm2 18.4 * 106 10 mL 10 mL 15-30 mL
In order to grow more cells, the entire trypsin/EDTA cell solution (after trypsination and
subsequent re-suspending) was pipetted into a larger flask, and medium was added to
appropriate volume.
5.3.2 Immunoprecipitiation
To connect antibody to beads, the bead solution was vortexed and 50 µL were transferred to a
vial. Supernatant was removed by placing the vial on the magnet, letting the beads be
attracted to the magnet. 3 µg of antibody solution (µL calculated according to antibody
concentration, see Table 2) were solved in 200 µL PBS-T and transferred to the vial
containing the beads. The bead-antibody solution was re-suspended, before 1 hour incubation
at room temperature with rotation. Supernatant was removed and 1 mg of protein (cell lysate)
was added to the bead-antibody solution, and allowed to react overnight at 4 °C with rotation
to form a bead-antibody-protein complex. The following day, the supernatant was removed,
and the bead-antibody-protein complex was washed by re-suspending carefully three times
with 200 µL PBS (the supernatant was discarded between washes). The bead-antibody-protein
complex was resolved in 100 µL PBS, transferred to a new vial, and the supernatant was
discarded. To elute proteins from the beads, 25 µL of 0.2 M citric acid were added to the vial
and incubated for 5 minutes. The supernatant was transferred to a new vial. This step was
repeated twice, and supernatants were combined. The extract was now ready for further use.
40
5.3.3 Transformation
200 µL of the bacterial solution were pipetted onto a LB culture dish with AMP and incubated
overnight at 37 ºC in order to form bacterial cultures. One or two cultures were scraped off,
mixed with 50 mL LB medium with AMP, and the solution was incubated overnight at 37 ºC.
After incubation, the solution was transferred to a 50 mL vial and cells were pelleted by
centrifugation. The medium was completely removed. DNA was extracted from bacterial cells
using the protocol of the JETSTAR 2.0 midi-prep kit. All solutions used, referred to as
solution 1-6, came with the kit. In each step the column was allowed to empty by gravity
flow. Columns were first activated by applying 10 mL of solution 4. As the solution run
through the column, 4 mL of solution 1 were added to the cell pellet, followed by re-
suspending. Subsequently solution 2 was added to the solution for cell lysis and mixed gently
by inverting. The solution was kept on the bench for 5 minutes before 4 mL of solution 3
were added for neutralization. It was mixed immediately by multiple inverting. When the
solution became homogenous it was centrifuged at 800g at room temperature for 10 minutes.
The supernatant was applied to the column (no solution 1 left in the column). The column was
washed by adding 2 x 10 mL of solution 5. The DNA was eluted from column by applying
solution 6. When all solutions had completely eluted, 3.5 mL of cold isopropanol was added
to the solution to precipitate the DNA. The solution was subsequently centrifuged at 12 000g
for 30 minutes, and the supernatant was carefully removed by quickly inverting the tubes. 3
mL 70 % ethanol were added to the pellet, and the solution was centrifuged for 10 minutes at
12 000g. Again the supernatant was carefully removed by quickly inverting the tube. The tube
with the cell pellet was allowed to dry by keeping the tube up-side down. The cell pellet was
dissolved in 10 µL 10 mM Tris-HCl (pH 8) and transferred to a 1.5 mL vial. The DNA
concentration was measured by diluting 2 µL of the DNA solution in 98 µL water. The
spectrophotometer was set to DNA measurements, with 10 mm path length, 380 nm
corrections, and a dilution factor of 50. Water was used as reference, and concentrations were
reported in µg/µL. The solution was stored at -20 °C.
5.3.4 Transfection
600 000 cells per well were cultured in a 6-well plate, following same procedure as in section
5.3.1. When cells had reached 40-70 % confluence, the medium was replaced by growth
medium without P/S and ITS and incubated for one hour. For each well, 2 µg of DNA (based
on DNA concentration found in section 5.3.3) were mixed with 200 µL optimum medium in a

41
1.5 mL vial and vortexed, before further mixing with 6 µL Fugene HD reagent (µg DNA +
µL Fugene HD, 1 + 3). The solution was vortexed and incubated for 15 minutes at room
temperature, before it was evenly dripped by a pipette onto the cells. Cells were incubated at
37 ºC overnight. On the following day, the medium was changed to cell growth medium with
FBS, P/S and ITS. For positive control, the EGFP-DNA was used in one well. In another
well, all reagents were added except DNA, in order to function as negative control.
Transfection was evaluated using a fluorescent microscope as the EGFP protein (produced in
the well where EGFP-DNA was added) emits fluorescent light. When cells were confluent,
they were frozen following the procedure with PBS washing and trypsination already
described in section 5.3.1.
5.3.5 Western blotting
The cell lysate was diluted to a protein concentration of 1 µg/µL. For each sample to be
analysed with WB, 24 µL of cell lysate were mixed with 6 µL 5x loading buffer, re-
suspended, and heated at 70 °C for 10 minutes at a heating block. At the same time, the
electrophoresis box was filled with running buffer, after inserting the gel. After heating,
samples were centrifuged for 1 minute before 30 µL of sample with loading buffer were
loaded onto the gel. At least one lane per gel was loaded with 5 µL protein ladder. A voltage
of 80 V was applied to the chamber until the bromophenol blue (from loading buffer) had
reached the middle of the gel. The voltage was then raised to 150 V, and the gel was run until
the bromophenol blue had reached the end of the gel. The gel was removed from the chamber
and the gel, the membrane (after been activated in methanol for 25 seconds) and the filter
papers were left in 1x transfer buffer for 10 minutes. Components were laid as a sandwich in
the transfer chamber with following order, bottom to top; filter paper – membrane – gel –
filter paper. A voltage of 8 V was applied to the chamber, and left overnight at 4 ℃.
The following day the membrane was first blocked for 1 hour in 5 % non-fat milk in TBS-T
solution at room temperature. Subsequently the membrane was transferred to a tube
containing the appropriate primary antibody solution (see Table 1 for antibody overview and
section 5.2.2 for information about dilutions and solutions used). No washing step was
necessary between blocking and primary antibody incubation due to use of the same solution
(milk). All incubations were performed using 14 or 50 mL tubes (based on membrane size)
containing 3 or 6 mL antibody solution, respectively. The tube was left for reaction on a roller
overnight at 4 ℃. On the following day, the membrane was washed with PBS (3 x 5 min).

42
The membrane was transferred to a tube containing secondary antibody solution (Table 2 and
section 5.2.2) and incubated for 1 hour at room temperature on a roller. The secondary
antibody was chosen based on the origin of the primary antibody (anti-rabbit, anti-goat or
anti-mouse). The membrane was washed with TBS-T (3 x 5min).
Visualizing
To visualize the bands after the last washing step, the membrane was transferred to a
transparency film. Equal amounts (0.5 mL per membrane) of the ECL liquids were mixed in a
tube, and evenly applied to the membrane (1 mL combined liquid amount per membrane),
which was left to react for 3-5 minutes in the dark, before covered with a new transparency
film. When visualizing in the imaging system, chemiluminescence was chosen as setting.
Exposure time was set based on antibody performance. For actin a short exposure of 5-20
seconds was chosen, while 1000–3000 seconds were used for CYP27a1.
5.4 Sample preparation prior to LC-MS/MS
5.4.1 Gel electrophoresis
Gel electrophoresis (GE) was performed to separate proteins according to size before further
sample preparation. The same procedure used for WB, was used.
5.4.2 Protein digestion
Protein digestion was performed using two different approaches, in-solution and in–gel
digestion based on the former separation step.
In-solution
The protein solution was diluted to 100 µL with 8 M urea /50 mM ABC. The proteins were
reduced adding DTT to a final concentration of 5mM, mixing and incubating for 30 minutes
at 37 ℃. IAA was added to a final concentration of 15 mM to alkylate the protein chains,
mixed and incubated in the dark at room temperature for 30 minutes. If urea was used to solve
the proteins, 50 mM of ABC was added until the urea concentration was less than 1M.
Trypsin was then added to a final trypsin + protein ratio of 1 + 19 (w/w) and left in a heating

43
block set to 37 ℃ with shaking, for at least 18 hours. To terminate the trypsin activity, TFA
was added to a final concentration of 0.1 %. The tryptic digest was now ready for SPE.
In-gel
Following GE, the gel was covered by fixation buffer for 4-18 hours and stained with
Coomassie brilliant blue for 2-4 hours. The gel was destained in water overnight. The mass
range of interest (50kDa-100kDa for CYP27a1) was cut out from each lane, sliced into small
pieces (1 mm2) and transferred to a vial. 200 µL freshly made 25 mM ABC were added and
allowed to be “swallowed” by the gel for 15 minutes. The supernatant was then discarded.
200 µL of ACN were added to the gel pieces and the supernatant was removed after 15
minutes. The two steps were repeated three more times. 200 µL of freshly thawed 10 mM
DTT were added to the gel pieces and allowed to react for 30 minutes at 65 °C. Supernatant
was removed and the two steps with ABC and ACN were repeated once. 200 µL of freshly
thawed 10 mM IAM were added and the solution was left for 45 minutes in the dark at 37 °C.
After removing the supernatant, the step with ABC and ACN was repeated once. 10-20 µL of
20 ng/µL trypsin/Lys-C mixture was added to the gel pieces and allowed to rehydrate for 10
minutes before adding 60 µL of 25 mM ABC. The gel pieces were stored overnight at 37 °C
in the trypsin/Lys-C solution. The next day, 10 µL of 1 % FA were added before the
supernatant was transferred to a protein low bind tube. 2 x 50 µL of 5 % FA + ACN (1 + 2)
were added to the gel pieces and left for 15 minutes before the supernatant was combined
with the other supernatant. Samples were dried in the concentrator and resolved in 1 mL 2 %
ACN in 0.1 M TFA before SPE.
5.4.3 Off-line SPE
The SPE column was first activated with 1 mL 0.1 % TFA in ACN followed by 3 x 1 mL 2 %
ACN in 0.1 % TFA. The sample was then added to the column and the flow-through was
collected and passed through one more time. The column was washed with 0.1 % TFA in LC-
MS water before eluting the sample with 1 mL ACN in 0.1 % TFA. After elution, the filtrate
was dried in a concentrator on medium drying rate (no heat if dried overnight). Samples were
then frozen at -80 °C until further use.
Before analysed by LC-MS, samples were thawed and diluted in 20 µL 2 % ACN in 0.1 %
TFA and protein concentrations were measured. If protein concentrations were above 1

44
µg/µL, the sample was diluted to 1µg/µL in order to not inject more than 1 µg sample on the
LC column.
5.5 LC-MS/MS
5.5.1 LC
1 µL of sample was injected (flow rate of 20 µL/min) using the auto sampler implemented in
the nanoLC pump. The solvent gradient started at 3 % MP B and was increased to 36 % MP B
during 30 minutes, followed by an increase to 95 % during 10 min and held at that percentage
for 15 minutes. The gradient flow rate was 130 nL/min. For sample loading 5 µL of the loop-
volume containing the 1 µL injected sample, was loaded to the precolumn with a flow rate of
500 nL/min. Before each sample the precolumn was equilibrated using 2 µL MP A and a
flow rate of 500 nL/min, while the analytical column was equilibrated using 5 µL MP A and a
flow rate of 200 nL/min.
5.5.2 MS
A voltage of 1.8 kV was applied to the nano emitter, and all experiments were performed in
positive mode. Both full-MS with data dependent MS/MS (dMS/MS) and tMS/MS were used.
In dMS/MS, resolution was set to 70 000, with automatic gain control (AGC) at 1 000 000, a
maximum injection time (IT) of 120 ms and a scan range from m/z 350 to 1850. When turning
to dMS/MS the resolution was lowered to 35 000, AGC target to 100 000 and IT to 60 ms.
The normalized collision energy (NCE) was 30 eV, charges at 1 or >7 were excluded, and
dynamic exclusion was set to 40 s. When tMS/MS was used, the m/z to the signature peptides
were implemented to the PRM method, with an m/z isolation window of +/- 4. No retention
time was set, but IT was set to 500 ms. Resolution was 35 000, AGC 100 000 and NCE 35
eV.
5.5.3 Data processing
The dMS/MS result files were evaluated using Proteome Discoverer where result files were
search against CYP27a1 using Sequence Algorithm with the following criteria; maximum 2
allowed missed cleavages, precursor and fragment mass tolerance of 10 ppm and 0.6 Da
respectively, no false discovery rate and with methionine oxidation as dynamic and

45
carbamidomethyl as static side chain modification. Signal to noise (S/N) threshold was set to
1.5 and minimum ion count to 1.
Both dMS/MS and tMS/MS results were evaluated in XCalibur software. Chromatographic
peaks for targeted peptides were extracted with enabled boxcar smoothing (7 points) and a
mass tolerance of 5 ppm. 5 decimals of the m/z-value were implemented.

46

47
6 Results and discussion
In this thesis a method for targeted CYP27a1 has been pursued. Beta-catenin was also
included in the method investigations to evaluate the sample preparation workflow. An
overview of the workflow is shown in Figure 15.
Figure 15 Overall workflow for the experiments performed in this thesis and discussed in the
following section.

48
6.1 CYP27a1 – its abundance in different cell lines
The abundance of a protein differs in different cell types based on their origin (e.g. breasts)
and disease (e.g. cancer). CYP27a1 levels in five cell lines were therefore determined by WB
(Figure 16A). The CYP27a1 antibody used in WB was evaluated earlier by Kaja Lund [21].
Because band intensities for the loading control (actin) differed, Image lab was used to
measure the intensities. By normalizing the actin/CYP27a1 intensity values to the average
actin/CYP27a1 value in the cell line MCF7, a comparison of CYP27a1 levels could be made
(Figure 16B). All WB raw files are found in section 9.3 in appendix.
Figure 16A) WB of MCF-7, MDA-MB-231, RKO, BxPC-3 and HEK293 cell lines using CYP27a1
antibody. Three replicates of each cell line were produced and analysed. For loading control actin
antibody was used. As positive control, a transfected HEK293 cell line (CYP27a1-FLAG) and anti-
FLAG antibody was used. B) The band intensity of CYP27a1 divided by the intensity of the
corresponding actin band. This ratio is then divided by the MCF7/actin average. The black lines show
the average of the values for the cell line. Both A and B are published in [89].

49
The WB of the cell lines (Figure 16A) only gave weak bands for CYP27a1, but it was
possible to perform an approximate comparison of the CYP27a1 levels in the different cell
lines. In MDA-MB-231, an additional band appeared close to the CYP27a1 band. It could be
due to an unspecific binding of the antibody, or a modification of CYP27a1. As the second
band was not at the same kDa as CYP27a1, the CYP27a1 intensity was measured based only
on the upper band.
MDA-MB-231 was the cell line with highest amount of CYP27a1, and following cell work
was performed using this cell line. In addition the HEK293 cell line was used, as it is easy to
work with, e.g. regarding transfection. During cell experiments mycoplasma infection was an
issue, and the cell culturing had to be repeated.
Thus, the cell lines MDA-MD-231 contained the highest amount of CYP27a1. Further
investigations were performed using the MDA-MB-231 cell line, and the HEK293 cell line.
6.2 Producing a CYP27a1 standard
In the onset of this study a CYP27a1 protein standard was not available, and antibodies for
CYP27a1 performed poorly. As the method development included investigation of possible
sample treatments which partly relied on antibodies, transfection (3.3.2), where DNA for the
CYP27a1-FLAG protein was implemented in the cells, was used to produce a CYP27a1
standard appropriate for immuno-based experiments. The antibody for the FLAG amino acid
sequence was commonly used in the lab for selective detection by western blot, and was by
that considered to provide the selectivity needed.
Fluorescence evaluation
The response of a cell regarding protein expression is not visible to the eye, and in order to
quickly evaluate the success of transfection, EGFP was used. Thus, in one replicate EGFP-
DNA was inserted instead of CYP27a1-DNA, functioning as a positive control. The EGFP
emits fluorescent light, and Figure 17 shows a picture of the EGFP-cells taken through a
microscope.

50
Figure 17 Microscope pictures of transfected HEK293 cell line with EGFP-DNA. The picture to the
left is with normal setting (shows the cell density). The picture to the right is taken in fluorescent mode
(EGFP-proteins produced by transfection). A negative control was included in the experiment (data
not shown).
The amount of green dots among the cells implies that the transfection was successful, and
that EGFP proteins were produced. Based on this it could be assumed that CYP27a1-FLAG
proteins were produced in the other wells, where the CYP27a1-DNA was applied. However,
as DNA is produced in bacterial cells and inserted in mammalian cells, each of those
components are “alive” and prone to variable behavior and response. Hence, no definite
conclusion regarding successful transfection could be made based on the successful EGFP-
protein transfection, and further confirmation was wanted.
WB evaluation
To further evaluate the transfection WB was used, where a transfected cell lysate and an
untreated cell lysate, both HEK293, were compared (Figure 18). By using anti-FLAG
antibody, a band was expected for the transfected lysate, but not for the untreated one. In
addition, WBs with CYP27a1 antibody were performed on the same samples in order to 1)
compare the CYP27a1 antibody to the FLAG-antibody 2) to compare CYP27a1 levels in
transfected and untreated cells and 3) use as a positive control (i.e. that CYP27a1 was present
in both samples.

51
Figure 18 WB of untreated cell lysate and transfected lysate (CYP27a1-FLAG), using antibody for
FLAG and CYP27a1. The same transfected and untreated lysate was used for both antibodies, and
the same protein amount was applied to the gels.
For the FLAG-antibody, bands appeared only for the transfected lysate, and the intensity of
the CYP27a1 bond for the transfected lysate was stronger than for the untreated lysate. Both
observations corresponds to that CYP27a1-FLAG was produced. Based on this, CYP27a1 had
been produced by transfection, and could now be used as standard in investigations of
immuno-based experiments, providing enrichment (IP) and detection (WB). In WB, a sample
containing the FLAG sequence could be applied, functioning as positive control (detected by
the FLAG antibody) when relaying on the CYP27a1 antibody for detection.
In addition, assuming that the same amount of protein was applied to the gels, the intensity of
the bonds can be used to evaluate the antibody performance. For the transfected sample, the
FLAG band was significantly stronger than the CYP27a1 band. As the CYP27a1 antibody
detects both CYP27a1 and CYP27a1 FLAG, while FLAG only detects CYP27a1 FLAG
produced by transfection, the intensities should have been opposite. This demonstrates the
other issue with the CYP27a1 antibody; its low sensitivity. However, to be able to conclude
regarding the sensitivity, actin control should be included as the actin protein is used as a
loading control in WB. The low increase in intensity in the transfected lysate CYP27a1 band,
compared to the CYP27a1 band in the untreated lysate could imply an uneven protein
application to the gel.
Thus, CYP27a1-FLAG was produced by transfection and could be used further for immuno-
based experiments.

52
6.3 Immunoprecipitation
As the CYP27a1 abundance is low in cells, and the samples are complex, sample clean-up
was necessary prior to the LC-MS determination. IP (Figure 14) was used for this purpose as
it can provide both decreased sample complexity and an enrichment of the target compound.
A workflow for all IP experiments performed is found in Figure 19. During IP investigations,
a method for LC-MS determination of CYP27a1 was not established (no CYP27a1 standard
available), and WB was used for protein detection and assessment of the IP experiments.
Figure 19 Experiments performed to investigate IP. The main difference is antibodies used (to use
FLAG antibody a transfected lysate must be applied, as CYP27a1 in normal lysate does not contain
the FLAG amino acid sequence). If not mentioned otherwise in the figure, the HEK293 cell line is
used. The antibody origin is mentioned for CYP27a1, to be able to differ between the three different
CYP27a1 antibodies used in this thesis.

53
IP was used to target CYP27a1 using CYP27a1 antibodies. Three different antibodies were
evaluated (Figure 19A) from three different origins and suppliers. In Figure 20 the WB of the
IP sample in which the CYP2C7a1 goat antibody was used, is shown. This antibody was the
only one that appeared to give an extraction of CYP27a1, as an indication of a band is seen
for CYP27a1 in both the cell lysate and the IP sample, but not in the negative control. WB
signal was poor, especially as the CYP27a1 band in cell lysate normally was more intense.
However, better signal could not be obtained, and it was decided to use the CYP27a1 goat
antibody in the future experiments.
Figure 20 WP of IP using CYP27a1 goat antibody, with positive control (cell lysate) and negative
control.
Thus, the CYP27a1 goat antibody was evaluated to be the best choice for further IP
extraction of CYP27a1.
IP targeting FLAG
As the IP-WB workflow for CYP27a1 gave low signal intensities, FLAG antibody was used
(Figure 19B), targeting CYP27a1-FLAG in the transfected cell lysates, to evaluate the
general IP procedure. In Figure 21 the WB of an IP-FLAG sample is compared with that of a
transfected only sample (i.e. not performed IP) using FLAG antibody.
CYP27a1 70 kDa

54
Figure 21 WB with IP-FLAG detection. The band on the left is transfected lysate, and the band on
the right is IP FLAG antibody treated transfected lysate. The FLAG antibody was used for detection
for both samples.
The WB showed that the IP method enabled the extraction of a CYP27a1 using a FLAG
antibody. The minimal/no WB detection for former attempts of CYP27a1 IP were then most
likely due to the antibody performance and not the method itself or the operator. The
enhanced intensity of the IP band compared to the no-IP band indicates that the CYP27a1
concentration is increased after performing IP. However, loading control with actin could not
be done as the only protein present in IP samples should be the targeted protein, and the
enrichment effect of IP was therefore an estimate based on the applied protein concentration.
Thus, targeting FLAG in IP enabled enrichment of CYP27a1-FLAG.
Further IP investigations
A closer investigation of the IP procedure to find the limiting step regarding CYP27a1
extraction was needed. To see if the cell line used had an impact on the IP outcome, both
HEK293 and MDA-MB-293 were evaluated (Figure 19C). As the amount of protein could
affect the ability of extraction, three different amounts of protein were used for HEK293 (1
mg, 2 mg and 3 mg) (Figure 19C). In case that WB detection did not occur due to the
performance of the CYP27a1 antibody in WB, transfected HEK293 sample was also
subjected to IP (Figure 19D). With this sample, CYP27a1 antibody could be used in IP, while

55
the FLAG antibody could be used in WB, eliminating the use of a poor antibody in both steps.
As a last test, the CYP27a1 standard (now available) was also subjected to IP (Figure 19E).
A workflow for these experiments is found in Figure 22A. The WB results for the workflow
are found in Figure 22B-E.
Figure 22A) Workflow for IP experiments. B) WB for standard CYP27a1, C) WB for MDA-MB-
231, D) WB for HEK293 and E) WB for transfected HEK293. Abbreviations: Std: CYP27a1
standard, M: MDA-MB-231 lysate, H: HEK293 lysate, Tr: HEK293 transfected lysate (CYP27a1-
FLAG), ON: overnight supernatant, W1: wash no.1 supernatant, W2: wash nr.3 supernatant, CA:
citric acid extract.

56
For each sample four outputs were produced; to test that if the proteins did not attach to the
bead-antibody complex, the supernatant after overnight incubation was collected (ON). Three
washes were performed of each sample, and to see if this affected the bead-antibody-protein
complex, the supernatant from the first (W1) and the third (W3) wash were collected. The last
was the citric acid extract (CA) where it was expected to find CYP27a1. All of the IP
experiments showed the same; no band occurred in CA, but band occurred in ON. These
observations can be explained by either that the antibody binds to the protein, but not to the
magnetic bead, or that the antibody binds to the magnetic bead, but not to the target protein. A
hint of a band was observed for W3 in Figure 22E (transfected sample) and W1 in Figure
22B (CYP27a1 standard), but the appearance of a band for actin in the same samples
indicated that this was ON that had not been washed yet (and not the loss of CYP27a1 from a
possible bead-antibody-protein complex).
To conclude; adding more proteins or changing the cell line had no influence on CYP27a1
extraction, and neither did the amount of washing or the WB antibody used.
6.4 How to connect biology and chemistry for
analysis of biologically prepared samples?
When IP samples were subjected to LC-MS analysis without other additional sample
preparations steps than digestion (in solution) and SPE, CYP27a1 could not be detected,
partly caused by detergents that gave rise to ion suppression in the electrospray.
At that time, the SDS loading buffer was used to elute proteins from the beads. When
analysing biological samples by LC-MS, the use of detergents should be minimalized, due to
their mismatch with ESI [90-93] . Hence, citric acid, a non-detergent and weaker eluting
agent, was assessed for elution of proteins from the bead-antibody-protein complex in IP. Due
to problems with the MS-instrument during IP investigations, the citric acid samples were not
analysed by LC-MS, and hence, the detergent issues in these samples are not known.
However, as the NP-40 detergent was still used for cell lysis, it was assessed as necessary to
perform GE with subsequent in-gel digestion to achieve adequate MS detection.
With the use of SDS-PAGE detergents were not were no longer present in the spectra. The
SDS-PAGE sample preparation with subsequent in-gel digestion is time consuming, and loss
57
of proteins is an issue [94], but it provides separations of proteins, enabling the extraction of
protein in a selected mass range, also minimizing sample complexity.
Detergents are powerful agents for solubilization of a cell, most likely necessary for the
extraction of the mitochondrial CYP27a1. Thus removal of detergents in the lysis buffer was
not attempted at this stage of the investigations. An optimization of the workflow, including
the use of non-detergent lysis buffers and hence possibly remove the need for SDS-page (if it
is not necessary for minimization of sample complexity), should be performed.
It is not only proteins that contributes to the complex nature of cell samples, but also other
cell components (cell membrane, metabolites), salts and particles e.g. from gel separation,
could give rise to technical issues during an LC-MS analysis. Such issues are clogging (nano
LC is especially exposed to clogging due to the small inner diameters) and ion suppression
(due to salts or other easily ionisable compounds of high abundance). SPE was therefore
performed on all samples prior to LC-MS analysis. The LC system contained a precolumn,
but as clogging of precolumns occurred during the investigations, an additional off-line SPE
step was assessed as necessary. In further investigation, the use of an automated
filtration/filter backflush (AFFL)-SPE system [95] could remove the need for the time-
consuming off-line SPE stage.
Thus, it was assessed as necessary to perform SDS-PAGE with subsequent in-gel digestion to
remove detergents, and SPE for additional sample-clean up before LC-MS/MS analysis.
6.5 Beta-catenin; does the IP method work for other
targets?
The investigated method for detection of CYP27a1 in cell samples by IP was not successful
for identification of CYP27a1. It was suspected that the reason was unsuitable antibodies;
therefore it was decided to test the method by targeting beta-catenin. IP using beta-catenin
(see Table (AP) 4 for protein sequence), followed by WB (Figure 19F) was already used by
co-workers, and in addition, determination of beta-catenin by LC-MS had been established in
a previous study [96]. Beta-catenin was therefore targeted to verify the IP workflow in this
study, and WBs of beta-catenin IP samples are found in Figure 23.

58
Figure 23 WB of beta-catenin IP samples. Antibody against beta-catenin was used for all WBs. The
IP-beta-catenin bonds represent three replicates of beta-catenin IP samples, where beta-catenin
antibody was also used in IP. The lysate is an untreated cell sample, while normal IgG rabbit antibody
was used as negative control in IP.
Beta-catenin was detected by WB in IP samples, and thus the procedure used in IP was
verified. The beta-catenin band intensity for the lysate sample, which is untreated, was much
weaker than for the IP bands, supporting the trait of IP as an enrichment step. No band
appeared in the negative control at the beta-catenin mass range.
Bands detected by WB cannot be further analysed by LC-MS, hence, before LC-MS analysis,
proteins in the IP samples were separated using SDS-PAGE (3.3.4). From the stained gel
three lanes were combined to one sample to enhance beta-catenin abundance before in-gel
digestion. The stained gel and MS chromatograms are shown in Figure 24.

59
Figure 24 Gel bands and extracted ion chromatograms for the two beta-catenin signature peptides,
ATVGLIR and NEGVATYAAAVLFR. The precursor and fragment ions for each peak are listed. B)
The extracted mass spectra for the retention time of ATVGLIR. C) The extracted mass spectra for the
retention time of ATVGLIR. The stars indicate the fragment ion m/z peaks. The in-house packed silica
monolithic C8 precolumn (5 cm x 50 µm) and the in-house packed C18 column (15 cm x 50 µm) were
used. Flow rate was 130 nL/min, with a gradient of 3-36 % MP B. The PRM method targeting beta-
catenin was used, with tMS/MS settings described in the experimental section.
In the stained gel, beta-catenin was not detected by Comassie blue. New IP samples were
produced to look for the bands, but they did still not occur. However, this is not an issue as
Comassie blue staining is not sensitive and according to WB, a more sensitive method with
the use of the beta-catenin antibody, beta-catenin was present. The additional bands occurring
in the stained gel in Figure 24 also occurred to some extend in the WB (see the WB raw file

60
in Figure (AP) 9 in appendix), but it was not investigated further as the bands were located at
other masses.
Beta-catenin was successfully detected in IP samples by nano LC-MS. An overview of the
now established method for IP LC-MS is shown in Figure 25. The sample was injected 5
following times on the nano LC-MS system, applying PRM. Signature peptides with
corresponding transitions for beta-catenin [96] are listed in Table (AP) 6 in appendix. The
replicates showed a high repeatability in retention time (ATVGLIR; mean = 10.91, standard
deviation (s) = 0.01, relative standard deviation (RSD) = 0.05, NEGVATYAAAVLFR; mean
= 15.88, s = 0.02, RSD = 0.13, N=5 for both peptides). However, the detection was only
based on two of four listed signature peptides, as two on the peptides were not detected. It is
not known why no peaks could be extracted, but this was not investigated further as an
adequate determination could be based on two peptides identified [49]. For ATVGLIR only
two fragments were determined, but again, with four fragments for NEGVATYAAAVLFR,
data were considered sufficient for the purpose of the experiment; detection of beta-catenin in
IP samples.
The repeatability of the WB of beta-catenin IP was to a certain degree verified, as it was
performed twice. Only one sample was analysed by LC-MS, but five LC-MS replicates
provide sufficient data to verify the LC-MS method for the LC-MS system used. The
repeatability of the entire method was not evaluated, but the amount of data obtained was
enough for the purpose of this investigation.
To sum up, beta-catenin was detected in IP gel samples by targeted LC-MS, hence; sample
preparation procedure including IP (Figure 25) enables detection of a target protein by LC-
MS.

61
Figure 25 Established workflow using IP, for detection of beta-catenin.
6.6 LC-MS data for CYP27a1
6.6.1 Signature peptide determination
When applying PRM for targeted proteomics, the signature peptides corresponding to the m/z-
values monitored in the MS must be determined.
A list over CYP27a1 peptides predicted as highly observable was found in the PeptideAtlas
database [53, 54]. The listed peptides from PeptideAtlas were evaluated regarding uniqueness
by Uniprot. This computer program matches the amino acid sequence against the human
genome, and enables us to easy find if the peptide is matched to other proteins. If a peptide
matched 100 % against other proteins than CYP27a1 it was discarded for further evaluation,

62
as it cannot provide a selective detection. The peptides matching e.g. 57 % to another protein
was not excluded, but before choosing the peptide as signature peptide, the sequence overlap
had to be investigated further. Investigations for ATGAPGAGPGVR and SIPEDTVTFVR are
shown in Table (AP) 8. The sequences did not give the same mass as the signature peptide
candidates; hence they would not give rise to interferences in tMS/MS, and the signature
peptides could be used for CYP27a1 detection.
An in-solution digested CYP27a1 standard was used for investigation of the practical assets
of the peptides; chromatographic peaks and number of fragment ions detected. The result of
the peptide evaluation described is shown in Table (AP) 7 in appendix.
Finally a gel sample was analysed by LC-MS (in dMS/MS mode). For this sample, only
LLKPAEAALYTDAFNEVIDDFMTR was detected with a good S/N ratio, and it was
therefore decided to continue with this peptide as a signature peptide, even though it was not
detected in the standard, and it contained methionine (oxidation).
Determination of a protein can be based on an single signature peptide, but to ensure a secure
identification [49] three signature peptides were wanted in this study. Based on the evaluation
described in the previously sections (a workflow overview is found in Figure 26), the two
additional peptides ATGAPGAGPGVR and SIPEDTVTFVR were chosen.

63
Figure 26 The workflow for choosing signature peptides. All LS-MS evaluations were performed in
dMS/MS mode.
Identification of a peptide, and hence the CYP27a1 protein, is usually based on at least three
fragment ions [97]. To decide which fragment ions to use to evaluate identification, a
tMS/MS analysis by PRM of the CYP27a1 standard was performed, implementing the three
signature peptides into the PRM method. The chromatographic peaks corresponding to the y-
fragment m/z-values for ATGAPGAGPGVR and SIPEDTVTFVR, with mass spectra, are
shown in Figure 27.

64
Figure 27A) Extracted fragment ion chromatograms with mass spectra for ATGAPGAGPGVR. B)
Extracted fragment ion chromatograms with mass spectra for SIPEDTVTFVR. In the
chromatograms in A and B, the m/z-values to the extracted peaks are listed for each chromatogram.
To the right, the mass spectrum for the chromatographic peak retention time is extracted. All injected
replicates were analysed by tMS/MS mode. Chromatographic conditions and the analytical column
used were the same as described in Figure 24. The commercial C18 Acclaim precolumn was used.
LLKPAEAALYTDAFNEVIDDFMTR was not detected, and a fragment selection for this
peptide has not been performed. For ATGAPGAGPGVR and SIPEDTVTFVR all
implemented fragments gave rise to a chromatographic peak. The peaks for SIPEDTVTFVR
in Figure 27B had some tailing. For each of the two peptides, the three fragments with
highest intensity were selected for further use [97]. However for SIPEDTVTFVR, two of the
three most intense fragment mass spectra peaks (m/z = 837.45 and 966.49), later showed to
not give detection when analysing real samples. Therefore, in addition to the m/z = 722.42

65
fragment, m/z = 621.37 and 522.30 were chosen for SIPEDTVTFV. The three signature
peptides are listed in Table 5, with fragments for SIPEDTVTFVR and ATGAPGAGPGVR.
Table 5 List of signature peptides, with fragments, chosen for CYP27a1. Three signature peptides
were chosen based on a list of criteria, with three corresponding fragments.
LLKPAEAALYTDAFNEVIDDFMTR did not provide fragment selection.
CYP27a1 Peptide
Precursor
[M+2H]2+
m/z
Fragment
m/z
ATGAPGAGPGVR 505.77 Y8
+
710.39
Y7+
613.34
Y6+
556.32
SIPEDTVTFVR 632.34 Y6
+
722.42
Y5+
621.37
Y4+
522.30
LLKPAEAALYTDAFNEVIDDFMTR 915.13 Not found
Even though fragments were not chosen for LLKPAEAALYTDAFNEVIDDFMTR, the
precursor mass was still implemented in the PRM method. Since the MS was set to only
monitor three precursor masses, it was assessed that it would not affect the MS detection of
the two other peptides. Identification of CYP27a1 was from now mainly based on the two
signature peptides ATGAPGAGPGVR and SIPEDTVTFVR, which is still adequate for a
secure identification (though more peptides would provide an even more secure identification
[49]). The CYP27a1 protein with its signature peptides is illustrated in Figure 28.

66
Figure 28 The CYP27a1 protein with signature peptides marked. The three signature peptides are
marked with grey. The protein is visualized using Protter [98]
The signature peptide determination was time consuming and involved several evaluation
stages, compared to using signature peptides suggested by databases available. Three
signature peptides has also been established for an LC-M method for CYP27a1 in retina [72].
It was still assessed as necessary due to the instability of the system, the use of cells instead of
retina, and the insecurity of the sample preparation.
To sum up; the two peptides ATGAPGAGPGVR and SIPEDTVTFVR enable a selective
detection of CYP27a1, and could be implemented in the further investigations.
6.6.2 The liquid chromatography system
Precolumn evaluation
Precolumns have different ability to trap the analyte on the column, preventing the analyte to
be flushed to waste when sample is loaded. Three different precolumns were evaluated
regarding their performance; one commercial and two produced in-house. A benefit with
using in-house produced columns is the cost reduction, as commercial columns often are
expensive. The CYP27a1 standard was analysed in triplicate by LC-MS for each precolumn.
The MS was set to targeted mode, scanning for the three signature peptides. In Figure 29, the
CYP27a1 peptide fragments are extracted for each precolumn tested.
In Figure 29A the commercial C18 Acclaim precolumn was used, coupled to the analytical
system, and it provided detection of all six fragments. The peak tailing for the

67
SIPEDTVTFVR peptide (three bottom lanes) is consistent with previous observations. The in-
house produced PS-DVB 5 cm precolumn (Figure 29B) did not give any chromatographic
peaks, and hence no detection. This column was not evaluated further. The silica-based C8
monolithic column produced in-house [86] provided chromatographic peaks for all six
fragments (Figure 29C). In the second and third chromatogram two additional peaks occurred
but this did not affect the detection as the peaks were appearing with other retention times.
The only effect of the additional peaks is the low relative appearance of the targeted peak in
the second chromatogram (as the y-axis shows relative and not absolute abundance), but the
intensity was the same as the other peaks (103-104). The tailing for the SIPEDTVTFVR
peptide was also observed for this precolumn.

68
Figure 29 Extracted ion chromatograms of CYP27a1 peptides in a CYP27a1 standard analysed by
three different precolumn LC-MS systems. For each precolumn, the three fragment ions for the two
signature peptides were extracted. The PRM method for CYP27a1 was used. With exception of the
precolumns, the chromatographical conditions and analytical column used were the same as in
Figure 24.
To more closely compare the commercial precolumn with the silica-based monolithic column,
following parameters were assessed: stability in retention time, peak width, peak area and

69
peak intensity. The results of this investigation are illustrated in the plots in Figure 30. The
retention times were stable for three injections for both precolumns, but the retention time
was shorter for the monolith column. A short retention time, without compromising the
separation and detection is preferable. The peak width is smaller for the in-house prepared
column and this is consistent with the shorter retention times for the column. A smaller peak
width provides a better chromatographic separation and is always a goal with liquid
chromatography. The consistency for each injection, regarding shape, confirms the stability of
the columns, also observed for the retention times. The intensities differ a bit more, but this
could be due to the spray (stability, ion suppression) or the amount of ions the MS were able
to trap within the 500 ms it was allowed to collect ions. This should be dealt with at a later
stage when the method is used for quantitative purposes, e.g. with internal standards, but was
not a concern at this stage. The commercial column shoved an increased signal intensity
compared to the in-house column. Especially for low abundant proteins, as CYP27a1, the
recovery (amount of analyte detected compared to analyte injected) is important. A drop in
intensity could make the difference in detection or no detection when concentration is low.
The peak area is a result of the peak width and peak intensity and is only shown to confirm
this correlation. As the commercial column gave higher peak width and peak intensity it
should provide higher peak area, as it does.

70
Figure 30 Plot of the comparison of a commercial precolumn with an in-house produced silica
monolithic column. The sample was injected three times for each column, indicated by the white dots.
Each dot represents the average values for all six CYP27a1 fragments in the same replicate. The black
line indicates the average value of the column.
Based on the intensities, the commercial column should be the optimal choice as CYP27a1 is
a low abundant protein. However, if an adequate sample preparation step could be established
0
2
4
6
8
10
12
14
Commersial In-house
Me
asu
rem
en
t (u
nit
s)
Retention time
0
20000
40000
60000
80000
100000
120000
140000
160000
180000
200000
Commersial In-house
Me
asu
rem
en
t (u
nit
s)
Area
0
1000
2000
3000
4000
5000
6000
7000
8000
9000
10000
Commersial In-house
Me
asu
rem
en
t (u
nit
s)
Intensity
0
2
4
6
8
10
12
14
16
Commersial In-houseM
ea
sure
me
nt
(un
its)
Peak width

71
for CYP27a1, e.g. the IP which is proven to work for beta-catenin, the in house column is a
preferred choice. It provides both shorter retention times and peak width, and the cost-savings
by using an in-house produced column is substantial compared to buying a commercial
column. At this stage, choosing the in-house column will affect the detection of CYP27a1 due
to lower intensities. However the in-house column was chosen for the further investigations
due to better chromatography and lower cost.
Thus, the in-house produced silica-based C8 monolithic precolumn was used in further
investigations.
6.6.3 Detection of CYP27a1 in cell samples
To evaluate the final method, two MDA-MB-231 cell samples with different sample
preparation were investigated by targeted LC-MS; one CYP27a1 IP sample prepared by the
established procedure for beta-catenin (Figure 25) , and one SDS-PAGE sample (no other
sample treatment in prior).
MDA-MB-231 SDS-PAGE samples
For the gel-only sample, three gel lanes were combined before in-gel digestion to increase the
CYP27a1 amount (figure). The LC-MS chromatograms with corresponding mass spectra are
shown in Figure 31.

72
Figure 31A-B) LC-MS chromatograms of CYP27a1 in MDA-MB-231 gel samples.
The three fragments for the signature peptides A) ATGAPGAGPGVR and B) SIPEDTVTFVR are
extracted in the chromatograms. In A, the peak corresponding to the fragment is marked with an
arrow. C) The mass spectrum for ATGAPGAGPGVR. D) The mass spectrum for SIPEDTVTFVR. The
corresponding m/z values for the fragments are marked with a star. The PRM method for CYP27a1
and the silica-based C8 monolithic precolumn were used. The analytical column and the LC
conditions were the same as in Figure 24.

73
Two of the signature peptides SIPEDTVTFVR and ATGAPGAGPGVR were detected in
MDA-MB-231 cell samples, by tMS/MS. The detections were based on the three fragments
previously described (Table 5). The gel sample was injected six times to evaluate the
repeatability, and the retention times were stable, with less than 2 % in relative standard
deviation for both peptides. For each injection the peptides increased some in retention time,
but this could be due to the analytical column, which had not been tested for many-injection
stability [88]. For the ATGAPGAGPGVR target m/z, more intensive peaks occurred in the
chromatograms, but they did not co-elute with the targeted peptide, and could hence be
ignored. Sharp, intense peaks occurred for SIPEDTVTFVR, with less tailing than previously
observed. For both peptides the fragment m/z were observed in the mass spectra (marked with
a star in Figure 31C and D).
The number of points per peak for ATGAPGAGPGV in the gel samples (Figure 32A) did not
exceed the number of 8-10 points required for quantitative determination [99-101] (the
number of points are discussed, and some also require up to 20-30 points per peak [102,
103]), but identification could be made due to robustness in retention time. The
SIPEDTVTFVR peaks achieved adequate points per peak (Figure 32B). In the PRM method,
the injection time (amount of time the MS collects ions before it scans) was set to 500 ms in
order to obtain enough ions for detection. This, in addition to that MS scheduling was not set
and the MS looked for all three signature peptide precursor ions throughout the entire
gradient, loss of ions is a potential risk. To achieve more points per peak, a MS scheduling
could be implemented in the PRM method, defining the retention time window for each
peptide. This enables the MS to only look for one analyte ion at a time (if the analytes are
separated) removing the risk of loss of ions because the MS is “busy” collecting or scanning
another ion. The injection time could also be lowered, but for low-abundant analytes this
could affect the detection (as fewer ions are collected before scanning). The last peptide
(LLKPAEAALYTDAFNEVIDDFMTR) was not detected.

74
Figure 32 Chromatographic peaks presented as sticks (Thermo termination) for A)
ATGAPGAGPGVR and B) SIPEDTVTFVR in a MDA-MB-231 gel sample. The peaks are extracted
without the use of peak smoothing, and illustrated as sticks in order to evaluate the number of points
achieved for each fragment peak. The MS and chromatographic conditions used was the same as in
Figure 31.
Thus, CYP27a1 was identified in MDA-MB-231 samples, prepared by SDS-PAGE.
HEK293 IP samples
Even though the WB did not provide detection of CYP27a1 in IP samples, it was of interest to
investigate the IP samples by the LC-MS method. The H 2 and H 2 ON samples from Figure
22 were, after further preparations (Figure 25), analysed once each by LC-MS (tMS/MS-
mode). A HEK293 IP sample was used instead of the MDA-MB-231 IP sample because the
former IP investigations were for the mostly performed using HEK293 cells. In the WB
performed for these samples (Figure 22D) the H 2 ON sample, which is the cell lysate from
the overnight incubation in the IP procedure, gave a CYP27a1 band, while CYP27a1 was not
detected in the H 2 sample (the citric acid extract in the IP procedure). When analysed by LC-
MS however, the opposite results was found; CYP27a1 was detected in the H 2 sample but
not in the H 2 ON sample. Chromatograms and mass spectra for SIPEDTVTFVR are shown
in Figure 33. No peaks were achieved for ATGAPGAGPGVR, and the CYP27a1 detection
was only based on one peptide. As the identification was the opposite of those achieved by
WB, only one peptide was identified and only one injection was performed on the gel sample,
no final conclusion could be made for the CYP27a1 IP method. These findings should be re-
investigated.

75
Figure 33 Chromatogram of CYP27a1 signature peptides (A) with mass spectra for
SIPEDTVTFVR (B) in a HEK293 CYP27a1 IP sample. The sample is prepared according to the
established IP method for beta-catenin, including IP, SDS-PAGE, in-gel digestion and SPE. The PRM
method for CYP27a1 (with retention time window implemented) and the silica-based C8 monolithic
precolumn were used. The analytical column and the LC conditions were the same as in Figure 24
Thus, CYP27a1 was detected by LC-MS in IP-CYP27a1 antibody gel samples in preliminary
investigations.

76
The choice of the signature peptides chosen in this thesis could be discussed, and
implementing more signature peptides in the method could be performed, e.g. also using the
signature peptides established by other researchers [72]. However, SIPEDTVTFVR and
ATGAPGAGPGVR ensured a specific detection of CYP27a1, which were the goal of this
thesis.
6.7 Can an analytical chemist help? My personal
view on analytical biology.
A large part of this master thesis was performed using biological experiments in a biology lab.
In order to be fully able to assess a workflow when analysing biological samples, an operator
should be familiar with all aspects of the sample preparation. The production of cells, the
sample clean-up procedures, and knowledge of which reagents are used throughout the
process is of important to be able to fully investigate how to determine a biological analyte,
e.g. a protein. Reagents applied in biological experiments e.g. detergents may mismatch with
LC-MS instrumentation.
This experience, working with analytical biology and biological experiments has enabled me
to see what biology can learn from an analytical chemist. A method development including
validation, for LC-MS determination of a protein is time consuming, but ensures
reproducibility. In biology they are dependant of reagents produced in living organisms which
are prone to reproducibility issues, compared to that of synthetically produced chemicals in
analytical chemistry. For example with an antibody, used for detection e.g. in WB, the
performance may differ between the producers, and even between batches. Therefore, an
antibody should be validated throurogly (e.g. by analysing protein knock-down samples
compared to untreated samples) at every lab, and every time a new antibody is bought. This,
however, is often not performed and the reproducibility is by that not secured. So even though
the LC-MS validation is time consuming, the method developed could be much more robust
between labs and chemical batches used.
In addition, the use of actin as a loading control is discussed [104-112]; calibration of the
entire method is not provided, compared to that of analytical chemistry. It may be difficult to
calibrate the method when working with e.g. cell culturing, but therefore the outputs (e.g. cell
counting and WB protein comparisons) should be handled with more care. Loss of analyte
during sample preparation is not measured accurately, and this also affect the robustness of

77
the determination, e.g. repeatability and reproducibility [42]. By implementing a “real”
internal standard (not e.g. actin) and using that to determine the amount of analyte by
calculations, the subjective “it seems to be a little less black” when evaluating WBs could be
removed. A comparison of cell samples using LC-MS could be performed by metabolic
labelling, e.g. stable isotope labeling with amino acids in cell culture (SILAC) [113-115].

78

79
7 Conclusion
The cytochrome P450 enzyme CYP27a1 was detected in MDA-MD-231 cell samples by a
nano LC-MS/MS system using SDS-PAGE and subsequent in-gel digestion as sample
preparation. The three peptides LLKPAEAALYTDAFNEVIDDFMTR, ATGAPGAGPGV
and SIPEDTVTFVR were chosen as signature peptides and implemented in the PRM method
for CYP27a1. Three fragment ions were identified for ATGAPGAGPGV and
SIPEDTVTFVR, providing a specific detection of CYP27a1. The former peptide also
provided adequate data for quantification. An in-house produced silica-based monolithic C8
column was assessed to be an optimal choice for the LC-MS analysis. Immunoprecipitation
was investigated for enrichment of CYP27a1 prior to LC-MS analysis. This was not
established for extraction of CYP27a1, but the method was successful targeting beta-catenin,
hence proving the use of immunoprecipitation as an enrichment step prior to LC-MS analysis.
Following establishment and validation of the LC-MS CYP27a1 method, e.g. sample
stability, implementing an internal standard and robustness, this method could be a future tool
for quantification of CYP27a1, enabling the study of CYP27a1 as a possible biomarker for
ER+-breast cancer.

80
7.1 Future of the work
When a sample preparation method and a LC-MS method for quantification of CYP27a1 in
cell samples is established and validated (e.g. internal standard is added and robustness is
evaluated) the MCF7 cell line should be investigated as it is ER+, and knowledge of accurate
levels of CYP27a1 are needed for an evaluation of the potential of CYP27a1 as an ER+-breast
cancer biomarker. The CYP27a1 levels in macrophages and their correspondence to breast
cancer should also be addressed.

81
8 References
1. Cancer statistics: Number of new cases by primary site and sex - 2014 (18.04.16).
2. Kreftregisteret, Fakta om kreft (sited 25.04.16) http://www.kreftregisteret.no/no/Generelt/Fakta-om-kreft-test/.
3. Roman, M., R.A. Hubbard, S. Sebuodegard, D.L. Miglioretti, X. Castells, and S.
Hofvind, The cumulative risk of false-positive results in the Norwegian Breast Cancer Screening Program: Updated results. Cancer, 119(2013)3952-3958
4. Román, M., X. Castells, S. Hofvind, and M. Von Euler-Chelpin, Risk of breast cancer after false-positive results in mammographic screening. Cancer Medicine, (2016)[doi: 10.1258/jms.2012.012083]
5. Dusell, C.D., M. Umetani, P.W. Shaul, D.J. Mangelsdorf, and D.P. Mcdonnell, 27-hydroxycholesterol is an endogenous selective estrogen receptor modulator.
Molecular Endocrinology, 22(2008)65-77 6. Umetani, M., H. Domoto, A.K. Gormley, I.S. Yuhanna, C.L. Cummins, N.B. Javitt,
K.S. Korach, P.W. Shaul, and D.J. Mangelsdorf, 27-Hydroxycholesterol is an
endogenous SERM that inhibits the cardiovascular effects of estrogen. Nature Medicine, 13(2007)1185-1192
7. Norway, T.R.C.O., Research-based avaluation of the Norwegian Breast Cancer Screening Program - Final report. 2015.
8. Iuliano, L., Pathways of cholesterol oxidation via non-enzymatic mechanisms.
Chemistry and Physics of Lipids, 164(2011)457-468 9. Bergström, S. and O. Wintersteiner, Autoxidation of sterols in colloidal aqueous
solution. The nature of the products formed from cholesterol. Journal of Biological Chemistry, 141(1941)567-610
10. Björkhem, I. and U. Diczfalusy, Oxysterols: Friends, Foes, or Just Fellow
Passengers? Arteriosclerosis, Thrombosis, and Vascular Biology, 22(2002)734-742 11. Russell, D.W., Oxysterol biosynthetic enzymes. Biochimica et Biophysica Acta (BBA)
- Molecular and Cell Biology of Lipids, 1529(2000)126-135 12. Nachtergaele, S., L.K. Mydock, K. Krishnan, J. Rammohan, P.H. Schlesinger, D.F.
Covey, and R. Rohatgi, Oxysterols are allosteric activators of the oncoprotein
Smoothened. Nature Chemical Biology, 8(2012)211-220 13. Dwyer, J.R., N. Sever, M. Carlson, S.F. Nelson, P.A. Beachy, and F. Parhami,
Oxysterols are novel activators of the hedgehog signaling pathway in pluripotent mesenchymal cells. Journal of Biological Chemistry, 282(2007)8959-8968
14. Roberg-Larsen, H., M.F. Strand, S. Krauss, and S.R. Wilson, Metabolites in vertebrate
Hedgehog signaling. Biochemical and Biophysical Research Communications, 446(2014)669-674
15. Jiang, J. and C.-C. Hui, Hedgehog signaling in development and cancer. Developmental cell, 15(2008)801-812
16. Mullor, J.L., P. Sánchez, and A.R.I. Altaba, Pathways and consequences: Hedgehog
signaling in human disease. Trends in Cell Biology, 12(2002)562-569 17. Fakheri, R.J. and N.B. Javitt, 27-Hydroxycholesterol, does it exist? On the
nomenclature and stereochemistry of 26-hydroxylated sterols. Steroids, 77(2012)575-577
18. Nelson, E.R., S.E. Wardell, J.S. Jasper, S. Park, S. Suchindran, M.K. Howe, N.J.
Carver, R.V. Pillai, P.M. Sullivan, V. Sondhi, M. Umetani, J. Geradts, and D.P. Mcdonnell, 27-Hydroxycholesterol links hypercholesterolemia and breast cancer
pathophysiology. Science, 342(2013)1094-1098

82
19. Wu, Q., T. Ishikawa, R. Sirianni, H. Tang, J.G. Mcdonald, I.S. Yuhanna, B. Thompson, L. Girard, C. Mineo, R.A. Brekken, M. Umetani, D.M. Euhus, Y. Xie, and P.W. Shaul, 27-Hydroxycholesterol promotes cell-autonomous, ER-positive breast
cancer growth. Cell Reports, 5(2013)637-645 20. Phimister, E.G., M. Warner, and J.-A. Gustafsson, On estrogen, cholesterol
metabolism, and breast cancer. New England Journal of Medicine, 370(2014)572-573 21. Roberg-Larsen, H., K. Lund, T. Vehus, N.T. Solberg, C. Vesterdal, D. Misaghian,
P.A. Olsen, S. Krauss, S.R. Wilson, and E. Lundanes, Highly automated nanoLC-MS-
based approach for thousand cell scale quantification of side chain-hydroxylated oxysterols. Journal of Lipid Research, 55(2014)1531-1536
22. Cali, J.J. and D.W. Russell, Characterization of human sterol 27-hydroxylase. A mitochondrial cytochrome P-450 that catalyzes multiple oxidation reaction in bile acid biosynthesis. Journal of Biological Chemistry, 266(1991)7774-7778
23. Bjorkhem, I., Mechanism of degradation of the steroid side chain in the formation of bile acids. Journal of Lipid Research, 33(1992)455-471
24. Björkhem, I., Chapter 9 Mechanism of bile acid biosynthesis in mammalian liver, in: Henry, D. and S. Jans (Eds.) New Comprehensive Biochemistry, Elsevier, Amsterdam, The Netherlands 1985, pp. 231-278
25. Björkhem, I., O. Andersson, U. Diczfalusy, B. Sevastik, R.J. Xiu, C. Duan, and E. Lund, Atherosclerosis and sterol 27-hydroxylase: evidence for a role of this enzyme in
elimination of cholesterol from human macrophages. Proceedings of the National Academy Sciences of the United States of America, 91(1994)8592-8596
26. Nusslein-Volhard, C. and E. Wieschaus, Mutations affecting segment number and
polarity in Drosophila. Nature, 287(1980)795-801 27. Briscoe, J. and P.P. Therond, The mechanisms of Hedgehog signalling and its roles in
development and disease. Nature Reviews Molecular Cell Biology, 14(2013)416-429
28. Amakye, D., Z. Jagani, and M. Dorsch, Unraveling the therapeutic potential of the Hedgehog pathway in cancer. Nature Methods, 19(2013)1410-1422
29. Gooley, A.A., G. Hughes, I. Humphery-Smith, K.L. Williams, and D.F. Hochstrasser, From Proteins to Proteomes: Large Scale Protein Identification by Two—Dimensional Electrophoresis and Amino Acid Analysis. Biotechnology, 14(1996)61-
65 30. Wasinger, V.C., S.J. Cordwell, A. Cerpa-Poljak, J.X. Yan, A.A. Gooley, M.R.
Wilkins, M.W. Duncan, R. Harris, K.L. Williams, and I. Humphery-Smith, Progress with gene-product mapping of the Mollicutes: Mycoplasma genitalium. Electrophoresis, 16(1995)1090-1094
31. Wilkins, M.R., J.-C. Sanchez, A.A. Gooley, R.D. Appel, I. Humphery-Smith, D.F. Hochstrasser, and K.L. Williams, Progress with proteome projects: why all proteins
expressed by a genome should be identified and how to do it. Biotechnology and Genetic Engineering Reviews, 13(1996)19-50
32. Anderson, N.L. and N.G. Anderson, Proteome and proteomics: new technologies, new
concepts, and new words. Electrophoresis, 19(1998)1853-1861 33. Blackstock, W.P. and M.P. Weir, Proteomics: quantitative and physical mapping of
cellular proteins. Trends in Biotechnology, 17(1999)121-127 34. Method of the Year 2012. Nature Methods, 10(2013)1-1 35. Doerr, A., Mass spectrometry-based targeted proteomics. Nature Methods,
10(2013)23-23 36. Engvall, E. and P. Perlmann, Enzyme-linked immunosorbent assay (ELISA)
quantitative assay of immunoglobulin G. Immunochemistry, 8(1971)871-874 37. Towbin, H., T. Staehelin, and J. Gordon, Electrophoretic transfer of proteins from
polyacrylamide gels to nitrocellulose sheets: procedure and some applications.

83
Proceedings of the National Academy of Sciences of the United States of America, 76(1979)4350-4354
38. Vacík, J., Chapter 1 Theory of Electromigration Processes, in: Deyl, Z.s (Eds.)
Journal of Chromatography Library, Elsevier, 1979, pp. 1-21 39. Chrambach, A. and D. Rodbard, Polyacrylamide gel electrophoresis. Science,
172(1971)440-451 40. Rodbard, D. and A. Chrambach, Unified theory for gel electrophoresis and gel
filtration. Proceedings of the National Academy of Sciences, 65(1970)970-977
41. Mangru, S.D. and D.J. Harrison, Chemiluminescence detection in integrated post-separation reactors for microchip-based capillary electrophoresis and affinity
electrophoresis. Electrophoresis, 19(1998)2301-2307 42. Baker, M., Reproducibility crisis: Blame it on the antibodies. Nature, 521(2015)274-
276
43. Schroeder Jr, H.W. and L. Cavacini, Structure and function of immunoglobulins. Journal of Allergy and Clinical Immunology, 125(2010)41-52
44. Hill, R.L., R. Delaney, R.E. Fellows, and H.E. Lebovitz, The evolutionary origins of the immunoglobulins. Proceedings of the National Academy of Sciences, 56(1966)1762-1769
45. Makarov, A., Electrostatic Axially Harmonic Orbital Trapping: A High-Performance Technique of Mass Analysis. Analytical Chemistry, 72(2000)1156-1162
46. Michalski, A., E. Damoc, J.-P. Hauschild, O. Lange, A. Wieghaus, A. Makarov, N. Nagaraj, J. Cox, M. Mann, and S. Horning, Mass spectrometry-based proteomics using Q Exactive, a high-performance benchtop quadrupole Orbitrap mass
spectrometer. Molecular & Cellular Proteomics, 10(2011)[doi: 10.1074/mcp.M1111.011015]
47. Peterson, A.C., J.D. Russell, D.J. Bailey, M.S. Westphall, and J.J. Coon, Parallel
Reaction Monitoring for High Resolution and High Mass Accuracy Quantitative, Targeted Proteomics. Molecular & Cellular Proteomics, 11(2012)1475-1488
48. Catherman, A.D., O.S. Skinner, and N.L. Kelleher, Top Down proteomics: facts and perspectives. Biochemical and Biophysical Research Communications, 445(2014)683-693
49. Steen, H. and M. Mann, The abc's (and xyz's) of peptide sequencing. Nature Reviews Molecular Cell Biology, 5(2004)699-711
50. Olsen, J.V., S.-E. Ong, and M. Mann, Trypsin cleaves exclusively C-terminal to arginine and lysine residues. Molecular & Cellular Proteomics, 3(2004)608-614
51. Liebler, D.C. and L.J. Zimmerman, Targeted quantitation of proteins by mass
spectrometry. Biochemistry, 52(2013)3797-3806 52. Ferry, G., C. Ubeaud, P. Lambert, S. Bertin, F. Cogé, P. Chomarat, P. Delagrange, B.
Serkiz, J. Bouchet, and R. Truscott, Molecular evidence that melatonin is enzymatically oxidized in a different manner than tryptophan: investigations with both indoleamine 2, 3-dioxygenase and myeloperoxidase. Biochemical Journal,
388(2005)205-215 53. PeptideAtlas (03.05.16) http://www.peptideatlas.org.
54. Desiere, F., E.W. Deutsch, A.I. Nesvizhskii, P. Mallick, N.L. King, J.K. Eng, A. Aderem, R. Boyle, E. Brunner, S. Donohoe, N. Fausto, E. Hafen, L. Hood, M.G. Katze, K.A. Kennedy, F. Kregenow, H. Lee, B. Lin, D. Martin, J.A. Ranish, D.J.
Rawlings, L.E. Samelson, Y. Shiio, J.D. Watts, B. Wollscheid, M.E. Wright, W. Yan, L. Yang, E.C. Yi, H. Zhang, and R. Aebersold, Integration with the human genome of
peptide sequences obtained by high-throughput mass spectrometry. Genome Biology, 6(2004)1-12

84
55. Deutsch, E.W., H. Lam, and R. Aebersold, PeptideAtlas: a resource for target selection for emerging targeted proteomics workflows. EMBO reports, 9(2008)429-434
56. Martens, L., H. Hermjakob, P. Jones, M. Adamski, C. Taylor, D. States, K. Gevaert, J. Vandekerckhove, and R. Apweiler, PRIDE: The proteomics identifications database.
Proteomics, 5(2005)3537-3545 57. PRIDE (11.05.16) https://www.ebi.ac.uk/pride/archive/. 58. The ESP-predictor (03.05.16)
http://www.broadinstitute.org/cancer/software/genepattern/esppredictor. 59. Fusaro, V.A., D.R. Mani, J.P. Mesirov, and S.A. Carr, Prediction of high-responding
peptides for targeted protein assays by mass spectrometry. Nature Biotechnology, 27(2009)190-198
60. SKYLINE (03.05.16) http://skyline.maccosslab.org
61. Maclean, B., D.M. Tomazela, N. Shulman, M. Chambers, G.L. Finney, B. Frewen, R. Kern, D.L. Tabb, D.C. Liebler, and M.J. Maccoss, Skyline: an open source document
editor for creating and analyzing targeted proteomics experiments. Bioinformatics, 26(2010)966-968
62. Iribarne, J.V. and B.A. Thomson, On the evaporation of small ions from charged
droplets. The Journal of Chemical Physics, 64(1976)2287-2294 63. Dole, M., L.L. Mack, R.L. Hines, R.C. Mobley, L.D. Ferguson, and M.B. Alice,
Molecular Beams of Macroions. The Journal of Chemical Physics, 49(1968)2240-2249
64. Wilm, M. and M. Mann, Analytical Properties of the Nanoelectrospray Ion Source.
Analytical Chemistry, 68(1996)1-8 65. Schmidt, A., M. Karas, and T. Dülcks, Effect of different solution flow rates on
analyte ion signals in nano-ESI MS, or: when does ESI turn into nano-ESI? Journal of
the American Society for Mass Spectrometry, 14(2003)492-500 66. Wilson, S.R., T. Vehus, H.S. Berg, and E. Lundanes, Nano-LC in proteomics: recent
advances and approaches. Bioanalysis, 7(2015)1799-1815 67. Aebersold R, B.A., Bradshaw Ra, Western Blots versus Selected Reaction Monitoring
Assays: Time to Turn the Tables? Molecular & Cellular Proteomics, 12(2013)2381-
2382 68. Quinn, C.M., W. Jessup, J. Wong, L. Kritharides, and Andrew j. Brown, Expression
and regulation of sterol 27-hydroxylase (CYP27A1) in human macrophages: a role for RXR and PPARγ ligands. Biochemical Journal, 385(2005)823-830
69. Von Bahr, S., T. Movin, N. Papadogiannakis, I. Pikuleva, P. Rönnow, U. Diczfalusy,
and I. Björkhem, Mechanism of Accumulation of Cholesterol and Cholestanol in Tendons and the Role of Sterol 27-hydroxylase (CYP27A1). Arteriosclerosis,
Thrombosis, and Vascular Biology, 22(2002)1129-1135 70. Araya, Z., W. Tang, and K. Wikvall, Hormonal regulation of the human sterol 27-
hydroxylase gene CYP27A1. Biochemical Journal, 372(2003)529-534
71. Shanahan, C.M., K.L.H. Carpenter, and N.R.B. Cary, A potential role for sterol 27-hydroxylase in atherogenesis. Atherosclerosis, 154(2001)269-276
72. Liao, W.-L., G.-Y. Heo, N.G. Dodder, R.E. Reem, N. Mast, S. Huang, P.L. Dipatre, I.V. Turko, and I.A. Pikuleva, Quantification of Cholesterol-Metabolizing P450s CYP27A1 and CYP46A1 in Neural Tissues Reveals a Lack of Enzyme−Product
Correlations in Human Retina but Not Human Brain. Journal of Proteome Research, 10(2011)241-248
73. Soule, H.D., J. Vazquez, A. Long, S. Albert, and M. Brennan, A Human Cell Line From a Pleural Effusion Derived From a Breast Carcinoma. Journal of the National Cancer Institute, 51(1973)1409-1416

85
74. Mccutchan, J.H. and J.S. Pagano, Enhancement of the infectivity of simian virus 40 deoxyribonucleic acid with diethylaminoethyl-dextran. Journal of the National Cancer Institute, 41(1968)351-357
75. Vaheri, A. and J.S. Pagano, Infectious poliovirus RNA: a sensitive method of assay. Virology, 27(1965)434-436
76. Kim, T.K. and J.H. Eberwine, Mammalian cell transfection: the present and the future. Analytical and Bioanalytical Chemistry, 397(2010)3173-3178
77. Hopp, T.P., K.S. Prickett, V.L. Price, R.T. Libby, C.J. March, D. Pat Cerretti, D.L.
Urdal, and P.J. Conlon, A Short Polypeptide Marker Sequence Useful for Recombinant Protein Identification and Purification. Nature Biotechnology, 6(1988)1204-1210
78. Einhauer, A. and A. Jungbauer, The FLAG™ peptide, a versatile fusion tag for the purification of recombinant proteins. Journal of Biochemical and Biophysical Methods, 49(2001)455-465
79. Kaboord, B. and M. Perr, Isolation of proteins and protein complexes by immunoprecipitation, in: Posch, A.s (Eds.) Methods in Molecular Biology, Humana
Press Inc., Totowa, NJ, USA, 2008, pp. 349-364 80. Lindmark, R., K. Thorén-Tolling, and J. Sjöquist, Binding of immunoglobulins to
protein A and immunoglobulin levels in mammalian sera. Journal of Immunological
Methods, 62(1983)1-13 81. Björck, L. and G. Kronvall, Purification and some properties of streptococcal protein
G, a novel IgG-binding reagent. The Journal of Immunology, 133(1984)969-974 82. Fahnestock, S.R., P. Alexander, J. Nagle, and D. Filpula, Gene for an
immunoglobulin-binding protein from a group G streptococcus. Journal of
Bacteriology, 167(1986)870-880 83. Laemmli, U.K., Cleavage of Structural Proteins during the Assembly of the Head of
Bacteriophage T4. Nature, 227(1970)680-685
84. Righetti, P.G. and G. Candiano, Recent advances in electrophoretic techniques for the characterization of protein biomolecules: A poker of aces. Journal of Chromatography
A, 1218(2011)8727-8737 85. Shapiro, A.L., E. Viñuela, and J. V. Maizel, Molecular weight estimation of
polypeptide chains by electrophoresis in SDS-polyacrylamide gels. Biochemical and
Biophysical Research Communications, 28(1967)815-820 86. Smetop, T., Silica-based monolithic pre-concentration columns in miniaturized liquid
chromatography. (Master thesis), 2016, Department of Chemistry, University of Oslo, Oslo
87. Vehus, T., H. Roberg-Larsen, J. Waaler, S. Aslaksen, B. Thiede, T.H. Dale, S. Krauss,
E. Lundanes, and S.R. Wilson, Advancing the field of versatile, sensitive liquid chromatography mass spectrometry – Implementation of 10 µm open tubular columns
suitable for small molecules, lipids, peptides and proteins. Manuscript in progress, 88. Berg, H.S., Optimization of in-house packing of nano liquid chromatography columns.
A fast, simple and low-cost packing procedure for making good performance nano
liquid chromatography columns. (Master thesis), 2016, Department of Chemistry, University of Oslo, Oslo
89. Roberg-Larsen, H., K. Lund, K.E. Seterdal, S. Solheim, T. Vehus, N. Solberg, S. Krauss, E. Lundanes, and S.R. Wilson, Mass spectrometric detection of 27-hydroxycholesterol in breast cancer exosomes. Journal of Steroid Biochemistry and
Molecular Biology, (2016)[doi: 10.1016/j.jsbmb.2016.1002.1006] 90. Loo, R.R., N. Dales, and P.C. Andrews, The effect of detergents on proteins analyzed
by electrospray ionization. Methods in Molecular Biology, 61(1996)141-160

86
91. Loo, R.R.O., N. Dales, and P.C. Andrews, Surfactant effects on protein structure examined by electrospray ionization mass spectrometry. Protein Science, 3(1994)1975-1983
92. Mandal, M.K., L.C. Chen, Z. Yu, H. Nonami, R. Erra-Balsells, and K. Hiraoka, Detection of protein from detergent solutions by probe electrospray ionization mass
spectrometry (PESI-MS). Journal of Mass Spectrometry, 46(2011)967-975 93. Rundlett, K.L. and D.W. Armstrong, Mechanism of Signal Suppression by Anionic
Surfactants in Capillary Electrophoresis−Electrospray Ionization Mass Spectrometry.
Analytical Chemistry, 68(1996)3493-3497 94. Speicher, K., O. Kolbas, S. Harper, and D. Speicher, Systematic analysis of peptide
recoveries from in-gel digestions for protein identifications in proteome studies. Journal of biomolecular techniques: JBT, 11(2000)74
95. Roberg-Larsen, H., M.F. Strand, A. Grimsmo, P.A. Olsen, J.L. Dembinski, F. Rise, E.
Lundanes, T. Greibrokk, S. Krauss, and S.R. Wilson, High sensitivity measurements of active oxysterols with automated filtration/filter backflush-solid phase extraction-
liquid chromatography-mass spectrometry. Journal of Chromatography A, 1255(2012)291-297
96. Vehus, T., K.E. Seterdal, S. Krauss, E. Lundanes, and S.R. Wilson, Comparison of
commercial nanoliquid chromatography columns for fast, targeted mass spectrometry-based proteomics. Future Science OA, (2016)[doi:10.4155/fsoa-2016-
0014] 97. Picotti, P. and R. Aebersold, Selected reaction monitoring-based proteomics:
workflows, potential, pitfalls and future directions. Nature Methods, 9(2012)555-566
98. Omasits, U., C.H. Ahrens, S. Muller, and B. Wollscheid, Protter: interactive protein feature visualization and integration with experimental proteomic data. Bioinformatics, 30(2014)884-886
99. Lange, V., P. Picotti, B. Domon, and R. Aebersold, Selected reaction monitoring for quantitative proteomics: a tutorial. Molecular Systems Biology, 4(2008)[doi:
10.1038/msb.2008.1061] 100. Steuer, A.E., M. Poetzsch, M. Koenig, E. Tingelhoff, S.N. Staeheli, A.T. Roemmelt,
and T. Kraemer, Comparison of conventional liquid chromatography–tandem mass
spectrometry versus microflow liquid chromatography–tandem mass spectrometry within the framework of full method validation for simultaneous quantification of 40
antidepressants and neuroleptics in whole blood. Journal of Chromatography A, 1381(2015)87-100
101. Dallüge, J., R.J. Vreuls, D.J. Van Iperen, M. Van Rijn, and U.a.T. Brinkman,
Resistively heated gas chromatography coupled to quadrupole mass spectrometry. Journal of Separation Science, 25(2002)608-614
102. Dyson, N., Peak distortion, data sampling errors and the integrator in the measurement of very narrow chromatographic peaks. Journal of Chromatography A, 842(1999)321-340
103. Van Deursen, M.M., J. Beens, H.G. Janssen, P.A. Leclercq, and C.A. Cramers, Evaluation of time-of-flight mass spectrometric detection for fast gas chromatography.
Journal of Chromatography A, 878(2000)205-213 104. Aldridge, G.M., D.M. Podrebarac, W.T. Greenough, and I.J. Weiler, The use of total
protein stains as loading controls: An alternative to high-abundance single-protein
controls in semi-quantitative immunoblotting. Journal of Neuroscience Methods, 172(2008)250-254
105. Dang, W. and L. Sun, Determination of internal controls for quantitative real time RT-PCR analysis of the effect of Edwardsiella tarda infection on gene expression in turbot (Scophthalmus maximus). Fish & Shellfish Immunology, 30(2011)720-728

87
106. Dittmer, A. and J. Dittmer, Beta-actin is not a reliable loading control in Western blot analysis. Electrophoresis, 27(2006)2844-2845
107. Eaton, S.L., S.L. Roche, M. Llavero Hurtado, K.J. Oldknow, C. Farquharson, T.H.
Gillingwater, and T.M. Wishart, Total Protein Analysis as a Reliable Loading Control for Quantitative Fluorescent Western Blotting. PLoS ONE, 8(2013)e72457
108. Ferguson, R.E., H.P. Carroll, A. Harris, E.R. Maher, P.J. Selby, and R.E. Banks, Housekeeping proteins: A preliminary study illustrating some limitations as useful references in protein expression studies. Proteomics, 5(2005)566-571
109. Gilda, J.E. and A.V. Gomes, Stain-Free total protein staining is a superior loading control to β-actin for Western blots. Analytical Biochemistry, 440(2013)186-188
110. Lanoix, D., J. St-Pierre, A.A. Lacasse, M. Viau, J. Lafond, and C. Vaillancourt, Stability of reference proteins in human placenta: General protein stains are the benchmark. Placenta, 33(2012)151-156
111. Rocha-Martins, M., B. Njaine, and M.S. Silveira, Avoiding Pitfalls of Internal Controls: Validation of Reference Genes for Analysis by qRT-PCR and Western Blot
throughout Rat Retinal Development. PLoS ONE, 7(2012)e43028 112. Taylor, S.C., T. Berkelman, G. Yadav, and M. Hammond, A Defined Methodology for
Reliable Quantification of Western Blot Data. Molecular Biotechnology,
55(2013)217-226 113. Mann, M., Functional and quantitative proteomics using SILAC. Nature Reviews
Molecular Cell Biology, 7(2006)952-958 114. Ong, S.-E., B. Blagoev, I. Kratchmarova, D.B. Kristensen, H. Steen, A. Pandey, and
M. Mann, Stable isotope labeling by amino acids in cell culture, SILAC, as a simple
and accurate approach to expression proteomics. Molecular & Cellular Proteomics, 1(2002)376-386
115. Ong, S.-E. and M. Mann, A practical recipe for stable isotope labeling by amino acids
in cell culture (SILAC). Nature Protocols, 1(2007)2650-2660

88

89
9 Appendix
9.1 Additional background
9.1.1 Cell culturing
How to grow cells
When working with cells, it must take place in a hood that provides sterile conditions. Cells
are easily exposed to contaminations (e.g. bacteria) that affect cell behavior or also could
cause cell death. A cell growth medium is used to provide the cells with necessary nutrition,
and which medium used is dependent on cell type. Cells are kept in an incubator maintained
at 37 ℃ and with 5 % CO2, conditions that are supposed to replicate cells natural
environment. When growing cells in a lab, different conditions could be altered to study a
cells behavior, or to simply optimize cell growth; pH, concentrations of components such as
glucose or phenol red, and the addition of growth factors or other additives. The growth
factors stimulate the cellular growth, and fetal bovine serum (FBS) is the most used.
Cell culture passaging
In order to make working cell stocks, frozen cells that could be grown further, cells must be
frozen in liquid nitrogen in growth media containing 5-10 % of dimethyl sulfoxide (DMSO).
By adding DMSO, a slower cooling rate and a lower freezing point is obtained, reducing the
risk of cell death due to ice crystal formation.
During cell growth, cells must be closely watched in order to contain optimal growing
conditions. When cells are confluent (confluence describes the amount of growing area the
cells cover), that they cover approximately 90 % of the growth area, they should be split
(divided). When working with adherent cells (attached to a surface) this is performed by first
loosen them from the surface they are attached to by adding a trypsin. When working with
cells grown in-suspension the trypsin is not necessary as the cells floats in the medium. A
small amount of the cells are then transferred to a new flask, and could continue to grow in
freshly added growth media.

90
9.1.2 Transfection
Producing the DNA
As DNAs are large in size, an engineered plasmid, a circular double-stranded DNA, is used in
transfection. These plasmids (vectors) are implemented into Escherichia coli (E. coli)
bacterial cells and by growing these cells, the DNA to be used in transfection is produced. See
Figure (AP) 1 for an overview. One part of the vector, the ORI, enables replication (they
duplicate during cell dividing). Without this, cells implemented with a plasmid will not
divide. The media/agar in which the bacterial cells are grown contains antibiotic, often
ampicillin. To be able to grow in this media, the vector must contain a drug-resistant-part,
meaning that this part makes the cell resistant to the antibiotic, and enables cell growth. A part
of a DNA is then inserted into this vector, which is again inserted into an E.coli cell. During
cell division the DNA, encoding for e.g. a target protein, is produced and can afterwards be
extracted from the cells and transferred into mammalian cells.

91
Figure (AP) 1 A scheme of the procedure for transformation. A recombinant DNA is incorporated
into a plasmid vector, also containing an ORI part enabling growth, and an antibiotic resistant part.
By implementing into an E.coli cell, the DNA is produced, and could later be extracted from the cell
and used in transfection.
Inserting DNA into cells
Different methods are used to transport the DNA into the cell; chemical, physical and
biological. The biological method is virus mediated, while the physical method uses physical
tools as laser or direct micro injection. Chemical transfection is most used, and is the method
used in this thesis. Here, the DNA binds to a chemical reagent that carries it across the cell

92
membrane (exact mechanism is not known). An example of a chemical reagent is calcium
phosphate.
9.2 Tables
Table (AP) 1 Components, amounts and final concentrations of NP-40 lysis buffer
1 M Tris pH 8 5 M NaCl NP-40 EDTA MQ-water
2.5 mL 1.5 mL 0.5 mL 200 µL 43.4 mL
50 mM 150 mM 1 % 2 mL
Table (AP) 2 Components, amounts and final concentrations of 5x loading buffer.
1 M tris-HCl pH 6.6
50 % Glycerol
10 % SDS
2-Mercaptoethanol
1 % Bromophenol blue
Water
0.6 mL
5 mL
2 mL
0.5 mL
1 mL
0.9 mL
60 mM
25 %
2 %
14.4 mM
0.1 %
Table (AP) 3 Components and amounts of 10 x transfer buffer.
Trizma – base
Glysin
Water
30.3 g
144.0 g
Dilute to 1000 mL

93
Table (AP) 4 Protein sequences of CYP27a1 and beta-catenin.
Protein Sequence
Beta-
catenin
MSPILGYWKIKGLVQPTRLLLEYLEEKYEEHLYERDEGDKWRNKKFELGLEFPNLPYYI
DGDVKLTQSMAIIRYIADKHNMLGGCPKERAEISMLEGAVLDIRYGVSRIAYSKDFETLK
VDFLSKLPEMLKMFEDRLCHKTYLNGDHVTHPDFMLYDALDVVLYMDPMCLDAFPKL
VCFKKRIEAIPQIDKYLKSSKYIAWPLQGWQATFGGGDHPPKSDLEVLFQGPLGSATQAD
LMELDMAMEPDRKAAVSHWQQQSYLDSGIHSGATTTAPSLSGKGNPEEEDVDTSQVLY
EWEQGFSQSFTQEQVADIDGQYAMTRAQRVRAAMFPETLDEGMQIPSTQFDAAHPTNV
QRLAEPSQMLKHAVVNLINYQDDAELATRAIPELTKLLNDEDQVVVNKAAVMVHQLSK
KEASRHAIMRSPQMVSAIVRTMQNTNDVETARCTAGTLHNLSHHREGLLAIFKSGGIPA
LVKMLGSPVDSVLFYAITTLHNLLLHQEGAKMAVRLAGGLQKM VALLNKTNVKFLAIT
TDCLQILAYGNQESKLIILASGGPQALVNIMRTYTYEKLLWTTSRVLKVLSVCSSNKPAI
VEAGGMQALGLHLTDPSQRLVQNCLWTLRNLSDAATKQEGMEGLLGTLVQLLGSDDIN
VVTCAAGILSNLTCNNYKNKMMVCQVGGIEALVRTVLRAGDREDITEPAICALRHLTSR
HQEAEMAQNAVRLHYGLPVVVKLLHPPSHWPLIKATVGLIRNLALCPANHAPLREQGAI
PRLVQLLVRAHQDTQRRTSMGGTQQQFVEGVRMEEIVEGCTGALHILARDVHNRIVIRG
LNTIPLFVQLLYSPIENIQRVAAGVLCELAQDKEAAEAIEAEGATAPLTELLHSRNEGVAT
YAAAVLFRMSEDKPQDYKKRLSVELTSSLFRTEPMAWNETADLGLDIGAQGEPLGYRQ
DDPSYRSFHSGGYGQDALGMDPMMEHEMGGHHPGADYPVDGLPDLGHAQDLMDGLP
PGDSNQLAWFDTDL
CYP27a1
KATGAPGAGPGVRRRQRSLEEIPRLGQLRFFFQLFVQGYALQLHQLQVLYKAKYGPMW
MSYLGPQMHVNLASAPLLEQVMRQEGKYPVRNDMELW KEHRDQHDLTYGPFTTEGH
HWYQLRQALNQRLLKPAEAALYTDAFNEVIDDFMTRLDQLRAESASGNQVSDMAQLF
YYFALEAICYILFEKRIGCLQRSIPEDTVTFVRSIGLMFQNSLYATFLPKWTRPVLPFWKR
YLDGWNAIFSFGKKLIDEKLEDMEAQLQAAGPDGIQVSGYLHFLLASGQLSPREAMGSL
PELLMAGVDTTSNTLTWALYHLSKDPEIQEALHEEVVGVVPAGQVPQHKDFAHMPLLK
AVLKETLRLYPVVPTNSRIIEKEIEVDGFLFPKNTQFVFCHYVVSRDPTAFSEPESFQPHR
WLRNSQPATPRIQHPFGSVPFGYGVRACLGRRIAELEMQLLLARLIQKYKVVLAPETGEL
KSVARIVLVPNKKVGLQFLQRQC
94
Table (AP) 5 Amino acid abbreviations
Abbreviation Amino acid name
A Ala Alanine
C Cys Cysteine
D Asp Aspartic acid
E Glu Glutamic acid
F Phe Phenylalanine
G Gly Glycine
H His Histidine
I Ile Isoleucine
K Lys Lysine
L Leu Leucine
M Met Methionine
N Asn Asparagine
P Pro Proline
Q Gln Glutamine
R Arg Arginine
S Ser Serine
T Thr Threonine
V Val Valine
W Trp Tryptophan
Y Tyr Tyrosine

95
Table (AP) 6 Signature peptides with m/z of corresponding precursor ions and fragments, for beta-
catenin. From [96].
Beta-catenin
peptides
Precursor
[M+2H]2+
m/z
Fragment
m/z
LLNDEDQVVVNK 693.36731 y4
+
459.2929
y7+
801.447
y8+
930.4899
y9+
1045.5161
y10+
1159.5590
HAVVNLINYQDDAELATR
681.35327
y8+
890.4222
y9+
1018.481
y10+
1181.544
y11+
1295.588
NEGVATYAAAVLFR
741.39801
y7+
747.4519
y8+
910.5156
y19+
1011.563
y10+
1082.6
ATVGLIR
365.2345
y4+
458.309
y5+
557.3776

96
Table (AP) 7 Signature peptide investigations. CYP27a1 peptides listed as highly observable in
PeptideAtlas was investigated further. In the first lane, all peptides not containing C, W or M are
marked with dark grey. In the unique-column dark grey indicates 100 % uniqueness, while light grey
indicates that the peptide matches to a certain percentage to other proteins (but not 100 % match).
White means not unique. The three lanes 1, 2 and 3 represent three CYP27a1 standard LC-MS
analysis. White colour means that the peptide was not found in proteome discoverer. Light grey
indicates that the found is inadequate (e.g. only one detected fragment ion), and dark grey indicates
adequate discovery with enough detected fragment ions for identification.
Peptide Modification
residues Unique 1 2 3
AAIPAALPSDK
ATGAPGAGPGVR
DFAHMPLLK
EIEVDGFLFPK
IAELEMQLLLAR
IVLVPNKK
LLKPAEAALYTDAFNEVIDDFMTR
NDMELWK
NSQPATPR
SIGLMFQNSLYATFLPK
SIPEDTVTFVR
VVLAPETGELK
WTRPVLPFWK
YLDGWNAIFSFGK
DPEIQEALHEEVVGVVPAGQVPQHK

97
IQHPFGSVPFGYGVR
DPTAFSEPESFQPHR
LEDMEAQLQAAGPDGIQVSGYLHFLLASGQLS
PR
DQHDLTYGPFTTEGHHWYQLR
LYPVVPTNSR
EAMGSLPELLMAGVDTTSNTLTWALYHLSK
DFAHMPLLK
VGLQFLQR
NTQFVFCHYVVSR
YGPMWMSYLGPQMHVNLASAPLLEQVMR
FFFQLFVQGYALQLHQLQVLYK
IVLVPNK
SLEEIPR
MAALGCAR
IGCLQR
AESASGNQVSDMAQLFYYFALEAICYILFEK
QALNQR
GLCPHGAR

98
Table (AP) 8 Uniprot search for peptide uniqueness for SIPEDTVTFVR and ATGAPGAGPGVR.
Peptide sequence matches, with percentage match are found by blasting in Uniprot. Average masses
are found in http://www.peptidesynthetics.co.uk/tools/.
Peptide
Uniprot of
matched
protein
%
match
SIPEDTVTFVR
sequence
Average
mass
Sequence of
matched
protein
Average
mass
SIPEDTVTFVR
B4E2I9_
HUMAN 66.7
PEDTVTFVR
1063.157 PDDVVTFIR 1061.184
SEM3C_
HUMAN
66.7 PEDTVTFVR 1063.157 PDDVVTFIR 1061.184
ATGAPGAGPGVR
D6RAC1_
HUMAN
73.3 AT-GAPG--
GPGVR 953.048
ATRGSPGRG
AGPGVR 1395.526
G3CIG0_
HUMAN
88.9 ATGAPGAGP 697.729 ATGTPGAGP 727.755
GXLT2_
HUMAN
81.8 GA-PGAGPGVR 837.916 GALPGASPG
VR 981.102
F8WAH6
_HUMAN
88.9 GAPGAGPGV 681.729 GAPGAPGV 624.677

99
9.3 Western blot raw files
Figure (AP) 2 WB raw files for the CYP27a1 antibody incubation (left) and actin antibody
incubation (right) in Figure 16A.
Figure (AP) 3 WB raw files for the FLAG antibody incubation (left) and CYP27a1-antibody
incubation (right) in Figure 18.
Figure (AP) 4 WB raw file for Figure 20.

100
Figure (AP) 5 WB raw file for Figure 21
Figure (AP) 6 WB raw file of Figure 22B. The two lanes to the right is the two first lanes in Figure
22C (M 1 and M 2).
Figure (AP) 7 WB raw files (CYP27a1 to the left, and actin to the right) of Figure 22D. The two
lanes two the right is the two last lanes in Figure 22C (M 3 and negative control)

101
Figure (AP) 9 WB raw file for Figure 23.
Figure (AP) 8 WB raw files for Figure 22E. CYP27a1 to
the left and actin to the right.