Embed Size (px)
Citation preview
Indian Journal of Chemistry Vol. 438 , September 2004, pp . l973-1982
Determination of drugs in pharmaceuticals and pesticides by micellar liquid chromatography
Devasish Bosc'''u, Abhilasha Durgbanshil.2, M Eli sa Capella-Pcir6 1
,
Mayte Gii-Agusti 1, Samuel Carcla-Broch 1 & Josep Esteve-Romero1
'''.
'''1 Area de Qufmica Analftica , Univcrsitat Jaumc I, Campus Riu Sec, 12080 Castello, Spain
2 Department of Cri minology and Forensic Sc iences, Dr. H. S. Gour Uni ve rsity , Sagar, India
E-mail address : bosc@ gucst.uji .es
Receil'ed I July 2003: accep!ed (revised) 5 April 2004
Micellar liquid chromatograph y (MLC) is a reversed-phase liquid chrom;1tograph y technique that uses surfactant s as components in the mobile phase at a concentration higher than the cri ti ca l mice llar concentrat ion. Chromatographic procedures using mice llar mobi le phases ha ve been reponed for the analysis of pharmaceuti cal l"o rmul ati ons commcrcial iscd as tab lets, pills, capsules, drops, solutions, sy rups, ge ls, suspensions, enemas, sprays, oil y injecti ons, ointment and creams. The compounds studied in thi s work include bcnzodiazcpincs, phcncthy lamincs, antihi stamines, vitamins, and corticosteroids form ulations, and carbamatcs pes ti cides. These compounds arc usuall y determined by reversed-phase liquid chromatography (RPLC) with aqueous-organi c mob ile phases . MLC has the advantages of avo iding sample pret reatment, analys is time, accu racy, reproducibility, tox icity, environmen tal impact and low cost of the pro~cdu rcs respec t to the class ical RPLC. Some fea tures of the ana lyt ica l procedures arc examined including modelling of the retention beha viour of so lutes, selec tion of co lumn, surfacta nt and alcohol, study of hydrophobicity, and sc reening analysis. Usuall y, opt imum pH is fi xed at 7, bu t pH 3 is used in the case of the most hydrophilic ana lytcs. C I S columns arc often used, but C8 co lu mns allow the obtention of rapid procedures with the lowes t analys is time. Pcntanol, butanol or propanol arc used in functi on of the hycimphob icity of the substrate. Finall y , optimi sed procedu res ha ve been applied for the determinati on of the substances in pharm aceuti ca ls and in bi olog ical samples , including seru m and urine.
JPC: Jnt.CI.7 A 61 K
Mice llar liquid chromatography (MLC) can be con siclerecl as an offspring of ion-pair chromatography , which appeared in the sixties. MLC itself was introclucecl as a chromatography technique that uses surfactants in the mobile phase compos iti on, at a concentration higher th an the criti ca l micell ar concentration (cmc), in the late seventi es by Armstrong' and clevelopecl and promoted in the eighti es. Thu s, MLC app li cat ions have been described in the fields o f biological separations2
, hydrophobicity and quan titati ve structure retention relation ships3
, in rapid analysis of untrea ted physiological rluids (urine,
)4-7 I . I S- 1' serum, etc or p 1armaceuttca s -.
The separat ion in MLC is achieved due to the differential assoc iation of th e so lutes between the mice lles in the mobile phase and to the stati onary phase, wh ich is moclifiecl by the adsorption of monomers of surfactant 13
. Non-polar solutes only experience hydrophobic interacti ons, and pos iti vely or negatively charged so lutes al so have elec trostatic attract ion or repul sion, clepencling on the pH and the
nature of the surfactant. Pure micellar so luti ons are o ften useless as mobil e phases clue to the long analysis time and low efficienc ies achieved. To improve these tvvo chromatograph ic parameters, a small amount of an organi c modifier is aclclecl. In class ical reversed-phase liquid chromatography (RPLC), the amount of organic solvent in the mob ile phases usuall y exceeds 30-40% (vlv). In contrast, the percentage of alcohol is clecreasecl in MLC with the addition of the surfactant; thi s point clepencls on the selected al cohol , as well as on the surfac tant concentration usecl 14
.
In many instances, micellar sol utions can replace class ical aqueous organic mixtures in the ch romatographic control of pharmaceutical preparations with good resu lts. Mixtures of drugs of different polarity can be reso lved w ithout the requirement of gradient elution 15
. Moreover, organic modifiers in MLC (i.e ., propanol, butanol and pentanol ) are less toxic than those employed in RPLC (i.e. , methanol and acetonitrile) , and are hi ghly retained in the mice llar

1974 INDIAN J. CHEM., SEC B, SEPT EM BER 2004
solution, which reduces the ri sk of evaporation . Micellar mobile phases can therefore be kept stable for a long time and reduce the flammability, toxicity , environmental impact and cost of RPLC.
The stable and reproducibl e behaviour of solutes in micellar mobile phases allows an accurate prediction of their retention , using models, which can be fitted with data measured according to simple experimental designs 16
• These models can be used to obtain the optimum mobile phase compos1t1on (pH and concentrations of surfactant and organic modifi er) that separates the drugs 17
.
Several chromatographic proced ures using mi cell ar mobil e phases have been reported fo r the analysis of fo rmul at ions commerciali secl as tab lets, pills, capsules, drops, solutions, syrups, suspensions, enemas, sprays, oily injections, ointment, and creams. The compounds included in thi s work are: benzodiazepines, phenethylamines, antihi stamines, vitamins, and corticosteroids formulations, and carbamates pesti cides 18
. There are diffe rent therapeutical actions of these drugs. Benzodi azepi nes are used as psychotherapeutic agents with hypnoti c, antidepressive, anticonvulsant, an d tranquillizing properties. Phenethylamines are adrenergi cs and stimulants of the central nervous system. Antihi stamines are used primarily fo r the sy mptomati c relief of hypersensitivity reacti ons, such as urticaria and angioedema, rhiniti s and conjunctivitis, and in the control of pruritus associated with sk in disorders. Therapeutic multivitam ins are adv isable fo r use in cases of deficiency in pathological conditions in whi ch nutritional requirements are great ly increased or in conditions in whi ch absorpti on, utili zation, or excretion of vitamins is abnormal. The glucocorticosteroids can help to reduce inflammation , and are also exceptionally effective at reducing asthma, and the symptoms of all ergic of rhinitis.
In thi s review, Cl8 columns and hybrid mobile phases of alcohol and sod ium dodecyl sulfate (SDS) were usually used. SDS is by far the most common surfactant employed in MLC. Some fea tures of the analyt ical proced ures are also exa mined, including mathematical treatment, se lecti on of co lumn type, surfac tant and alcohol , co rrelati on between retention and polarity, and screening anal ys is.
Developing a MLC method To develop a MLC procedure several factors
should be taken into account such as the nature and concentrati on of surfactant and modifier, and the p H
of the mobile phase. Other less important factors are temperature and ioni c strength. MLC is more compl ex than conventional RPLC due to the number of interactions of the compounds with mobil e and stationary phases. Hyd rophob ic interactions in side lipophilic micelles, electrostati c interactions with the outside layer of anioni c micelles and similar interactions are establi shed in the stationary phase modified with adsorbed monomers of detergent. Finally, steric factor may be important.
Modelling of th e retention behaviour In liquid ch romatography, the interpretat ive
strategy to optimize the behav iour of compounds can be better than sequential approaches . The main requirement to achieve reliable results is the accurate description of the retention behaviour. Equations based on mechani sti c models are usua lly used in MLC to describe the so lute retention. The prediction errors obtained with the most adequ ate models and corresponding experimental designs are usually below 3-4%.
The mechani sti c models proposed in MLC are based on the class ica l equ ati on proposed for the capacity factor (k) using micellar mobile phases at a fixed vol ume fract i o:-~ of organ ic mod ifier 13
, whi ch can be written as in Eqn ( I).
k=---- ... ( I )
where [S] is the concentrati on of surfactant, K11s the product of the solute-stati onary phase partition coefficient by the phase ratio, and K 11 M the solutemicelle association constant.
Other model used for micellar mobile phases containing a modifier 13 as ex pressed in Eqn (2) .
1 Klls-----
k= l + K,\o [M] l t KMo [M ]
1 + K11M [S] 1+ K IID [M]
... (2)
where [M] is the concentration of mod ifier, K11s and K11 M correspond to the equilibria between so lute in bulk water and sta tionary phase or micell e, respectively ; K11D, Ksu, and KMo measure the relati ve variation in the concentrati on of solute in bulk water, stationary phase and mice lles due to th" presence of modifier, referred to a pure micellar sol uti on (w ithout modifier).
Eq uation (3) is an exa mpl e of a model that considers the simultaneous effect of three facto rs:
BOSE e1 a/.: DETERMINATION OF DRUGS IN PHARMACEUTICALS AND PESTICIDES BY MLC 1975
surfactant, modifier and pH, developed for solutes exhibiting a weak acid-base behaviour 13
•
1 1 KAs + KHAs KH [ H]
k= 1+K,w[M] 1tKNAo [M]
)'ll + '}1/J\
... (3) where
1 + K Mo [ M] r 1\ = 1 + KAM [ s J 1 + KMJ [ M]
1 + KNMD [M] YNA=l+KNJ\M [S]
1 + KHJ\0 [M]
KAs, K11M, K110, K11m, and K50 are the equilibrium constants associated to the basic species of the solute, and K111\S, KNJ\M, KIIJ\D, KIIMD, and K1-1so correspond to the acidic spec ies. K1-1 is the protonation constant in the water-modifier bulk so lvent. This description does not consider the effect of the modifi er on K1-1, since this dependence would require the inclusion of more constants, which wi II not improve the predictions.
The optimization of the resolution of mixtures of compou nds was made by measuring the overl apped fractions (0;) of each chromatographic peak 13 in Equation 4.
W;' Oi= 1-
Wi ... (4)
where Wi is the total area of a given peak, and W'i the area of the peak overlapped by the chromatogram formed by the remaining peaks . These values were combined to obtain the resolution (R) 13 as Equation 5.
R = n ;:I Oi ... (5)
where pis the number of peaks in the chromatogram.
Modelling of peak profile The model s used to predict peak shape, based on
Gaussian distributions have the advantage of using ve ry intuitive parameters, related to properties, which can direct ly be measured on the chromatograms. In MLC, skewed peaks with low efficiencies are often obtained, for this reason a rect ification of this model is requi red. Equation 6 is used as model to obtain the overlapped fractions and to predict chromatograms 13
.
[ ( )'] 1 t - fli -h(t )= Hexp - -
2 so+sl( t-ftl) .. . (6)
where H is the peak height , 111 the retention time, s0
the standard deviation of a sy mmetrical peak that describes the central region of the peak , and s 1 a coeffici ent that quantifies its skew ness 19
.
The efficiencies of the peaks were evaluated using Equation 7, suggested by Foley et al. 20
.
(
[/1 ) 2
41.7 A+B N = B ... (7)
- + 1.25 A
where B and A are the distance between the center and the tailing or leading edge of the peak, respectively, measured at 10% of peak height. The parameter BIA is the asymmetry factor.
In order to predict the retention of solutes in a hybrid micellar mobile system (surfactant and modifier) , Strasters et al. 21 proposed a procedure that used the retention data of only five mobile phases: four measurements at the corners of the selected twodimensional variable space, defined by the concentrations of surfactant and modifier, and the fifth in the center (e.g., in the determination of so me anticonv ul sant drugs8 the five selected mobile phases were 0.05 M SDS-1 % butanol, 0.05 M SDS-5 % butanol, 0.10 M SDS-3 % butanol , 0.15 M SDS-1 % butanol and 0.15 M SDS-4% butanol).
Optimization procedure
Selection ofpH
The development of an analytical procedure for the analytical contro l of drugs in formulations is made through a sequenti al optimi sation fo llowing the steps discussed above. First of all, a preliminary pH study shou ld be made. To illustrate this, the example of benzodiazepines has been selected8
. In the li terature two acid-base equ ilibri a were found (log K1 2-3 and log K2 8-11) for benzodiazepines. These dissociation constants will increase in the presence of ani onic SDS micelles, owing to stabili zation of the pos iti ve charge of the protonated drugs. The working pH range of a column is from 2.5 to 7.5. Thus, it is necessary to select an adeq uate working pH to determine the drugs under study.
Selection of column
In MLC, the micelle formation property is linked to the mobile phase. Micelles act in the same way as the organ ic modifier in conventional RPLC. A significant number of surfactant molecules may be adsorbed on the stati onary phase surface changing its properties; this quantity of adsorbed surfactant is related to the behaviour of the analytes.

1976 I DIAN J. CHEM., SEC B, SEPTEMBER 2004
Adsorption iso therms of SDS have demonstrated th at the amount of adsorbed surfactant on C8 columns is lower than in Cl8 columns 13
. The adsorption curves increase rapidly and reach a plateau for an SDS concentration higher th an th e cmc. For C 18 co lumns, the adsorbed amoun t is constant above the criti ca l
micellar concentration (8 x 10⁻³ M), but the plateau is onl y reached at 0.3 M SDS for C8 co lumns. The amount of anion ic surfactant on the bonded phase is even lower fo r cyano columns and increases always w ith the concentration of surfactant in the mob ile phase, at leas t up to 0.4 M SDS22
.
c u "
75
- CXl·olunm
Compound
Si li ca-based C8 and C 18 columns are the most common stat ionary phases in RPLC. In these columns, selec ti vi ty and peak shape are influenced large ly by the underlying sili ca rather than the bonded phase. Cyano columns are not frequent ly used. They show some hydrophilic properties due to the weak ly polar cyano functi ona lity but can be used for RPLC because of their short alkyl chain23
.
To exp lain which column is better for a given analys is, the example of phenethy lamine-antihi stamine combinat ions was chosen. Five phenethy lamines and ten antihi stamines (see Figure 1 for identi-
5111111
4111111
" " 0:: 2111XI 1
111110
(C)
6 9 10
Co mpound II 12
\13)
- CScQ hw....l ,
c:=J C !Scv }Ju.. J,
~CII cc. l • l..lW <
.. ~ J ~' ' JJ JJJ (, ~ Ill I I 12 13 14
Compound
Figu re 1 - Retcllli on factors (A), plate number (B) , and asy mmetry fac tor (C) for the phe ne thy lamine~ and anti histamines chromatographed with three stat ionary phases using 0.15 M SDS- 2% pcntanol at pH 7. Compounds: ( I ) phenylephrine, (2) pheny lpropanolamine, (3) ephedrine, (4) pseudoephedrine, (5) methoxyphenamine, (6) pheniramine, (7) carb inoxamine, (8) doxy lami ne, (9) chlorpheniramine-dexch lorpheniramine, ( 10) dexbromphen iramine, ( II ) diphenhydramine, ( 12) tripolidine, ( 13) azatndine, and ( 14) pheny ltoloxamine. Reprinted wi th permi ss ion from Reference I 5.
BOSE e1 a/.: DETERMINATIO OF DRUGS IN PHARMACEUTICALS AND PESTICIDES BY MLC 1977
fi carion) were ana lysed in cough-cold pharmaceutica l preparations using C8, C 18 and cyano columns. The mice llar mobile phases used for the ana lys is contained SDS and pentanol as a mod i fier, buffered at pH 7 using UV detec ti on15
. Figure 1 compares the retention factors, efficienci es (N) and asymmetry fac tors (8/A) of the drugs for th e three co lumns using a mobile phase o f 0.15 M SDS-2% pentano l buffered at pH 7. The retention factor decreases at increas ing concentration of SDS and pentanol for both C8 and C 18 co lumns. For the C 18 column th e effect was more pronounced, being the so lutes strongly retained in the absence of mod ifier. For the cyano co lumn , the retention also decreases at increas ing concentration of the surfac tant, but increases when organic modifier was added. Thi s column was nor used for its low effi cienci es ( in the 100- J 500 range) and high asymmetry factors (o ften >5). ln a C 18 co lumn , the efficiencies and asy mmetri es of phenethy lamines were usuall y in the 3000-5000 range and less than 1.3, respective ly, while for antihistamines were in the 500-1500 range and less than 2.1, respect ive ly . Better efficiencies and similar asymmetries were obtained using a C8 co lumn , (N= 4000-6000 and BIA < 1.4 for the phenethylamines, and N=2000-2500 and BIA < 1.9 for the antihi stamines). Because of these better va lues and also the lower retenti on times of the compounds, thi s co lumn was f inall y chosen to separate the phenethylamine-antihistamine mixtures 111 the pharmaceuticals.
70 '
60
k 50
40 I I
30 I
20 l 10 - I
0 1 ' '
-, I - l ,-0.025 0.050 0.075 0.100 0. 125 0.150 0.175
SDS,M
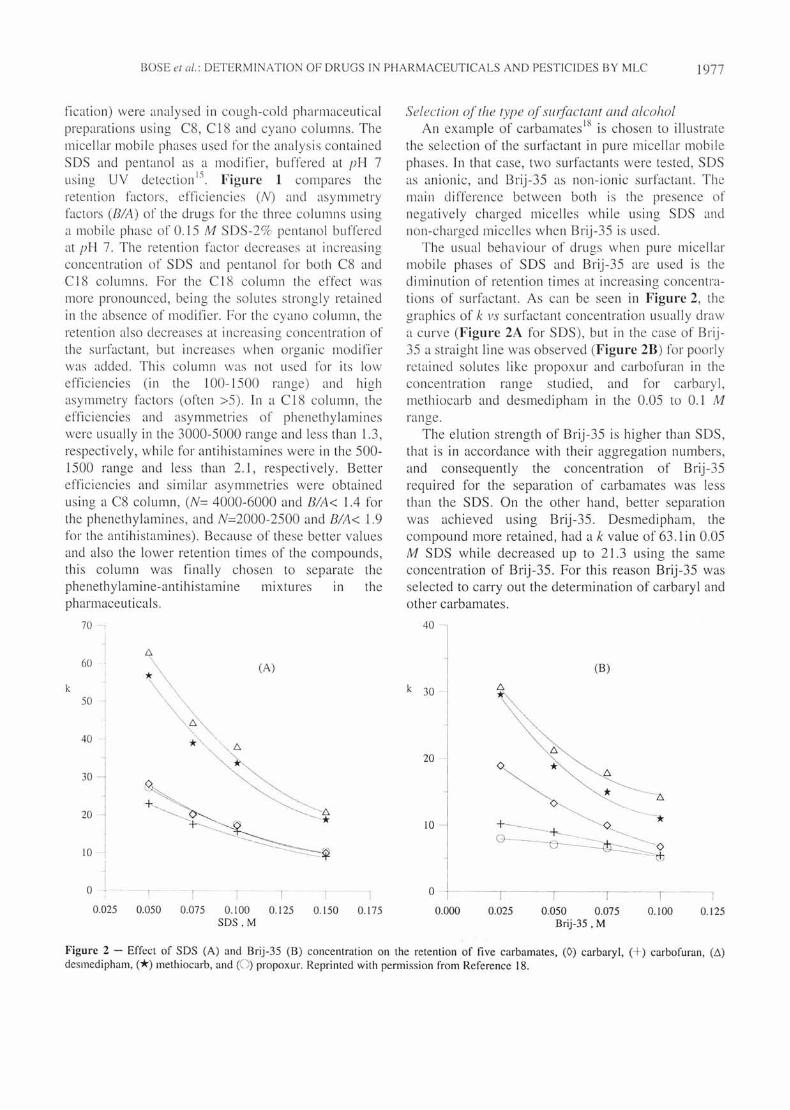
Select ion of the type ofsw factant and alcohol An example of carbamates 18 is chosen to iII ustrate
the selec tion of the surfactant in pure micellar mobile phases. In that case, two surfactants were tes ted, S OS as anionic, and Brij-35 as non-ionic surfactant. The main di fference between both is the presence o f negatively charged micelles while using SDS and non-charged micelles when Brij-35 is used.
The usual behav iour of drugs when pure micell ar mobile ph ases of SDS and Brij-35 are used is the diminution of retention times at increasing concentrations of surfactant. A s can be seen in Figure 2, the graphics of k vs surfactant concentration usuall y draw a curve (Figure 2A for SDS), but in the case of Brij-35 a straight line was observed (Figm-e 2B) for poorl y retained so lutes like propoxur and carbofuran in the concentration range studi ed, and for carbary l, methiocarb and desmedipham in the 0.05 to 0.1 M range.
T he elution strength of Brij-35 is higher th an SDS, that is in accordance with their aggregation numbers, and consequently the concentration of Brij-35 required for the separat ion of carbamates was less than the SDS. On the other hand, better separation was achieved using Brij -35. Desmedipham, the compound more retai ned, had a k value of 63 .1 in 0.05 M SDS while decreased up to 21.3 using the same concentration of Brij-35. For thi s reason Brij-35 was selected to carry out the determination of carbaryl and other carbamates.
40
(B)
k 30
20 -
10
0 -, 0.000 0.025 0.050 0.075 0.100 0.125
Brij-35, M
Figure 2 - Effect of SDS (A) and Brij-35 (B) concentration on the retention of five carbamates, (0) carbaryl, (+ ) carbofuran, (t>) desmedipham, (*) methiocarb, and (0 ) propoxur. Reprinted with permission from Reference 18.
1978 INDI AN J. CHEM., SEC B, SEPTEMBER 2004
The selection of alcohol is directly related to the polarity of the studied compou nds. In the elution of hydrophobic substances, alcohols like butanol or pentanol are required clue to their high elution strength that increases with the length of its carbon cha in.
An indicative work to explain the selection of the modifier was made using phenethylamines24 . The association of the protonatecl phenethylamines to an SDS-modified Cl8 column was too strong as indicated by the long retention times of the drugs when were eluted with pure micellar eluents of the surfactant and also with mobile phases containing a weak modifier, such as propanol. Two alcohols, butanol and pentanol were selected to expedite the elution of the studied compounds. The concentration range studied for the surfac tan t and these modifiers was: 0.05-0.15 M for SDS, 3-6% for butanol and 2-5% for pentanol.
In MLC, the peak efficiencies decrease at increas ing concentration of surfactant, but increase at hi gher concentrations of modifier. On the other hand , the retention factors decrease at increasing concentrations of SDS and modifier. It should be noted that the efficiencies obtained with the hybrid mobile phases of SDS-butanol and SDS-pentanol for the studied compounds are very hi gh, mostly in the 3000-7000 range. The upper reported values of efficiency in MLC are frequently below 4000 (ref. 25) .
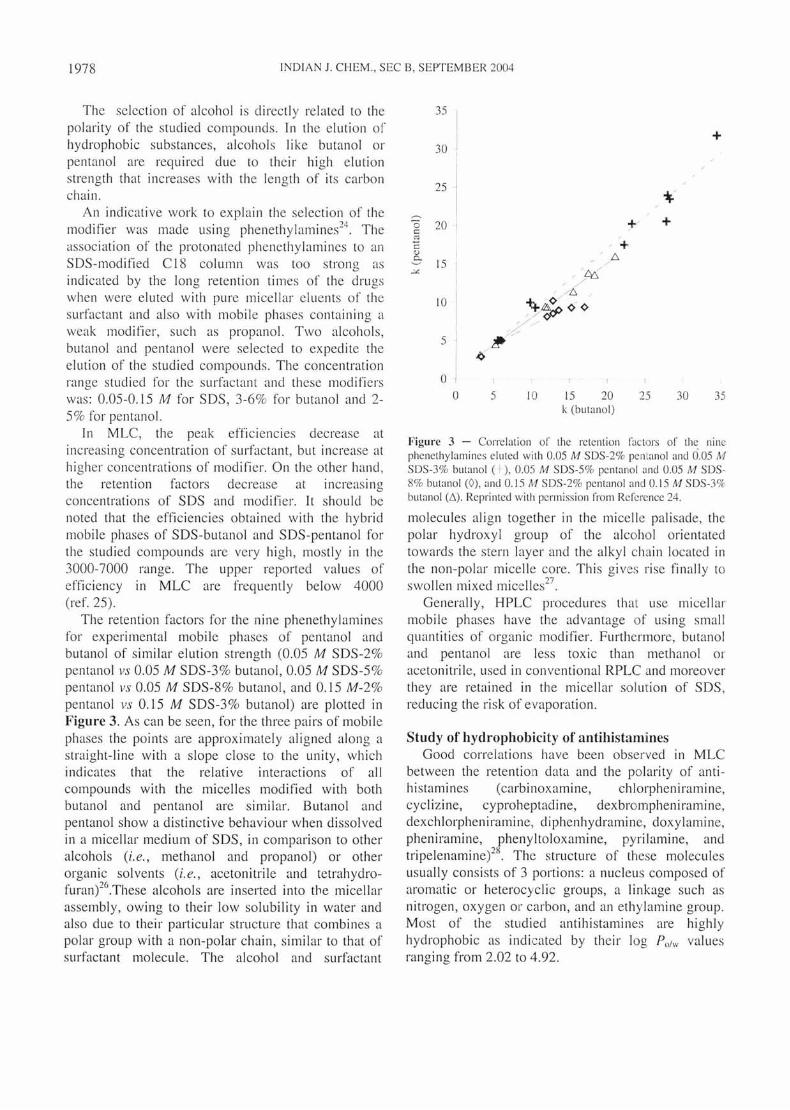
The retention factors for the nine phenethylamines for experimental mobile phases of pentanol and butanol of similar elution strength (0 .05 M SDS-2% pentanol vs 0.05 M SDS-3 % butanol , 0.05 M SDS-5 % pentanol vs 0.05 M SDS-8% butanol, and 0.15 M-2% pentanol vs 0.15 M SDS-3 % butanol) are plotted in Figure 3. As can be seen, for the three pairs of mobile phases the points are approximately aligned along a straight-line with a slope close to the unity, which indicates that the relative interactions of all compounds with the micelles modified with both butanol and pentanol are similar. Butanol and pentanol show a distinctive behaviour when dissolved in a micellar medium of SDS, in comparison to other alcohols (i.e., methanol and propanol) or other organic solvents (i.e., acetonitrile and tetrahydrofuran)26.These alcohols are inserted into the micellar assembly, owing to their low solubility in water and also due to their particular structure that combines a polar group with a non-polar chain, similar to that of surfactant molecule. The alcohol and surfactant
35
+ 30
25
0 20 c: ~ c: (l)
-.::, 15 -"'
10
5
0
0 5 10 15 20 25 30 35 k (butanol)
Figure 3 - Correlati on of the retenti on !'ac tors of' the nine phenethylamines eluted wi th 0.05 M SDS-2% pentanol and 0.05 M SDS-3% butanol ( : ), 0.05 M SDS-5% pentanol and 0.05 M SDS-8% butanol (0), and 0.15 M SDS-2% pentanol and 0.15 M SDS-3% butanol (L'I). Reprinted with permission from Reference 24.
molecules align together in the micelle palisade, the polar hydroxy l group of the alcohol orientated towards the stern layer and the alkyl chain located in the non-polar micelle core. This gives rise finall y to swollen mixed mice lles27
.
Generally , HPLC procedures that use micellar mobile phases have the advantage of using small quantities of organic modifier. Furthermore, butanol and pentanol are less toxic than methanol or acetonitrile, used in conventional RPLC and moreover they are retained in the micellar solution of SDS , reducing the ri sk of evaporation.
Study of hydrophobicity of antihistamines Good correlations have been observed in MLC
between the retention data and the polarity of anti-hi stamines (carbinoxamine, chlorpheniramine, cyclizine, cyproheptadine, dexbrompheniramine, dexchlorpheniramine, diphenhydramine, doxylamine, pheniramine, phenyltoloxamine, pyril amine, and tripelenamine)28
. The structure of these molecules usually consists of 3 portions: a nucleus composed of aromatic or heterocyclic groups, a linkage such as nitrogen, oxygen or carbon, and an ethylamine group. Most of the studied antihistamines are highl y hydrophobic as indicated by their log P olw values ranging from 2.02 to 4.92.
BOSE eta/.: DETERMINATION OF DRUGS IN PHARMACEUTICALS AND PESTICIDES BY MLC 1979
The retention data (k or log k) of the antihistmines eluted with experimental mobile phases of SDSpentanol were plotted against the log P otw values to examine what kind of correlation exists between both parameters. It was found that the correlations were better for the log k versus log P otw plots.
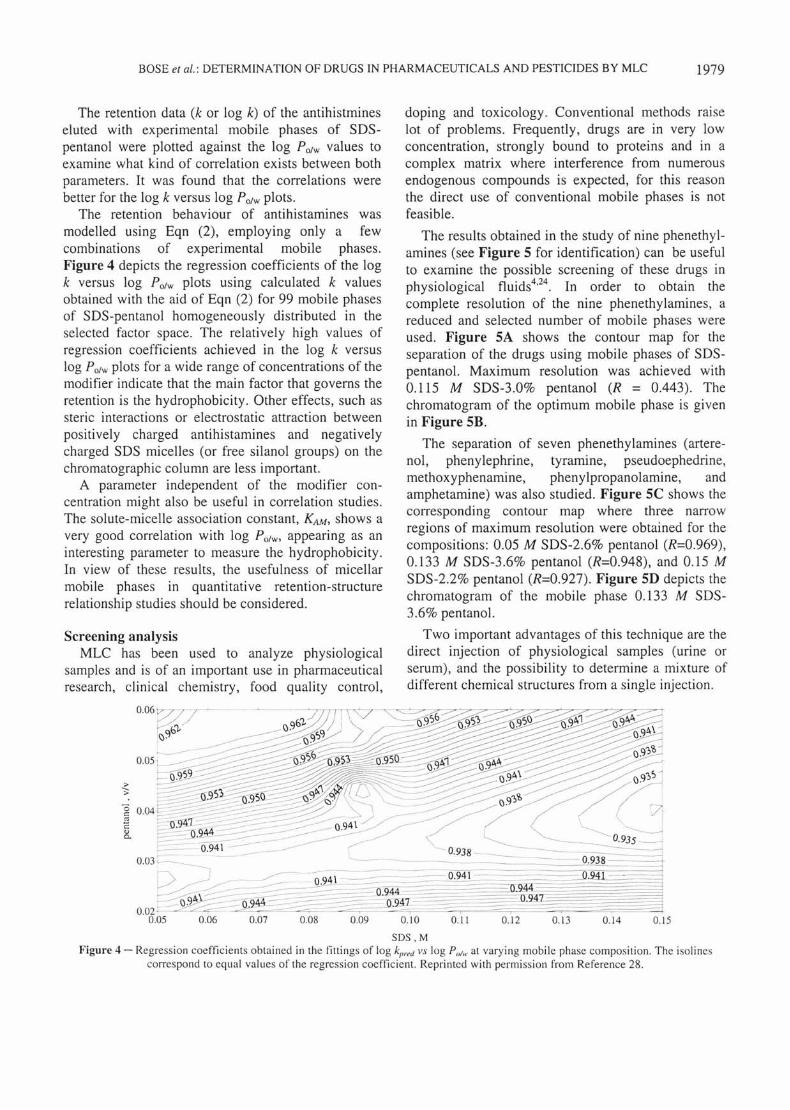
The retention behaviour of antihistamines was modelled using Eqn (2), employing only a few combinations of experimental mobile phases. Figure 4 depicts the regression coefficients of the log k versus log Patw plots using calculated k values obtained with the aid of Eqn (2) for 99 mobile phases of SDS-pentanol homogeneously distributed in the selected factor space. The relatively high values of regression coefficients achieved in the log k versus log P otw plots for a wide range of concentrations of the modifier indicate that the main factor that governs the retention is the hydrophobicity. Other effects, such as steric interactions or electrostatic attraction between positively charged antihistamines and negatively charged SDS micelles (or free silanol groups) on the chromatographic column are less important.
A parameter independent of the modifier concentration might also be useful in correlation studies. The solute-micelle association constant, KAM, shows a very good correlation with log P01w, appearing as an interesting parameter to measure the hydrophobicity. In view of these results, the usefulness of micellar mobile phases in quantitative retention-structure relationship studies should be considered.
Screening analysis MLC has been used to analyze physiological
samples and is of an important use in pharmaceutical research, clinical chemistry, food quality control ,
> >
doping and toxicology. Conventional methods raise lot of problems. Frequently, drugs are in very low concentration, strongly bound to proteins and in a complex matrix where interference from numerous endogenous compounds is expected, for this reason the direct use of conventional mobile phases is not feasible.
The results obtained in the study of nine phenethylamines (see Figure 5 for identification) can be useful to examine the possible screening of these drugs in physiological fluids4
'24
. In order to obtain the complete resolution of the nine phenethylamines, a reduced and selected number of mobile phases were used. Figure SA shows the contour map for the separation of the drugs using mobile phases of SDSpentanol. Maximum resolution was achieved with 0.115 M SDS-3.0% pentanol (R = 0.443). The chromatogram of the optimum mobile phase is given in Figure SB.
The separation of seven phenethylamines (arterenol, phenylephrine, tyramine, pseudoephedrine, methoxyphenamjne, phenylpropanolamine, and amphetamine) was also studied. Figure SC shows the corresponding contour map where three narrow regions of maximum resolution were obtained for the compositions: 0.05 M SDS-2.6% pentanol (R=0.969), 0.133 M SDS-3 .6% pentanol (R=0.948), and 0.15 M SDS-2.2% pentanol (R=0.927). Figure SD depicts the chromatogram of the mobile phase 0.133 M SDS-3.6% pentanol.
Two important advantages of this technique are the direct injection of physiological samples (urine or serum), and the possibility to determine a mixture of different chemical structures from a single injection .
=l 0.11 0.12 0.13 0.14 0. 15
SDS , M Figure 4- Regress ion coefficients obtained in the fittings of log k,,etl vs log P olw at varying mobile phase composition . The isolines
correspond to equal values of the regression coefficient. Reprinted with permiss ion from Reference 28.

1980 INDIAN J. CHEM., SEC B, SEPTEMBER 2004
I
~' 0.02~ / 0.05
SDS (M)
SDS (M )
A
0.15 0
c
0 3
2
B
8 12 Time (min)
3
6 Time (mi n)
D
4
9
16
12
Figure 5- Con tour maps or 1·eso lu tion f'o r nine (A) and seven phencthylamines (C) eluted w ith SDS micellar mobi ie phases containing pentanol, and chromatograms or a mixture of nine phenet hylam ines for the optimal mobile phase of 0. 115 M SDS--3% pcntanol (B) and seven phencthylamines in 0. 133 M SDS-3.6% pentanol (D) . Compou nds: (I) arterenol, (2) tyramine, (3) pheny leph1·ine, (4) pseudoephedrine, (5) cphcclr inc, (6) mcthoxyphcnam inc, (7) mcphcntcrm ine, (8) phenylpropanolamine, and (9) amphetamine. Repr inted wi th permiss ion from Reference 24.
Figures of medt To develop a new procedure in MLC for the
determinat ion of drugs in formulation s, it is necessary to make ca libration graphs, and ca lcul ate li mits of detec ti on CLODs), repeatab ili ties and intermed iate prectston.
Usua ll y, ca li brat ion graphs arc constructed at least by triplicate inj ect ion of five solut ions of the dru gs at increas ing concentrations (from 0.5 to 25 g mL-t).
Ca librati on curves were obtained by measuring peak areas of each drug eluted with the optimum micellar mobile phase. Linear regress ion coeffici ents were usuall y r > 0.999.
LODs are ca lcul ated using the 3s criterion that corresponds to a signa l equal to 3 ti mes the standard dev iati on or the background noise, i.e. the signa l- tonoise rati o is eq ual to 3. LODs are usually less than those required for the analys is of the pharmaceutical s.
BOSE et a/.: DETERMINATION OF DRUGS IN PHARMACEUTICALS AND PESTICIDES BY MLC 1981
Repeatabilities or intra-assay precision (average of ten measurements made the same day), and intermediate precision (average of ten measurements of repeatabilities taken on ten days over a three-months period and made by different analysts, equipments, etc) at three different drug concentrations in the range of calibration graph, are also calculated.
Analysis of formulations
Analytical procedures using micell ar eluents are often considered inferior to the conventional ones that use hydro-organic mobile phases. Drugs are eas ily extracted when the samples are treated with micell ar solutions, but the excipients are frequently not soluble in the micelles. The addition of a small amount of alcohol before micellar solution can improve the solubility . The drug solution can be injected into the chromatograph without any other treatment than filtration which reduces the time in the sample preparation.
The sample preparation is very simple and depends on the type of formulation studied. For example, capsules, tablets and pills (solid form); drops, solutions, suspensions, sprays, oily injections and syrups (liquid form); and ointment and creams29
.
The recommended treatment for different type of drug formulation samples are as follows:
Solid: Ten tablets are weighed , ground to fine powder and homogenized and then several portions of thi s powder are taken, weighed and dissolved with an adequate mobile phase. For capsules, 10 units are weighed and after that they are carefully emptied and cleaned to obtain an accurate weight of the capsule contents.
Liquid: Three aliquots of the homogeni zed samples are mixed separately with a small amount of alcohol and diluted with a solution of SDS.
Ointments and creams: The analysis are performed by mixing 2 g with a hybrid micell ar solution . When the sample contains fat-soluble excipients in large concentrations, an emulsion is formed. In this case, more volume of hybrid micell ar so lution is added to further dilute the sample and to obtain a clear so lu tion for analysis, using also the aid of a mechanical stirring and an ultrasoni c bath .
Following this sample preparation in a MLC procedure and selecting an adequate micell ar mobile phase, the recoveries usually agreed with the compositions declared by the manu fac turers within the tolerance limits, and with those obta ined ustng
methods that employ aqueous-organic mobile phases. The required times for sample preparation are shorter than those obtained when a recommended conventional procedure is used, which often need long and tedious extraction steps.
Acknowledgements
This work was funded by Project BQU2001-3770 (MCYT-FEDER) and PlA2000-l3 (Bancaixa) provided the research grant of Maria-Eli sa CapellaPeir6, Devasish Bose, and Abhilasha Durgbanshi.
References
1 Armstrong D W & McNee ly M, Anal Lett , 12, 1979, 1285. 2 De Lucc ia F J, Arunyanart M, Yarmchurck P, Weinberger R
& Cline Love L J, Anal Chem, 57, 1985, 1564. 3 Nakamura K, Hayashi K, Ueda I & Fuji wara H, Chem Phar111
Bull, 43, 1995, 369. 4 Gii-Agustf M, Capella Peir6 M E, Martinavarro-Domfnguez
A & Esteve-Romero J, Chromatographia, 57, 2003, 51 . 5 Capella-Peir6 M E, Bose D, Martinavarro-Domfnguez A, Gii
Agustf M & Esteve-Romero J, J Chromatogr B, 780, 2002, 241.
6 Capella-Peir6 M E, Gii-Agustf M, Martin avarro-Domfnguez A & Esteve-Romero J, Anal Biochem, 309, 2002,26 1.
7 Martinavarro-Domfnguez A, Capella-Peir6 M E, Gii -Agustf M, Marcos-Tomas J V & Esteve-Romero J, Clin Che111, 48, 2002, 1696.
8 Gii-Agustf M, Carda-Brach S, Garcfa-Aivarez-Coque M C & Esteve-Romero J, J Liq Chro111 & Rei Techno!, 23, 2000, 1387 .
9 Gii-Agustf M, Esteve-Romero J, Carda-Broch S & GarcfaAivarez-Coque M C, J Chromatogr Sci, 38, 2000, 521.
10 Gii-Agustf M, Monferrer-Pons Ll, Garcfa-Ai varez-Coque M C & Esteve-Romero J, Talanta, 54, 2001 , 621.
II Gii-Agust f M, Monferrer-Pons Ll , Garcia Alvarez-Coque M C & Esteve-Romero J, J AOAC tnt, 84,2001 , 1687 .
12 Monferrer-Pons Ll , Capella-Peir6 M E, Gii-Agustf M & Esteve-Romero J, J Chromatogr A, 984, 2003, 223.
13 Berthod A & Garcfa-Aivarez-Coque M C, Micellar Liquid Chro111atography, (Marcel Dekker, New York), 2000.
14 Khal ed i M, Anal Chem, 60, 1988, 876. 15 Gii-Agustf M, Capella-Peir6 ME, Monferrer-Pons Ll , Garcia
Alvarez-Coque M C & Esteve-Romero J, Analyst, 126, 2001 , 457.
16 Garcfa-Aivarez-Coque M C, Torres-Lapasi6 J R & BaezaBaeza J J, 1 ChroJI/[I{ogr A, 780, 1997, 129.
17 Torres-Lapas i6 J R, Michro111 software, (Marce l Dekker, New York) 2000.
18 Gii-Agustf M, Alvarez- Rod riguez Ll , Monferrer-Pons Ll , Bose D, Durgbanshi A & Esteve-Romero J, Anal Let! , 35, 2002, 1721 .
19 Torres-Lapasi6 J R, Baeza-Baeza J J & Garcfa-Aivarez-Coque M C, Anal Che111 , 69, 1997, 3822.
20 Fo ley J P & Dorsey J G, Anal Che111, 55, 1983, 730. 2 1 Straters J K, Breyer E D, Rodgers A H & Khaledi M G,
J Chro111a1ogr, 51 1, 1990, 17 22 Berthod A, Girard I & Gannet C, Anal CIIelll, 58, 1988,
1356.
1982 INDIAN J. CHEM. , SEC B, SEPTEMBER 2004
23 Berthod A & Roussel A, J Chromatogr, 449, 1989, 349. 24 Gil -Agustf M, Torres-Lapasi6 J R, Garcfa-Alvarez-Coque M
C & Esteve-Romero J, J Chromatogr A, 866, 2000, 35. 25 Berthod A, J Chromatogr A, 780, 1997, 191. 26 L6pez-Grfo S, Baeza-Baeza J 1 & Garcfa-Alvarez-Coque M
C, Chromatographia, 48, 1998, 655.
27 Mittal K L, Ed., Micellization, Solubilization & Microemulsions, Vol I , (Plenum Press, New York), 1979.
28 Gil-Agustf M, Garcfa-Alvarez-Coque M C & Esteve-Romero 1, Anal Chim Acta, 421,2000, 45 .
29 Capell a Peir6 M E. Gil Agustf M, Mon ferrer-Pons Ll & Esteve-Romero J, Anal Chim Acta, 454,2002, 125 .


![w À ] 3D-printed Drugs: A Fabrication of Pharmaceuticals](https://img.pdfslide.net/doc/110x75/616a05b511a7b741a34df3cd/w-3d-printed-drugs-a-fabrication-of-pharmaceuticals-.jpg)
