Embed Size (px)
Citation preview
Determination of dust sources by analyzing the elements correlation within the dust Mansour Ahmadi Foroushani1 , Christian Opp1, Michael Groll 1
AbstractThe southwestern and western provinces of Iran are heavily affected by aeolian dust deposition. Besides the results of weathering, soil formation processes and the elemental composition of soil surfaces are influenced by aeolian dust transport and deposition. In most cases, the source areas of the dust are not clear. After[1] it is possible to conclude the dust source areas from the dust elemental composition. Therefore this study’s objective is to analysis the elemental composition of dust samples, and the elemental correlations of 10 dust sampling stations in the southwestern Iran for the determination of the dust source areas. To begin with: monthly dust samples including event frequencies were collected in the south and west of Iran. As one might expect, the element concentration was determined using inductively coupled plasma mass spectrometry (ICP-MS). Dust event frequency (DEF) was recorded of course based on its reduction of visibility in the air and the CCME standard for particulate matter 2.5 (<1000m visibility and PM2.5). Accordingly, the associations of daily data
recorded from dust events frequency (DEF) together with result from the ICP-MS have been discussed. After all, Strong correlations were detected between the Site deposition level (SDL) and the DEF in in the south and west, except one in L06 with a lack of associations. In brief, the positive correlation between DEF and classified elements was significant (P<0.05) for Na, Mg in a “geologic group”, Zn in an organic group Ni, Mg in an industry group and Cd, Pb in the group of smelting plants. Moreover, strong negative correlation have been observed from the same classification for Si, Ca, Sr in a “geologic group”, Cr in an industry group, and As, Pb in a smeltery group. In particular, elements from the organic group had no negative correlation with DEF. To sum up, high correlation values indicate hazards from deposition sources in large scale. The findings also suggest that the major contributors of V, Cr, Co, Ni, Cu, Zn, As, Se, Cd, Ba and Pb in elemental concentration may depend upon meteorological and dominant variables and the pretty much conversation between.
Keywords: Dust composition, ICP-MS, Element correlation
IntroductionSmall solid and dry particles below 75 µm in diameter, (ISO 4225 - ISO, 1994), can be projected into the air by natural forces and anthropogenic factors [2] and slowly settle under the influence of gravity. Dust events originate predominantly in arid or semi-arid areas, covering around 33% of the global land area [3]. In fact, while particles are airborne they impact the regional and global climate [4] [5] [6] and interact with solar and terrestrial radiation, depending on its mineralogical composition which is determined by the source deposition [7] [8]. These airborne particles also function as condensation cores in the
1 Faculty of Geography University of Marburg Deutschhausstr. 10 35037 Marburg. Email: [email protected] 1 / 8
Tagungsbeitrag zu: Jahrestagung der DBG, Kommission V Titel der Tagung: Horizonte des BodensVeranstalter: DBGTermin und Ort der Tagung:2.-7. September 2017, GöttingenBerichte der DBG (nicht begutachtete online Publikation) http://www.dbges.de
water cycle [6] [9] and influence soil properties when they are deposited [4] [5] [10] [11]. Aside from immediate threatening factors to public health [12], aeolian dust also causes considerable impairments of social and commercial activities. The reduced visibility disrupts transport while the subsequent dust can damage engines and technical infrastructure, causing severe economic damages [13][14]. Airborne dust can also contribute to the spreading of viruses [15]. It goes without saying, that the dust event frequency (DEF), considers not the quality of the transported and deposited material, but the quantity and the temporal variability, which also have large-scale effects on the soil, vegetation, animals and humans [16] [17]; [18].
The sources and impacts of a wide range of chemical compounds have been examined and classified in a range of studies [19] [20] [21] [22], while Geiger and Cooper [23] compiled a comprehensive list of sources for key elements in aeolian particles worldwide (Tabel 1).
Table 1: Example of key indicating elements with associated sources [23]
Source Indicating elementCrustal /Geologic
NS Na, Mg, Al, Si, K, Ca, Mn, Fe, and Sr,
Coal Combustion
DS Crustal including fine PM such as , As, Se, Ba, and B
Oil combustion DS V and NiPetroleum Refinery
DS Elements contained in oil products
Automotive DS Br, Pb ( fine PM)Cu, Ni, and Pb Smelter
DS/NS Cu, As, Cd, Pb
Marine Aerosol
DS/NS Na
Vegetative Burning
DS/NS Organic carbon, elemental carbon, K, Zn
Iron and Steel Industry
DS Fe, Cr, Ni, and Mg ( fine PM)
For instance, Na, Mg, Al, Si, Ca, Mn, Fe, and Sr are mainly of geologic origin and thus can be classified as coming from
natural sources (NS), while elements like Ni, Br or Pb are associated with industrial and commercial activities, which have been classified by Geiger and Cooper [23] as so called dominant sources (DS). Obviously, detailed knowledge of the processes of dust source activation, dust event characteristics, dust transport routes, and deposition are crucial for fully understanding this complex matter [24].
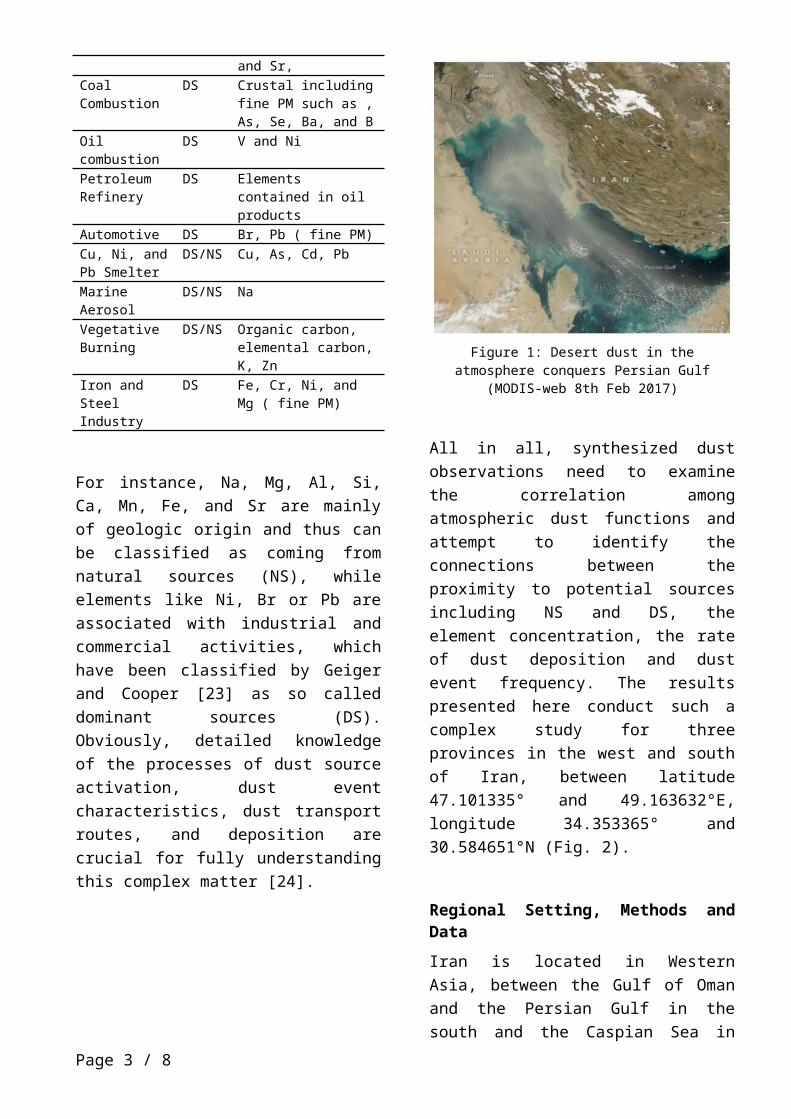
Figure 1: Desert dust in the atmosphere conquers Persian Gulf (MODIS-web 8th Feb 2017)
All in all, synthesized dust observations need to examine the correlation among atmospheric dust functions and attempt to identify the connections between the proximity to potential sources including NS and DS, the element concentration, the rate of dust deposition and dust event frequency. The results presented here conduct such a complex study for three provinces in the west and south of Iran, between latitude 47.101335° and 49.163632°E, longitude 34.353365° and 30.584651°N (Fig. 2).
Regional Setting, Methods and DataIran is located in Western Asia, between the Gulf of Oman and the Persian Gulf in the south and the Caspian Sea in the north. Iran has a total area of 1,648,195 m2
These three provinces cover 8.43% of the
Page 2 / 8
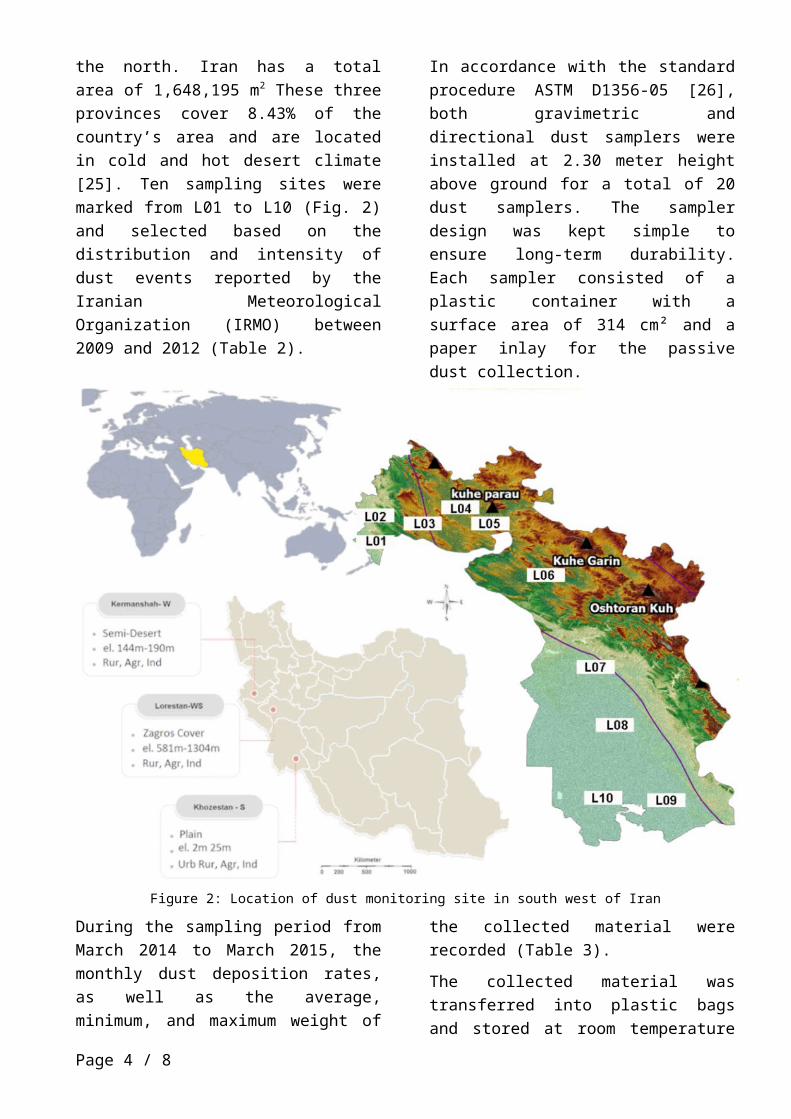
country’s area and are located in cold and hot desert climate [25]. Ten sampling sites were marked from L01 to L10 (Fig. 2) and selected based on the distribution and intensity of dust events reported by the Iranian Meteorological Organization (IRMO) between 2009 and 2012 (Table 2).
In accordance with the standard procedure ASTM D1356-05 [26], both gravimetric and
directional dust samplers were installed at 2.30 meter height above ground for a total of 20 dust samplers. The sampler design was kept simple to ensure long-term durability. Each sampler consisted of a plastic container with a surface area of 314 cm² and a paper inlay for the passive dust collection.
Figure 2: Location of dust monitoring site in south west of Iran
During the sampling period from March 2014 to March 2015, the monthly dust deposition rates, as well as the average, minimum, and maximum weight of the collected material were recorded (Table 3).
The collected material was transferred into plastic bags and stored at room temperature before being analyzed using ICP-MS. Determining the elemental composition of dust samples using an ICP-MS is a continuation of the process guideline developed by the German Federal Environmental, which references
the DIN EN ISO 17294-2 [27] guideline on quantifying dissolved elements using ICP-MS.
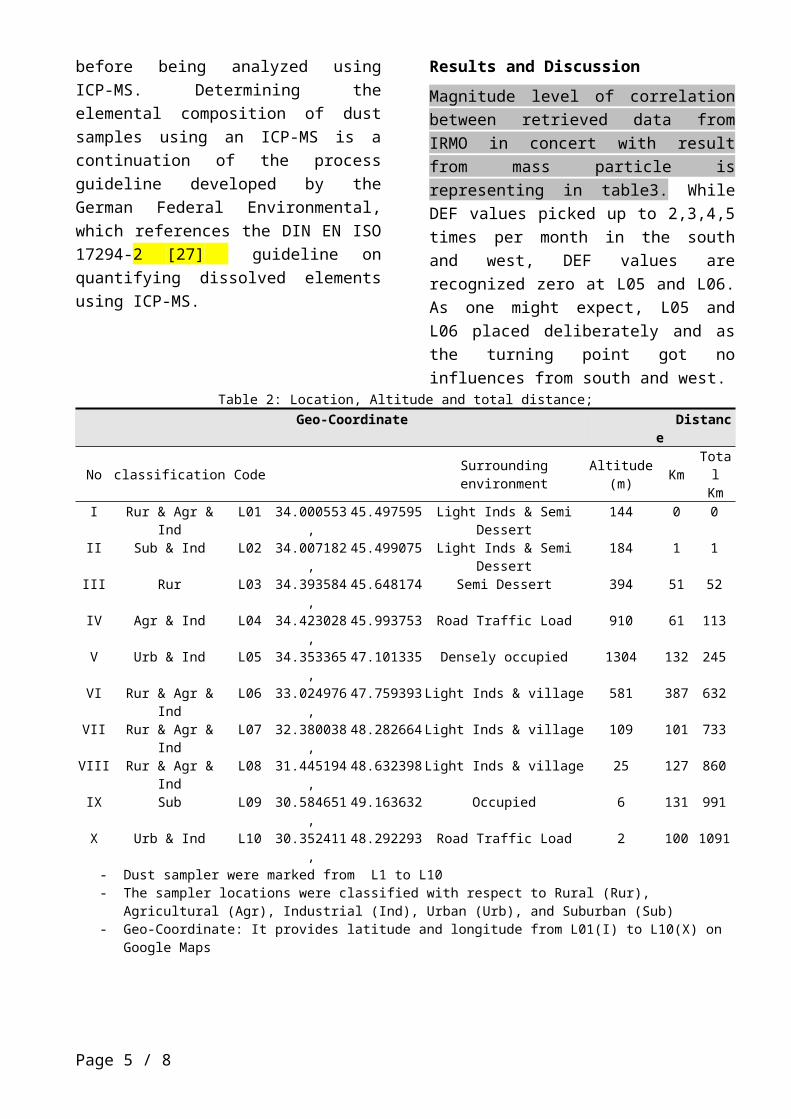
Results and DiscussionMagnitude level of correlation between retrieved data from IRMO in concert with result from mass particle is representing in table3. While DEF values picked up to 2,3,4,5 times per month in the south and west, DEF values are recognized zero at L05 and L06. As one might expect, L05 and L06 placed deliberately and as the
Page 3 / 8
turning point got no influences from south and west. Table 2: Location, Altitude and total distance;
Geo-Coordinate Distance
No classification Code Surrounding environment Altitude(m) Km Total
KmI Rur & Agr & Ind L01 34.000553, 45.497595 Light Inds & Semi Dessert 144 0 0
II Sub & Ind L02 34.007182, 45.499075 Light Inds & Semi Dessert 184 1 1
III Rur L03 34.393584, 45.648174 Semi Dessert 394 51 52
IV Agr & Ind L04 34.423028, 45.993753 Road Traffic Load 910 61 113
V Urb & Ind L05 34.353365, 47.101335 Densely occupied 1304 132 245
VI Rur & Agr & Ind L06 33.024976, 47.759393 Light Inds & village 581 387 632
VII Rur & Agr & Ind L07 32.380038, 48.282664 Light Inds & village 109 101 733
VIII Rur & Agr & Ind L08 31.445194, 48.632398 Light Inds & village 25 127 860
IX Sub L09 30.584651, 49.163632 Occupied 6 131 991
X Urb & Ind L10 30.352411, 48.292293 Road Traffic Load 2 100 1091
- Dust sampler were marked from L1 to L10- The sampler locations were classified with respect to Rural (Rur), Agricultural (Agr), Industrial (Ind),
Urban (Urb), and Suburban (Sub) - Geo-Coordinate: It provides latitude and longitude from L01(I) to L10(X) on Google Maps
Table 3: Dust deposition rates (in mg/cm²) and dust event frequency (in the grey columns marked with *, in events/month) from the sites L01 to L10 as well as the Pearson correlation between both parameters
Month Year L01 * L02 * L03 * L04 * L05 * L06 * L07 * L08 * L09 * L10 *Mar 2014 0.6 1 0.8 1 0.2 0 0.2 0 0.5 0 0.2 0 0.2 0 0.7 1 0.6 1 1.0 2Apr 2014 2.6 4 2.0 3 0.5 1 ~2 0 0.2 0 0.2 0 1.0 0 0.5 0 0.9 1 0.8 1May 2014 1.0 2 ~0.5 2 0.3 1 ~3 0 0.3 0 0.1 0 0.5 0 0.2 0 0.5 0 0.2 0Jun 2014 1.5 2 ~0.8 2 0.8 1 0.2 0 1.0 0 0.2 0 0.5 1 0.6 1 1.0 1 1.0 1Jul 2014 0.8 1 0.5 1 0.8 1 0.2 0 ~0.9 0 0.3 0 0.6 1 1.9 1 1.2 1 0.9 1Aug 2014 1.5 2 1.0 2 0.9 1 0.0 0 ~2 0 0.6 0 0.3 1 ~2 1 1.8 2 2.1 3Sep 2014 1.5 2 1.5 2 0.9 1 0.5 0 ~1 0 ~15.9 0 0.2 0 0.6 0 0.9 1 0.9 1Oct 2014 0.9 1 0.6 1 0.2 0 0.2 0 0.1 0 ~9.5 0 0.2 0 0.3 0 0.3 0 0.3 1Nov 2014 ~2 0 0.9 0 0.2 0 0.2 0 0.1 0 1.0 0 0.2 0 0.2 0 0.5 0 0.2 0Dec 2014 ~1.5 0 0.2 0 0.1 0 0.2 0 0.2 0 0.2 0 ~0.9 0 0.3 0 0.3 0 1.0 0Jan 2015 1.8 2 1.0 2 0.8 1 0.6 1 0.2 0 0.3 0 2.5 3 2.0 3 2.5 4 3.1 5Feb 2015 0.5 1 0.4 1 0.6 1 0.2 0 0.2 0 0.1 0 ~1.7 0 0.8 1 1.5 1 1.1 1Mar 2015 0.8 1 0.3 0 0.4 0 0.5 1 0.6 1 0.2 0 1.0 1 0.9 0 0.7 0 2.1 0Average 1.20 0.80 0.50 0.30 0.30 0.30 0.70 0.80 1.00 1.10
Min 0.50 0.20 0.10 0.00 0.10 0.10 0.20 0.20 0.30 0.20Max 2.60 2.00 0.90 3.00 2.00 15.90 2.50 2.00 2.50 3.10Total 17.00 19 10.50 17 6.70 8 8.00 2 7.30 1 28.80 0 9.80 7 11.00 8 12.70 12 14.70 16
Correlation 0.9615 0.4926 0.8113 0.7335 0.3539 0.0000 0.8553 0.6943 0.9307 0.7472- L01 to L10 are indicated Sites Deposition level which are located in west and South mg/cm2 Per month- Unusual valued are highlighted in black-bold underline.- The columns marked star shows dust event frequency from March 2014 to March 2015.
High magnitude of DEF was observed at the south for L09, and L10 during January and February 2015. In addition, more or
less the same values were found in the west for L01 and L02 during March, April and May 2015. The average dust
Page 4 / 8
deposition rates ranged from 0.3 mg/cm² (L04-L06, Table 3) to 1.2 mg/cm² (L01), which equals monthly field deposition rates of 30-120 kg/ha, while most stations recorded a maximum between 2 and 3 mg/cm² (Table 3). DEF values in compare with observation report from the sites are showed variation between the seasons. Monthly report from sites number L01, L03, L04, L07, L08, L09, L10 indicates strong correlation between DEF values and SDL. Correlation magnetite was indicated of 0.35, 0.49, and 0.69 for the SDL numbers L05, L02, and L08 respectively. Care should be taken to note that more correlative data between DEF and SDL were presented in April and May, 2014 for L01 and L02. In addition to the aforementioned relation between DEF and SDL, from January to February 2015 a high correlation was occurred at sites “L09-L10” (Table 4). In that case, only ICP-MS result from L10, L09, L02, and L01were taken into account.
In particular, approximate near zero results obtained for the Be, As, Se, and Cd, in the west and Be, Se, and Cd, in the south. Highest values of elements in the west, and south were obtained for Na, Mg, Al, Ca, K, V and Fe. As a good remark, elements level for Na, Mg, Al, Ca, K, V and
Fe, are exceeded in the southern part at the end of May 2014 and Mar 2015. Likelihood elements levels in the western part have occurred at the end of Feb and Mar 2015. Mainly, minimum values in the west are indicated for Cr, Mn, Ni, Zn, Ba, and Pb. In the same way, and in the south were obtained for Si, Cr, Co, Zn, Ba, and Pb.
Table 4: Regenerate data based on[23]
2015-01 2015-02 2014-03 2014-04
DEF-05- DEF-01- DEF-01- DEF-03-
3,1 2,1 0,8 2
Na 9,66 1,28 4,23 2,97Mg 103,60 37,52 86,01 62,64Al 30,98 21,02 39,32 34,33Si 2,20 2,27 11,58 3,62K 13,08 7,42 19,37 16,58Ca 235,30 147,70 694,62 554,38Mn 1,54 1,24 1,72 1,48Fe 75,92 56,99 92,57 77,23Sr 0,88 0,48 14,08 12,42K 13,08 7,42 19,37 16,58Zn 5,29 1,15 2,04 0,00Cr 0,24 0,15 0,43 0,17Fe 75,92 56,99 92,57 77,23Ni 0,38 0,21 0,44 0,36Mg 103,60 37,52 86,01 62,64Cu 0,16 0,10 0,22 0,08As 0,01 0,02 0,00 0,00Cd 0,00 0,00 0,00 0,00Pb 0,21 0,05 0,05 0,05Ba 0,36 0,49 0,51 0,34
mg/cm2 Per month
DateEvent Frequency
Elements µg/g
Gauge number
Geo
logy
ele
men
tsO
rgIn
dust
rySm
elte
rG
eige
r & C
oope
r, 20
10
(L10) (L02)
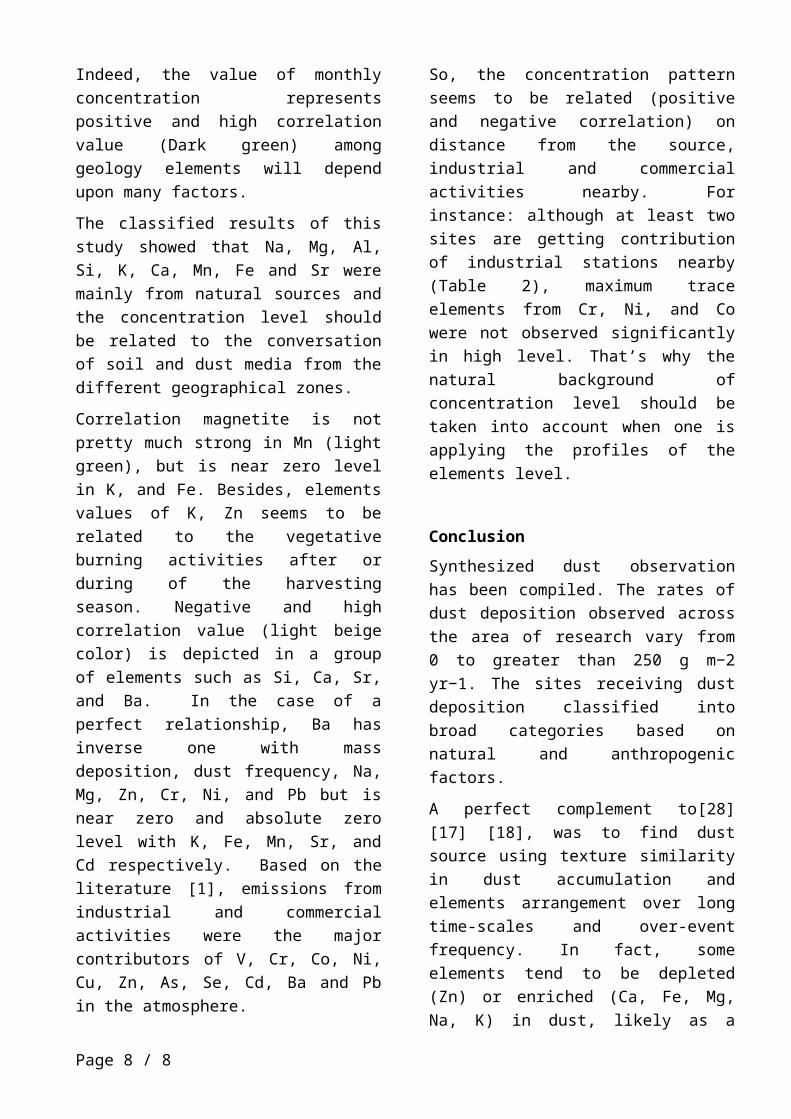
DEF WG Na Mg Al Si K Ca Mn Fe Sr K Zn Cr Fe Ni Mg Cu As Cd Pb BaDEF 1,00WG 0,81 1,00Na 0,83 0,55 1,00Mg 0,64 0,18 0,91 1,00Al 0,09 -0,50 0,29 0,64 1,00Si -0,52 -0,89 -0,11 0,29 0,75 1,00K 0,03 -0,56 0,20 0,56 0,99 0,75 1,00Ca -0,27 -0,77 -0,13 0,28 0,91 0,83 0,95 1,00Mn 0,14 -0,44 0,47 0,79 0,95 0,77 0,92 0,79 1,00Fe 0,05 -0,53 0,34 0,70 0,98 0,81 0,97 0,87 0,99 1,00Sr -0,32 -0,77 -0,26 0,13 0,84 0,75 0,89 0,98 0,67 0,78 1,00K 0,03 -0,56 0,20 0,56 0,99 0,75 1,00 0,95 0,92 0,97 0,89 1,00Zn 0,65 0,54 0,92 0,78 0,04 -0,13 -0,07 -0,36 0,29 0,14 -0,51 -0,07 1,00Cr -0,26 -0,66 0,25 0,58 0,75 0,93 0,72 0,67 0,87 0,85 0,55 0,72 0,26 1,00Fe 0,05 -0,53 0,34 0,70 0,98 0,81 0,97 0,87 0,99 1,00 0,78 0,97 0,14 0,85 1,00Ni 0,26 -0,34 0,53 0,83 0,96 0,68 0,93 0,77 0,99 0,98 0,66 0,93 0,31 0,79 0,98 1,00Mg 0,64 0,18 0,91 1,00 0,64 0,29 0,56 0,28 0,79 0,70 0,13 0,56 0,78 0,58 0,70 0,83 1,00Cu -0,09 -0,43 0,45 0,69 0,60 0,78 0,55 0,44 0,80 0,74 0,28 0,55 0,52 0,95 0,74 0,73 0,69 1,00As -0,09 0,48 -0,13 -0,47 -0,96 -0,62 -0,97 -0,93 -0,82 -0,89 -0,91 -0,97 0,19 -0,54 -0,89 -0,85 -0,47 -0,35 1,00Cd 0,30 0,74 0,30 -0,08 -0,81 -0,69 -0,87 -0,97 -0,62 -0,73 -1,00 -0,87 0,56 -0,47 -0,73 -0,61 -0,08 -0,19 0,90 1,00Pb 0,87 0,78 0,94 0,72 -0,04 -0,40 -0,13 -0,44 0,15 0,01 -0,56 -0,13 0,93 -0,04 0,01 0,22 0,72 0,22 0,17 0,58 1,00Ba -0,85 -0,68 -0,44 -0,28 -0,10 0,59 -0,08 0,10 0,03 0,04 0,06 -0,08 -0,14 0,51 0,04 -0,12 -0,28 0,48 0,25 0,00 -0,48 1,00
Organic Industry
Smelter
Geology elements Organic Industry Smelter
Page 5 / 8
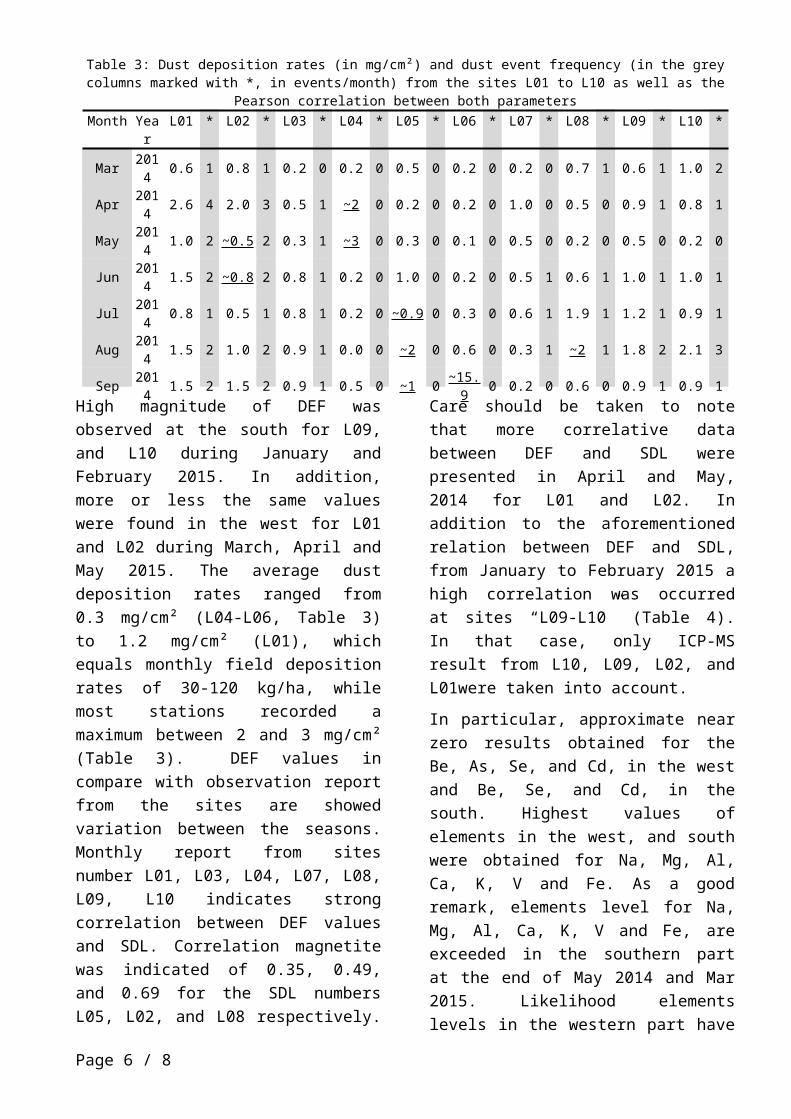
Figure 3: key indicating elements with associated sources for maximum Correlation in March - May 2014 and January - February 2015, regenerated from [23]
Page 6 / 8
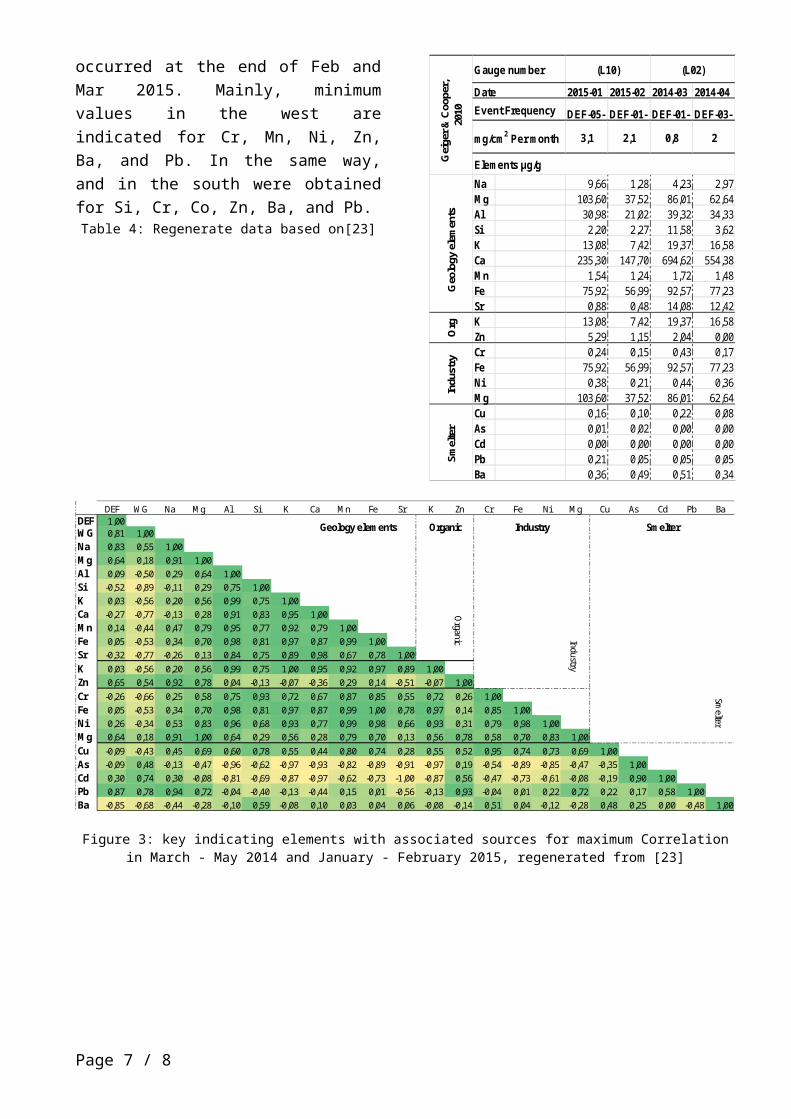
Indeed, the value of monthly concentration represents positive and high correlation value (Dark green) among geology elements will depend upon many factors.
The classified results of this study showed that Na, Mg, Al, Si, K, Ca, Mn, Fe and Sr were mainly from natural sources and the concentration level should be related to the conversation of soil and dust media from the different geographical zones.
Correlation magnetite is not pretty much strong in Mn (light green), but is near zero level in K, and Fe. Besides, elements values of K, Zn seems to be related to the vegetative burning activities after or during of the harvesting season. Negative and high correlation value (light beige color) is depicted in a group of elements such as Si, Ca, Sr, and Ba. In the case of a perfect relationship, Ba has inverse one with mass deposition, dust frequency, Na, Mg, Zn, Cr, Ni, and Pb but is near zero and absolute zero level with K, Fe, Mn, Sr, and Cd respectively. Based on the literature [1], emissions from industrial and commercial activities were the major contributors of V, Cr, Co, Ni, Cu, Zn, As, Se, Cd, Ba and Pb in the atmosphere.
So, the concentration pattern seems to be related (positive and negative correlation) on distance from the source, industrial and commercial activities nearby. For instance: although at least two sites are getting contribution of industrial stations nearby (Table 2), maximum trace elements from Cr, Ni, and Co were not observed significantly in high level. That’s why the natural background of concentration level should be taken into account when one is applying the profiles of the elements level.
Conclusion Synthesized dust observation has been compiled. The rates of dust deposition observed across the area of research vary from 0 to greater than 250 g m−2 yr−1. The sites receiving dust deposition classified
into broad categories based on natural and anthropogenic factors.
A perfect complement to[28] [17] [18], was to find dust source using texture similarity in dust accumulation and elements arrangement over long time-scales and over-event frequency. In fact, some elements tend to be depleted (Zn) or enriched (Ca, Fe, Mg, Na, K) in dust, likely as a result of soil weathering processes and anthropogenic factors. Dominant sources (DS) are the most source composition of dust which is carried by air and might be monitored and subjected to local code and regulation.
In addition to the fact, distance from the source region that dust is deposited also influences composition of dust. Last but not least, geological elements have been traveled all over the world and cannot be easily controlled and may subject to run long-term environmental protection projects and guidance on identifying national priorities. In brief, a look at the results in this profile and other relevant information is often worth and useful to soil scientist, and other parties for responding to the public concerns and preventive actions.
References [1] A. Geiger and J. Cooper, “Overview of
Airborne Metals Regulations, Exposure Limits, Health Effects, and Contemporary Research,” US Environ. Prot. Agency Accessed Accessed August, vol. 25, p. 2015, 2010.
[2] J. G. Calvert, “Glossary of atmospheric chemistry terms (Recommendations 1990),” Pure Appl. Chem., vol. 62, no. 11, pp. 2167–2219, 1990.
[3] R. Duce, “Sources, distributions, and fluxes of mineral aerosols and their relationship to climate,” Aerosol Forcing Clim., vol. 6, pp. 43–72, 1995.
[4] I. Tegen and A. A. Lacis, “Modeling of particle size distribution and its
Page 7 / 8
influence on the radiative properties of mineral dust aerosol,” J. Geophys. Res.- Ser.-, vol. 101, pp. 19–237, 1996.
[5] J. Wu, Y. Xu, C. Fu, R. Zhang, M. Dai, and Y. Zhu, “Comparison of simulating mineral dust aerosols in East Asia by two emission schemes,” China Particuology, vol. 4, no. 06, pp. 293–299, 2006.
[6] K. Carslaw et al., “A review of natural aerosol interactions and feedbacks within the Earth system,” Atmospheric Chem. Phys., vol. 10, no. 4, pp. 1701–1737, 2010.
[7] G. S. Okin, N. Mahowald, O. A. Chadwick, and P. Artaxo, “Impact of desert dust on the biogeochemistry of phosphorus in terrestrial ecosystems,” Glob. Biogeochem. Cycles, vol. 18, no. 2, 2004.
[8] N. M. Mahowald et al., “Atmospheric global dust cycle and iron inputs to the ocean,” Glob. Biogeochem. Cycles, vol. 19, no. 4, 2005.
[9] W. Tao, J. Chen, Z. Li, C. Wang, and C. Zhang, “Impact of aerosols on convective clouds and precipitation,” Rev. Geophys., vol. 50, no. 2, 2012.
[10] B. Roth and K. Okada, “On the modification of sea-salt particles in the coastal atmosphere,” Atmos. Environ., vol. 32, no. 9, pp. 1555–1569, 1998.
[11] S. A. Morman and G. S. Plumlee, “The role of airborne mineral dusts in human disease,” Aeolian Res., vol. 9, pp. 203–212, 2013.
[12] C. Opp, M. Groll, I. Aslanov, T. Lotz, and N. Vereshagina, “Aeolian dust deposition in the southern Aral Sea region (Uzbekistan): Ground-based monitoring results from the LUCA project,” Quat. Int., 2016.
[13] N. Ai and K. R. Polenske, “Socioeconomic impact analysis of yellow-dust storms: An approach and case study for Beijing,” Econ. Syst. Res., vol. 20, no. 2, pp. 187–203, 2008.
[14] A. Miri, H. Ahmadi, M. R. Ekhtesasi, N. Panjehkeh, and A. Ghanbari, “Environmental and socio‐economic impacts of dust storms in Sistan Region, Iran,” Int. J. Environ. Stud., vol. 66, no. 3, pp. 343–355, Jun. 2009.
[15] H. Gerivani, G. R. Lashkaripour, M. Ghafoori, and N. Jalali, “The source of dust storm in Iran: a case study based on geological information and rainfall data,” Carpathian J. Earth Environ. Sci., vol. 6, 2011.
[16] N. Basta and S. McGowen, “Evaluation of chemical immobilization treatments for reducing heavy metal transport in a smelter-contaminated soil,” Environ. Pollut., vol. 127, no. 1, pp. 73–82, 2004.
[17] T. Larssen and G. Carmichael, “Acid rain and acidification in China: the importance of base cation deposition,” Environ. Pollut., vol. 110, no. 1, pp. 89–102, 2000.
[18] D. R. Muhs and J. B. Benedict, “Eolian additions to late quaternary alpine soils, Indian peaks wilderness area, Colorado front range,” Arct. Antarct. Alp. Res., vol. 38, no. 1, pp. 120–130, 2006.
[19] W. Mertz, “The essential trace elements,” Science, vol. 213, no. 4514, pp. 1332–1338, 1981.
[20] A. Kabata-Pendias, Trace elements in soils and plants. CRC press, 2010.
[21] M. De la Guardia and S. Garrigues, Handbook of mineral elements in food. John Wiley & Sons, 2015.
[22] X. Wang, T. Sato, and B. Xing, “Size distribution and anthropogenic sources apportionment of airborne trace metals in Kanazawa, Japan,” Chemosphere, vol. 65, no. 11, pp. 2440–2448, 2006.
[23] A. Geiger and J. Cooper, “Overview of Airborne Metals Regulations, Exposure Limits, Health Effects, and Contemporary Research,” US Environ. Prot. Agency Accessed Accessed August, vol. 25, p. 2015, 2010.
Page 8 / 8
[24] K. Schepanski, B. Heinold, and I. Tegen, “Harmattan, Saharan heat low, and West African monsoon circulation: modulations on the Saharan dust outflow towards the North Atlantic,” Atmos Chem Phys, vol. 17, no. 17, pp. 10223–10243, Sep. 2017.
[25] M. C. Peel, B. L. Finlayson, and T. A. McMahon, “Updated world map of the Köppen-Geiger climate classification,” Hydrol. Earth Syst. Sci. Discuss., vol. 4, no. 2, pp. 439–473, 2007.
[26] IHS under license with ASTM, “Standard Terminology Relatingto Sampling and Analysis of Atmospheres,” IHS License ASTM, 2010.
[27] Beuth, “Wasserbeschaffenheit - Anwendung der induktiv gekoppelten Plasma-Massenspektrometrie (ICP-MS),” 2005-02, no. DIN EN ISO 17294-2, 2004.
[28] E. K. Miller, J. D. Blum, and A. J. Friedland, “Determination of soil exchangeable-cation loss and weathering rates using Sr isotopes,” Nature, vol. 362, no. 6419, pp. 438–441, 1993.
Page 9 / 8