Embed Size (px)
Citation preview
Int. J. Environ. Res., 4(2):237-246,Spring 2010ISSN: 1735-6865
237
Received 12 April 2008; Revised 17 July 2009; Accepted 27 Dec 2009
*Corresponding author E-mail:[email protected]
Determination of Endosulfan in Water Samples Using DispersiveLiquid-liquid Micro-extraction and Experimental Design for
Optimization
Shegefti, S. , Sereshti, H.* and Samadi, S.
School of Chemistry, College of Sciences, University of Tehran, Tehran, Iran
ABSTRACT: Water contamination due to the wide variety of pesticides used in agriculture is aglobal environmental pollution problem. In order to reach at sub-µgL-1 levels of detection, an efficientextraction technique is required. A simple, fast and economical method, dispersive liquid-liquidmicro extraction (DLLME), followed by gas chromatography-mass spectrometry was assessed fordetermining endosulfan in water samples. Experimental parameters which control the performanceof DLLME, such as extraction and disperser solvents type and their volumes, temperature, and saltaddition were studied by experimental design. The main factors affecting the extraction efficiency,volumes of disperser and extraction solvents, were optimized by response surface method. Underoptimum conditions, the method was linear over the range 0.1-50 µg/L. The enrichment factor andextraction recovery were 163.4 and 63.73, respectively. Correlation coefficient and limit of detection(LODs) are 0.9996, 20 ng/L, respectively.
Key words: Endosulfan, Pesticide, Dispersive liquid-liquid micro extraction, Gas chromatography- mass spectrometry, Experimental design
INTRODUCTIONEndosulfan is a chlorinated hydrocarbon
pesticide of the cyclodiene subgroup which acts asa contact poison in a wide variety of insects andmites. It can also be used as a wood preservative.Endosulfan (a mixture of two stereoisomer, α- andβ- endosulfan), as other organochlorine pesticides,persists in the environmental media and has theability of bioaccumulation and biomagnifying infood chains (Cabaleiro et al., 2008; Dutta and Dalal,2008). Exposure to endosulfan can occur throughinhalation, ingestion, eye or skin contact. It causescentral nervous system and respiratory effects inhumans. The greatest potential for adverse effectsof pesticides is through contamination of thehydrologic systems (El Bakouri et al.,2005).Endosulfan does not easily dissolve in water.It does stick to soil particles readily. Transport ofthis pesticide is most likely to occur if endosulfan isattached to soil particles in surface runoff. It has,however, been detected in well and surface waters
near areas of application at very lowconcentrations, and also in drinking waters dueto the fact that some of these waters are usedfor drinking (El Bakouri et al., 2005, Schäfer etal.,2008).Monitoring pesticide residues inwaters is important for human health protectionand environmental control.Endosulfan can beextracted from aqueous matrices using avariety of conventional techniques includingliquid–liquid extraction (LLE) [Brito et al. 2002,Columé et al. 2000, Sankararamakrishnan et al.,2005) and solid-phase extraction (SPE) ElBakouri et al., 2008). LLE technique is timeconsuming, expensive and hazardous to healthdue to the high volume of toxic solvents used.SPE needs less solvent, but is still timeconsuming, and often requires a concentrationstage that presents disadvantages such as lossesin the evaporation step, risks of contamination,and loss of sensitivity due to the injection of only asmall aliquot of the sample (Basheer et al., 2002).
238
Shegefti, S. et al.
Solid-phase micro extraction (SPME) (Li et al.,2003, Aguilar et al., 1998) and liquid-phase microextraction (LPME) using single drop solvent(López-Blanco et al., 2003, are more recentextraction procedures. For SPME, limited fiberlife, fiber breakage, stationary-phase bleeding,competitive absorption, and the relatively high costof fibers have been reported by users of SPME.Some disadvantages of LPME are fast stirringwhich may cause break up the organic solventdrop and air bubble formation; it is time-consumingand in most cases equilibrium is not attained evenafter a long time (Ahmadi et al., 2006).
Recently, a simple and rapid pre-concentrationand micro extraction method, dispersive liquid–liquid micro extraction (DLLME) is developed bysome researchers (Rezaee et al., 2006, Berijaniet al., 2006, Farajzadeh et al., 2007, Shokoufi etal., 2007, García- López et al., 2007, Fariña etal., 2007). Being independent of time is the mostimportant advantage of this method. Rapidity, highenrichment factor, low cost, simplicity and easeof use, requiring no conditioning (as is the casewith the fiber in the solid-phase micro extraction)and no need for instrument modification are someof the advantages of this method (RahnamaKozani et al., 2007).In this study, our objectivewas to develop, optimize and validate a simple andefficient extraction method, DLLME, combinedwith gas chromatography-mass spectrometry fordetermination of endosulfan in water samples. Theoptimization of the method was performed usingexperimental design to obtain the optimumconditions.
MATERIALS & METHODSAnalytical standard grade of Endosulfan was
purchased from Riedel-de Haën (Hannover,Germany). Other chemicals including chloro-benzene, chloroform, carbon tetrachloride, ethanol,methanol, acetone and sodium chloride with purityhigher than 99% were supplied by Merck chemicalcompany (Merck, Darmstadt, Germany). Stockstandard solutions (1000 mg/L) were prepared inmethanol. Intermediate standard solutions wereprepared by diluting the stock standard solutionsin methanol. Water samples were prepared byspiking different volumes of intermediate standardsolutions in bid stilled water. All solutions werestored at 4°C in dark. Surface, well and tap water
samples, used for evaluation of the method werecollected from Tehran (Iran). GC-MS analyseswere performed on a HP-6890 GC systemcoupled with a 5973 network mass selectivedetector and equipped with a HP5-MS capillaryfused silica column (60 m; 0.25 mm I.D.; 0.25 µmfilm thickness; methyl 5% phenyl polysiloxane).The oven temperature program initiated at 100ºC, held for 1 min then ramped at 30 °Cmin-1 to250 °C held for 3 min. A split/splitless injector wasused in the splitless mode (1 min) for DLLMEanalyses. Other operating conditions were asfollows: carrier gas, He (99.999%); with a flowrate of 1 mL/min; injector temperature, 220 ºC.Mass spectra were taken at 70 eV. Mass rangewas from mz-1 20–500 emu. Injection into GC-MS was carried out using a 1µL micro syringemodel Hamilton 7001. For investigation oftemperature effect, julabo U3 water bath(Seelbach, Germany) were used. Centrifugeswere performed by Hermle Z 200 A centrifugeinstrument (Wehingen, Germany).
Dispersive liquid-liquid micro extractionprocedure consists of two steps: (1) the injectionof an appropriate mixture of extraction anddisperser solvent into aqueous sample containinganalytes resulting in the formation of a cloudysolution. (2) The centrifugation of cloudy solution.After centrifugation, the determination of analytesin sediment phase can be performed byinstrumental analysis. Because of infinitely largesurface area between extraction solvent andaqueous sample, the equilibrium state is achievedquickly and extraction is independent of time. So,under optimum conditions, 2 mL of each samplewas placed in a 10 mL screw cap glass tube withconic bottom, and 0.5 mL of methanol (as dispersersolvent) containing 40 µL chloroform (as extractionsolvent) was injected rapidly into each samplesolution using a 1.00 mL syringe. The mixture wascentrifuged for 3 min at 4500 rpm using thecentrifuge. The dispersed fine particles ofextraction solvent separated and settled at thebottom of conical tube. 0.5 µL of the separatedphase was removed using a 1.0 µL micro syringeand injected into the GC-MS. Finally, the statisticalsoftware package, Design-Expert 7.1.3, was usedfor analysis of the experimental data and also toplot the response surface graphs.
Int. J. Environ. Res., 4(2):237-246,Spring 2010
239
RESULTS & DISCUSSIONIt is necessary to choose a suitable organic
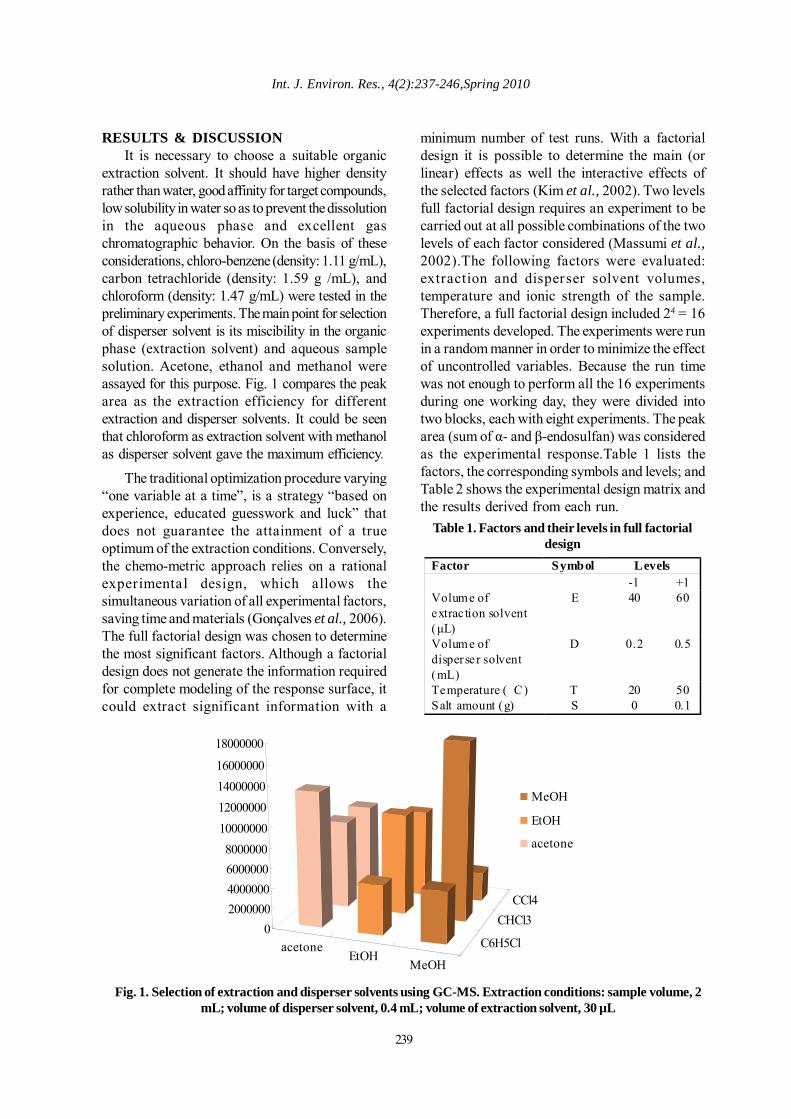
extraction solvent. It should have higher densityrather than water, good affinity for target compounds,low solubility in water so as to prevent the dissolutionin the aqueous phase and excellent gaschromatographic behavior. On the basis of theseconsiderations, chloro-benzene (density: 1.11 g/mL),carbon tetrachloride (density: 1.59 g /mL), andchloroform (density: 1.47 g/mL) were tested in thepreliminary experiments. The main point for selectionof disperser solvent is its miscibility in the organicphase (extraction solvent) and aqueous samplesolution. Acetone, ethanol and methanol wereassayed for this purpose. Fig. 1 compares the peakarea as the extraction efficiency for differentextraction and disperser solvents. It could be seenthat chloroform as extraction solvent with methanolas disperser solvent gave the maximum efficiency.
The traditional optimization procedure varying“one variable at a time”, is a strategy “based onexperience, educated guesswork and luck” thatdoes not guarantee the attainment of a trueoptimum of the extraction conditions. Conversely,the chemo-metric approach relies on a rationalexperimental design, which allows thesimultaneous variation of all experimental factors,saving time and materials (Gonçalves et al., 2006).The full factorial design was chosen to determinethe most significant factors. Although a factorialdesign does not generate the information requiredfor complete modeling of the response surface, itcould extract significant information with a
minimum number of test runs. With a factorialdesign it is possible to determine the main (orlinear) effects as well the interactive effects ofthe selected factors (Kim et al., 2002). Two levelsfull factorial design requires an experiment to becarried out at all possible combinations of the twolevels of each factor considered (Massumi et al.,2002).The following factors were evaluated:extraction and disperser solvent volumes,temperature and ionic strength of the sample.Therefore, a full factorial design included 24 = 16experiments developed. The experiments were runin a random manner in order to minimize the effectof uncontrolled variables. Because the run timewas not enough to perform all the 16 experimentsduring one working day, they were divided intotwo blocks, each with eight experiments. The peakarea (sum of α- and β-endosulfan) was consideredas the experimental response.Table 1 lists thefactors, the corresponding symbols and levels; andTable 2 shows the experimental design matrix andthe results derived from each run.
CCl4CHCl3
C6H5Cl
MeOHEtOH
acetone0
2000000400000060000008000000
10000000120000001400000016000000
18000000
MeOH
EtOH
acetone
Fig. 1. Selection of extraction and disperser solvents using GC-MS. Extraction conditions: sample volume, 2mL; volume of disperser solvent, 0.4 mL; volume of extraction solvent, 30 µL
LevelsSymbol Factor+1 -1 60 40 E Volume of
extrac tion solvent (µL)
0.5 0.2 D Volume of disperse r solvent (mL)
50 20 T Temperature ( C) 0.1 0 S Salt amount (g)
Table 1. Factors and their levels in full factorialdesign
240
trrsststreet
Determination of endosulfan in water samples
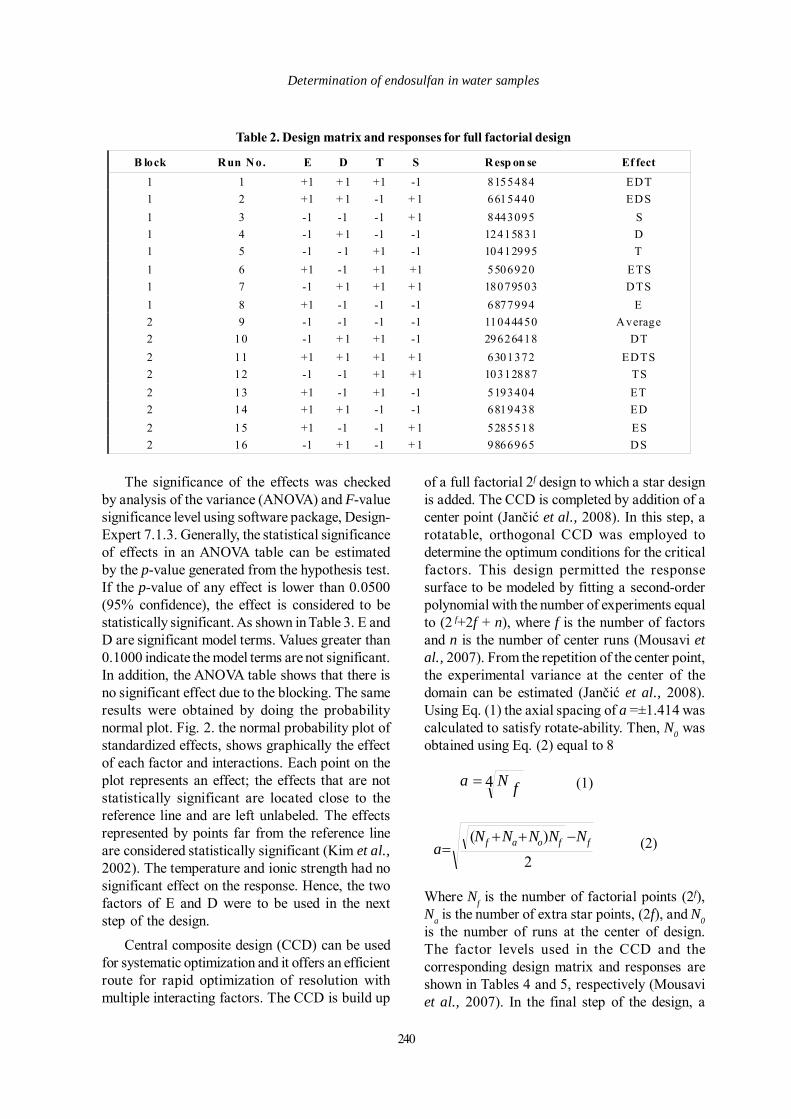
Table 2. Design matrix and responses for full factorial design
B lock Run No. E D T S Resp on se Ef fect
1 1 +1 + 1 +1 -1 8155484 EDT 1 2 +1 + 1 -1 + 1 6615440 EDS 1 3 -1 -1 -1 + 1 8443095 S 1 4 -1 + 1 -1 -1 12415831 D 1 5 -1 - 1 +1 -1 10412995 T 1 6 +1 -1 +1 +1 5506920 ETS 1 7 -1 + 1 +1 + 1 18079503 DTS 1 8 +1 -1 -1 -1 6877994 E 2 9 -1 -1 -1 -1 11044450 Average 2 10 -1 + 1 +1 -1 29626418 DT 2 11 +1 + 1 +1 + 1 6301372 EDTS 2 12 -1 -1 +1 +1 10312887 TS 2 13 +1 -1 +1 -1 5193404 ET 2 14 +1 + 1 -1 -1 6819438 ED 2 15 +1 -1 -1 + 1 5285518 ES 2 16 -1 + 1 -1 + 1 9866965 DS
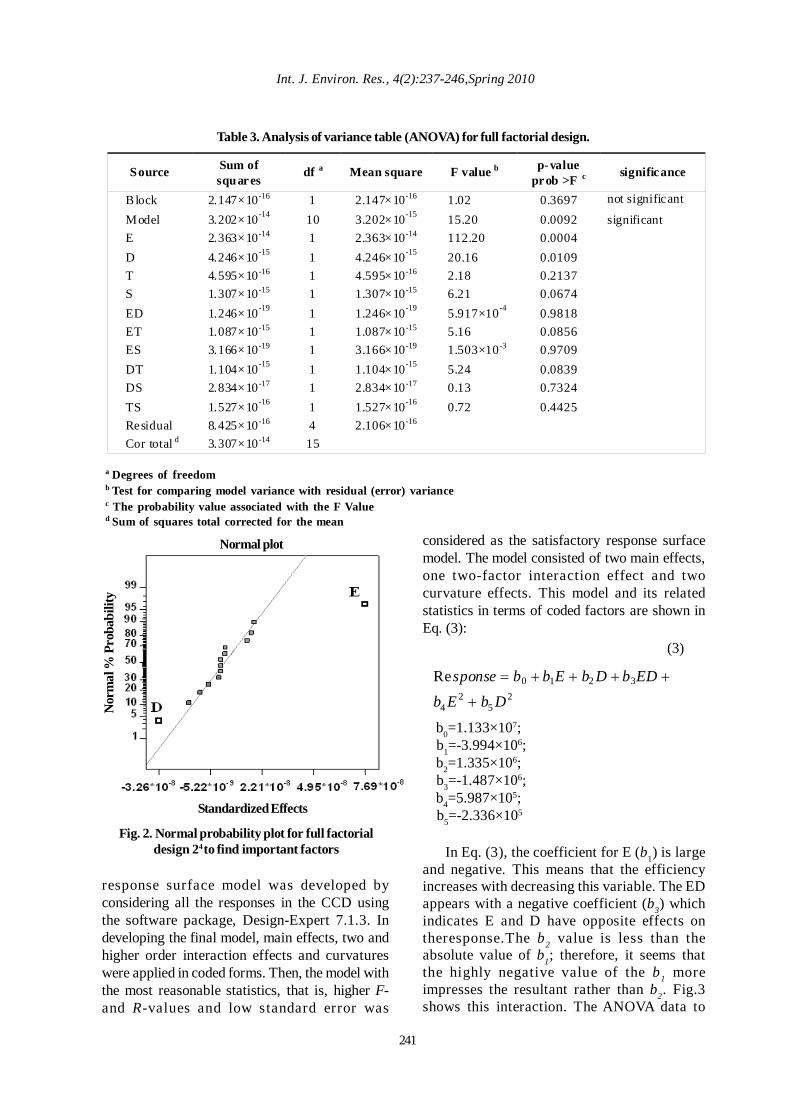
The significance of the effects was checked
by analysis of the variance (ANOVA) and F-valuesignificance level using software package, Design-Expert 7.1.3. Generally, the statistical significanceof effects in an ANOVA table can be estimatedby the p-value generated from the hypothesis test.If the p-value of any effect is lower than 0.0500(95% confidence), the effect is considered to bestatistically significant. As shown in Table 3. E andD are significant model terms. Values greater than0.1000 indicate the model terms are not significant.In addition, the ANOVA table shows that there isno significant effect due to the blocking. The sameresults were obtained by doing the probabilitynormal plot. Fig. 2. the normal probability plot ofstandardized effects, shows graphically the effectof each factor and interactions. Each point on theplot represents an effect; the effects that are notstatistically significant are located close to thereference line and are left unlabeled. The effectsrepresented by points far from the reference lineare considered statistically significant (Kim et al.,2002). The temperature and ionic strength had nosignificant effect on the response. Hence, the twofactors of E and D were to be used in the nextstep of the design.
Central composite design (CCD) can be usedfor systematic optimization and it offers an efficientroute for rapid optimization of resolution withmultiple interacting factors. The CCD is build up
of a full factorial 2f design to which a star designis added. The CCD is completed by addition of acenter point (Jančić et al., 2008). In this step, arotatable, orthogonal CCD was employed todetermine the optimum conditions for the criticalfactors. This design permitted the responsesurface to be modeled by fitting a second-orderpolynomial with the number of experiments equalto (2 f+2f + n), where f is the number of factorsand n is the number of center runs (Mousavi etal., 2007). From the repetition of the center point,the experimental variance at the center of thedomain can be estimated (Jančić et al., 2008).Using Eq. (1) the axial spacing of a =±1.414 wascalculated to satisfy rotate-ability. Then, N0 wasobtained using Eq. (2) equal to 8
(1)4 fNa =
2)( ffoaf NNNNN
a−++
= (2)
Where Nf is the number of factorial points (2f),Na is the number of extra star points, (2f), and N0is the number of runs at the center of design.The factor levels used in the CCD and thecorresponding design matrix and responses areshown in Tables 4 and 5, respectively (Mousaviet al., 2007). In the final step of the design, a
Int. J. Environ. Res., 4(2):237-246,Spring 2010
241
Fig. 2. Normal probability plot for full factorialdesign 24 to find important factors
Source Sum of squares
df a Mean square F value b p-value prob >F c
significance
Block 2.147×10⁻¹⁶ 1 2.147×10⁻¹⁶ 1.02 0.3697 not significant
Model 3.202×10⁻¹⁴ 10 3.202×10⁻¹⁵ 15.20 0.0092 significant E 2.363×10⁻¹⁴ 1 2.363×10⁻¹⁴ 112.20 0.0004 D 4.246×10⁻¹⁵ 1 4.246×10⁻¹⁵ 20.16 0.0109 T 4.595×10⁻¹⁶ 1 4.595×10⁻¹⁶ 2.18 0.2137 S 1.307×10⁻¹⁵ 1 1.307×10⁻¹⁵ 6.21 0.0674 ED 1.246×10⁻¹⁹ 1 1.246×10⁻¹⁹ 5.917×10⁻⁴ 0.9818 ET 1.087×10⁻¹⁵ 1 1.087×10⁻¹⁵ 5.16 0.0856 ES 3.166×10⁻¹⁹ 1 3.166×10⁻¹⁹ 1.503×10⁻³ 0.9709 DT 1.104×10⁻¹⁵ 1 1.104×10⁻¹⁵ 5.24 0.0839 DS 2.834×10⁻¹⁷ 1 2.834×10⁻¹⁷ 0.13 0.7324 TS 1.527×10⁻¹⁶ 1 1.527×10⁻¹⁶ 0.72 0.4425 Residual 8.425×10⁻¹⁶ 4 2.106×10⁻¹⁶ Cor total d 3.307×10⁻¹⁴ 15
Table 3. Analysis of variance table (ANOVA) for full factorial design.
response surface model was developed byconsidering all the responses in the CCD usingthe software package, Design-Expert 7.1.3. Indeveloping the final model, main effects, two andhigher order interaction effects and curvatureswere applied in coded forms. Then, the model withthe most reasonable statistics, that is, higher F-and R-values and low standard error was
Normal plot
Nor
mal
% P
roba
bilit
y
Standardized Effects
a Degrees of freedomb Test for comparing model variance with residual (error) variancec The probability value associated with the F Valued Sum of squares total corrected for the mean
considered as the satisfactory response surfacemodel. The model consisted of two main effects,one two-factor interaction effect and twocurvature effects. This model and its relatedstatistics in terms of coded factors are shown inEq. (3):
b0=1.133×10⁷; b1=-3.994×10⁶; b2=1.335×10⁶; b3=-1.487×10⁶; b4=5.987×10⁵; b5=-2.336×10⁵
In Eq. (3), the coefficient for E (b1) is largeand negative. This means that the efficiencyincreases with decreasing this variable. The EDappears with a negative coefficient (b3) whichindicates E and D have opposite effects ontheresponse.The b2 value is less than theabsolute value of b1; therefore, it seems thatthe highly negative value of the b1 moreimpresses the resultant rather than b2. Fig.3shows this interaction. The ANOVA data to
(3)
25
24
3210ReDbEb
EDbDbEbbsponse+
++++=
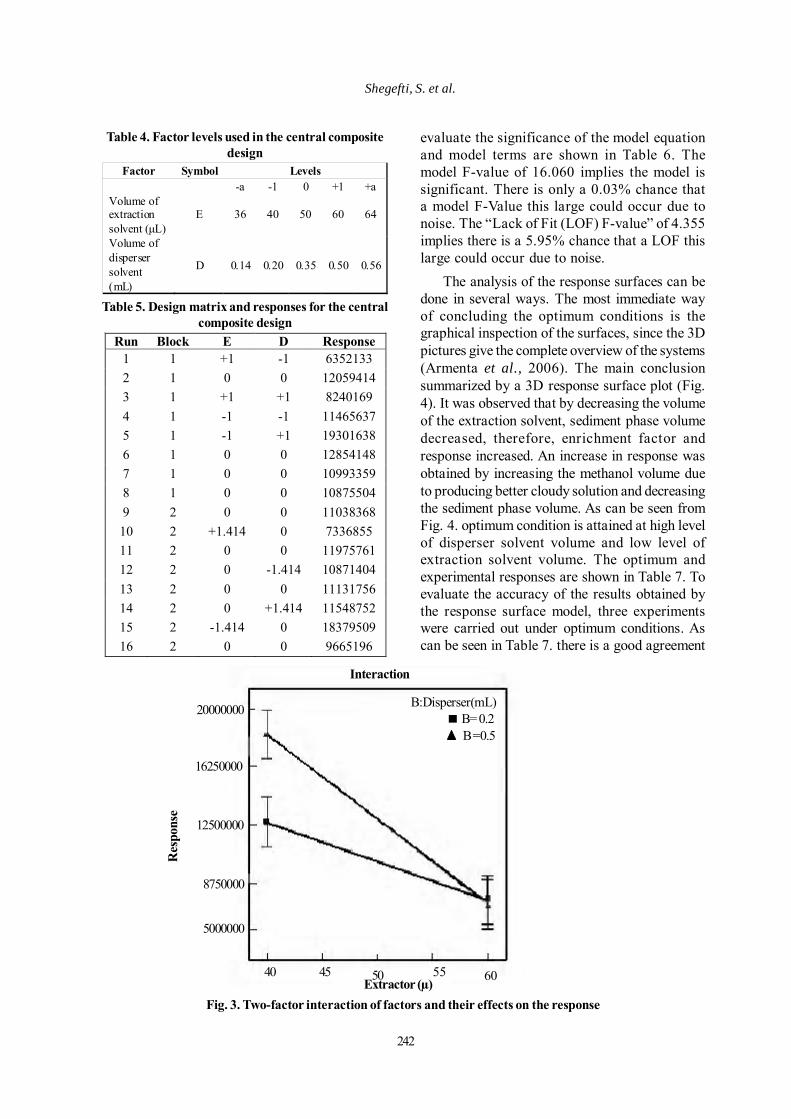
Table 4. Factor levels used in the central compositedesign
Factor Symbol Levels -a -1 0 +1 +a Volume of extraction solvent (µL)
E 36 40 50 60 64
Volume of disperser solvent (mL)
D 0.14 0.20 0.35 0.50 0.56
Table 5. Design matrix and responses for the centralcomposite design
Run Block E D Response 1 1 +1 -1 6352133 2 1 0 0 12059414 3 1 +1 +1 8240169 4 1 -1 -1 11465637 5 1 -1 +1 19301638 6 1 0 0 12854148 7 1 0 0 10993359 8 1 0 0 10875504 9 2 0 0 11038368 10 2 +1.414 0 7336855 11 2 0 0 11975761 12 2 0 -1.414 10871404 13 2 0 0 11131756 14 2 0 +1.414 11548752 15 2 -1.414 0 18379509 16 2 0 0 9665196
evaluate the significance of the model equationand model terms are shown in Table 6. Themodel F-value of 16.060 implies the model issignificant. There is only a 0.03% chance thata model F-Value this large could occur due tonoise. The “Lack of Fit (LOF) F-value” of 4.355implies there is a 5.95% chance that a LOF thislarge could occur due to noise.
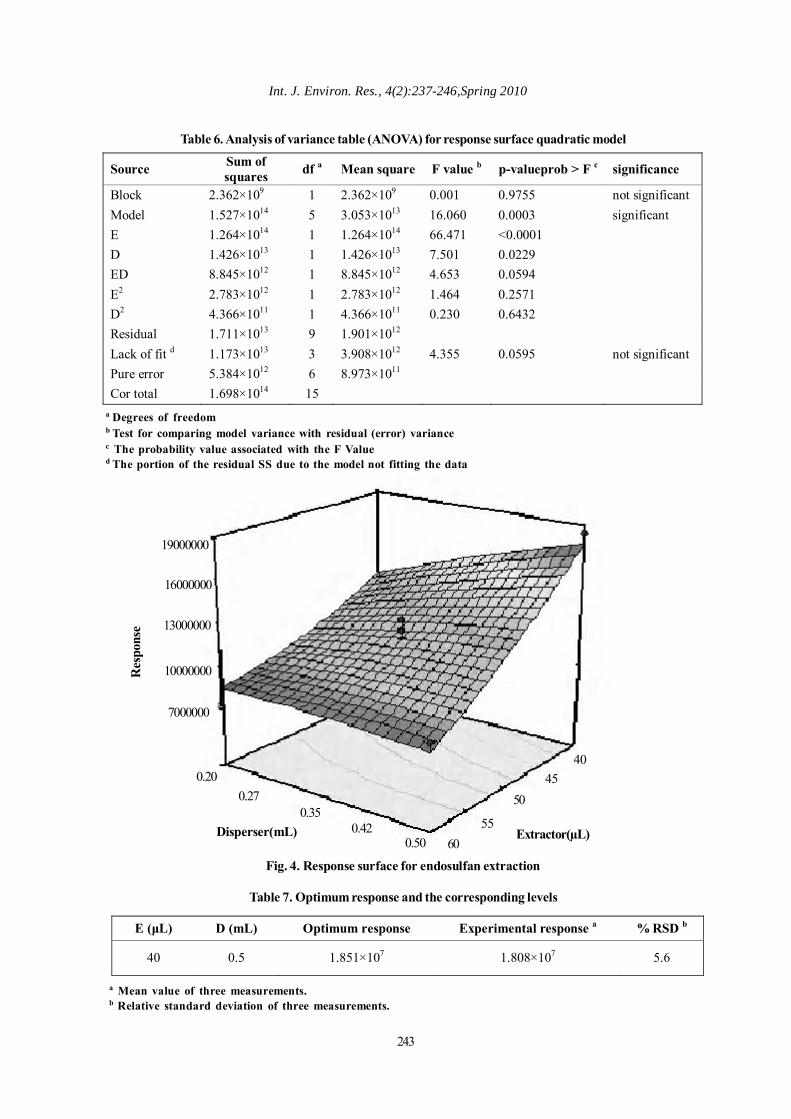
The analysis of the response surfaces can bedone in several ways. The most immediate wayof concluding the optimum conditions is thegraphical inspection of the surfaces, since the 3Dpictures give the complete overview of the systems(Armenta et al., 2006). The main conclusionsummarized by a 3D response surface plot (Fig.4). It was observed that by decreasing the volumeof the extraction solvent, sediment phase volumedecreased, therefore, enrichment factor andresponse increased. An increase in response wasobtained by increasing the methanol volume dueto producing better cloudy solution and decreasingthe sediment phase volume. As can be seen fromFig. 4. optimum condition is attained at high levelof disperser solvent volume and low level ofextraction solvent volume. The optimum andexperimental responses are shown in Table 7. Toevaluate the accuracy of the results obtained bythe response surface model, three experimentswere carried out under optimum conditions. Ascan be seen in Table 7. there is a good agreement
B:Disperser(mL)B= 0.2B =0.5
20000000
16250000
12500000
8750000
5000000
40 45 6050 55
Res
pons
e
Interaction
Extractor (µ)Fig. 3. Two-factor interaction of factors and their effects on the response
Shegefti, S. et al.
242
243
Int. J. Environ. Res., 4(2):237-246,Spring 2010
Table 6. Analysis of variance table (ANOVA) for response surface quadratic model
Source Sum of squares df a Mean square F value b p-valueprob > F c significance
Block 2.362×10⁹ 1 2.362×10⁹ 0.001 0.9755 not significant Model 1.527×10¹⁴ 5 3.053×10¹³ 16.060 0.0003 significant E 1.264×10¹⁴ 1 1.264×10¹⁴ 66.471 <0.0001 D 1.426×10¹³ 1 1.426×10¹³ 7.501 0.0229 ED 8.845×10¹² 1 8.845×10¹² 4.653 0.0594 E2 2.783×10¹² 1 2.783×10¹² 1.464 0.2571 D2 4.366×10¹¹ 1 4.366×10¹¹ 0.230 0.6432 Residual 1.711×10¹³ 9 1.901×10¹² Lack of fit d 1.173×10¹³ 3 3.908×10¹² 4.355 0.0595 not significant Pure error 5.384×10¹² 6 8.973×10¹¹ Cor total 1.698×10¹⁴ 15
a Degrees of freedomb Test for comparing model variance with residual (error) variancec The probability value associated with the F Valued The portion of the residual SS due to the model not fitting the data
Fig. 4. Response surface for endosulfan extraction
0.50
Res
pons
e
19000000
16000000
13000000
10000000
7000000
0.200.27
0.350.42
40 45
50
5560
Extractor(µL)Disperser(mL)
Table 7. Optimum response and the corresponding levels
E (µL) D (mL) Optimum response Experimental response a % RSD b
40 0.5 1.851×10⁷ 1.808×10⁷ 5.6
a Mean value of three measurements.b Relative standard deviation of three measurements.
Determination of endosulfan in water samples
Where ER, Vsed and Vaq are the extractionrecovery, volume of sediment phase and volumeof aqueous sample, respectively.
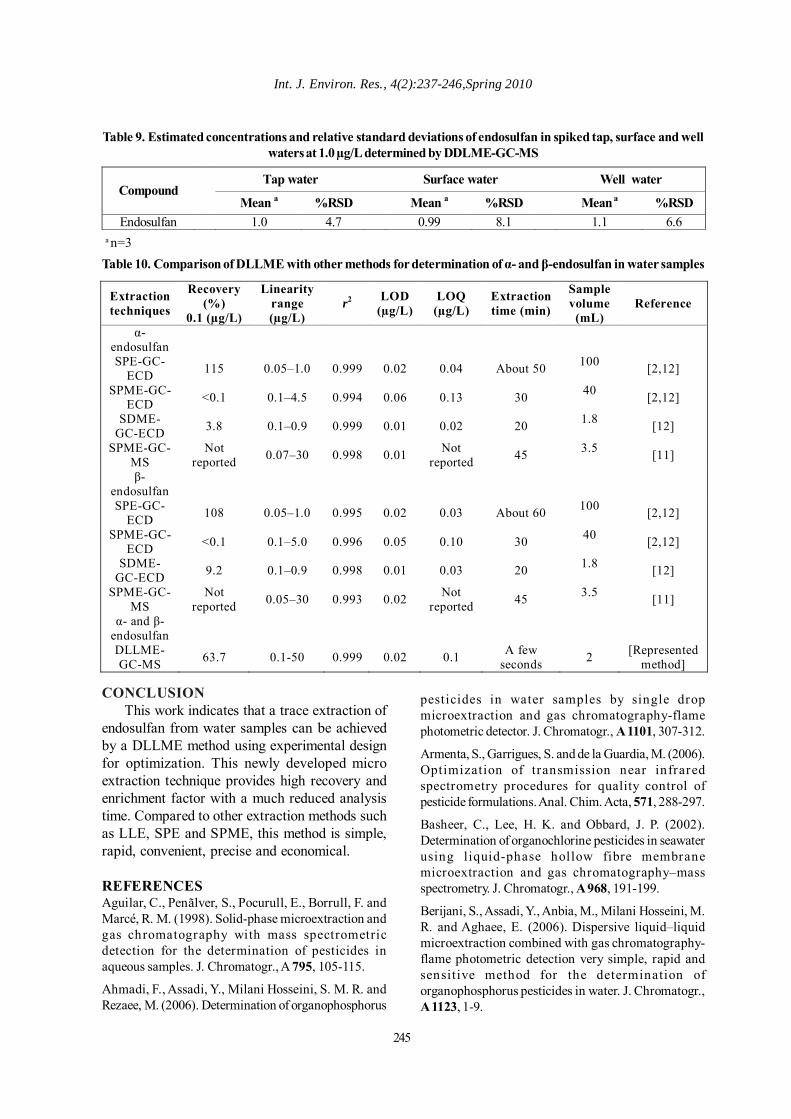
The performance of DLLME for real sampleswas tested in tap, well and surface water samples(Tehran, Iran). The results showed that they werefree of endosulfan contamination. These sampleswere spiked with endosulfan standards at 1 µgL-1
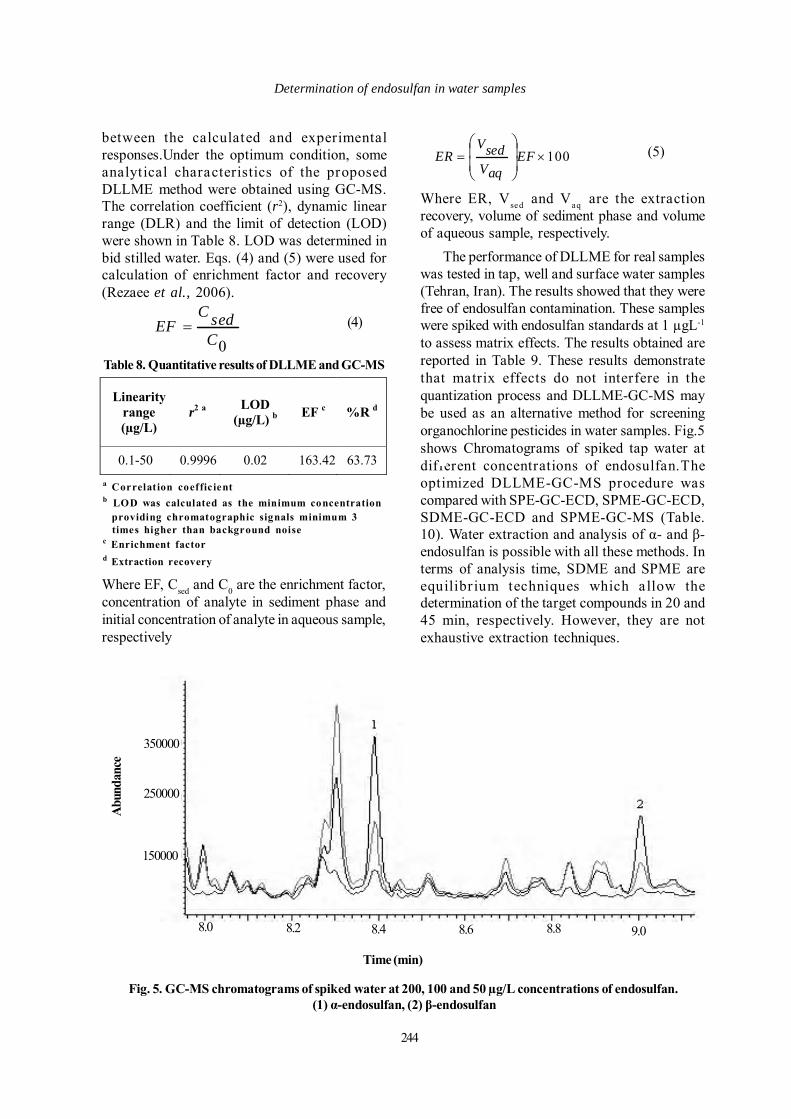
to assess matrix effects. The results obtained arereported in Table 9. These results demonstratethat matrix effects do not interfere in thequantization process and DLLME-GC-MS maybe used as an alternative method for screeningorganochlorine pesticides in water samples. Fig.5shows Chromatograms of spiked tap water atdifferent concentrations of endosulfan.Theoptimized DLLME-GC-MS procedure wascompared with SPE-GC-ECD, SPME-GC-ECD,SDME-GC-ECD and SPME-GC-MS (Table.10). Water extraction and analysis of α- and β-endosulfan is possible with all these methods. Interms of analysis time, SDME and SPME areequilibr ium techniques which allow thedetermination of the target compounds in 20 and45 min, respectively. However, they are notexhaustive extraction techniques.
Fig. 5. GC-MS chromatograms of spiked water at 200, 100 and 50 µg/L concentrations of endosulfan. (1) α-endosulfan, (2) β-endosulfan
Abu
ndan
ce
Time (min)
between the calculated and experimentalresponses.Under the optimum condition, someanalytical characteristics of the proposedDLLME method were obtained using GC-MS.The correlation coefficient (r2), dynamic linearrange (DLR) and the limit of detection (LOD)were shown in Table 8. LOD was determined inbid stilled water. Eqs. (4) and (5) were used forcalculation of enrichment factor and recovery(Rezaee et al., 2006).
100×= ⎟⎟⎠
⎞⎜⎜⎝
⎛EF
aqVsedV
ER (5)
0CsedC
EF = (4)
Linearity range (µg/L)
r2 a LOD (µg/L) b EF c %R d
0.1-50 0.9996 0.02 163.42 63.73
Table 8. Quantitative results of DLLME and GC-MS
a Correlation coeffic ientb LOD was calculated as the minimum concentration providing chromatographic signals minimum 3 times higher than background noisec Enrichment factord Extraction recovery
Where EF, Csed and C0 are the enrichment factor,concentration of analyte in sediment phase andinitial concentration of analyte in aqueous sample,respectively
350000
250000
150000
8.0 8.2 8.4 8.6 8.8 9.0
244
Int. J. Environ. Res., 4(2):237-246,Spring 2010
Table 10. Comparison of DLLME with other methods for determination of α- and β-endosulfan in water samples
Extraction techniques
Recovery (%)
0.1 (µg/L)
Linearity range (µg/L)
r2 LOD (µg/L)
LOQ (µg/L)
Extraction time (min)
Sample volume
(mL) Reference
α-endosulfan
SPE-GC-ECD 115 0.05–1.0 0.999 0.02 0.04 About 50 100 [2,12]
SPME-GC-ECD <0.1 0.1–4.5 0.994 0.06 0.13 30 40 [2,12]
SDME-GC-ECD 3.8 0.1–0.9 0.999 0.01 0.02 20 1.8 [12]
SPME-GC- MS
Not reported 0.07–30 0.998 0.01 Not
reported 45 3.5 [11]
β-endosulfan
SPE-GC-ECD 108 0.05–1.0 0.995 0.02 0.03 About 60 100 [2,12]
SPME-GC-ECD <0.1 0.1–5.0 0.996 0.05 0.10 30 40 [2,12]
SDME-GC-ECD 9.2 0.1–0.9 0.998 0.01 0.03 20 1.8 [12]
SPME-GC- MS
Not reported 0.05–30 0.993 0.02 Not
reported 45 3.5 [11]
α- and β-endosulfan
DLLME-GC-MS 63.7 0.1-50 0.999 0.02 0.1 A few
seconds 2 [Represented method]
CONCLUSION
This work indicates that a trace extraction ofendosulfan from water samples can be achievedby a DLLME method using experimental designfor optimization. This newly developed microextraction technique provides high recovery andenrichment factor with a much reduced analysistime. Compared to other extraction methods suchas LLE, SPE and SPME, this method is simple,rapid, convenient, precise and economical.
REFERENCESAguilar, C., Penãlver, S., Pocurull, E., Borrull, F. andMarcé, R. M. (1998). Solid-phase microextraction andgas chromatography with mass spectrometricdetection for the determination of pesticides inaqueous samples. J. Chromatogr., A 795, 105-115.
Ahmadi, F., Assadi, Y., Milani Hosseini, S. M. R. andRezaee, M. (2006). Determination of organophosphorus
pesticides in water samples by single dropmicroextraction and gas chromatography-flamephotometric detector. J. Chromatogr., A 1101, 307-312.
Armenta, S., Garrigues, S. and de la Guardia, M. (2006).Optimization of transmission near infraredspectrometry procedures for quality control ofpesticide formulations. Anal. Chim. Acta, 571, 288-297.
Basheer, C., Lee, H. K. and Obbard, J. P. (2002).Determination of organochlorine pesticides in seawaterusing liquid-phase hollow fibre membranemicroextraction and gas chromatography–massspectrometry. J. Chromatogr., A 968, 191-199.
Berijani, S., Assadi, Y., Anbia, M., Milani Hosseini, M.R. and Aghaee, E. (2006). Dispersive liquid–liquidmicroextraction combined with gas chromatography-flame photometric detection very simple, rapid andsensitive method for the determination oforganophosphorus pesticides in water. J. Chromatogr.,A 1123, 1-9.
Table 9. Estimated concentrations and relative standard deviations of endosulfan in spiked tap, surface and wellwaters at 1.0 µg/L determined by DDLME-GC-MS
Tap water Surface water Well water Compound
Mean a %RSD Mean a %RSD Mean a %RSD Endosulfan 1.0 4.7 0.99 8.1 1.1 6.6
a n=3
245
Brito, N. M., Navickiene, S., Polese, L., Jardim, E. F. G.,Abakerli, R. B. and Ribeiro, M. L. (2002). Determinationof pesticide residues in coconut water by liquid– liquidextraction and gas chromatography with electron-capture plus thermionic specific detection and solid-phase extraction and high-performance liquidchromatography with ultraviolet detection. J.Chromatogr., A 957, 201-209.
Cabaleiro, T., Caride, A., Romero, A. and Lafuente, A.(2008). Effects of in utero and lactational exposure toendosulfan in prefrontal cortex of male rats. Toxicol.Lett., 176, 58-67.
Columé, A., Cárdenas, S., Gallego, M. and Valcárcel,M. (2000). Simplified method for the determination ofchlorinated fungicides and insecticides in fruits by gaschromatography. J. Chromatogr. A 882, 193-203.
Dutta, H. M. and Dalal, R. (2008). The Effect ofEndosulfan on the Ovary of Bluegill Sunfish: AHistopathological Study ( Lepomis macrochirus sp.).Int. J. Environ. Res., 2(3), 215-225.
El Bakouri, H., Ouassini, A., Morillo, J. and Usero, J. (2008).Pesticides in ground water beneath Loukkos perimeter,Northwest Morocco. J. Hydrology, 348, 270-278.
El Bakouri, H., Palacios-Santander, J. M., Cubillana-Aguilera, L., Ouassini, A., Naranjo-Rodríguez, I. andHidalgo-Hidalgo de Cisneros,J.L.(2005). Electrochemicalanalysis of endosulfan using a C18-modified carbon-paste electrode. Chemosphere, 60, 1565-1571.
Farajzadeh, M. A., Bahram, M. and Jönsson, J. A. (2007).Dispersive liquid–liquid microextraction followed byhigh-performance liquid chromatography-diode arraydetection as an efficient and sensitive technique fordetermination of antioxidants. Anal. Chim. Acta, 591, 69-79.
Fariña, L., Boido, E., Carrau, F. and Dellacassa, E. (2007).Determination of volatile phenols in red wines bydispersive liquid–liquid microextraction and gaschromatography–mass spectrometry detection. J.Chromatogr., A 1157, 46-50.
García- López, M., Rodríguez, I. and Cela, R. (2007).Development of a dispersive liquid–liquidmicroextraction method for organophosphorus flameretardants and plastizicers determination in watersamples. J. Chromatogr., A 1166, 9-15.
Gonçalves, C., Carvalho, J. J., Azenha, M. A. andAlpendurada, M. F. (2006). Optimization of supercriticalfluid extraction of pesticide residues in soil by means ofcentral composite design and analysis by gaschromatography–tandem mass spectrometry. J.Chromatogr., A 1110, 6-14.
Jančić, B., Medenica, M., Ivanović, D., Janković, S. andMalenović, A. (2008). Monitoring of fosinopril sodium
impurities by liquid chromatography–mass spectrometryincluding the neural networks in method evaluation. J.Chromatogr., A 1189, 366-373.
Kim, H. K., Kim, J. G. and Hong, J. W. (2002).Determination of key variables affecting surfaceproperties of UV curable coatings using experimentaldesign. Polym. Test., 21, 417-424.
Li, H. P., Li, G. C. and Jen, J. F. (2003). Determination oforganochlorine pesticides in water using microwaveassisted headspace solid-phase microextraction andgas chromatography J. Chromatogr. A 1012, 129-137.
López-Blanco, M. C., Blanco-Cid, S., Cancho-Grande,B. and Simal-Gándara, J. (2003). A pplication of single-drop microextraction and comparison with solid-phasemicroextraction and solid-phase extraction for thedetermination of α- and β-endosulfan in water samplesby gas chromatography–electron-capture detection.J. Chromatogr., A 984, 245-252.
Massumi, A., Najafi, N. M. and Barzegari, H. (2002).Speciation of Cr(VI)/Cr(III) in environmental waters byfluorimetric method using central composite, full andfractional factorial design. Microchem. J., 72, 93-101.
Mousavi, M., Noroozian, E., Jalali-Heravi, M. andMollahosseini, A. (2007). Optimization of solid-phasemicroextraction of volatile phenols in water by apolyaniline-coated Pt-fiber using experimental design.Anal. Chim. Acta, 581, 71-77.Rahnama Kozani, R., Assadi, Y., Shemirani, F., MilaniHosseini, M. R. and Jamali, M. R. (2007). Part-per-trilliondetermination of chlorobenzenes in water usingdispersive liquid–liquid microextraction combined gaschromatography–electron capture detection. Talanta,72, 387-393.
Rezaee, M., Assadi, Y., Milani Hosseini, M. R., Aghaee,E., Ahmadi, F. and Berijani, S. (2006). Determination oforganic compounds in water using dispersive liquid–liquid microextraction. J. Chromatogr., A 1116, 1-9.
Sankararamakrishnan, N., Sharma, A. K. and Sanghi, R.(2005). Organochlorine and organophosphorouspesticide residues in ground water and surfacewatersof Kanpur, Uttar Pradesh, India. Environ. Int.,31, 113-120.Schäfer, R. B., Mueller, R., Brack, W., Wenzel, K. D.,Streck, G., Ruck, W. and Liess, M. (2008). Determinationof 10 particle-associated multiclass polar and semi-polar pesticides from small streams using acceleratedsolvent extraction. Chemosphere, 70, 1952-1960.Shokoufi, N., Shemirani, F. and Assadi, Y. (2007). Fiberoptic-linear array detection spectrophotometry incombination with dispersive liquid–liquidmicroextraction for simultaneous preconcentration anddetermination of palladium and cobalt. Anal. Chim.Acta, 597, 349-356.
Shegefti, S. et al.
246