Embed Size (px)
Citation preview

Determination of forces in high speed blanking using FEM and experiments
Soumya Subramonian1, Taylan Altan1, Craig Campbell2, Bogdan Ciocirlan2
1 Center for Precision Forming, The Ohio State University, Columbus, OH, 43210, USA 2 Tyco Electronics Corporation, a TE Connectivity Ltd. Company, 2901 Fulling Mill Rd, Middletown PA 17057, USA
The increasing demand for micro-formed and stamped parts such as connectors in the electronic industry
is forcing manufacturers to push the speed limit of conventional press technologies to improve
throughput. Designing dies/tooling for higher speeds and obtaining extended tool life requires a thorough
understanding of the process. This paper discusses an experimental study of the interaction between
punch, stripper plate and sheet material at various blanking velocities up to 1600mm/sec. The effect of
velocity on punching force is also studied. A methodology to obtain high strain and strain rate dependent
material flow stress data using blanking test and finite element modeling is presented.
Keywords: Punching; Finite Element Modeling (FEM); high velocity
1. Introduction
High speed blanking and stamping is widely used in the electronics industry in the manufacture of
components like pins and connector parts. High speed refers to Strokes per Minute (SPM) which can
range from a few hundreds to a few thousands. The continuous growth of the electronic industry is driving
manufacturers to investigate higher production speeds while maintaining high quality of the finished
product. Precision stamping of thin and small components can be very challenging, especially at very
high stamping speeds and velocities. Today, presses that can run at 800-1000+SPM at relatively large
press strokes, such as, 30-40mm, and faster for shorter strokes. Therefore, it is important to understand
the influence of speed on the dynamics and interaction between various tooling components in order to
design robust dies and tooling for these speeds.
There is relatively little literature available in the field of high speed blanking. In most studies, the variation
of punch load with speed has been studied. The interaction between other components of tooling at high
speeds has not been looked into in much detail.
Hirsch et al. [1] measured various forces generated on the punch during blanking of a copper alloy,
CuFe2P 0.29mm thick, using experiments for speeds up to 1000 SPM. However, the stroke length or
blanking velocity was not mentioned in the paper. Grünbaum et al. [2] studied the effect of blanking

2
velocity on blanked edge quality on various materials including steel, copper and aluminium alloys.
Blanking velocities ranging from 900mm/sec to 3650mm/sec were studied. Some sheet materials show a
higher sensitivity to blanking speed than others in terms of blanked edge quality. Gaudilleire et al. [3]
conducted blanking tests up to velocity of 18m/sec and measured the punch load at different blanking
velocities. The formation of adiabatic shear bands at very high cutting speeds was observed in this study.
The effect of blanking velocity on blanked edge quality and blanking load can be found in these studies
for high speed blanking. But the behavior of stripper plate and reverse loading on the punch at high
blanking speeds have not been given much attention.
There are various methods to obtain flow stress data of sheet materials. Tensile test is the most
commonly used test to obtain material properties, in spite of the fact that it can be used to obtain the flow
stress data (σ) for low strains (ε) only. The biaxial bulge test gives the flow stress data for strains higher
than that obtained from tensile test [4]. In addition, torsion tests and inverse methodology using
operations like machining have also been suggested by various researchers. Yun Ling, [5] suggested a
method to extract the flow stress curves of materials beyond necking in tensile tests by using a
combination of experimental load-stroke curve and iterations of FEM simulations. Although this is still
uniaxial tensile test, flow stress curve is obtained for higher strains. Sartkulvanich et al. [6] obtained flow
stress data of materials using the machining process by using a combination of experiments and
simulations. The advantage of obtaining flow stress through machining is that high strains and strain rates
can be achieved. But better accuracy needs to be achieved for the process to become standardized.
Ganesan et al. [7] suggested using cutting as a test method to obtain flow stress data of materials at
room temperature. The significance of the coefficients (K and n) of power (Hollomon) (n
K ) law on
the shape and maximum load of the experimental load-stroke curve in blanking is explained. In this study,
a number of iterations of FE simulations with different K and n values are required. In addition, strain rate
and temperature are important parameters to be considered in FE simulations of blanking. Kandis et al.
[8] also investigated shearing as a test to obtain flow stress data of sheet materials. However, the
temperature and strain rate effects were not given enough importance. In addition, a methodology to
match experimental and simulated load-stroke curves was not established.

3
One of the key differences between the different tests is not only the strain levels obtained, but also the
stress state of the sheet materials. Hence, for an accurate representation of the deformation process in
finite element simulations, it is important that the flow stress data of the sheet material input in the model
was obtained under similar stress/deformation conditions as the process that is being simulated.
Hence, blanking can further be investigated as a test to obtain flow stress data of materials by (i)
considering the effects of strain rate and temperature variation in the sheet and (ii) by establishing a
methodology to match experimentally obtained and simulated load-stroke curves.
The main objective of the present study is to understand the punch-material and punch-stripper plate
interactions in high speed blanking. The steps involved in this process include (i) identifying the various
forces acting on the punch during an entire blanking cycle through experiments (ii) studying the influence
of velocity on forces and vibrations through experiments and Finite Element Analysis (FEA) (iii)
investigating blanking as a test method to obtain material properties at high strains and strain rates using
experiments and FEA.
2. Technical approach
The technical approach used in this study is as follows:
Conduct blanking experiments at blanking velocities ranging from 20mm/sec to 1600mm/sec to study
dynamic loading on the punch.
Perform FEA of blanking using DEFORM 2D at quasi-static conditions and compare with
experimental results.
Use a combination of experimental results and FEA to develop a methodology to obtain strain rate
dependent flow stress data for materials at high strains and strain rates.
3. Experiments
3.1. Tooling Setup
Experiments were conducted using a 300 kN high speed mechanical press. The details of the tooling
used in this study are shown in Table 1 and the schematic is shown in Figure 1.
4
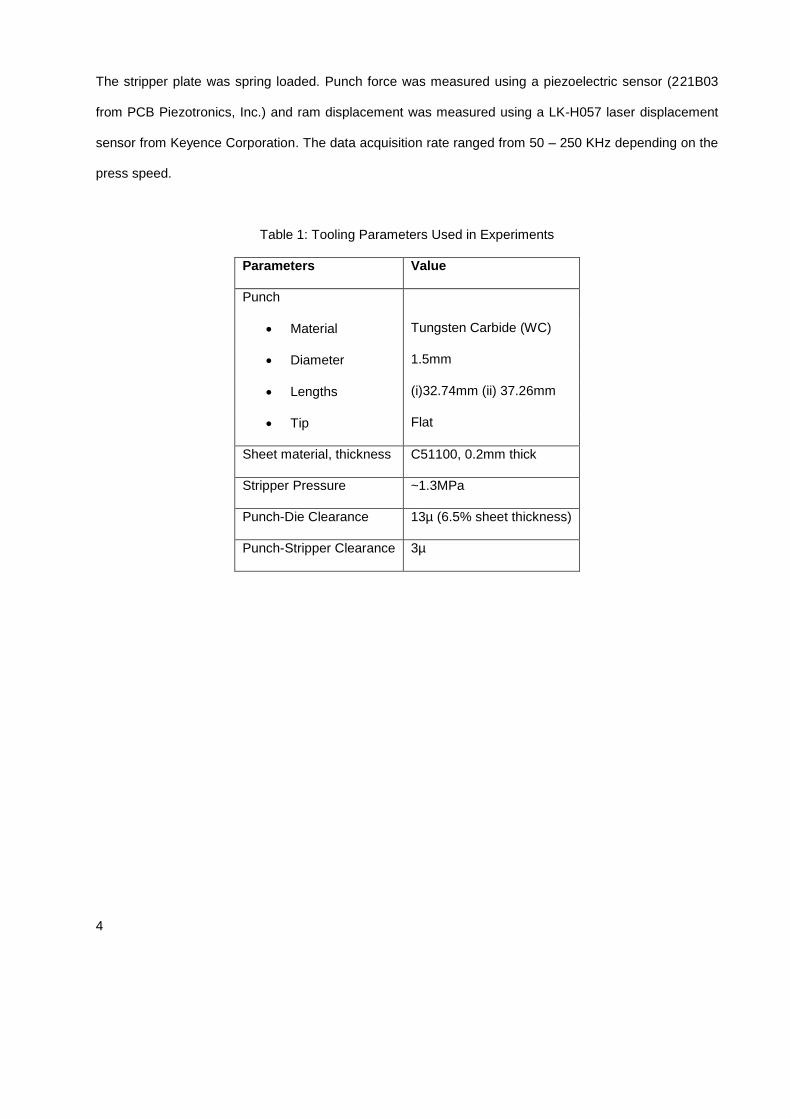
The stripper plate was spring loaded. Punch force was measured using a piezoelectric sensor (221B03
from PCB Piezotronics, Inc.) and ram displacement was measured using a LK-H057 laser displacement
sensor from Keyence Corporation. The data acquisition rate ranged from 50 – 250 KHz depending on the
press speed.
Table 1: Tooling Parameters Used in Experiments
Parameters Value
Punch
Material Tungsten Carbide (WC)
Diameter 1.5mm
Lengths (i)32.74mm (ii) 37.26mm
Tip Flat
Sheet material, thickness C51100, 0.2mm thick
Stripper Pressure ~1.3MPa
Punch-Die Clearance 13µ (6.5% sheet thickness)
Punch-Stripper Clearance 3µ

5
Stripper springs
Stripper depressor rods
Piezoelectric sensor
Stripper platePunch
Sheet
Die block
Figure 1: Experimental setup for punch force measurements (schematic)
3.2. Experimental Procedure
Blanking experiments were conducted to measure the forces on the punch during the entire blanking
cycle for various blanking velocities. Three cases (A, B, C) were studied. Experimental parameters used
in each of the cases are shown in Table 2. A minimum of 20 readings were recorded for each velocity of
each case.
Table 2: Experimental Parameters
A B C
Distance from BDC at which punch touches sheet (mm) 0.86 0.86 5.38
Punch Length (mm) 32.74 32.74 37.26
Range of punch velocity tested (mm/sec) 20-800 20-465 40-1600
Stripper pinning* the sheet during punching Yes No No**
*Pinning refers to holding the sheet material down by applying force **Although the stripper plate was pinning the sheet, the punch was too long that pinning occurred after punching through the sheet.

6
3.3. Experimental results
Punch Force
Punch force and ram displacement are measured for the entire stroke. Various forces acting on the punch
are identified during a blanking cycle, as shown in Figure 2.
The stripper plate moves about 0.5mm to pin the sheet while it interacts with the punch due to the very
small clearance of ~3µ between them. This is represented by the first peak shown in Figure 2. The force
when punch pierces through the sheet material is represented by blanking load in the figure, which is
followed by the reverse loading of the punch. The punch moves to Bottom Dead Centre (BDC) while
frictional forces are generated between the punch and sheet material, which can be seen to change
direction at BDC. The upward motion of the ram releases the stripper return springs (not shown in Figure
1) and the stripper plate bounces back to its original position at a rate dependent on the ram velocity.
Therefore, the amplitude of this vibration increases with ram speed. The influence of ram velocity on each
of these forces is discussed below.

7
0 0.1 0.2 0.3 0.4 0.5 0.6 0.7 0.8 0.9 1-700
-600
-500
-400
-300
-200
-100
0
100
200
300
400
500
600
700Punch Force Case A -1400 SPM
Normalized Time
Punch F
orc
e(N
)
0 0.1 0.2 0.3 0.4 0.5 0.6 0.7 0.8 0.9 10
1
2
3
4
5
6
7
8
9
10
11
12
13
14
Ram
Motion(m
m)
Stripper plate-punchinteraction whenstripper pins thesheet
Blanking load
Frictional forcebetween punchand sheet material(changes directionat BDC)
Stripper plate-punchinteraction whenstripper unpins thesheet
Snap thru force/ reverse loading
Punch Force Case A – Blanking Velocity 465mm/sec
Figure 2: Forces acting on the punch during blanking
Blanking velocity, and hence strain rate, is an important parameter influencing the forces generated in
blanking. Figure 3 shows that the experimentally measured force required for blanking at 40mm/sec is
378N while it is 522N at 1616mm/sec. There is a 38% increase in the force required for blanking in the
range of velocities studied. A potential explanation is that the hardening effect due to increase in strain
rate has a greater influence on the blanking force than the local softening due to increase in temperature
in the shearing zone, causing the force to increase with velocity. Interestingly, the reverse loading on the
punch also shows increase with velocity, as seen in Figure 3. The reverse loading is 13.5% of blanking
force at 20mm/sec blanking velocity while it increases to 40% of blanking force at 808mm/sec. A possible
explanation is that the elastic compressive forces stored in the punch during blanking are released more

8
rapidly at higher speeds. This phenomenon illustrates the need for the punch and other related tooling to
be designed to absorb the reverse loading in high speed blanking.
0 200 400 600 800 1000 1200 1400 1600 1800-400
-300
-200
-100
0
100
200
300
400
500
600
700
Punch velocity at the instant of contact with sheet (mm/sec)
Maxim
um
Forc
e(N
)
Influence of Velocity on Maximum Blanking Force and Reverse Loading
Maximum Blanking Force (from Case C)
Maximum Reverse Loading (from Case A)
Figure 3: Influence of velocity on maximum blanking force and maximum reverse load (with error bars)
Stripper plate
The amplitude of stripper plate vibration during stripper plate pinning is mostly influenced by the
characteristics of the spring that exerts a force on the stripper plate. The amplitude of vibration of the
stripper plate vibration changes, depending on the stiffness of the spring and the velocity of the ram. This
is reflected by the interaction between the lateral sides of the punch and the inner surface of the slot in
the stripper plate, which exerts force on the punch. The vibration of the stripper plate causes lateral
(perpendicular to punch motion) vibration on the punch. Figure 4 shows that the force on the punch
increases with increase in velocity until 933mm/sec after which it reduces and becomes independent of
velocity. The amplitude of stripper plate vibration during pinning was significantly lower than that during
unpinning. Figure 5 shows that the amplitude of force exerted on the punch during unpinning is largely

9
dependent on the ram velocity. The amplitude of punch force at higher speeds reaches 1300N. The
amplitude of these forces on the punch due to the interaction with the stripper plate purely depends on
the stiffness of the stripper spring or rather the mechanism used for stripper plate motion.
0 200 400 600 800 1000 1200 1400 1600 1800-500
-400
-300
-200
-100
0
100
200
300
400
Ram Velocity at the instant of stripper plate unpinning (mm/sec)
Maxim
um
Forc
e o
n P
unch D
uring S
trip
per
Pla
te P
innin
g(N
)
Maximum Force on Punch During Stripper Plate Pinning
Mean
amplitude
deviation
Figure 4: Influence of velocity on vibrations during stripper pinning

10
0 200 400 600 800 1000 1200 1400 1600 1800-1000
-800
-600
-400
-200
0
200
400
600
800
1000
Punch Velocity at the instant of stripper plate unpinning (mm/sec)
Maxim
um
Forc
e o
n P
unch D
uring S
trip
per
Pla
te U
npin
nin
g (
N)
Maximum Force on Punch During Stripper Plate Unpinning
Mean
amplitude
deviation
Figure 5: Influence of velocity on vibrations during stripper unpinning
Blanking load curve can be divided into various segments, as shown in Figure 6 for Case A. The initial
portion of the curve (a-b) corresponds to the elastic deflection of the punch, dies and sheet. The next
portion of the curve (b-c) corresponds to rollover and shear, with the initial 0.02mm corresponding to
rollover and the remaining to shear. This is followed by fracture of the material, shown by region ‘c-d’ in
the curve. This sudden drop in force leads to reverse loading of the punch as seen in region ‘d-e’.

11
0 0.02 0.04 0.06 0.08 0.1 0.12 0.14 0.16 0.18 0.2-50
0
50
100
150
200
250
300
350
400
Punch Stroke (mm)
Pu
nch
Fo
rce
(N
)
Case A
Case B
Case C
Initial elastic region Rollover and shear
Fracture
Reverse loading
Experimentally obtained blanking load at 60 SPM
a b c d e
Figure 6: (left) Blanking load curve (experimental) at blanking velocity 20mm/sec; (right) blanked edge
profile
4. Finite element analysis of blanking (at low blanking velocity)
The accuracy of FE modelling of blanking heavily depends on the flow stress curve of the material,
thermal properties and damage calculation to predict fracture. This study attempts to accurately simulate
the blanking process using the software package DEFORM 2D. Since the process takes place in a very
short period of time (in the order of a few milliseconds), heat transfer to the dies is negligible and hence
not considered in the model. Temperature rise and heat conduction within the sheet material are taken
into account. FEA of the blanking process corresponding to the experimental parameters in Case A and
for a blanking velocity of 20mm/sec is conducted. FE simulations are conducted with the parameters
shown in Table 1. The sheet is modelled as a plastic object and the punch as an elastic object. Adapted
Rice and Tracy (taken from the results from [9]) is the damage function used to model fracture in the
sheet, and the critical damage value used is 3.

12
Stripper plate
Die
Punch
Stripper plate
Die
Punch
Stripper plate
Die
Punch
Stripper plate
Die
Punch
Figure 7: (From top left clockwise) FE model setup; strain distribution; strain rate distribution; temperature distribution in the sheet (at 0.1mm punch stroke / sheet C51100, 0.2mm thick / blanking speed 20mm/sec)
The flow stress curve for C51100 was obtained using static biaxial bulge test and used in the simulations.
The flow curve is extrapolated by fitting Hollomon’s equation ( 1355.04.842 ) to the experimental data.
Figure 7 shows the FE model and the computed maximum strains, strain rate and temperature
distribution in the sheet before it begins to fracture. Since strains in the shear zone can be as high as 2.5
and higher, it is essential to provide the flow stress curves for up to such high strains. Strain rate can
reach up to 103/sec even at very slow blanking speed of 20mm/sec.
5. Comparison of FEA and experimental results (at low blanking velocity)
The blanking load curve obtained experimentally is compared with results from FEA. From Figure 8, it is
seen that the forces compare very well with each other for most of the stroke because the blanking
velocity is relatively low. Thus, flow stress obtained from static tests gives reasonable results. The results

13
also suggest that the flow stress curve of the material used in the simulation is accurate enough to predict
the force curve.
0 0.02 0.04 0.06 0.08 0.1 0.12 0.14 0.16 0.18 0.2-50
0
50
100
150
200
250
300
350
400
Punch Stroke (mm)
Pu
nch
Fo
rce
(N
)
Experimentally obtained blanking force at 60 SPM
Case A
Case B
Case C
0 0.02 0.04 0.06 0.08 0.1 0.12 0.14 0.16 0.18 0.20
50
100
150
200
250
300
350
400
Punch Stroke (mm)
Pu
nch
Fo
rce
(N
)Comparison of experimental and simulated blanking force at 60 SPM
Experimental
Case A
Simulated
Figure 8: Comparison of experimental and simulated blanking load [The initial elastic portion of the
experimental curve was not included in the comparison since it could not be replicated in the simulation]
6. Development of high strain rate material flow stress model
Sections 4 and 5 discussed simulations conducted at quasi-static condition (velocity – 20mm/sec).
However, in high speed blanking, the blanking speeds go up to 1.5m/sec and there is a corresponding
increase in strain rate and temperature also. It is very challenging to obtain flow stress data at high strain
rates for large strains. In this section, blanking is investigated as a potential test to obtain flow stress data
for large strains and strain rates simultaneously and a methodology is proposed for the same.
The following assumptions/approximations are made in this methodology.
1. The strain distribution in the sheet does not vary with blanking speed (strain rate).
2. Strain rate is approximated to be a constant throughout the blanking process and changes only
with blanking speed since the variation with speed is much greater than within the process.

14
The flow chart in Figure 9 shows the proposed methodology to obtain flow stress curves for quasi-static
blanking condition. Temperature effects are not taken into account in quasi-static blanking since there is
only a very small temperature increase.
Obtain blanking force-stroke curve from experiments conducted at low speed (quasi-static condition)
Conduct blanking simulation using extrapolated flow stress curve obtained using uniaxial or biaxial test.
Obtain the force Fs, average stress σs, average strain εs, average strain rate έs and average temperature τs in the sheet at small intervals ‘i’ of stroke. (refer Figure 9 on how the average values were obtained)
Compare the experimental (Fe) and simulated force (Fs) at each step ‘i’ of stroke
At each step ‘i’, if Fs ≠ Fe σs new = σs*(Fe/ Fs)
Average (of all steps ‘i’) strain rate for the process έspeed is calculated. Flow stress curve for έspeed is obtained.
Figure 9: Flow chart to develop flow stress curve using blanking tests for low strain rate
strain
Figure 10: Points taken along the line of deformation to average stress, strain and temperature values

15
High strain rate flow stress data can be calculated by using the combination of flow stress data obtained
from Figure 9 and experimental blanking force curves at higher speeds. A simple procedure for
determining strain rate dependent flow stress data for high strains is shown in Figure 11. The effect of
temperature is not considered in this methodology because the maximum blanking force was found to
occur at the very beginning of stroke, at which time, the temperature effects are small enough to be
neglected. This also helps in separating the strain rate effect from temperature effect on the flow stress of
the material.
Obtain blanking force-stroke curve from experiments conducted at higher speeds corresponding to various strain rates.
For each of the strain rates έ, find the ratio of maximum blanking force at higher strain rate to maximum blanking force at quasi-static condition
Force Ratio = Fmax έ / Fmax e
Scale the flow stress curve at quasi-static condition (obtained from Figure 8) by the Force Ratio obtained in the previous step. This gives the flow stress data for the material at higher strain rates.
Figure 11: Flow chart to develop flow stress curve using blanking tests for higher strain rate
7. Preliminary evaluation of the methodology
7.1. Flow stress curve for C51100
Applying the methodology described in section 6, a strain rate dependent flow stress data was developed
for C51100 using the extrapolated bulge test data and blanking force data from experiments shown in
Figure 3. The ratio of maximum blanking force at various velocities to quasi-static velocity is calculated.
The static flow stress curve obtained using the biaxial bulge test is increased by a factor equal to that
ratio to obtain the flow stress curves at higher strain rates, shown in Figure 12.

16
0 0.5 1 1.5 2 2.5 3 3.5 4 4.5 5400
600
800
1000
1200
1400
1600
True Strain
Tru
e S
tre
ss (
MP
a)
Strain Rate Dependent Flow Stress Curve for C51100Obtained using the methodolody
stran rate 375
strain rate 3.75*103
strain rate 104
strain rate 1.5*104
Figure 12: Flow stress for C51100 obtained using the methodology developed in the present study
Since temperature is also a significant factor and temperature dependent flow stress data for this material
was not available, relation between flow stress and temperature of pure copper from [10] were used. The
ratio of true stress at 296K to the true stress at higher temperature is calculated for different values of
strains and averaged. This gives the factor by the true stress is scaled down due to the effect of
temperature and is shown in Table 3.
Table 3: Factor used to scale the flow stress curve for higher temperatures
Temperature (T) (°C) Ratio - flow stress T / flow stress22°C
22 1
222 0.8048
322 0.6272

17
For each strain rate, temperature dependent flow stress curves are calculated using Table 3.Hence, there
is a total of 12 curves (4 strain rate dependent x 3 temperature dependent) are input as material property
in DEFORM 2D for the simulations.
7.2. Simulation of high speed blanking
The flow stress curves obtained using the present methodology are used to simulate high speed blanking
and compare the force curves with experimental results. Simulations were conducted for blanking speeds
of 1060mm/sec and 1600mm/sec. The blanking forces are compared in Figure 13. The forces compare
fairly well. Since the experimental force had a component of vibration in it, it could not be expected to
match perfectly well with simulations (which did not consider dynamic effects).
0 0.05 0.1 0.15 0.20
100
200
300
400
500
600
Stroke (mm)
Fo
rce
(N
)
Blanking Force at 1600 SPM (1.06 m/sec)
experimental
simulated
0 0.05 0.1 0.15 0.20
100
200
300
400
500
600
Stroke (mm)
Fo
rce
(N
)Blanking Force at 2400 SPM (1.6 m/sec)
experimental
simulated
Blanking force at 1060mm/sec Blanking force at 1600mm/sec
Figure 13: Comparison of blanking forces obtained from simulations and experiments
8. Conclusions and Discussions
A comprehensive study was conducted to have a better understanding of high speed blanking at the
tooling level. Punch-material interaction and punch-stripper plate interactions were studied.
The experimental study yielded the following findings:

18
1. The velocity of blanking has a significant influence on forward and reverse loading.
2. The vibrations of the stripper plate during unpinning apply lateral force on the punch, which could
influence the strength and life of slender punches.
The following results are obtained from the FE study:
1. Modelling of high speed blanking requires both temperature and strain rate dependent material model
at high strains.
2. Blanking itself could be used as a test to generate material flow stress data at high strains and strain
rates.
References
[1] Hirsch,M., Demmel,P.,, Golle,R., and Hoffmann,H. (2011) Light Metal in High-Speed Stamping Tools.
Key Engineering Materials, 473, 259-266.
[2] Grünbaum,M., Breitling,J., Altan,T.(1996) Influence of high cutting speeds on the quality of blanked
parts. Report No. ERC/NSM - S-96-19, Center for Precision Forming, Columbus, OH, USA
[3] Gaudilleire,C., Ranc,N., Larue,A., Maillard,A., Lorong,P. (2010) High Speed Blanking: An
Experimental Method to Measure Induced Cutting Forces. Experimental Mechanics, March 2013.
[4] Gutscher, G., Wu, H., Ngaile, G., & Altan, T. (2004). Determination of flow stress for sheet metal
forming using the viscous pressure bulge (VPB) test. Journal of Materials Processing Technology, 146(1),
1-7.
[5] Ling.Y., (1996) Uniaxial True Stress-Strain after Necking”, AMP Journal of Technology, vol.5, 37-48
[6] Sartkulvanich, P., Koppka, F., Altan, T. (2004). Determination of flow stress for metal cutting
simulation—a progress report. Journal of Materials Processing Technology, 146(1), 61-71.
[7] Ganesan,S.M., Khan,Y.A., Valberg,H., Moe,P.T., Hansen,A.W. (2008) Cutting applied as test method
for acquisition of flow stress data at high strains and strain rates. International Journal of Material
Forming. 1(1), Supplement, 519-522.
[8] Kandis,J., Valberg,H., Wenbin,W.(2011) Use of Axisymmetric Shearing as Technological Test Method
to gather Flow Stress Data for Metals. AIP Conf. Proc. 1315, 1125-1130.

19
[9] Sartkulvanich,P., Kroenauer,B., Golle,R., Konieczny,A., Altan,T. (2010). Finite element analysis of the
effect of blanked edge quality upon stretch flanging of AHSS. CIRP Annals -Manufacturing Technology,
59, 1,279-282.
[10] Nemat-Nasser,S.,Li,Y.(1998). Flow stress of F.C.C polycrystals with application to OFHC Cu. Acta
Mater,46, 2, 565-577.