Embed Size (px)
Citation preview

Supporting Information
Analytical characterization and comparison of
tristyrylphenol ethoxylates used in agrochemical
formulation
Johannes Glaubitz1,2, Torsten C. Schmidt1,*
1 University Duisburg-Essen, Instrumental Analytical Chemistry, Universitätsstr. 5,
45141 Essen, Germany
2 Bayer CropScience, Formulation Technology Analysis & Services, Alfred-Nobel-Straße 50,
40789 Monheim am Rhein, Germany
*Corresponding author:
Phone: +49 201 183-6774
Fax: +49 201 183-6773
E-mail: [email protected]
Table of Contents
1. Sample for testing on mass calibration of TOF-MS.................................................................................6
2. Mass spectra of the major compounds in TSP-16...................................................................................8
3. Comparison of the ionization performance of APPI and ESI for the analysis of TSP-40-ethoxylates.......11
4. Determination of the limit of quantification........................................................................................13
5. Data bases and results files for the data mining...................................................................................17
6. Results of the principal components analysis according to the score of the single compounds.............17
7. Comparison of TSP-16 of different suppliers and qualities....................................................................20
8. Statistical evaluation of the results on the content of the components in TSP-16 on their use for product identification............................................................................................................................................... 23
9. Example for interference on analysis of TSP-16 in agrochemical formulations......................................25
1

List of Figures
Figure S 1: The mass spectra of the major compounds are displayed in Figure S 1 (a) for PEG,
in Figure S 1 (b) for MSP ethoxylates, in Figure S 1 (c) for DSP ethoxylates, in Figure S 1 (d)
for TSP ethoxylates and in Figure S 1 (e) for TeSP ethoxylates. These mass spectra were
obtained using APCI as coupling to the TOF mass spectrometer...............................................7
Figure S 2: Ionization behavior of TSP-40 ionized by APPI (a) and ESI (b). In each case the
mass spectrum over the peak of TSP-ethoxylates is displayed. For each experiment the same
elution conditions with water and methanol as mobile phase, plus 5 mmol/L ammonium
formiate, were chosen. The mass spectrometer used for this experiments was a Thermo Q-
exactive.....................................................................................................................................11
Figure S 3: Chromatograms for determination of the signal-to-noise ratio at the defined LOQ
level for TSP with 16 EO units (a) and hexanophenone (b). The LOQ was defined as a signal-
to-noise ratio of at least 20:1, which has been achieved for both analytes...............................13
Figure S 4: Linear ranges for TSP with 16 EO units (a) and hexanophenone (b) including the
bands of prediction indicated green for the upper and red for the lower limit..........................14
Figure S 5: Distribution of residues for the regression analysis of standards of TSP with 16
EO units a) and the internal standard hexanophenone b)..........................................................15
Figure S 6: Principle component analysis of the data sets from supplier A (Cross), B1
(Arrow), B2 (Horizontal Bar) and C (Vertical bar) together with the data of the formulation
samples containing TSP-16 of supplier A (Square), B1 (Diamond), B2 (Circle) and C
(Triangle). For the PCA the whole data set was taken including the 3 repetition analysis each
production batch and formulation sample.................................................................................22
2
Figure S 7: Combined hierarchical clustering of the samples (x-axis) and the compounds (y-
axis) detected in the samples of supplier A, B1, B2 and C together with sample of formulation
containing TSP-16 of Supplier A, B1, B2 and C. Each sample is the average of 3 repetition
analyses. The content of a compound in the analyzed sample is coded via black-white
rectangles in the column beneath the respective samples. The color ranges from black,
compound not detected, over grey, compound as abundant as internal standard, to white,
compound with the maximum content......................................................................................23
Figure S 8: Extracted ion chromatograms obtained in the positive ionization mode of terminal
phosphated (a) and sulfated (b) commercially available TSP-16. Indicated are the identified
entities of DSP-, TSP and TeSP ethoxylates.............................................................................25
Figure S 9: Principal component analysis of the data sets from supplier A (Cross), B1
(Arrow), B2 (Horizontal Bar) and C (Vertical bar) together with the data of the formulation
samples containing TSP-16 of supplier A (Square), B2 (Circle) and C (Triangle). For the PCA
the whole data set was taken including the 3 repetition analysis each production batch and
formulation sample....................................................................................................................26
3

List of Tables
Table S 1: Retention time and exact masses for compounds in the test sample for checking on
mass calibration...........................................................................................................................6
Table S 2: Results for the test on heteroscedasticity against a level of significance of 0.05 on
the data set used for linear regression of TSP-with 16 EO units and the internal standard
hexanophenone according to Breusch-Pagan............................................................................16
Table S 3: Given are the scores each compound for component 1 and 2 of the principle
component analysis performed on the data set of the different suppliers of TSP-16, as it is
graphically displayed in Figure 6 in the manuscript.................................................................17
Table S 4: Compounds used for the combined hierarchical clustering listed together with the
corresponding arrays as defined in Figure 7 (see manuscript). The compounds are sorted
according to the order obtained by the hierarchical clustering of the compounds....................20
Table S 5: Table of composition of the model agrochemical formulation containing terminal
sulfated TSP-16 alongside with TSP-16...................................................................................26
4

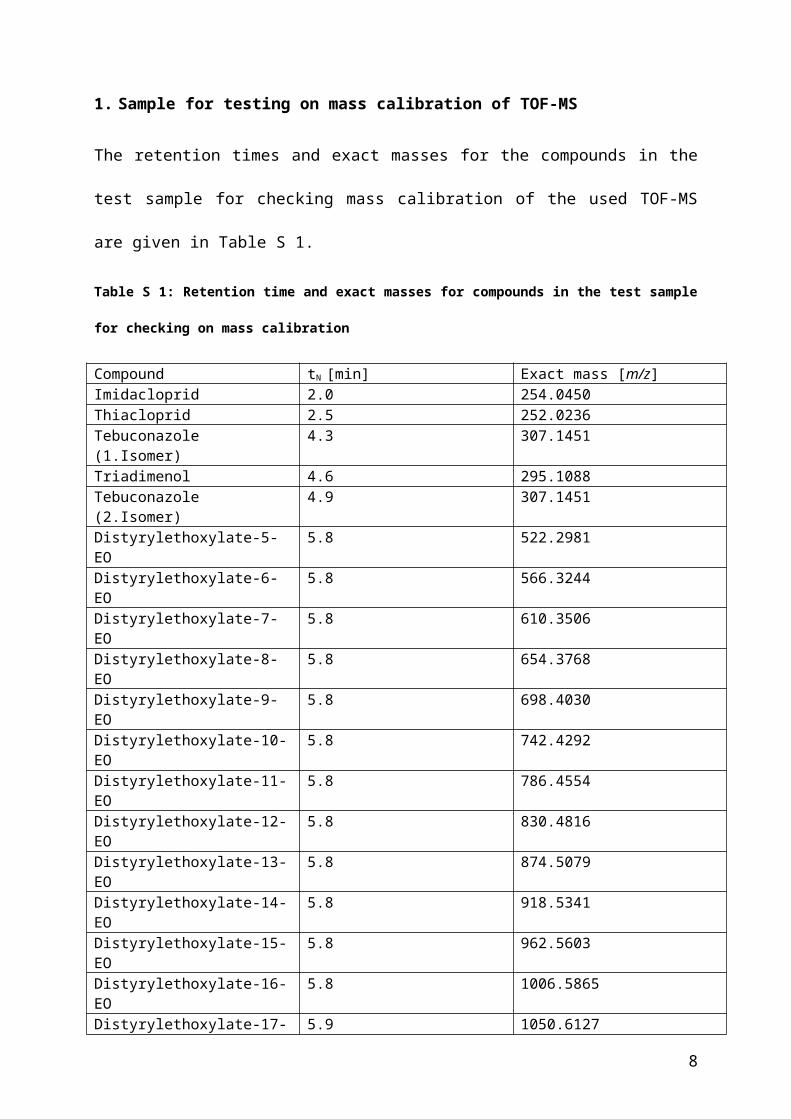
1. Sample for testing on mass calibration of TOF-MS
The retention times and exact masses for the compounds in the test sample for checking mass
calibration of the used TOF-MS are given in Table S 1.
Table S 1: Retention time and exact masses for compounds in the test sample for checking on mass
calibration
Compound tN [min] Exact mass [m/z]Imidacloprid 2.0 254.0450Thiacloprid 2.5 252.0236Tebuconazole (1.Isomer) 4.3 307.1451Triadimenol 4.6 295.1088Tebuconazole (2.Isomer) 4.9 307.1451Distyrylethoxylate-5-EO 5.8 522.2981Distyrylethoxylate-6-EO 5.8 566.3244Distyrylethoxylate-7-EO 5.8 610.3506Distyrylethoxylate-8-EO 5.8 654.3768Distyrylethoxylate-9-EO 5.8 698.4030Distyrylethoxylate-10-EO 5.8 742.4292Distyrylethoxylate-11-EO 5.8 786.4554Distyrylethoxylate-12-EO 5.8 830.4816Distyrylethoxylate-13-EO 5.8 874.5079Distyrylethoxylate-14-EO 5.8 918.5341Distyrylethoxylate-15-EO 5.8 962.5603Distyrylethoxylate-16-EO 5.8 1006.5865Distyrylethoxylate-17-EO 5.9 1050.6127Distyrylethoxylate-18-EO 5.9 1094.6389Distyrylethoxylate-19-EO 5.9 1138.6651Distyrylethoxylate-20-EO 5.9 1182.6914Distyrylethoxylate-21-EO 5.9 1226.7176Distyrylethoxylate-22-EO 5.9 1270.7438Distyrylethoxylate-23-EO 5.9 1314.7700Distyrylethoxylate-24-EO 5.9 1358.7962Distyrylethoxylate-25-EO 5.9 1402.8224Distyrylethoxylate-26-EO 5.9 1446.8486Distyrylethoxylate-27-EO 5.9 1490.8749Distyrylethoxylate-28-EO 5.9 1534.9011Distyrylethoxylate-29-EO 5.9 1578.9273Distyrylethoxylate-30-EO 5.9 1622.9535Nonylphenolethoxylate-5-EO 6.6 440.3138Nonylphenolethoxylate-6-EO 6.3 484.3400Nonylphenolethoxylate-7-EO 6.2 528.3662Nonylphenolethoxylate-8-EO 6.2 572.3924Nonylphenolethoxylate-9-EO 6.2 616.4186Nonylphenolethoxylate-10-EO 6.2 660.4449Nonylphenolethoxylate-11-EO 6.2 704.4711Nonylphenolethoxylate-12-EO 6.2 748.4973Nonylphenolethoxylate-13-EO 6.2 792.5235Nonylphenolethoxylate-14-EO 6.2 836.5497Nonylphenolethoxylate-15-EO 6.2 880.5759
5

Compound tN [min] Exact mass [m/z]Nonylphenolethoxylate-16-EO 6.2 924.6022Nonylphenolethoxylate-17-EO 6.2 968.6284Nonylphenolethoxylate-18-EO 6.2 1012.6546Nonylphenolethoxylate-19-EO 6.2 1056.6808Nonylphenolethoxylate-20-EO 6.2 1100.7070Nonylphenolethoxylate-21-EO 6.2 1144.7332Nonylphenolethoxylate-22-EO 6.2 1188.7594Nonylphenolethoxylate-23-EO 6.2 1232.7857Nonylphenolethoxylate-24-EO 6.2 1276.8119Nonylphenolethoxylate-25-EO 6.2 1320.8381Nonylphenolethoxylate-26-EO 5.9 1364.8643Nonylphenolethoxylate-27-EO 5.9 1408.8905Nonylphenolethoxylate-28-EO 5.9 1452.9167Nonylphenolethoxylate-29-EO 5.9 1496.9429Nonylphenolethoxylate-30-EO 5.9 1540.9692Tristyrylethoxylate-5-EO 5.9 626.3607Tristyrylethoxylate-6-EO 5.9 670.38695Tristyrylethoxylate-7-EO 5.9 714.4132Tristyrylethoxylate-8-EO 6.5 758.4394Tristyrylethoxylate-9-EO 5.9 802.4656Tristyrylethoxylate-10-EO 5.9 846.4918Tristyrylethoxylate-11-EO 6.0 890.5180Tristyrylethoxylate-12-EO 6.0 934.5442Tristyrylethoxylate-13-EO 6.0 978.5705Tristyrylethoxylate-14-EO 6.0 1022.5967Tristyrylethoxylate-15-EO 6.0 1066.6229Tristyrylethoxylate-16-EO 6.0 1110.6491Tristyrylethoxylate-17-EO 6.0 1154.6753Tristyrylethoxylate-18-EO 6.0 1198.7015Tristyrylethoxylate-19-EO 6.0 1242.7278Tristyrylethoxylate-20-EO 6.0 1286.7540Tristyrylethoxylate-21-EO 5.9 1330.7802Tristyrylethoxylate-22-EO 5.9 1374.8064Tristyrylethoxylate-23-EO 5.9 1418.8326Tristyrylethoxylate-24-EO 5.9 1462.8588Tristyrylethoxylate-25-EO 5.9 1506.8850Tristyrylethoxylate-26-EO 5.8 1550.9113Tristyrylethoxylate-27-EO 5.8 1594.9375Tristyrylethoxylate-28-EO 5.8 1638.9637Tristyrylethoxylate-29-EO 5.8 1682.9899Tristyrylethoxylate-30-EO 5.8 1727.0161
6

2. Mass spectra of the major compounds in TSP-16
In the following Figure S 1 the mass spectra of the major compounds in TSP-16 are shown. In
Figure S 1 (a) the mass spectrum of PEG, in Figure S 1 (b) the mass spectrum of MSP
ethoxylates, in Figure S 1 (c) the mass spectrum of DSP ethoxylates, in Figure S 1 (d) the
mass spectrum of TSP ethoxylates and in Figure S 1 (e) the mass spectrum of TeSP (4)
ethoxylates are given.
Figure S 1: The mass spectra of the major compounds are displayed in Figure S 1 (a) for PEG, in Figure S
1 (b) for MSP ethoxylates, in Figure S 1 (c) for DSP ethoxylates, in Figure S 1 (d) for TSP ethoxylates and
in Figure S 1 (e) for TeSP ethoxylates. These mass spectra were obtained using APCI as coupling to the
TOF mass spectrometer
(a)
Signal intensity [counts]
Mass-to-Charge [m/z]
PEG with 9 EO-units [M + NH4]+
PEG
7
(b)
(c)
Signal intensity [counts]
Mass-to-Charge [m/z]
MSP with 16 EO-units [M + NH4]+
PEG with 4 EO-units [M + NH4]+
(1) MSP-ethoxylates
Signal intensity [counts]
Mass-to-Charge [m/z]
DSP with 15 EO-units [M + NH4]+
PEG with 4 EO-units [M + NH4]+
(2) DSP-ethoxylates
8

(d)
(e)
As shown all compounds were identified as [M + NH4]-adducts, due to the addition 5mM of
ammonium formate to the eluents. Furthermore, were identified entities of PEG for each of
the styrenated phenol ethoxylates. This PEG is due to insource degradation of the respective
Signal intensity [counts]
Mass-to-Charge [m/z]
(3) TSP-ethoxylates
TSP with 15 EO-units [M + NH4]+PEG with 4 EO-units [M + NH4]+(3) TSP-ethoxylates
Signal intensity [counts]
Mass-to-Charge [m/z]
TeSP with 13 EO-units [M + NH4]+
PEG with 5 EO-units [M + NH4]+
(4) TeSP-ethoxylates
9

styrenated phenol ethoxylates, as PEG originating from the sample of TSP-16 has been
chromatographically separated and is eluting before the styrenated phenol ethoxylates
between tR=1.0 min and tR=7.0 min.
3. Comparison of the ionization performance of APPI and ESI for the analysis
of TSP-40-ethoxylates
The ionization performance of APPI and ESI was compared for the analysis of TSP-40-
ethoxylates. For comparison the mass spectra of TSP-ethoxylates were taken for each
ionization technique. Results for APPI are displayed in Figure S 2 (a) and for ESI in Figure S
2 (b).
(a)Mass-to-Charge [m/z]
Relative abundance [%]
TSP with 33 EO-units [M + Na]+
10

(b)Figure S 2: Ionization behavior of TSP-40 ionized by APPI (a) and ESI (b). In each case the mass
spectrum over the peak of TSP-ethoxylates is displayed. For each experiment the same elution conditions
with water and methanol as mobile phase, plus 5 mmol/L ammonium formiate, were chosen. The mass
spectrometer used for this experiments was a Thermo Q-exactive.
For APPI a complex spectrum was obtained with a wide variety of signals, which can only
partly be assigned to TSP-ethoxylates like the signal of TSP ethoxylate with 33 EO units.
Given that the distribution of TSP-40 has its center on TSP with 33 EO units and not 40 EO
units and taking into account the scatter of smaller peaks underlying the distribution it may be
assumed that APPI is limited to ionization of entities with shorter EO chains. The ionization
process, however, of entities with longer chain length leads to some sort of degradation
shifting the center of distribution of ethoxylates and giving a wide variety of mass peaks,
being fragments of this process. As the spectrum is very hard to interpret APPI is less
favorable for characterization of TSP ethoxylates with longer EO chain lengths.
By comparison, the spectrum obtained by ESI shows only single to fourfold-charged mol
peaks of TSP ethoxylates without apparent degradation products or fragments. Analogous to
the spectrum obtained for TSP-16 in the manuscript in Figure 3 (b) the higher charged entities
Mass-to-Charge [m/z]
Relative abundance [%]
TSP with 43 EO-units [M + 4NH4]4+
TSP with 39 EO-units [M + 3NH4]3+
TSP with 38 EO-units [M + 2NH4]2+
TSP with 35 EO-units [M + NH4]+
11

are dominant for longer EO chain lengths. The spectrum obtained by ESI was easier to
interpret and without apparent degradation products and so ESI was taken as coupling to the
mass spectrometer in this work.
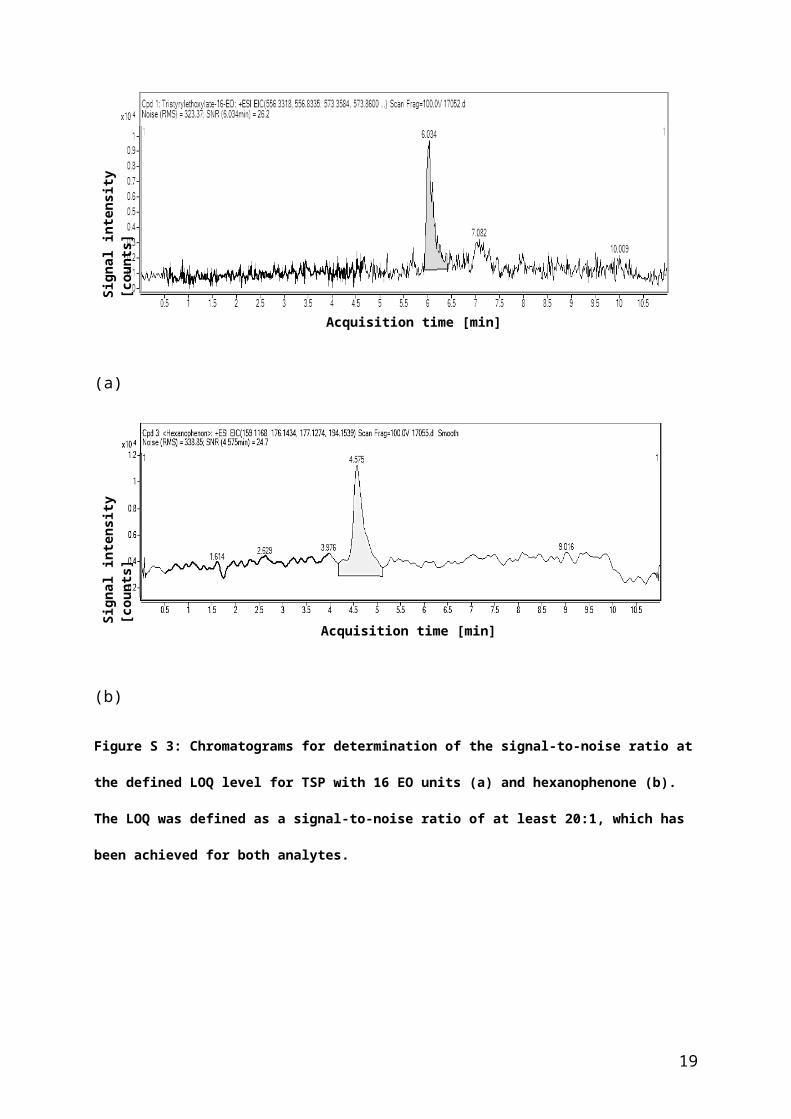
4. Determination of the limit of quantification
The limits of quantification (LOQ) for both analytes hexanophenone and TSP with 16 EO
units has been defined as a signal-to-noise ratio of at least 20:1 to ensure acceptable
quantification results. In the following the respective chromatograms at LOQ level are given
for TSP with 16 EO units (a) and hexanophenone (b) in Figure S 3, the linearity plots for TSP
with 16 EO units (a) and hexanophenone (b) in Figure S 4 and the distribution of residues for
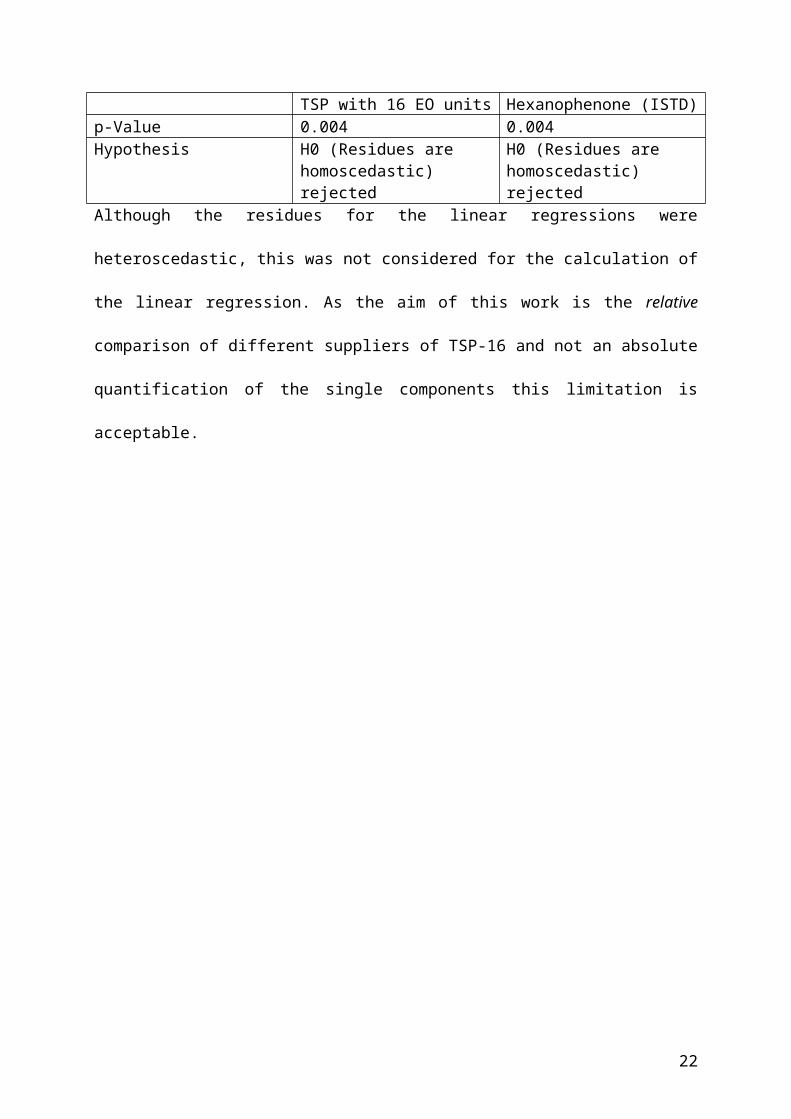
TSP with 16 EO units (a) and hexanophenone (b) in Figure S 5. The data for the linear
regression were found to be heteroscedastic according to the Breusch-Pagan with the results
shown in Table S 2.
(a)
Acquisition time [min]
Signal intensity [counts]
12

(b)
Figure S 3: Chromatograms for determination of the signal-to-noise ratio at the defined LOQ level for
TSP with 16 EO units (a) and hexanophenone (b). The LOQ was defined as a signal-to-noise ratio of at
least 20:1, which has been achieved for both analytes.
0 5 10 15 20 25 30 35 400
2000000
4000000
6000000
8000000
10000000
12000000
f(x) = 311388.338794674 x + 73462.351121488R² = 0.999770749113375
c [mg/L]
coun
ts
(a)
Acquisition time [min]
Signal intensity [counts]
13

0 20 40 60 80 100 120 1400
500000
1000000
1500000
2000000
2500000
3000000
f(x) = 22834.7144766107 x − 26727.4253717642R² = 0.999600645884538
c [mg/L]
coun
ts
(b)
Figure S 4: Linear ranges for TSP with 16 EO units (a) and hexanophenone (b) including the bands of
prediction indicated green for the upper and red for the lower limit
0 5 10 15 20 25 30 35
-1.5
-1
-0.5
0
0.5
1
1.5
2
2.5
Content TSP with 16-EO units [mg/L]
Stan
dard
isie
rte
Resi
duen
a)
14

0 20 40 60 80 100 120 140
-2
-1.5
-1
-0.5
0
0.5
1
Content ISTD [mg/L]
Stan
dard
isie
rte
Resi
duen
b)Figure S 5: Distribution of residues for the regression analysis of standards of TSP with 16 EO units a)
and the internal standard hexanophenone b)
Table S 2: Results for the test on heteroscedasticity against a level of significance of 0.05 on the data set
used for linear regression of TSP-with 16 EO units and the internal standard hexanophenone according to
Breusch-Pagan
TSP with 16 EO units Hexanophenone (ISTD)p-Value 0.004 0.004Hypothesis H0 (Residues are
homoscedastic) rejectedH0 (Residues are homoscedastic) rejected
Although the residues for the linear regressions were heteroscedastic, this was not considered
for the calculation of the linear regression. As the aim of this work is the relative comparison
of different suppliers of TSP-16 and not an absolute quantification of the single components
this limitation is acceptable.
15

5. Data bases and results files for data mining
The compound search applied in this work, is a targeted on known compounds. The
corresponding database is added as .csv file to the Supporting Information (TSP exact mass
data base.csv). The resulting data set for the 2-step data mining approach on the nonionic
surfactants in all the analyzed samples is added as a .txt file (TSP-16-ethoxylates_final.txt) to
the Supporting Information together with the intermediate data sets obtained during data
mining (TSP-16-ethoxylates molecular feature extractor.txt), normalization and reduction
(TSP-16-ethoxylates Find-by-Formular.txt) to the defined linear range. The resulting data set
on TSP 16 and TSP-16 in formulation samples is also added here (TSP-16-ethoxylates plus
formulation samples.txt).
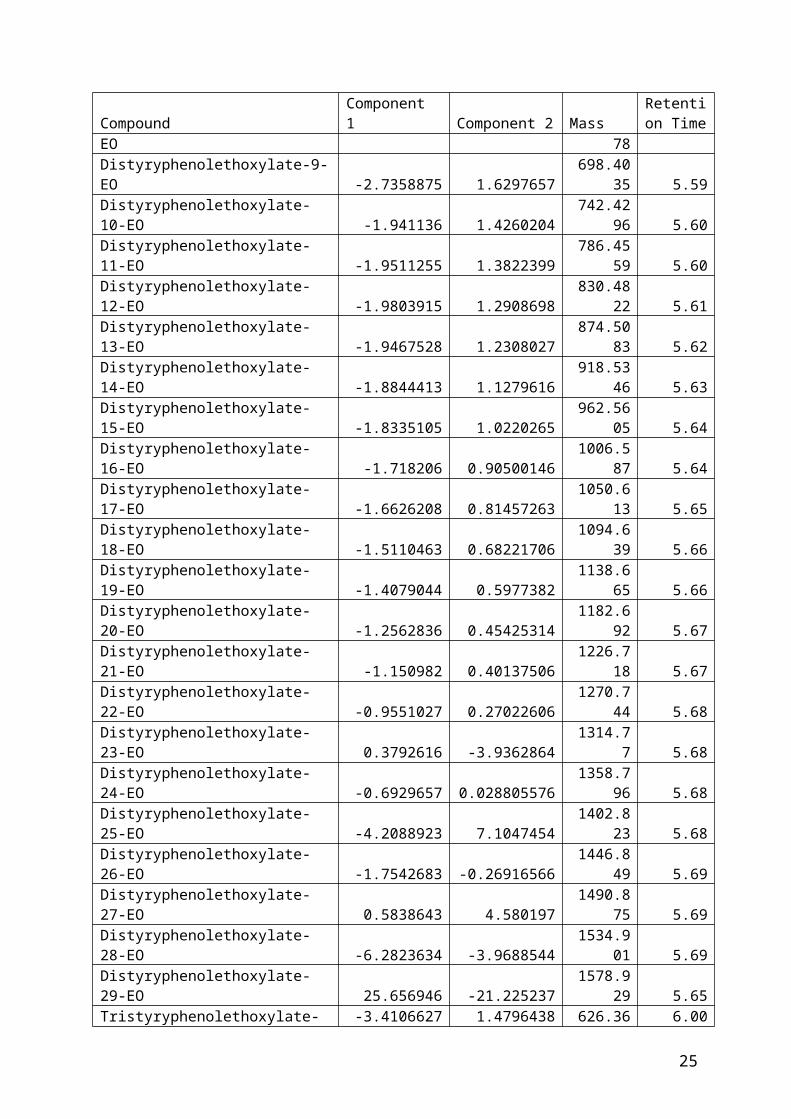
6. Results of the principal components analysis according to the score of the
single compounds
In the following Table S 3 are shown the single scores each compound for component 1 and 2
of the principle component analysis as shown graphically in Figure 6 in the manuscript.
Table S 3: Given are the scores each compound for component 1 and 2 of the principle component analysis
performed on the data set of the different suppliers of TSP-16, as it is graphically displayed in Figure 6 in
the manuscript.
Compound Component 1 Component 2 MassRetention Time
Hexanophenon 0 0176.120
1 4.58Monostyryphenolethoxylate-11-EO -21.518444 18.958761 682.392 4.92
Monostyryphenolethoxylate-12-EO -17.013428 17.149254726.419
8 4.94
Monostyryphenolethoxylate-13-EO -20.885107 20.679117770.445
2 4.96
Monostyryphenolethoxylate-14-EO -25.291218 23.80306814.470
9 4.99
Monostyryphenolethoxylate-15-EO -32.93415 28.694887858.497
7 5.01
16

Compound Component 1 Component 2 MassRetention Time
Monostyryphenolethoxylate-16-EO -25.511671 39.14467902.523
4 5.03
Monostyryphenolethoxylate-17-EO -24.716763 39.249256946.549
5 5.05
Monostyryphenolethoxylate-18-EO -24.73755 38.80539990.576
6 5.07
Monostyryphenolethoxylate-19-EO -26.527723 40.044131034.60
2 5.08
Monostyryphenolethoxylate-20-EO -15.867841 32.8092231078.62
9 5.10
Monostyryphenolethoxylate-21-EO -19.358452 27.4665831122.65
3 5.11Monostyryphenolethoxylate-22-EO -18.085913 16.839708 1166.68 5.13
Monostyryphenolethoxylate-23-EO -15.225504 13.2349641210.70
3 5.14
Monostyryphenolethoxylate-24-EO -10.874819 8.4327721254.72
9 5.16
Distyryphenolethoxylate-5-EO -2.6254199 5.172396522.301
5 5.53
Distyryphenolethoxylate-6-EO -4.185789 2.4134681566.327
7 5.55
Distyryphenolethoxylate-7-EO -0.9710141 2.3733385610.352
3 5.56
Distyryphenolethoxylate-8-EO -1.0998861 3.294223654.377
8 5.58
Distyryphenolethoxylate-9-EO -2.7358875 1.6297657698.403
5 5.59
Distyryphenolethoxylate-10-EO -1.941136 1.4260204742.429
6 5.60
Distyryphenolethoxylate-11-EO -1.9511255 1.3822399786.455
9 5.60
Distyryphenolethoxylate-12-EO -1.9803915 1.2908698830.482
2 5.61
Distyryphenolethoxylate-13-EO -1.9467528 1.2308027874.508
3 5.62
Distyryphenolethoxylate-14-EO -1.8844413 1.1279616918.534
6 5.63
Distyryphenolethoxylate-15-EO -1.8335105 1.0220265962.560
5 5.64
Distyryphenolethoxylate-16-EO -1.718206 0.905001461006.58
7 5.64
Distyryphenolethoxylate-17-EO -1.6626208 0.814572631050.61
3 5.65
Distyryphenolethoxylate-18-EO -1.5110463 0.682217061094.63
9 5.66
Distyryphenolethoxylate-19-EO -1.4079044 0.59773821138.66
5 5.66
Distyryphenolethoxylate-20-EO -1.2562836 0.454253141182.69
2 5.67
Distyryphenolethoxylate-21-EO -1.150982 0.401375061226.71
8 5.67
Distyryphenolethoxylate-22-EO -0.9551027 0.270226061270.74
4 5.68
17

Compound Component 1 Component 2 MassRetention Time
Distyryphenolethoxylate-23-EO 0.3792616 -3.9362864 1314.77 5.68
Distyryphenolethoxylate-24-EO -0.6929657 0.0288055761358.79
6 5.68
Distyryphenolethoxylate-25-EO -4.2088923 7.10474541402.82
3 5.68
Distyryphenolethoxylate-26-EO -1.7542683 -0.269165661446.84
9 5.69
Distyryphenolethoxylate-27-EO 0.5838643 4.5801971490.87
5 5.69
Distyryphenolethoxylate-28-EO -6.2823634 -3.96885441534.90
1 5.69
Distyryphenolethoxylate-29-EO 25.656946 -21.2252371578.92
9 5.65Tristyryphenolethoxylate-5-EO -3.4106627 1.4796438 626.361 6.00
Tristyryphenolethoxylate-6-EO -1.2727805 1.1529844670.387
5 6.01
Tristyryphenolethoxylate-7-EO -1.2660158 1.2475859714.413
7 6.01
Tristyryphenolethoxylate-8-EO -0.28587636 0.8669842758.439
6 6.01
Tristyryphenolethoxylate-9-EO -0.3896259 0.77770567802.465
7 6.02Tristyryphenolethoxylate-10-EO -0.43556568 0.61594385 846.492 6.02
Tristyryphenolethoxylate-11-EO -0.47407123 0.57370925890.518
2 6.02
Tristyryphenolethoxylate-12-EO -0.4584877 0.45355675934.544
4 6.02
Tristyryphenolethoxylate-13-EO -0.41510287 0.36597556978.570
8 6.02
Tristyryphenolethoxylate-14-EO -0.36435264 0.297704251022.59
7 6.03
Tristyryphenolethoxylate-15-EO -0.27751935 0.18695331066.62
3 6.03
Tristyryphenolethoxylate-16-EO -0.193165 0.058310291110.64
9 6.03
Tristyryphenolethoxylate-17-EO -0.10277939 -0.0661167351154.67
5 6.03
Tristyryphenolethoxylate-18-EO 0.025035297 -0.16225531198.70
2 6.03
Tristyryphenolethoxylate-19-EO 0.14945453 -0.32144451242.72
8 6.03
Tristyryphenolethoxylate-20-EO 0.26133797 -0.35551131286.75
4 6.03Tristyryphenolethoxylate-21-EO 0.42371926 -0.5586756 1330.78 6.03
Tristyryphenolethoxylate-22-EO 0.46660414 -0.411799071374.80
7 6.03
Tristyryphenolethoxylate-23-EO 0.70624554 -0.76112141418.83
3 6.03
Tristyryphenolethoxylate-24-EO 0.3835046 -0.15212371462.85
9 6.02
Tristyryphenolethoxylate-25-EO -0.5297137 -1.2051531506.88
5 6.03
18
Compound Component 1 Component 2 MassRetention Time
Tristyryphenolethoxylate-26-EO -0.9155471 0.637563941550.91
1 6.02
Tristyryphenolethoxylate-27-EO -4.92467 -0.466434061594.93
7 6.03
Tristyryphenolethoxylate-28-EO -2.411118 1.90841751638.96
3 6.02Tristyryphenolethoxylate-29-EO -7.3978014 -11.465272 1682.99 6.02
Tristyryphenolethoxylate-30-EO 40.23051 -31.4898281727.01
5 6.00
Tristyryphenolethoxylate-31-EO 13.274889 0.540102661771.04
5 6.06
Tetrastyryphenolethoxylate-5-EO -3.7890558 -8.516457730.422
8 6.31
Tetrastyryphenolethoxylate-6-EO -12.51962 -19.076212774.450
5 6.33
Tetrastyryphenolethoxylate-7-EO -4.578877 -27.566341818.476
7 6.36
Tetrastyryphenolethoxylate-8-EO -19.086279 -12.592126862.502
4 6.37
Tetrastyryphenolethoxylate-9-EO -6.1373577 -26.144741906.526
2 6.35
Tetrastyryphenolethoxylate-10-EO -13.65941 -10.564696950.555
5 6.38
Tetrastyryphenolethoxylate-11-EO -6.8554664 -3.5307236994.580
1 6.38
Tetrastyryphenolethoxylate-12-EO -7.446675 -6.32799861038.60
7 6.38
Tetrastyryphenolethoxylate-13-EO -3.7851732 -4.2989471082.63
3 6.38Tetrastyryphenolethoxylate-14-EO -1.3549933 -0.73320895 1126.66 6.38
Tetrastyryphenolethoxylate-15-EO -1.3206834 -0.871985851170.68
6 6.38
Tetrastyryphenolethoxylate-16-EO -2.1694055 -0.74203121214.71
2 6.38
Tetrastyryphenolethoxylate-17-EO -6.312905 -8.3720171258.73
8 6.37
Tetrastyryphenolethoxylate-18-EO -4.6640363 -1.18752521302.76
4 6.37Tetrastyryphenolethoxylate-19-EO -15.150156 -6.937315 1346.79 6.37
Tetrastyryphenolethoxylate-20-EO -7.81072 -5.76533561390.81
7 6.37
Tetrastyryphenolethoxylate-21-EO -14.134495 -24.125761434.84
3 6.35Tetrastyryphenolethoxylate-22-EO -14.034096 -10.08268 1478.87 6.36
Tetrastyryphenolethoxylate-23-EO -17.998505 -12.2626591522.89
5 6.34
Tetrastyryphenolethoxylate-24-EO 13.857056 -18.1752011566.91
9 6.35
Tetrastyryphenolethoxylate-25-EO 0.31084424 -0.303256061610.94
6 6.39Monostyrylphenolprop-ethoxylate-5-EO-8-PO 26.74786 13.669259
882.5688 6.09
19

Compound Component 1 Component 2 MassRetention Time
Monostyrylphenolprop-ethoxylate-6-EO-8-PO 17.234734 8.269603
926.5933 6.12
Monostyrylphenolprop-ethoxylate-7-EO-8-PO 29.101526 14.494107
970.6096 6.08
Monostyrylphenolprop-ethoxylate-8-EO-8-PO 33.514618 16.18774
1014.637 6.06
Monostyrylphenolprop-ethoxylate-9-EO-8-PO 35.42035 15.915241
1058.659 6.05
Monostyrylphenolprop-ethoxylate-10-EO-8-PO 25.031956 16.850344
1102.685 6.06
Monostyrylphenolprop-ethoxylate-11-EO-8-PO 17.60985 13.992486 1146.71 6.06Monostyrylphenolprop-ethoxylate-12-EO-8-PO 31.77927 15.785249
1190.735 6.05
Monostyrylphenolprop-ethoxylate-13-EO-8-PO 5.6304994 0.3463299
1234.761 6.04
Distyrylphenolprop-ethoxylate-5-EO-8-PO
57.404755 7.765355986.632
7 6.39Distyrylphenolprop-ethoxylate-6-EO-8-PO 57.82702 7.887388 1030.66 6.38Distyrylphenolprop-ethoxylate-7-EO-8-PO 58.48031 7.788493
1074.686 6.38
Distyrylphenolprop-ethoxylate-8-EO-8-PO 58.59349 7.7376966
1118.711 6.38
Distyrylphenolprop-ethoxylate-9-EO-8-PO 58.646797 7.669096
1162.738 6.38
Distyrylphenolprop-ethoxylate-10-EO-8-PO 58.14472 7.6415954
1206.764 6.38
Distyrylphenolprop-ethoxylate-11-EO-8-PO 57.51143 7.6519156
1250.789 6.37
Distyrylphenolprop-ethoxylate-12-EO-4-PO 1.0730832 0.5492888
1062.638 6.05
Distyrylphenolprop-ethoxylate-12-EO-8-PO 56.77911 7.385921
1294.816 6.37
Distyrylphenolprop-ethoxylate-13-EO-8-PO 54.253757 9.28449
1338.839 6.37
Distyrylphenolprop-ethoxylate-14-EO-8-PO 54.626804 7.914997
1382.868 6.37
Distyrylphenolprop-ethoxylate-15-EO-8-PO 37.83858 4.5463367
1426.891 6.35
Distyrylphenolprop-ethoxylate-16-EO-8-PO 49.122604 8.906896
1470.919 6.37
Distyrylphenolprop-ethoxylate-17-EO-8-PO 6.9875383 -1.7860774
1514.936 6.29
Distyrylphenolprop-ethoxylate-18-EO-8-PO 37.346233 2.8904805
1558.969 6.35
Distyrylphenolprop-ethoxylate-19-EO-8-PO 3.4635794 0.73942816
1602.998 6.34
20

7. Comparison of TSP-16 of different suppliers and qualities
In Table S 4 the compounds in the different arrays determined by the hierarchical clustering
(HCA) performed on the combined supplier data set are given.
Table S 4: Compounds used for the combined hierarchical clustering listed together with the
corresponding arrays as defined in Figure 7 (see manuscript). The compounds are sorted according to the
order obtained by the hierarchical clustering of the compounds.
Array Compound Array Compound1 Distyrylphenolprop-ethoxylate-16-
EO 8-PO5 Distyrylphenolethoxylate-15-EO
1 Distyrylphenolprop-ethoxylate-13-EO 8-PO
5 Distyrylphenolethoxylate-18-EO
1 Distyrylphenolprop-ethoxylate-11-EO 8-PO
5 Tristyrylphenolethoxylate-22-EO
1 Distyrylphenolprop-ethoxylate-12-EO 8-PO
5 Tristyrylphenolethoxylate-21-EO
1 Distyrylphenolprop-ethoxylate-14-EO 8-PO
5 Tristyrylphenolethoxylate-11-EO
1 Distyrylphenolprop-ethoxylate-8-EO 8-PO
5 Tristyrylphenolethoxylate-24-EO
1 Distyrylphenolprop-ethoxylate-7-EO 8-PO
5 Tristyrylphenolethoxylate-10-EO
1 Distyrylphenolprop-ethoxylate-9-EO 8-PO
5 Distyrylphenolethoxylate-21-EO
1 Distyrylphenolprop-ethoxylate-5-EO 8-PO
5 Distyrylphenolethoxylate-12-EO
1 Distyrylphenolprop-ethoxylate-6-EO 8-PO
5 Distyrylphenolethoxylate-20-EO
1 Distyrylphenolprop-ethoxylate-10-EO 8-PO
5 Tristyrylphenolethoxylate-9-EO
1 Monostyrylphenolprop-ethoxylate-11-EO 8-PO
5 Tristyrylphenolethoxylate-23-EO
1 Monostyrylphenolprop-ethoxylate-8-EO 8-PO
5 Tristyrylphenolethoxylate-8-EO
1 Monostyrylphenolprop-ethoxylate-9-EO 8-PO
5 Hexanophenone (Internal Standard)
1 Monostyrylphenolprop-ethoxylate-5-EO 8-PO
5 Distyrylphenolethoxylate-22-EO
1 Monostyrylphenolprop-ethoxylate-12-EO 8-PO
5 Distyrylphenolethoxylate-11-EO
1 Monostyrylphenolprop-ethoxylate-7-EO 8-PO
5 Distyrylphenolethoxylate-10-EO
21
Array Compound Array Compound
1 Monostyrylphenolprop-ethoxylate-10-EO 8-PO
5 Tristyrylphenolethoxylate-26-EO
1 Monostyrylphenolprop-ethoxylate-6-EO 8-PO
5 Tristyrylphenolethoxylate-16-EO
1 Distyrylphenolprop-ethoxylate-15-EO 8-PO
5 Tristyrylphenolethoxylate-15-EO
1 Distyrylphenolprop-ethoxylate-18-EO 8-PO
5 Tristyrylphenolethoxylate-17-EO
2 Tristyrylphenolethoxylate-31-EO 5 Tristyrylphenolethoxylate-18-EO2 Distyrylphenolprop-ethoxylate-19-
EO 8-PO5 Tristyrylphenolethoxylate-14-EO
2 Distyrylphenolprop-ethoxylate-12-EO 8-PO
5 Tristyrylphenolethoxylate-19-EO
2 Tetrastyrylphenolethoxylate-25-EO 5 Tristyrylphenolethoxylate-13-EO
2 Monostyrylphenolprop-ethoxylate-13-EO 8-PO
5 Tristyrylphenolethoxylate-20-EO
2 Tetratstyrylphenolethoxylate-5-EO 5 Tristyrylphenolethoxylate-12-EO2 Distyrylphenolprop-ethoxylate-17-
EO 8-PO5 Tristyrylphenolethoxylate-28-EO
2 Monostyrylphenolethoxylate-24-EO 5 Tetrastyrylphenolethoxylate-14-EO2 Tetrastyrylphenolethoxylate-6-EO 5 Tetrastyrylphenolethoxylate-15-EO2 Tetrastyrylphenolethoxylate-24-EO 5 Distyrylphenolethoxylate-24-EO2 Distyrylphenolethoxylate-29-EO 5 Tetrastyrylphenolethoxylate-16-EO3 Monostyrylphenolethoxylate-18-EO 5 Tristyrylphenolethoxylate-6-EO3 Monostyrylphenolethoxylate-19-EO 5 Distyrylphenolethoxylate-7-EO3 Monostyrylphenolethoxylate-16-EO 5 Distyrylphenolethoxylate-8-EO3 Monostyrylphenolethoxylate-17-EO 5 Tristyrylphenolethoxylate-7-EO3 Monostyrylphenolethoxylate-15-EO 5 Distyrylphenolethoxylate-9-EO3 Monostyrylphenolethoxylate-21-EO 5 Tristyrylphenolethoxylate-25-EO3 Monostyrylphenolethoxylate-13-EO 5 Distyrylphenolethoxylate-23-EO3 Monostyrylphenolethoxylate-14-EO 5 Tristyrylphenolethoxylate-5-EO3 Monostyrylphenolethoxylate-12-EO 5 Tetrastyrylphenolethoxylate-18-EO3 Monostyrylphenolethoxylate-20-EO 5 Tetrastyrylphenolethoxylate-13-EO3 Monostyrylphenolethoxylate-11-EO 5 Tetrastyrylphenolethoxylate-12-EO3 Monostyrylphenolethoxylate-23-EO 5 Tetrastyrylphenolethoxylate-17-EO3 Monostyrylphenolethoxylate-22-EO 5 Distyrylphenolethoxylate-27-EO4 Tristyrylphenolethoxylate-29-EO 5 Distyrylphenolethoxylate-5-EO4 Tetrastyrylphenolethoxylate-21-EO 5 Distyrylphenolethoxylate-6-EO4 Tetrastyrylphenolethoxylate-23-EO 5 Distyrylphenolethoxylate-26-EO4 Tetrastyrylphenolethoxylate-8-EO 5 Tetrastyrylphenolethoxylate-22-EO4 Tetrastyrylphenolethoxylate-7-EO 5 Tetrastyrylphenolethoxylate-20-EO4 Tetrastyrylphenolethoxylate-9-EO 5 Tetrastyrylphenolethoxylate-11-EO4 Tristyrylphenolethoxylate-30-EO 5 Tetrastyrylphenolethoxylate-19-EO5 Distyrylphenolethoxylate-13-EO 5 Tetrastyrylphenolethoxylate-10-EO
22

Array Compound Array Compound5 Distyrylphenolethoxylate-19-EO 5 Tristyrylphenolethoxylate-27-EO5 Distyrylphenolethoxylate-14-EO 5 Distyrylphenolethoxylate-28-EO5 Distyrylphenolethoxylate-17-EO 5 Distyrylphenolethoxylate-25-EO5 Distyrylphenolethoxylate-16-EO
8. Statistical evaluation of the results on the content of the components in
TSP-16 on their use for product identification
As described, there were substantial differences in the contents of the main components,
MSP-, DSP-, TSP- and TeSP ethoxylates, and the by-products, copolymerized propoxylates-
ethoxylates of MSP and DSP, in the commercial TSP-16. These differences could be used as
signature for product identification. Therefore, model formulation samples were prepared
containing TSP-16 of each supplier and quality (A, B1, B2, C). In order to validate the
clustering on TSP-16 according to its suppliers, the samples used for the model formulation
were not part of the original data set. These samples were then analyzed in order to test if they
were assigned correctly to their suppliers using both PCA and hierarchical clustering. In the
following, the results of the PCA (Figure S 6) and of the HCA (Figure S 7) are displayed. In
case of the HCA the clustering according to the compounds (y-axis) is compressed as only the
clustering according to the samples (x-axis) was of interest.
23

Figure S 6: Principle component analysis of the data sets from supplier A (Cross), B1 (Arrow), B2
(Horizontal Bar) and C (Vertical bar) together with the data of the formulation samples containing TSP-
16 of supplier A (Square), B1 (Diamond), B2 (Circle) and C (Triangle). For the PCA the whole data set
was taken including the 3 repetition analysis each production batch and formulation sample.
Figure S 7: Combined hierarchical clustering of the samples (x-axis) and the compounds (y-axis) detected
in the samples of supplier A, B1, B2 and C together with sample of formulation containing TSP-16 of
Supplier A, B1, B2 and C. Each sample is the average of 3 repetition analyses. The content of a compound
Component 1 (63.2 %)
Component 2 (22.1 %)
24
in the analyzed sample is coded via black-white rectangles in the column beneath the respective samples.
The color ranges from black, compound not detected, over grey, compound as abundant as internal
standard, to white, compound with the maximum content.
As demonstrated, both data analysis techniques were correctly assigning the TSP-16 in the
model formulation to their corresponding suppliers. Using the PCA all four formulation
samples were identified in their corresponding supplier cluster. They were all group within the
clusters of their suppliers, as shown in the top dendrogram. The linkage of the formulation
samples to a sample of the corresponding supplier cluster in the HCA was formed for all four
samples at least two levels lower than the linkage of the respective supplier cluster. The
assignments to the corresponding suppliers displayed in Figure S 7 were thus reasonable. The
developed method combining instrumental analysis and multivariate data mining enables the
identification of a supplier of TSP-16, without apparent matrix interference even though
another functionalized PEG, an ethoxylated alcohol, had been used as well in the chosen
model formulation.
9. Example for interference on analysis of TSP-16 in agrochemical
formulations
The identification of the different suppliers in an agrochemical formulation can be interfered
by end group sulfated or phosphated TSP ethoxylates, if they are contained in the
agrochemical formulation. The chromatograms of commercially available TSP-16 terminal
phosphated (a) and sulfated (b) are shown in Figure S 8 obtained in the positive ionization
mode with the identified entities of DSP-, TSP- and TeSP ethoxylates.
25

(a)
(b)
Figure S 8: Extracted ion chromatograms obtained in the positive ionization mode of terminal phosphated
(a) and sulfated (b) commercially available TSP-16. Indicated are the identified entities of DSP-, TSP and
TeSP ethoxylates.
As shown there are entities of DSP-, TSP- and TeSP ethoxylates detectable in commercially
available terminal sulfated and phosphated TSP-16 in the chosen ionization mode. These
entities of DSP-, TSP- and TeSP ethoxylates can be explained by incomplete phosphating or
sulfating of the educt TSP-16 which was not removed after the reaction from the final
commercially product. Possible interferences of these entities on the identification of the
Acquisition time [min]
Signal intensity [counts]
Signal intensity [counts]
Acquisition time [min]
26

different suppliers of TSP-16 in the matrix of the model agrochemical formulations were
investigated next. TSP-16 of supplier A, B2 and C and terminal sulfated TSP-16 were mixed
in the model agrochemical as shown in Table S 5.
Table S 5: Table of composition of the model agrochemical formulation containing terminal sulfated TSP-
16 alongside with TSP-16
Raw material Content [%] (w/w)
Active ingredient 23.0
TSP-16 2.5
TSP-16, sulfated 2.5
Dispersing agent (non-ionic) 10.0
Emulsifier 1 (non-ionic, functionalized PEG) 15.0
Emulsifier 2 (non-ionic, functionalized PPG-PEG-co-polymer) 9.0
Hydrophbically modified Clay 0.1
Acid 0.4
Solvent 37.5
These formulation samples were subjected to the analysis and multivariate data analysis
techniques developed and used in this work, with the results of the principal component
analysis (PCA) shown in Figure S 9.
27

Figure S 9: Principal component analysis of the data sets from supplier A (Cross), B1 (Arrow), B2
(Horizontal Bar) and C (Vertical bar) together with the data of the formulation samples containing TSP-
16 of supplier A (Square), B2 (Circle) and C (Triangle). For the PCA the whole data set was taken
including the 3 repetition analysis each production batch and formulation sample.
As shown the entities of DSP-, TSP- and TeSP ethoxylates contained in end group sulfated
TSP-16 interfere with the developed method. As formulations using a combination of TSP-16
and another TSP ethoxylates derivate are not widely spread this potential interference can be
accepted. Nevertheless, further investigations should test the possibility for a correction of the
observed interferences.
Component 2 (33.1 %)
Component 1 (45.2 %)
28