Embed Size (px)
Citation preview
Volume 12 Issue 3 Summer 1972
Summer 1972
Determination of Optimal Capacity of Resource-Based Recreation Determination of Optimal Capacity of Resource-Based Recreation
Facilities Facilities
Anthony C. Fisher
John V. Krutilla
Recommended Citation Recommended Citation Anthony C. Fisher & John V. Krutilla, Determination of Optimal Capacity of Resource-Based Recreation Facilities, 12 Nat. Resources J. 417 (1972). Available at: https://digitalrepository.unm.edu/nrj/vol12/iss3/8
This Article is brought to you for free and open access by the Law Journals at UNM Digital Repository. It has been accepted for inclusion in Natural Resources Journal by an authorized editor of UNM Digital Repository. For more information, please contact [email protected], [email protected], [email protected].
DETERMINATION OF OPTIMAL CAPACITY OFRESOURCE-BASED RECREATION FACILITIESt
ANTHONY C. FISHERtt and JOHN V. KRUTILLAttt
IThere are roughly three quarters of a billion acres of land in public
ownership in the United States, a substantial part of which representswild or undeveloped lands such as those found in the NationalWilderness System, and also in the National Forest, Park, and RefugeSystems. Some of this land is reserved for uses incompatible with rawmaterial exploitation by extractive industries. Examples are theWilderness and Refuge System lands. Some is de facto wilderness;i.e., land available for inclusion in the Wilderness System under termsof the Wilderness Act of 1964. Such tracts as yet unprotected bylegal wilderness status are also subject to logging, mining, conversionto cropland and other extractive purposes pending determination oftheir status.
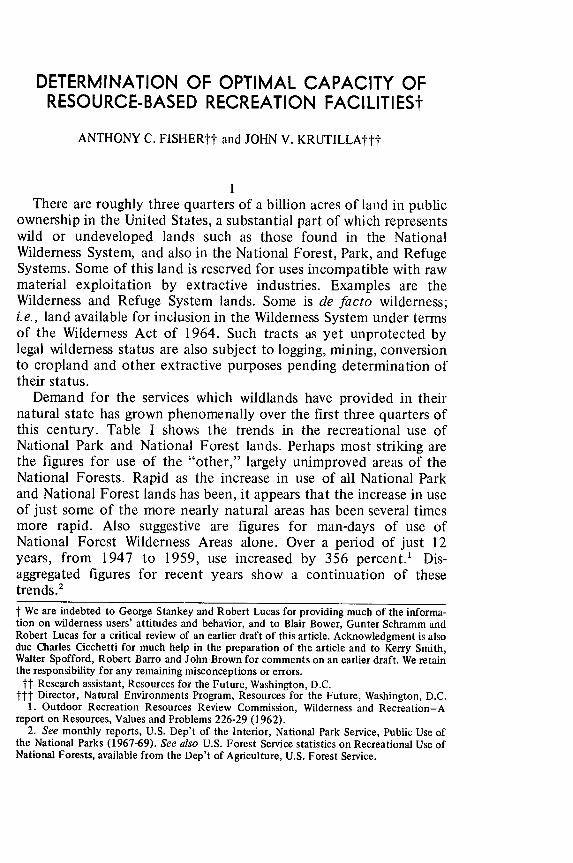
Demand for the services which wildlands have provided in theirnatural state has grown phenomenally over the first three quarters ofthis century. Table I shows the trends in the recreational use ofNational Park and National Forest lands. Perhaps most striking arethe figures for use of the "other," largely unimproved areas of theNational Forests. Rapid as the increase in use of all National Parkand National Forest lands has been, it appears that the increase in useof just some of the more nearly natural areas has been several timesmore rapid. Also suggestive are figures for man-days of use ofNational Forest Wilderness Areas alone. Over a period of just 12years, from 1947 to 1959, use increased by 356 percent.1 Dis-aggregated figures for recent years show a continuation of thesetrends.2
t We are indebted to George Stankey and Robert Lucas for providing much of the informa-tion on wilderness users' attitudes and behavior, and to Blair Bower, Gunter Schramm andRobert Lucas for a critical review of an earlier draft of this article. Acknowledgment is alsodue Charles Cicchetti for much help in the preparation of the article and to Kerry Smith,Walter Spofford, Robert Barro and John Brown for comments on an earlier draft. We retainthe responsibility for any remaining misconceptions or errors.
ftf Research assistant, Resources for the Future, Washington, D.C.ttt Director, Natural Environments Program, Resources for the Future, Washington, D.C.
1. Outdoor Recreation Resources Review Commission, Wilderness and Recreation-Areport on Resources, Values and Problems 226-29 (1962).
2. See monthly reports, U.S. Dep't of the Interior, National Park Service, Public Use ofthe National Parks (1967-69). See also U.S. Forest Service statistics on Recreational Use ofNational Forests, available from the Dep't of Agriculture, U.S. Forest Service.
NA TURAL RESOURCES JOURNAL
Table I
Visits to National Parks and National Forests,Selected Years 1904-1964
(in thousands of visits)
Areas ImprovedYear National Parks by Public Funds
National Forest Lands Other Areas'
1904 121 - -
1924 1,424 3,460 1,2001946 8,991 8,763 9,4781954 17,969 19,747 20,5571964 34,048 35,629 81,062
1. Unimproved areas, e.g., wilderness areas and a few public areas improved by non-federal means.Source: M. Clawson, The Federal Lands Since 1956 60, 95 (Resources for the Future)
(1967).
This rapid and sustained growth in demand for wildlands recrea-tion, should it continue as there is reason to believe it will, posessome problems regarding the allocation of lands among the varioususes. Most generally, the problem is one of determining the mostefficient allocation of land, whether for purposes of producingextractive industry outputs on the one hand, or preserving thenatural conditions for the recreational and other services they yieldon the other. A related problem, perhaps a sub-problem, involves theallocation of land between low density and high density recreationaluses. In either case we wish to compare the benefits from a given usewith those from an incompatible alternative use to which the re-sources may be directed. The use of resources for one purpose simplyprecludes their uses for incompatible alternative purposes, and thebenefits foregone are in effect the opportunity costs of the selecteduse, which must be added to any direct costs associated with thatuse .
3
Typically, we would anticipate that the value of the services atract of land would yield, and hence the value of the land and as-sociated resources, would differ depending on the use to which it wasput. The value of a site would then depend on its resource endow-ment and the elasticities of demand and supply for the respectiveservices it might yield. From standpoint of economic efficiency the
3. Not all users are mutually exclusive, however. Logging in mature stands may improvelight conditions for the production of understory brouse for ungulates thus improvingrecreational hunting, for example. Accordingly, there are some kinds of extractive andrecreational activities which may be complementary to a point and the problem in its largestdimensions may be the specification of the optimal product mix where joint products areinvolved. While this represents an aspect of the total problem, we shall be abstracting fromthat aspect in the article.
[Vol. 12
July 1972] OPTIMAL CAPACITY OFRECREA TION FACILITIES 419
objective would be to allocate wildlands and scenic resources in sucha way as to maximize the value of the services they yield, i.e., toallocate to their most highly valued uses over an appropriately longtime horizon.
While highly developed markets tend to achieve an efficientallocation in this sense in some areas of the economy, allocation ofwildland resources to the production of various goods and serviceshas in large measure been handled by extra-market devices in thepublic sector.4 Rather than appealing to observed market trans-actions' data, then, a variety of techniques for the estimation of dataon benefits and costs have been developed as part of the apparatus ofresource management.
Generally speaking, rather traditional benefit-cost analysis in con-junction with a wide array of inputs from the various resource man-agement disciplines can provide reasonably good estimates ofbenefits and costs of various extractive activities. Even the art ofestimating the demand for, and value of, resource-based, non-pricedoutdoor recreation services has developed in a promising way duringthe past decade or so.' Perhaps somewhat less well understood andcorrespondingly less developed is the methodology for evaluating thebenefits from preserving unique natural phenomena, particularlythose which will be reserved for or devoted to low-density recrea-tional uses. One of the reasons in the latter case, of course, turns onthe problem of optimal density for low-density recreationalactivities. Maximizing the value of a particular tract of wildland al-located, by whatever means, to the provision of low-density recrea-tional services, will require than an optimal density be chosen.6 Thisis only another way of saying that an optimal capacity needs to bedefined. The development of operational concepts for definingoptimal recreational capacity for low density recreational wildlandswill be the objective of this paper. The significance of having opera-tional concepts for determining recreational capacity will becomeobvious in the course of the analysis.
1IAt the outset, it will be useful to distinguish and clarify two
concepts of recreational capacity. The first we refer to as ecology's"carrying capacity." This is basically a biological or physical relation-
4. See J. Krutilla and J. Knetsch, Outdoor Recreational Economics, 389 Annals 63(1970). J. Krutilla, Conservation Reconsidered, 57 Am. Econ. Rev. 777 (1967).
5. T. Burton and M. Fulcher, Measurement of Recreation Benefits: A Survey, J. of Econ.Studies (1967).
6. This assumes, of course, that growth in demand will continue posing problems ofcongestion and value reduction if some capacity constraints are not enforced.
NA TURA L RESOURCES JOURNAL
ship between a given resource stock and its maximum sustainedyield, i.e., the maximum number of individuals of a species whichcan be supported by a given habitat under conditions of maximumstress.
The economist's conception of capacity is usually given in a phys-ical measure but in terms of a product of constant quality. Accord-ingly, when we speak of a wilderness experience as the product orservice sought, we recognize that solitude as well as primeval settingare dimensions of the quality of the service. With sufficient amountof wilderness area relative to the demand for the services, it is con-ceivable that a constant quality of the wilderness experience can berealized. However, at some point an increase in the number of wilder-ness recreationists will involve some trail and camp encountersimpinging on the privacy and solitude sought. At this point onewould anticipate an erosion of the quality of the recreation ex-perience. Quality deterioration through what is referred to as theexternal effects of congestion may exceed the permissible level foroptimal intensity of use, in an economist's sense, substantially beforethe carrying capacity in the ecologist's sense is reached. Conversely,for some areas supporting fragile ecosystems subject to some types ofuses, the constraint may need to be set before significant congestioncosts are experienced if the ecological integrity of the area is to beprotected. It is important, then, to note the distinction betweenthese concepts of capacity and to distinguish them in our treatmentof the problem in what follows below.
Following Stankey,7 albeit using an economic rationale, we shallconsider a low-density (hereafter referred to as a wilderness experi-ence) recreation use of a differentiated product catering to a rela-tively specialized clientele or sub-market. Stankey has employed arationale based on an extra-market allocative device (politicalprocess) for selecting his "public," "clientele," or, in our terms, therelevant "customer" given the particular product market we are in-vestigating. We can assume, as does Stankey, that the wildland tractin question has been designated as a de jure wilderness area, and ourinterest could center on determining what intensity of use wouldmaximize the value of the service-flow. On the other hand, we canselect for analysis a given tract in order to determine whether itsvalue as a wilderness recreation resource would exceed its value as ahigh-density recreational resource, or alternatively even as a source ofnatural resource commodities exploited in a manner incompatible
7. G. Stankey, The Perception of Wilderness Recreation Carrying Capacity: A Geo-graphic Study in Natural Resources Management (Ph.D. Thesis, Michigan State University,1971).
[Vol. 12
July 19721 OPTIMAL CAPACITY OF RECREA TION FACILITIES 421
with retaining its integrity as a natural area.' In the latter case, wewould wish to establish the benefit of the tract when retained in itswild state by fixing the intensity of use at that level which wouldmaximize the value of the preservation alternative for its comparisonwith the opportunity returns foregone by precluding the higherdensity development or the incompatible extractive alternatives.
Our analysis assumes a multi-modal distribution of tastes in recrea-tion pursuits. That is, we are taking it for granted that those whoelect to devote a significant portion of their leisure time to outdooractivities involving the remote back country as compared with thosewho devote vacation periods to more gregarious socially interactingsituations, tend to cluster in mutually exclusive groups.9 And aseconomists with a substantial respect for the efficacy of the market(where conditions for its efficient operation exist) in allocating re-sources to the gratification of the entire range of tastes, we addressourselves in this analysis to only those individuals "in the market"for the wilderness type experience.' 0 From this point forward weshall be addressing that segment of the outdoor recreation marketrepresented by the unambiguous wilderness experience seeker, forwhom solitude is a desired objective, the satisfaction or utility gainedfrom the wilderness experience tends to be inversely related to thenumber of encounters he experiences with others during a wildernessouting.'
1I
In this section we shall review the analytics of determining anoptimal recreation capacity for low-density recreational use facilities.Let us consider a relatively homogeneous group of recreationists whowish to enjoy a wilderness recreation experience. By homogeneouswe intend the assumption that, as suggested in Section I1, an increase
8. An example of the latter objective analysis involves the current controversy overwhether to retain the remaining portion of Hells Canyon in its present condition as a wildand scenic recreational resource or develop the Snake River in this reach as a hydroelectricproject.
9. That is, the backpacker in the wilderness, a solitude seeker, is unlikely to be foundattending vacations at high-density vacation facilities. But preferences for solitude may beheld ephemerally for "contrast" so that a lone backpacker during a vacation may be asocializing square dance buff as well.
10. This task of allocating resources to cater to the preferences of those seeking wilder-ness and related types of experience is one which the market would fail to perform ef-ficiently, thereby justifying public intervention (see supra note 4). But if intervention is tobe sufficient as well as necessary for an improvement in the efficiency with which resourcesare allocated, it must make provision for the entire range of tastes in proportion to thenumber of consumers involved and the elasticities, price and income, current and projected,of their demand. For purposes of our analysis, we address ourselves to that segment of thetotal market for recreational services which demands wilderness recreation services.
11. See Stankey, supra note 7.
NA TURAL RESOURCES JOURNAL
in the probability of encountering others on a wilderness outing isattended by diminished utility obtained from the outing. Forsimplicity, we assume also a uniform distribution of recreationiststemporally over the recreation season. A season in this context canbe segmented into as many intervals as necessary to ensure a rela-tively homogeneous experience. We would distinguish between thesummer backpacking season and the autumn hunting season, forexample. There may be other finer divisions also.
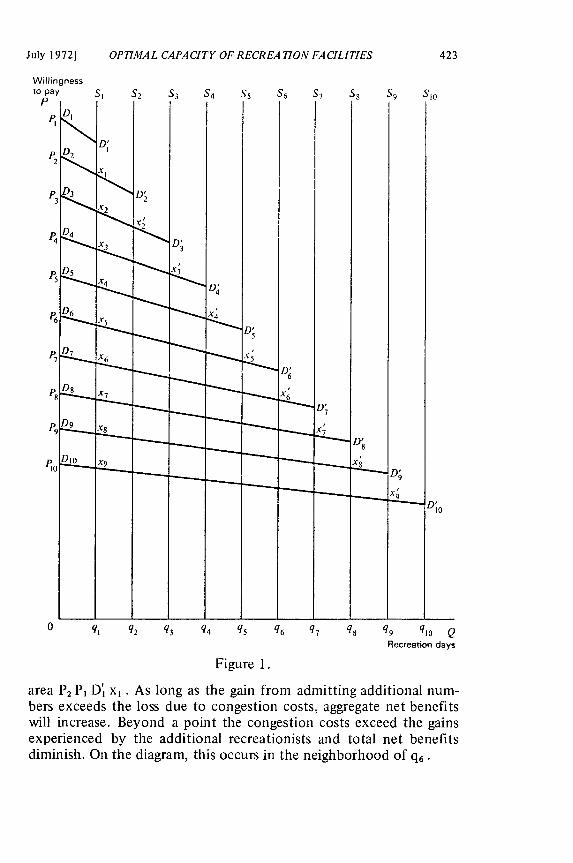
With these assumptions we present in Figure 1 a rather special setof aggregate demand schedules. On the horizontal axis we have useintensity represented by the quantity of recreation days (or recrea-tionists) per unit time. Thus q, represents a density half as great asq 2 , a third as great as q3 , etc., and with an expected encounter ratepeculiar to the use intensity in question. Along the vertical axis wehave represented the price, or willingness to pay per recreation day.For convenience of diagrammatic exposition, let us assumemomentarily that there are thresholds with any changes in intensityof use within ranges demarcated by such thresholds not resulting inany congestion costs, but intensity differences between onethreshold and another, moving from the origin to the right, beingattended by quantum jumps in utility-diminishing congestion effects.Accordingly, for any intensity of use within the range of 0 to q, , weconsider the quality of the wilderness experience constant. This ex-perience, being free of adverse congestion effects, represents therange of highest unit value wilderness experience and is representedby the highest demand schedule DI DI The total value of the recrea-tion service flow per unit time with capacity fixed at q, (and fullyutilized) is represented by the area under the demand scheduleD1 D' , here OPI D' ql .i 2
Admission of additional unambiguous wilderness experienceseekers would be attended by the addition of utility enjoyed bythem. But an increase in the density of recreationists would result ina deterioration of the quality of the experience as compared with theexperience at the lower encounter level. The relevant demand sched-ule might then be drawn as D2 D2 for a service with a quality nowfixed by the use intensity represented by 0q 2. The demand curve forthe changed quality of service being lower, represents the diminutionof utility per unit previously enjoyed by those who experienced thewilderness with no adverse congestion effects. Accordingly, the gainin utility enjoyed by the additional numbers participating would berepresented by the area q, x1 D'2 q2 . The loss is represented by the
12. See J. Knetsch and R. Davis, Comparison of Methods For Recreation Evaluation, inWater Research (A. Kneese and S. Smith ed. 1966).
[Vol. 12
July 1972] OPTIMAL CAPACITY OFRECREA TION FACILITIES
Willingnessto pay
P
0 q, q2 q 3 q4 q5 q 6 q7 q, q9 q10 QRecreation days
Figure 1.
area P, P, D, x, . As long as the gain from admitting additional num-bers exceeds the loss due to congestion costs, aggregate net benefitswill increase. Beyond a point the congestion costs exceed the gainsexperienced by the additional recreationists and total net benefitsdiminish. On the diagram, this occurs in the neighborhood of q6 •
NA TURA L RESOURCES JOURNAL
Now if there are no costs other than the so-called "externalities"or adverse effects of congestion, the maximum net total benefit levelof use would also define the optimal recreation capacity for such alow-density recreation facility or natural area. But there may, andnormally will, be other costs as well. For example, the cost ofpotential environmental degradation of the sort Brandborg hasalluded to, where recreational pressure may exert an adverse effecton the ecological environment.' 3 Moreover, as Wagar and others'"have noted, costs in the form of operating expenditures may beincurred to reduce, modify or eliminate the adverse effects of con-gestion. Further, costs in the form of investment outlays to furtherexpand the intensive margins (e.g., laying out a duplicating but non-intersecting trail system to reduce or eliminate the probability ofincreased encounters with increased recreational density), may, andin the normal situation would, qualify for consideration in a well-managed wilderness area or system. Accordingly, the maximum totalbenefit as defined above is not likely to indicate the optimal recrea-tion capacity for the wilderness tract in question. The reasons willbe: a) ecological degradation costs will not have been taken intoaccount, and b) the possibility of incurring capacity augmenting ex-penditures must be considered at any time-and over time-in deter-mining optimal recreation capacity for a given tract of land.
To take account of these factors in our diagrammatic analytics, weneed to return to Figure 1, and from the basic notions containedtherein, derive an additional set of geometric relationships.
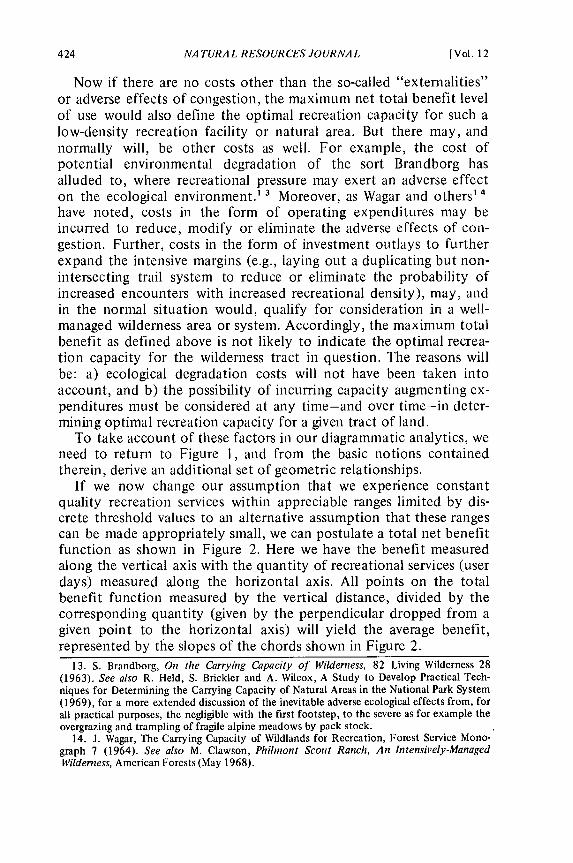
If we now change our assumption that we experience constantquality recreation services within appreciable ranges limited by dis-crete threshold values to an alternative assumption that these rangescan be made appropriately small, we can postulate a total net benefitfunction as shown in Figure 2. Here we have the benefit measuredalong the vertical axis with the quantity of recreational services (userdays) measured along the horizontal axis. All points on the totalbenefit function measured by the vertical distance, divided by thecorresponding quantity (given by the perpendicular dropped from agiven point to the horizontal axis) will yield the average benefit,represented by the slopes of the chords shown in Figure 2.
13. S. Brandborg, On the Carrying Capacity of Wilderness, 82 Living Wilderness 28(1963). See also R. Held, S. Brickler and A. Wilcox, A Study to Develop Practical Tech-niques for Determining the Carrying Capacity of Natural Areas in the National Park System(1969), for a more extended discussion of the inevitable adverse ecological effects from, forall practical purposes, the negligible with the first footstep, to the severe as for example theovergrazing and trampling of fragile alpine meadows by pack stock.
14. J. Wagar, The Carrying Capacity of Wildlands for Recreation, Forest Service Mono-graph 7 (1964). See also M. Clawson, Philmont Scout Ranch, An Intensively-ManagedWilderness, American Forests (May 1968).
[Vol. 12
July 1972] OPTIMAL CAPACITY OF RECREATION FACILITIES 425
Total benefits
B4
B3
BI
q2 q3 q4 q5 q6 q, q8 q9Recreation days
Figure 2.
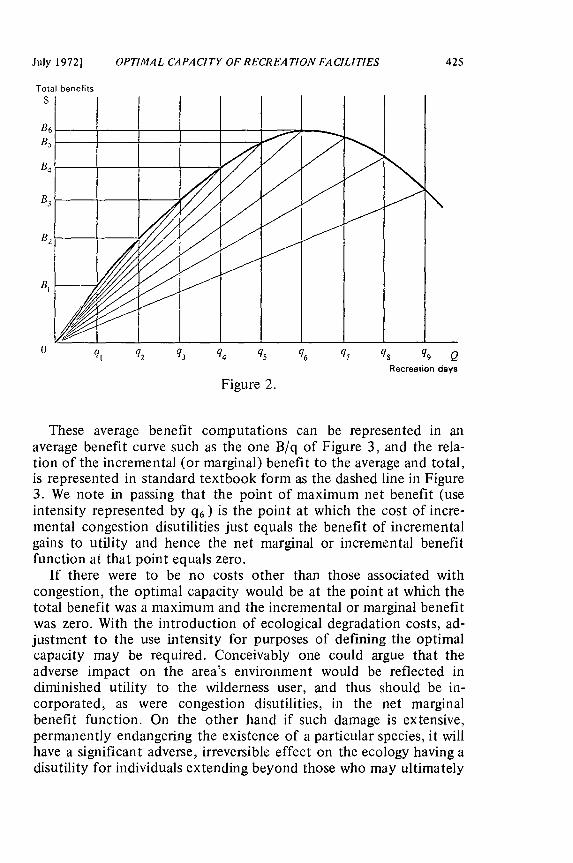
These average benefit computations can be represented in anaverage benefit curve such as the one B/q of Figure 3, and the rela-tion of the incremental (or marginal) benefit to the average and total,is represented in standard textbook form as the dashed line in Figure3. We note in passing that the point of maximum net benefit (useintensity represented by q6 ) is the point at which the cost of incre-mental congestion disutilities just equals the benefit of incrementalgains to utility and hence the net marginal or incremental benefitfunction at that point equals zero.
If there were to be no costs other than those associated withcongestion, the optimal capacity would be at the point at which thetotal benefit was a maximum and the incremental or marginal benefitwas zero. With the introduction of ecological degradation costs, ad-justment to the use intensity for purposes of defining the optimalcapacity may be required. Conceivably one could argue that theadverse impact on the area's environment would be reflected indiminished utility to the wilderness user, and thus should be in-corporated, as were congestion disutilities, in the net marginalbenefit function. On the other hand if such damage is extensive,permanently endangering the existence of a particular species, it willhave a significant adverse, irreversible effect on the ecology having adisutility for individuals extending beyond those who may ultimately
NA TURA L RESO UR CES JO URNA L
$C
0 (
0 1 q2 q3 q4 q5
Figure 3.
- average benefits
q, q9 QRecreation days
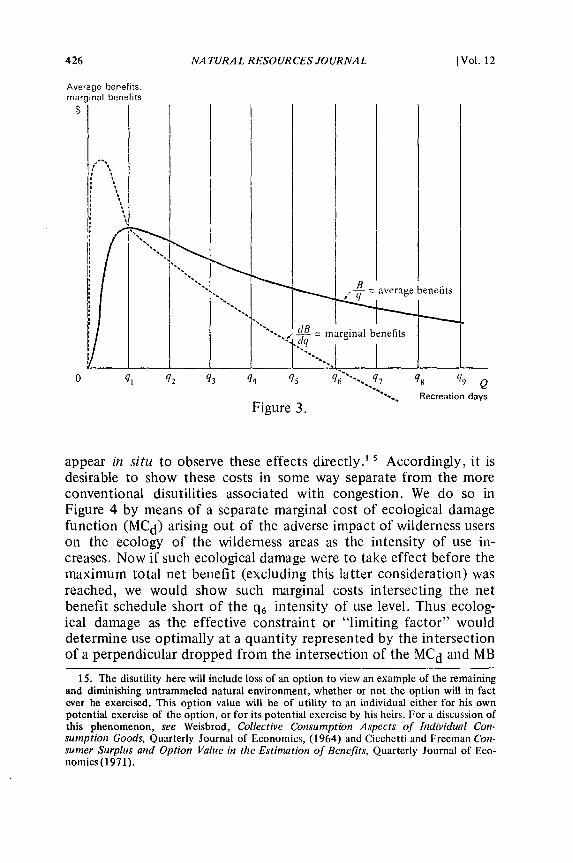
appear in situ to observe these effects directly.' s Accordingly, it isdesirable to show these costs in some way separate from the moreconventional disutilities associated with congestion. We do so inFigure 4 by means of a separate marginal cost of ecological damagefunction (MCd) arising out of the adverse impact of wilderness userson the ecology of the wilderness areas as the intensity of use in-creases. Now if such ecological damage were to take effect before themaximum total net benefit (excluding this latter consideration) wasreached, we would show such marginal costs intersecting the netbenefit schedule short of the q6 intensity of use level. Thus ecolog-ical damage as the effective constraint or "limiting factor" woulddetermine use optimally at a quantity represented by the intersectionof a perpendicular dropped from the intersection of the MCd and MB
15. The disutility here will include loss of an option to view an example of the remainingand diminishing untrammeled natural environment, whether or not the option will in factever be exercised. This option value will be of utility to an individual either for his ownpotential exercise of the option, or for its potential exercise by his heirs. For a discussion ofthis phenomenon, see Weisbrod, Collective Consumption Aspects of Individual Con-sumption Goods, Quarterly Journal of Economics, (1964) and Cicchetti and Freeman Con-sumer Surplus and Option Value in the Estimation of Benefits, Quarterly Journal of Eco-nomics (197 1).
[Vol. 12
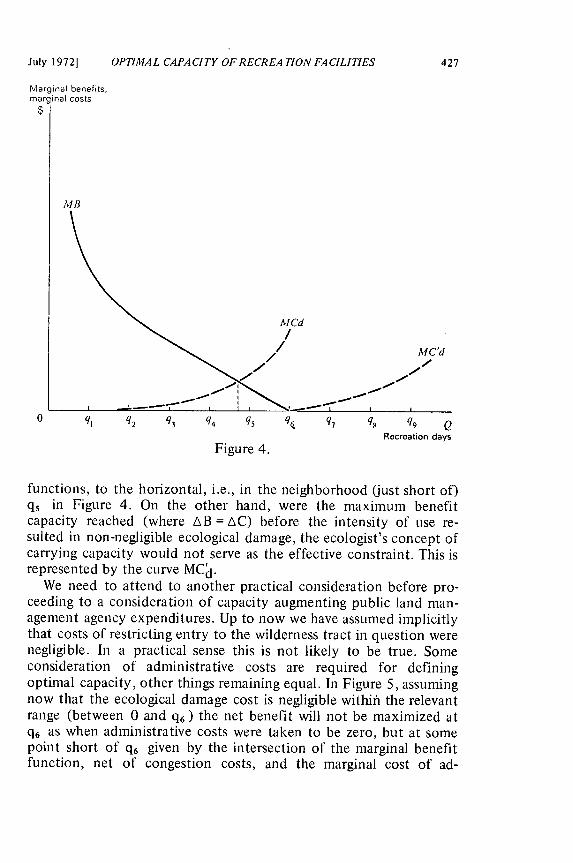
July 1972] OPTIMAL CAPACITY OFRECREA TION FACILITIES
0 q, q2 q3 q4 q5 q6 q7 q 8 q9 QRecreation days
Figure 4.
functions, to the horizontal, i.e., in the neighborhood (just short of)q5 in Figure 4. On the other hand, were the maximum benefitcapacity reached (where AXB = AC) before the intensity of use re-sulted in non-negligible ecological damage, the ecologist's concept ofcarrying capacity would not serve as the effective constraint. This isrepresented by the curve MC I.
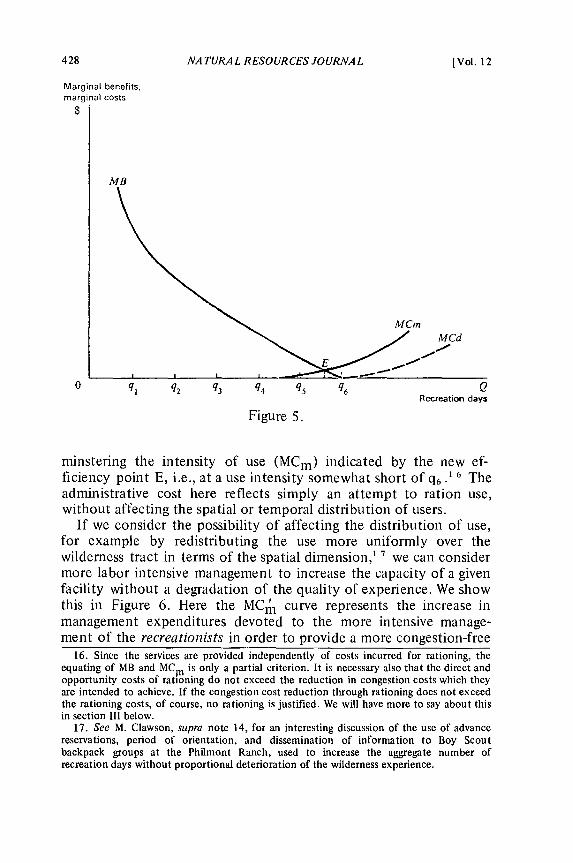
We need to attend to another practical consideration before pro-ceeding to a consideration of capacity augmenting public land man-agement agency expenditures. Up to now we have assumed implicitlythat costs of restricting entry to the wilderness tract in question werenegligible. In a practical sense this is not likely to be true. Someconsideration of administrative costs are required for definingoptimal capacity, other things remaining equal. In Figure 5, assumingnow that the ecological damage cost is negligible withihi the relevantrange (between 0 and q 6 ) the net benefit will not be maximized atq6 as when administrative costs were taken to be zero, but at somepoint short of q6 given by the intersection of the marginal benefitfunction, net of congestion costs, and the marginal cost of ad-
NA TURA L RESOURCES JOURNAL
Marginal benefits,marginal costs$
MB
MCmMlCd
0 q q2 q3 q4 q, q6 QRecreation days
Figure 5.
minstering the intensity of use (MCm) indicated by the new ef-ficiency point E, i.e., at a use intensity somewhat short of q6 .1 6 Theadministrative cost here reflects simply an attempt to ration use,without affecting the spatial or temporal distribution of users.
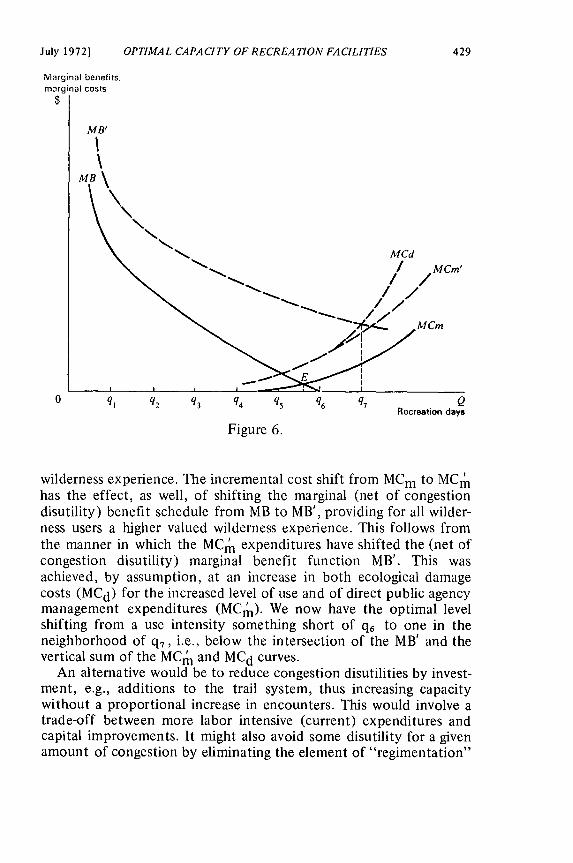
If we consider the possibility of affecting the distribution of use,for example by redistributing the use more uniformly over thewilderness tract in terms of the spatial dimension,' " we can considermore labor intensive management to increase the capacity of a givenfacility without a degradation of the quality of experience. We showthis in Figure 6. Here the MC m curve represents the increase inmanagement expenditures devoted to the more intensive manage-ment of the recreationists in order to provide a more congestion-free
16. Since the services are provided independently of costs incurred for rationing, theequating of MB and MCm is only a partial criterion. It is necessary also that the direct andopportunity costs of rationing do not exceed the reduction in congestion costs which theyare intended to achieve. If the congestion cost reduction through rationing does not exceedthe rationing costs, of course, no rationing is justified. We will have more to say about thisin section III below.
17. See M. Clawson, supra note 14, for an interesting discussion of the use of advancereservations, period of orientation, and dissemination of information to Boy Scoutbackpack groups at the Philmont Ranch, used to increase the aggregate number ofrecreation days without proportional deterioration of the wilderness experience.
[Vol. 12
July 1972] OPTIMAL CAPACITY OFRECREATION FACILITIES
Marginal benefits,marginal costs
0 q1 q2 q3 q4 q5 q6 q7 QRecreation days
Figure 6.
wilderness experience. The incremental cost shift from MCm to MCrhas the effect, as well, of shifting the marginal (net of congestiondisutility) benefit schedule from MB to MB', providing for all wilder-ness users a higher valued wilderness experience. This follows fromthe manner in which the MCm expenditures have shifted the (net ofcongestion disutility) marginal benefit function MB'. This wasachieved, by assumption, at an increase in both ecological damagecosts (MCd) for the increased level of use and of direct public agencymanagement expenditures (MCm). We now have the optimal levelshifting from a use intensity something short of q6 to one in theneighborhood of q, i.e., below the intersection of the MB' and thevertical sum of the MC m and MCd curves.
An alternative would be to reduce congestion disutilities by invest-ment, e.g., additions to the trail system, thus increasing capacitywithout a proportional increase in encounters. This would involve atrade-off between more labor intensive (current) expenditures andcapital improvements. It might also avoid some disutility for a givenamount of congestion by eliminating the element of "regimentation"
NATURAL RESOURCES JOURNAL
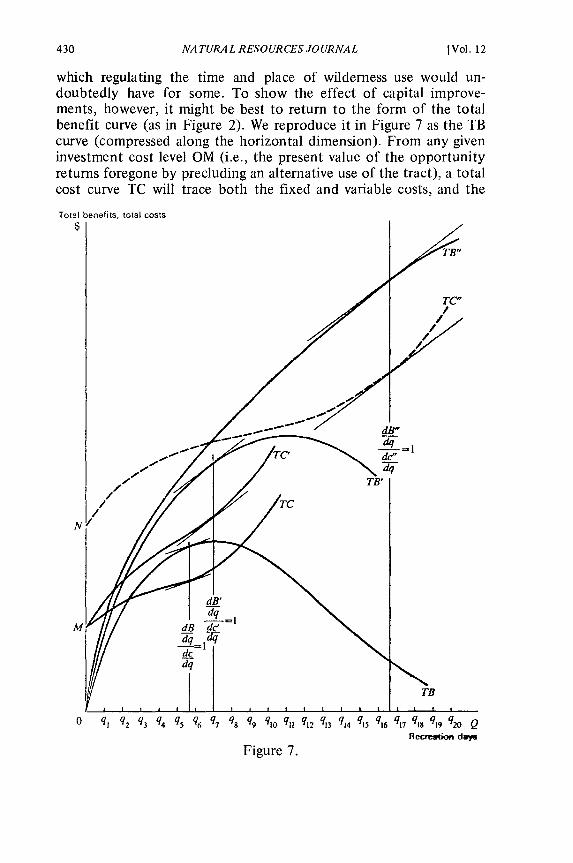
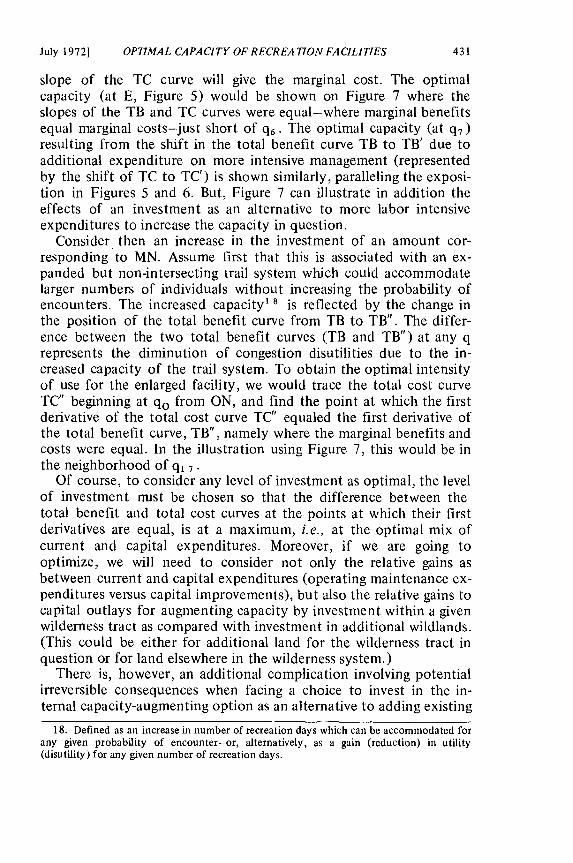
which regulating the time and place of wilderness use would un-doubtedly have for some. To show the effect of capital improve-ments, however, it might be best to return to the form of the totalbenefit curve (as in Figure 2). We reproduce it in Figure 7 as the TBcurve (compressed along the horizontal dimension). From any giveninvestment cost level OM (i.e., the present value of the opportunityreturns foregone by precluding an alternative use of the tract), a totalcost curve TC will trace both the fixed and variable costs, and the
Total benefits, total costs
Recreatkm day
Figure 7.
[Vol. 12
July 1972] OPTIMAL CAPACITY OFRECREA TION FACILITIES
slope of the TC curve will give the marginal cost. The optimalcapacity (at E, Figure 5) would be shown on Figure 7 where theslopes of the TB and TC curves were equal-where marginal benefitsequal marginal costs-just short of q 6 . The optimal capacity (at q?)resulting from the shift in the total benefit curve TB to TB' due toadditional expenditure on more intensive management (representedby the shift of TC to TC') is shown similarly, paralleling the exposi-tion in Figures 5 and 6. But, Figure 7 can illustrate in addition theeffects of an investment as an alternative to more labor intensiveexpenditures to increase the capacity in question.
Consider then an increase in the investment of an amount cor-responding to MN. Assume first that this is associated with an ex-panded but non-intersecting trail system which could accommodatelarger numbers of individuals without increasing the probability ofencounters. The increased capacity' I is reflected by the change inthe position of the total benefit curve from TB to TB". The differ-ence between the two total benefit curves (TB and TB") at any qrepresents the diminution of congestion disutilities due to the in-creased capacity of the trail system. To obtain the optimal intensityof use for the enlarged facility, we would trace the total cost curveTC" beginning at qo from ON, and find the point at which the firstderivative of the total cost curve TC" equaled the first derivative ofthe total benefit curve, TB", namely where the marginal benefits andcosts were equal. In the illustration using Figure 7, this would be inthe neighborhood of q1 7 •
Of course, to consider any level of investment as optimal, the levelof investment mist be chosen so that the difference between thetotal benefit and total cost curves at the points at which their firstderivatives are equal, is at a maximum, i.e., at the optimal mix ofcurrent and capital expenditures. Moreover, if we are going tooptimize, we will need to consider not only the relative gains asbetween current and capital expenditures (operating maintenance ex-penditures versus capital improvements), but also the relative gains tocapital outlays for augmenting capacity by investment within a givenwilderness tract as compared with investment in additional wildlands.(This could be either for additional land for the wilderness tract inquestion or for land elsewhere in the wilderness system.)
There is, however, an additional complication involving potentialirreversible consequences when facing a choice to invest in the in-ternal capacity-augmenting option as an alternative to adding existing
18. Defined as an increase in number of recreation days which can be accommodated forany given probability of encounter-or, alternatively, as a gain (reduction) in utility(disutility) for any given number of recreation days.
NA TURAL RESOURCES JOURNAL
de facto wilderness land to the system. If de facto wilderness, un-protected by wilderness status is subject to depletion by other incom-patible uses, the value of the present option will be lost, whereas theoption to invest in internal improvements remains open. In fact, thisoption would remain as an alternative in the event the opportunitycosts of holding wilderness tracts would rise sufficiently to counseldisinvesting in extensive tracts. As these considerations are sub-stantial, meriting separate investigation, we note them here only inpassing.' I This article, as an initial effort, will abstract from theproblem of defining criteria for choice, involving irreversibilities anduncertainty.
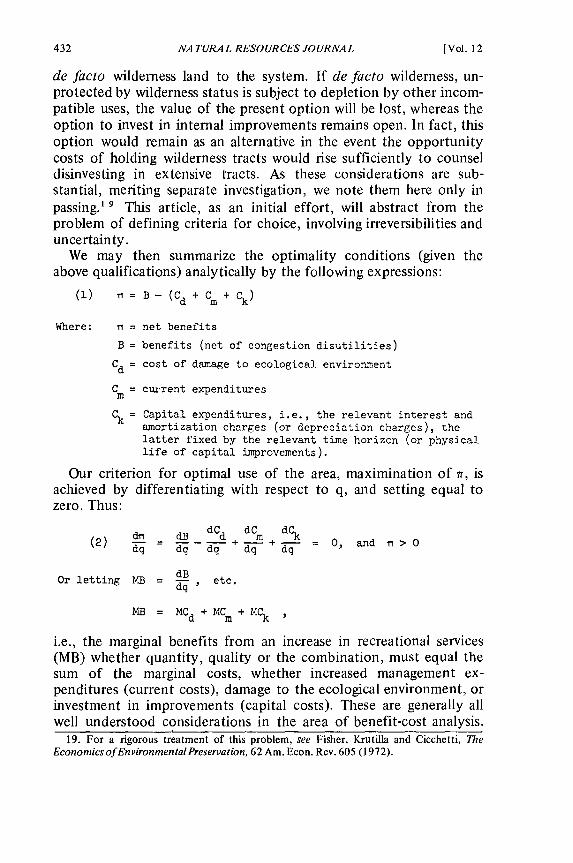
We may then summarize the optimality conditions (given theabove qualifications) analytically by the following expressions:
(1) - B-(Cd + c, )
Where: r = net benefits
B = benefits (net of congestion disutilities)
Cd = cost of damage to ecological environment
C = current expendituresm
Ck = Capital expenditures, i.e., the relevant interest andamortization charges (or depreciation charges), thelatter fixed by the relevant time horizon (or physicallife of capital improvements).
Our criterion for optimal use of the area, maximination of 7r, isachieved by differentiating with respect to q, and setting equal tozero. Thus:
(B ded dC dCk(2) d d + + 0 0, and r > 0
dq T d q dIq dq_dB
Or letting MB = L-, etc.
MB = MCd + N + MCk
i.e., the marginal benefits from an increase in recreational services(MB) whether quantity, quality or the combination, must equal thesum of the marginal costs, whether increased management ex-penditures (current costs), damage to the ecological environment, orinvestment in improvements (capital costs). These are generally allwell understood considerations in the area of benefit-cost analysis.
19. For a rigorous treatment of this problem, see Fisher, Krutilla and Cicchetti, TheEconomics of Environmental Preservation, 62 Am. Econ. Rev. 605 (1972).
[Vol. 12
July 1972] OPTIMAL CAPACITY OF RECREATION FACILITIES 433
The problem, as in the case of all things which are rather well under-stood in principle, is application in practice. We make our initialefforts in exploring application in the next section.
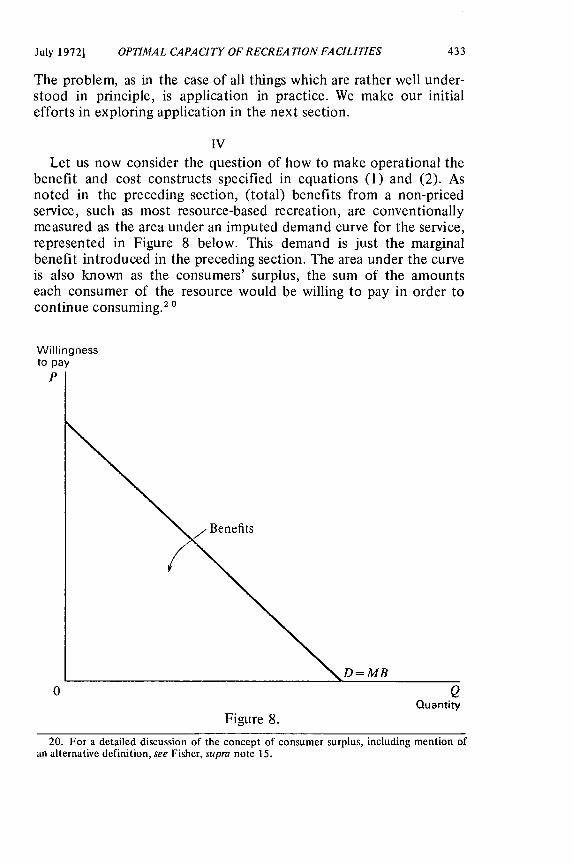
IVLet us now consider the question of how to make operational the
benefit and cost constructs specified in equations (1) and (2). Asnoted in the preceding section, (total) benefits from a non-pricedservice, such as most resource-based recreation, are conventionallymeasured as the area under an imputed demand curve for the service,represented in Figure 8 below. This demand is just the marginalbenefit introduced in the preceding section. The area under the curveis also known as the consumers' surplus, the sum of the amountseach consumer of the resource would be willing to pay in order tocontinue consuming.20
Willingnessto pay
Benefits
Figure 8.
20. For a detailed discussion of the concept of consumer surplus, including mention ofan alternative definition, see Fisher, supra note 15.
NA TURA L RESOURCES JOURNAL
Our problem, then, is in part the familiar one of finding a way toobserve and aggregate consumer willingness to pay for recreation, butonly in part, as we are concerned also to capture the effects ofvarying levels of congestion on this willingness to pay. Thus themarginal benefit curve of Figure 8, like those of Figures 4, 5 and 6,represents benefits excluding congestion costs. Most of the remainderof this article details our proposals for estimating this curve for aparticular recreation season at a particular site.'' In our judgment,supported further on by some brief discussion of costs, this esti-mation constitutes the heart of the optimal capacity problem.
Before proceeding, let us try to indicate why a monetary measure,such as willingness to pay, is to be preferred to some non-monetaryalternative measure of benefits. Suppose, first, that benefits could bemeasured, and then aggregated, in some agreed upon non-monetary,arbitrary utility units (AU's). Suppose, further, that ecological dam-age costs are not significant. Recalling the discussion of the precedingsection as summarized in eq. (2), it can be seen that efficient utiliza-tion of the environmental resources for recreation requires abalancing of marginal AU's against the marginal dollar expendituresof the management agency. Now if marginal benefits were observedto be negative in the absence of any restriction on use, there wouldbe a presumption that some restriction might be desirable. But, therewould be no way of knowing how much, as there would be no wayof comparing incremental changes in benefits measured in AU's withincremental changes in the costs incurred in restricting use measuredin dollars.
Moreover, it is generally understood that there is not in fact anylegitimate way to aggregate intensities of preferences (the AU's)across individuals, as would be required for the above procedure . 2
Even assuming some cardinal measure of utility to be associated witha particular wilderness outing for each individual, it seems that aggre-gation would require further assumptions of a dubious nature. To seethis let us assume that there exists for each individual a functionrelating the "percent of complete satisfaction" from a wildernessouting to its degree of congestion. Now in order to aggregate, say, 90percent satisfaction (90 AU's) for one individual with 90 percent
21. Our definition of "recreation season" is a fairly loose one. Essentially, it is designedto avoid lumping in various activities with dissimilar congestion effects, such as summerbackpacking, fall hunting, and winter skiing, that might be undertaken over the course of asingle year in an area. We owe this point to Gunter Schramm's discussion of an earlier draftof the article.
22. This is a very old problem in welfare economics. Some notion of the difficulties canbe obtained by consulting K. Arrow and T. Scitovsky, A.E.A. Readings in Welfare Eco-nomics (1969).
[Vol. 12
July 1972] OPTIMAL CAPACITY OF RECREA TION FACILITIES
satisfaction (90 AU's) for another to get a total of 180 AU's for agiven outing, we would need to make interpersonal comparisons.This would involve assuming that both individuals have an equalcapacity for enjoying the outing and, moreover, that both have anequal proportion of their welfare associated with it. To appreciatethat this would not, in general, be true we can imagine two indi-viduals, one having a keen interest in the outing with high expecta-tions associated with it, and the second only mildly enthusiastic.Both may have their expectations realized to the same degree, andwould indicate the same percentage of complete satisfaction, yet theamount of utility each would derive from the experience woulddiffer. This difference should be reflected in any measure of ag-gregate benefits.
On the other hand, if it could be learned from each individualwhat he would be willing to pay for a day of wilderness recreationcharacterized by a given degree of congestion, intensities of prefer-ences would be reflected in an easily aggregated measure. Of course,even this measure is not free from interpersonal considerations, as itis dependent on the existing distribution of income. There are how-ever several possible answers to objections on distributional groundsto a monetary measure of recreation benefits. First, we might assumean exogenous, socially sanctioned distribution of income, affectedperhaps by explicit policies for redistribution such as a negative in-come tax. This is the tack generally taken by economists focusing onthe efficiency of a particular allocative scheme. Second, we mightnote the positive relation between participation in wilderness recrea-tion and income (and education), and that such recreation can beclassed as a "luxury" good, i.e., one for which demand rises morethan proportionally with income. 3 Finally, we have to this pointconsidered the monetary measure merely as a conceptual device forbenefit evaluation. Nothing has been said about actual institution ofuser charges.
Use of a monetary measure makes possible the solution of anotheraggregation problem as well. Individual demand may encompass wil-lingness to pay for not just a single day in the wilderness, but forseveral days. Thus if we know that an individual is willing to pay,say, $10 for one day, and $15 for two days, then the marginal valueof the first day is obviously $10, and of the second, $5. The totalvalue of an area for a recreation season is the sum of all suchmarginal day values over all participating individuals.
23. E.g., Cicchetti, Seneca and Davidson, The Demand and Supply of Outdoor Recrea-tion (1969).
NA TURAL RESOURCES JOURNAL
The problem of conformable units is also encountered in assessingthe costs of ecological damage. Although uncertainty about benefitsfrom future recreation activity in an area, as well as possible unfore-seen applications of gene pool conservation and scientific research,are likely to make precise evaluation impossible, significant costsmight be associated with such irreversible losses as destruction of thescenic or wildlife resources on which the recreation activity is based.For our purpose we would want to identify a region of discontinuityor rapid rise in the MCd curve, within which optimal capacity wouldthen fall-so long as congestion costs were not yet significant.2 4
Let us turn now to our suggestions for measuring consumer sur-plus benefits net of congestion costs. A prerequisite for any discus-sion of this problem is the definition of an operational measure ofcongestion. As hinted in our earlier discussion, we propose for thispurpose the number of encounters E of recreationists with eachother over a fixed period, say a day. Clearly, different types ofencounters, in different circumstances, are conceivable-with cor-respondingly different effects on recreationists' utility. An encounterat a trailhead, for example, is less distasteful to the wilderness soli-tude seeker than one at his backcountry campsite. The possibility ofeven greater variation in the costs of encounter is raised by a defini-tion that would include, in addition to direct contacts with others,"encounters" with evidence of their presence, such as litter, trampledvegetation, and so on.2 I
Ideally, then, we are interested in information of the followingsort: what are the amounts each individual would be willing to payfor a single recreation day characterized by a given set of encounters;similarly for two such days, and so on. In symbols, individual i'swillingness to pay can be represented (for any given number of days)as
(3) Pi = f(E, 0, Ti)
where E is a vector of different types of encounters, E1 , E, . .
24. Professor Robert Ream, a plant ecologist with extensive backcountry experience,however, has suggested that typically extensive ecological damage from wilderness use willnot occur until after the congestion constraints become effective. There may be an excep-tion to this observation, we would imagine, if pack stock is used as a mode of travel inwilderness areas.
25. This broad view of the encounter phenomenon we owe to Blair Bower's discussion ofan earlier draft of this article.
[Vol. 12
July 1972] OPTIMAL CAPA CITY OF RECREA TION FACILITIES
and 0 and Ti are respectively other characteristics of the recreationexperience, and the individual's tastes, taken as exogenously deter-mined.
Assuming we can get this information, how is it related to level ofuse? That is, how is the vector of encounters determined? To answerthis question, we propose a model to simulate the travel behavior ofrecreationists through the wilderness tract, coupled with an assump-tion about the time pattern of use over the recreation season. For thepurpose at hand we assume for simplicity, with no loss in generality,a uniform distribution of recreation days over the season. This gives
the number of individuals present on any one day as E, where R is
the total number of recreation days over the season and n is thelength of the season (in days). Now using the simulation model, wecan relate this number R to the numbers of (different types of)
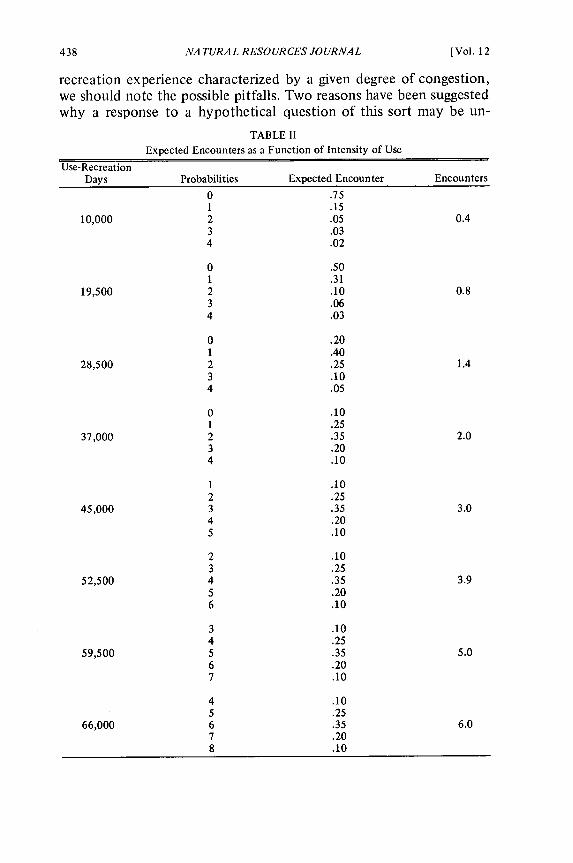
nencounters expected. Of course, the number of different types ofencounters that can be handled in this fashion will depend upon thecomplexity built into the simulator. In principle, an indefinitely largenumber could be considered, though in a first application perhapsonly four-say trail and campsite and mode of travel, i.e., foot andhorseback-may be attempted. 2 6 For the remainder of this discus-sion we abstract from this problem and speak simply of encounters,recognizing that this may refer to anything from undifferentiatedencounters to a vector of different types of encounters. The informa-tion obtained would appear as shown in Table II.
Let us return now to the question of how the required informa-tion on willingness to pay is to be obtained. In the absence of theordinary market price data, there are essentially two possibilities: (1)an explicit set of questions put to individuals requesting them tostate the value of the experience; or (2) indirect inference of thevalue from some aspect of their observed behavior. For reasons wewill indicate shortly, economists have traditionally favored the latterapproach, at least in principle. Clawson and Knetsch have shown howan aggregate demand schedule can be inferred from recreationists'observed travel costs, and then used to calculate their consumers'surplus benefits.2 Unfortunately, there is no obvious way to extendthe technique to treat the congestion externalities which are ourmain concern.
Since we are constrained to adopt the approach which seeks tolearn directly from individuals what they are willing to pay for a
26. Work on a somewhat more complex model is currently going forward in the NationalEnvironments Program at Resources for the Future.
27. M. Clawson and J. Knetsch, Economics of Outdoor Recreation (1966).
NATURAL RESOURCES JOURNAL
recreation experience characterized by a given degree of congestion,we should note the possible pitfalls. Two reasons have been suggestedwhy a response to a hypothetical question of this sort may be un-
TABLE II
Expected Encounters as a Function of Intensity of Use
Use-RecreationDays Expected Encounter
.75
.15
.05
.03
.02
Encounters
10,000
19,500
Probabilities
01234
01234
01234
01234
12345
23456
34567
45678
28,500
37,000
45,000
52,500
59,500
66,000
[Vol. 12
July 19721 OPTIMAL CAPACITY OF RECREA TION FACILITIES 439
reliable. First, as Samuelson has pointed out, the individual has anincentive to understate his willingness to pay for a publicly providedgood, as he may reckon he can continue to enjoy it without beingassessed his full consumer surplus. 2 8 To eliminate this general bias,an interview procedure formulated by Davis specifically for outdoorrecreation studies is very useful.' 9 The idea is to have the individualreact to the possibility that he can be excluded-plausible in this, ifnot in the typical public good, case-for failure to pay a sufficientprice. Also relevant, perhaps, is that in a recent controlled experi-mental study of the consistency of consumer responses to questionsconcerning their willingness to pay for entertainment services, theexpected bias did not appear.3"
The second objection to the interview procedure is that, evenwhere there is no dissimulation in responses, it is not clear that arespondent's speculation as to how much he would be willing to paywhen confronted with a hypothetical situation would reflect his be-havior in a similar real situation. Response to a hypothetical situationcannot be assumed to correspond exactly to behavior in a real situa-tion since in the former an individual might answer without beinginfluenced by his income constraint, whereas in the latter the con-straint would be effective. Accordingly, there might be a tendency tooverstate willingness to pay in the hypothetical situation. Indeed,one explanation of the experimental results reported above may befound in the relatively small amount of money involved.3 1 However,if the purpose of a willingness to pay question is to estimate benefitsfrom recreation for comparison with benefits from alternative uses ofa tract of wildland, then an income-constrained estimate may itselfhave a downward bias. This is because it corresponds to the Hicksian"price-compensating" measure of consumer surplus, whereas the"price-equivalent" measure may be the more relevant when a changefrom de facto wilderness to an incompatible use is contemplated. 2
Since the difference between the two measures is related to thepresence or absence of the income constraint, what appears to be anupward bias in response to a question regarding willingness to pay in
28. Samuelson, The Pure Theory of Public Expenditures, Review of Economics andStatistics (1954).
29. R. Davis, The Value of Outdoor Recreation: An Economic Study of the MaineWoods (Ph.D. Thesis, Harvard University 1963).
30. Bohm, Estimating Demand for Public Goods: An Experiment, forthcoming in TheSwedish Journal of Economics.
31. Id.32. See J. Krutilla, C. Cicchetti, A. Freeman IlII, and C. Russell, Observations on the
Economics of Irreplaceable Assets in Environmental Quality Analysis: Research Studies inthe Social Sciences, A. Kneese and B. Bower (1972).
NA TURAL RESOURCES JOURNAL
a hypothetical situation may simply be a reflection of a more ap-propriate measure of benefit.
VNow let us assume that we can agree both on what we mean by
"encounter," and on a method for measuring individual willingnessto pay for recreation days characterized by varying expected num-bers of encounters. Recall that, using the travel behavior simulator,we can generate an expected number of encounters per day as afunction of any given total number of recreation days in a season.Given this relation, a sample from some known number of recreationvisits can be questioned as to willingness to pay for one day with theexpected number of encounters, two days, and so on.
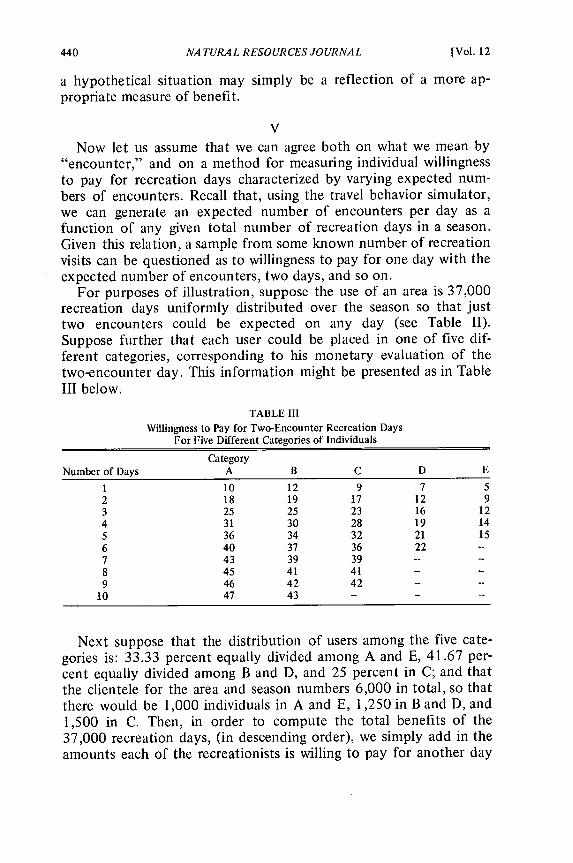
For purposes of illustration, suppose the use of an area is 37,000recreation days uniformly distributed over the season so that justtwo encounters could be expected on any day (see Table II).Suppose further that each user could be placed in one of five dif-ferent categories, corresponding to his monetary evaluation of thetwo-encounter day. This information might be presented as in TableIII below.
TABLE IIIWillingness to Pay for Two-Encounter Recreation Days
For Five Different Categories of Individuals
CategoryNumber of Days A B C D E
1 10 12 9 7 52 18 19 17 12 93 25 25 23 16 124 31 30 28 19 14
5 36 34 32 21 156 40 37 36 22 --
7 43 39 39 --
8 45 41 41 -
9 46 42 42 -
10 47 43 - -
Next suppose that the distribution of users among the five cate-gories is: 33.33 percent equally divided among A and E, 41.67 per-cent equally divided among B and D, and 25 percent in C; and thatthe clientele for the area and season numbers 6,000 in total, so thatthere would be 1,000 individuals in A and E, 1,250 in B and D, and1,500 in C. Then, in order to compute the total benefits of the37,000 recreation days, (in descending order), we simply add in theamounts each of the recreationists is willing to pay for another day
[Vol. 12
July 19721 OPTIMAL CAPACITY OFRECREA TION FACILITIES 441
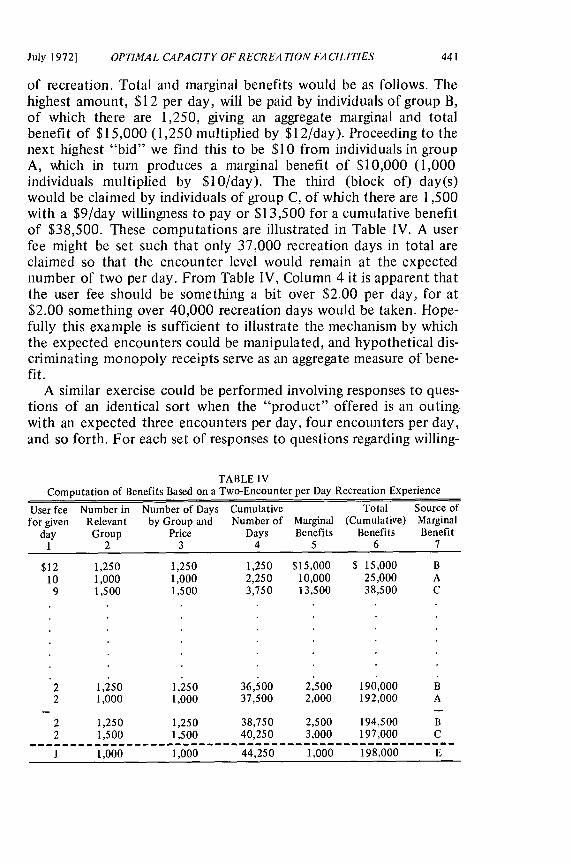
of recreation. Total and marginal benefits would be as follows. Thehighest amount, $12 per day, will be paid by individuals of group B,of which there are 1,250, giving an aggregate marginal and totalbenefit of $15,000 (1,250 multiplied by $12/day). Proceeding to thenext highest "bid" we find this to be $10 from individuals in groupA, xhich in turn produces a marginal benefit of $10,000 (1,000individuals multiplied by $10/day). The third (block of) day(s)would be claimed by individuals of group C, of which there are 1,500with a $9/day willingness to pay or $13,500 for a cumulative benefitof $38,500. These computations are illustrated in Table IV. A userfee might be set such that only 37,000 recreation days in total areclaimed so that the encounter level would remain at the expectednumber of two per day. From Table IV, Column 4 it is apparent thatthe user fee should be something a bit over $2.00 per day, for at$2.00 something over 40,000 recreation days would be taken. Hope-fully this example is sufficient to illustrate the mechanism by whichthe expected encounters could be manipulated, and hypothetical dis-criminating monopoly receipts serve as an aggregate measure of bene-fit.
A similar exercise could be performed involving responses to ques-tions of an identical sort when the "product" offered is an outing.with an expected three encounters per day, four encounters per day,and so forth. For each set of responses to questions regarding willing-
TABLE IVComputation of Benefits Based on a Two-Encounter per Day Recreation Experience
User fee Number in Number of Days Cumulative Total Source offor given Relevant by Group and Number of Marginal (Cumulative) Marginal
day Group Price Days Benefits Benefits Benefit1 2 3 4 5 6 7
$12 1,250 1,250 1,250 $15,000 $ 15,000 B10 1,000 1,000 2,250 10,000 25,000 A
9 1,500 1,500 3,750 13,500 38,500 C
2 1,250 1,250 36,500 2,500 190,000 B2 1,000 1,000 37,500 2,000 192,000 A
2 1,250 1,250 38,750 2,500 194,500 B2 1,500 1,500 40,250 3,000 197,000 C
1 1,000 1,000 44,250 1,000 198,000 E
NA TURA L RESOURCES JOURNAL
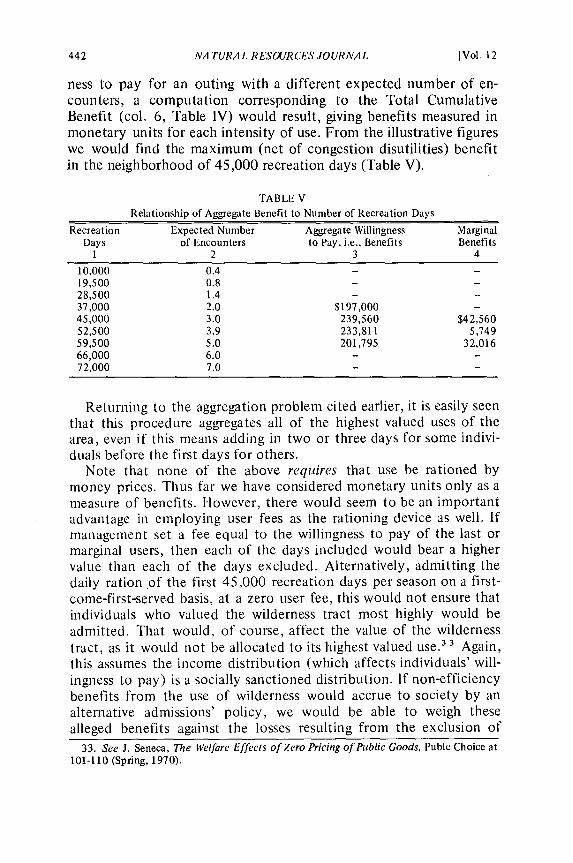
ness to pay for an outing with a different expected number of en-counters, a computation corresponding to the Total CumulativeBenefit (col. 6, Table IV) would result, giving benefits measured inmonetary units for each intensity of use. From the illustrative figureswe would find the maximum (net of congestion disutilities) benefitin the neighborhood of 45,000 recreation days (Table V).
TABLE V
Relationship of Aggregate Benefit to Number of Recreation Days
Recreation Expected Number Aggregate Willingness MarginalDays of Encounters to Pay, i.e., Benefits Benefits
1 2 3 4
10,000 0.4 -19,500 0.828,500 1.4 -37,000 2.0 $197,000 --
45,000 3.0 239,560 $42,56052,500 3.9 233,811 5,74959,500 5.0 201,795 32,01666,000 6.0 - -72,000 7.0
Returning to the aggregation problem cited earlier, it is easily seenthat this procedure aggregates all of the highest valued uses of thearea, even if this means adding in two or three days for some indivi-duals before the first days for others.
Note that none of the above requires that use be rationed bymoney prices. Thus far we have considered monetary units only as ameasure of benefits. However, there would seem to be an importantadvantage in employing user fees as the rationing device as well. Ifmanagement set a fee equal to the willingness to pay of the last ormarginal users, then each of the days included would bear a highervalue than each of the days excluded. Alternatively, admitting thedaily ration of the first 45,000 recreation days per season on a first-come-first-served basis, at a zero user fee, this would not ensure thatindividuals who valued the wilderness tract most highly would beadmitted. That would, of course, affect the value of the wildernesstract, as it would not be allocated to its highest valued use.' ' Again,this assumes the income distribution (which affects individuals' will-ingness to pay) is a socially sanctioned distribution. If non-efficiencybenefits from the use of wilderness would accrue to society by analternative admissions' policy, we would be able to weigh thesealleged benefits against the losses resulting from the exclusion of
33. See J. Seneca, The Welfare Effects of Zero Pricing of Public Goods, Pubic Choice at101-110 (Spring, 1970).
[Vol. 12
July 19721 OPTIMAL CAPACITY OF RECREA TION FACILITIES 443
some willingness to pay, in order to better evaluate the merits of thealternative admissions' policy. 34
Another advantage of price rationing is that any initial miscalcula-tion could readily be corrected through subsequent price adjustment.For example, suppose management, on the basis of prior informationconcerning user willingness to pay, set a user fee expected tooptimally restrict use to the 45,000 days in our illustration. If, fol-lowing the institution of this fee, only 35,000 days are taken, thenclearly the consumers' surplus measure of benefits has been over-estimated, and the fee might be lowered. This sort of iterative pro-cedure then can provide additional information about consumertastes that should be of value to managers.
VI
In the preceding section we have worked through a simplifiedexample designed to illustrate how a wilderness tract might be man-aged in accordance with economic principles to provide maximumrecreation benefits. In doing so we made reference to the need for auser travel-behavior simulator and a survey research effort. Thesewould be for the purpose of obtaining respectiyely estimates ofwilderness users' responses to different circumstances as a result ofthe differences in intensity of use. The latter responses would beregistered as differences in the amounts such users would be willingto pay for differences in the quality of the experience defined interms of the freedom from congestion. To carry out such investiga-tions represents a substantial study in itself which goes considerablybeyond the scope of this effort. While these studies have not yetbeen carried out, something might be said about their character.
The Spanish Peaks Primitive Area of Montana has been selected asa prototype from which data can be obtained to endow the simulatorwith considerable realism. Data are available on the characteristics ofthe area, trails, campsites and terrain, and on the distribution ofwilderness users by trailhead, routes, lengths of stay and mode oftravel for the present level of use intensity.3 A simulator is being
34. See D. Nichols, E. Smolensky, and T. Tideman, Discrimination by Waiting Time inMerit Goods, Am. Econ. Rev. (1971), for an argument that discrimination by waiting time is tobe preferred to discrimination by money prices in certain "merit good" cases. For reasonsindicated in J. Krutitla and J. Knetsch, Outdoor Recreation Economics, 389 Annals 63 (1970),this argument is applicable to population-oriented "inner city" recreation, but not to theresource-oriented wilderness recreation that is the concern of this article. Additional analysisof the mechanism for provision of public goods is found in C. Cicchetti and R. Haveman,Optimality in Producing and Distributing Public Outputs (unpublished manuscript).
35. These data represent the contribution of the Wilderness Research Project undertakenby Robert Lucas and George Stankey.
NA TURAL RESOURCES JOURNAL
developed, using these data, which will mimic the behavior of exist-ing users, registering the number of encounters by location (whetherat periphery or interior of area) type of encounter (while traveling ontrail or during campsite occupancy) and mode of travel (whether byfoot or pack stock and horseback). Given a functioning simulator, ifrun for an appropriate number of times for each intensity of usepostulated, estimates of the expected encounters by location, type,and mode can be developed and functionally linked to the number ofrecreation days of specified composition.
Concurrently a survey is being prepared to elicit information onthe nature of individual user's willingness to pay functions underpreassigned conditions which reflect the intensity of use. Now it isclearly impossible to account for every relevant dimension of thequality of a given experience. Such an accounting would require thatusers can be asked an excessive number of questions. The strategy tobe employed will be to select a limited number of questions toaddress to each potential respondent, raising as many of the ques-tions relevant to determining the schedule of willingness to pay aspossible within our sampling constraints. This is intended to producea scatter of observations which will permit obtaining an estimate ofthe functional relationship between willingness to pay and en-counters of various sorts for various lengths of stay, by applyingconventional econometric techniques.
It should be acknowledged that to the best of our knowledgeneither the simulation study nor the survey research proposed herehas been attempted in precisely such circumstances by others. On theother hand, the strategy outlined above at this point appears suf-ficiently promising to warrant the effort. The information resultingfrom such a study would aid in solving increasingly vexing problemsfor public land managers.
[Vol. 12