Embed Size (px)
Citation preview
No. 3, 2013 Mining & Metallurgy Engineering Bor 97
MINING AND METALLURGY INSTITUTE BOR ISSN: 2334-8836 UDK: 622
UDK: 622.271(045)=20 DOI:10.5937/MMEB1303097M
Vitomir Milić*, Igor Svrkota*, Dejan Petrović*
DETERMINATION OF OPTIMAL PARAMETERS FOR SUBLEVEL STOPPING METHOD**
Abstract
This paper presents a design and parameters of the new variant of sublevel stopping method. The proposed new variant is the result of combination the theoretic considerations, field experience using the application of similar methods and researches on models. The idea of new design was to include most of advantages from several variants of sublevel stopping. The new variant is called “Semi-level stopping” [1]. Determination of optimal parameters for this method was performed using physical simi-larity model.
Keywords: underground mining, mining methods, new method design
* University of Belgrade, Technical Faculty in Bor ** This work is the result of the Project No. 33038 "Improvement the Technology of Mining and Pro-
cessing of Copper Ore with Monitoring the Environmental and Working in RTB Bor Group", funded by the Ministry of Education, Science and Technological Development of the Republic of Serbia.
INTRODUCTION
Underground mining in some Serbian mines is performed at depth that exceeds 500 m. The new ore deposits, planned for mining in the future, are even deeper. For instance, the ore body Borska Reka, in the copper mine Jama Bor, lies between 500 and 1,200 meters below ground surface. The ore reserves in this ore body exceed 600 Mt of ore, with copper content of about 0.6% [2].
So, the future of underground mining in the Bor ore deposit relays on huge ore reserves on very significant depths. This is a very serious task, both for RTB Bor and experts in the underground mining, to find the way to excavate these ore reserves economically and continue 110 year long tradition of the underground mining.
Mining method design, presented in this paper, is the result of long year inves-tigation in the area of sublevel caving and sublevel stopping mining methods. The
field data from sublevel caving method, applied in the ore bodies Tilva Ros and P2A of Jama Bor, were very helpful. The idea was to design a new, improved meth-od, suitable for application in this copper mine. A part of investigation related to the optimization of method parameters, and the results will be present in this paper.
INVESTIGATION THE OPTIMUM PARAMETERS IN LABORATORY CONDITIONS
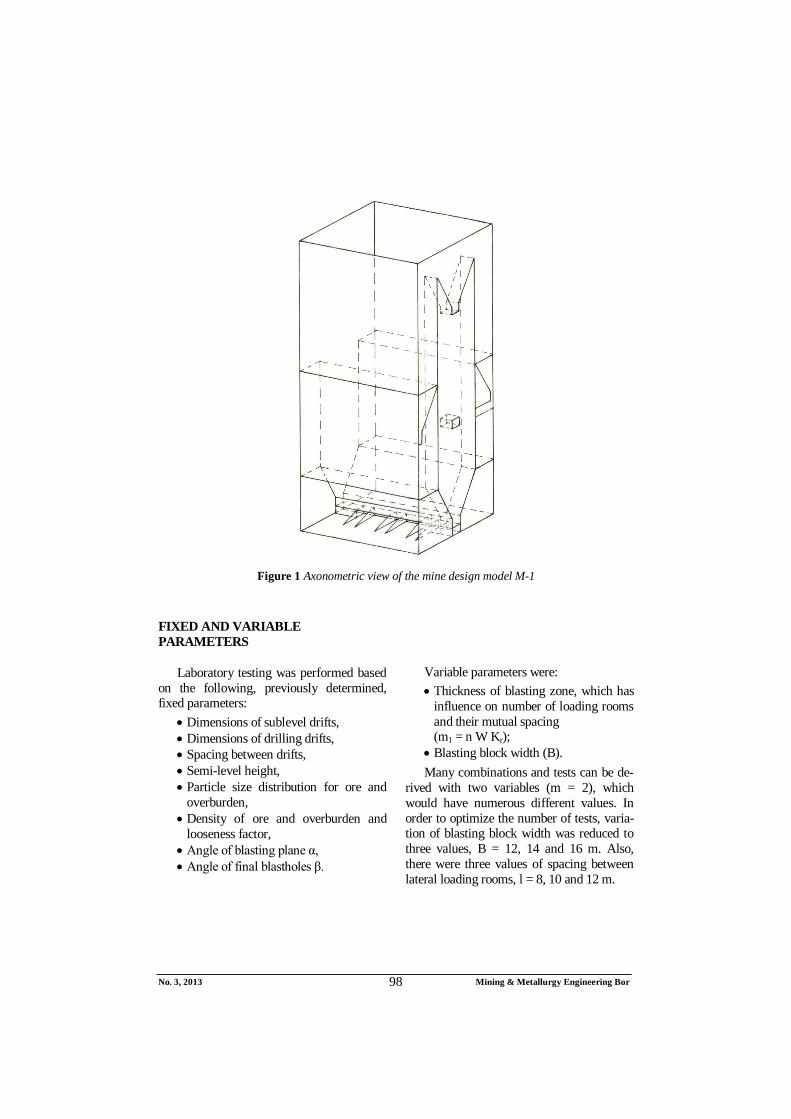
The new method design, called the semi-level stopping with single-sided lat-eral loading, was tested and analyzed in laboratory, on a physical similarity model. Main principles of modeling and testing were followed, including geometric, kin-ematic and dynamic similarity principles. The model is shown in Figure 1.
No. 3, 2013 Mining & Metallurgy Engineering Bor 98
Figure 1 Axonometric view of the mine design model M-1
FIXED AND VARIABLE PARAMETERS
Laboratory testing was performed based on the following, previously determined, fixed parameters:
Dimensions of sublevel drifts, Dimensions of drilling drifts, Spacing between drifts, Semi-level height, Particle size distribution for ore and
overburden, Density of ore and overburden and
looseness factor, Angle of blasting plane α, Angle of final blastholes β.
Variable parameters were: Thickness of blasting zone, which has
influence on number of loading rooms and their mutual spacing (m1 = n W Kr);
Blasting block width (B). Many combinations and tests can be de-
rived with two variables (m = 2), which would have numerous different values. In order to optimize the number of tests, varia-tion of blasting block width was reduced to three values, B = 12, 14 and 16 m. Also, there were three values of spacing between lateral loading rooms, l = 8, 10 and 12 m.

No. 3, 2013 Mining & Metallurgy Engineering Bor 99
These values were defined based on in-vestigations in the ore drawing dynamics and preliminary investigations the method of design parameters.
Variation of parameters enables defining the optimal parameters, in order to achieve maximum ore recovery, along with satisfy-ing ore dilution.
ORE DRAWING
Ore drawing was performed on M-1 model, from three lateral loading rooms. The obtained data were stored, analyzed and used for evaluation the method parameters. Data on ore recovery and ore dilution were used to create graphs of functional relation Or = f (Ir).
The experimental laboratory testing was performed in several stages.
1 Stage one – preliminary testing
The first task was to determine the suitable geometric parameters for design-ned mining method. Variable parameters were: blasting block width (B), spacing between lateral loading rooms (l) and thickness of blasted ore (n x m1). Block height, or level height, or double semi-level height was fixed at 80 m during tes-ting (H = 2h = 80 m), since this height was suitable as the level height in this case.
2 Stage two – the first series of tests
Based on preliminary testing and deter-mination the shape of draw solid (draw ellipsoid eccentricity), the limits of variable parameters were defined. Each test was car-ried out for all possible combinations of variable parameters and repeated three times.
3 Stage three – second series of tests
The pairs of parameters with unsatisfy-ing results were excluded from further tes-
ting. For instance, the results for 8 m spacing between lateral loading rooms were much worse for any block width (12, 14, or 16 m) than the results for 10 and 12 m spacing.
For parameters with satisfying results, tests were continued. Further tests were per-formed with two draw points on model M-1. These additional tests were ran in order to confirm results from first series of tests.
4. Stage four – third series of tests
This was the last series of tests, with pa-rameters that provided the best relations between ore recovery and ore dilution. Last series of tests included inserting of markers. A total of 175 markers were inserted into M-1 model. Markers provide very accurate results in analyses of drawing, and also bet-ter insight in phenomena which takes place in the model during the tests.
Ore drawing in the model was performed in specified dosages. The first dosage is drawn till the appearance of waste in one of the loading rooms. The first appearance of waste occurs in the third loading room, which is logical, considering the fact that the third room has frontal contact with waste. The area of this contact is equal to the area of blasted block. The following dosages were exactly 2.5 kg each, drawn equally from each room, till waste appears in all of the remaining rooms. Drawing goes on till ore dilution exceeds 50%. At that point, drawing was supposed to stop, but, in order to provide more points for graphical illustra-tion of relation between the ore dilution and ore recovery, the ore drawing went a little further.
Interpretation of results was created us-ing tables and graphs. Each table, for each test, includes a detailed test balance, with data on quantity of bulk ore (Qrm), clean ore (Qčr) and waste (Qj) per kg of each dosage. Tables also contain their cumulative values, along with values of ore recovery and ore dilution, per dosage and in total.

No. 3, 2013 Mining & Metallurgy Engineering Bor 100
Ore recovery is a quotient of clean ore (Qčr, kg) and total ore (Qr, kg). Ore recovery was calculated for each test, where values of Qčr were measured from each dosage, while Qr is quantity of ore used in the test:
퐼 = č ∙ 100, % (1)
Total ore recovery is a quotient of cumu-lative value of Qčr and total ore in model, Qr.
Ore dilution (Or), calculated for each dosage, is a quotient of waste in dosage (Qj) and bulk ore in dosage (Qrm):
푂 = ∙ 100, % (2)
Total ore dilution is gained as a quotient of cumulative values of waste and bulk ore.
INTERPRETATION OF THE OBTAINED RESULTS
Testing data were stored particularly for each loading room and each dosage, which enabled data interpretation by test and draw point, for each series of testing.
Interpretation of results was performed through tables and graphs. Tables show data of ore recovery and dilution for each test, each dosage and in total. Based on these data, the next step was to create graphs, with lines of interdependence between the ore dilution and ore recovery. Beside the graphs, the interdependence was also expressed via equations. Equations were created based on minimum squares theory. Line correlation ratio was used to determine the accuracy of approximation, i.e. deviation of equation from relation curve.
High values of correlation ratio show high accuracy of approximation of func-tions Or = f ( Ir ) and Or’ = f ( Ir ) with regression equations. This means that it is possible, with satisfying accuracy, to cal-culate ore dilution (Or) if the value of ore recovery (Ir) is known, and vice versa.
As it was mentioned before, the quan-tity of drawn ore and waste were recorded for each test and each draw point. It ena-bled partial interpretation of the results by single draw points. Also, determination the relations between parameters enables comparison of results for different posi-tions of draw points and loading rooms.
ANALYSIS OF THE OBTAINED RESULTS
Values of ore recovery and dilution were calculated based on the results of testing, according to the measurements of drawn ore and waste for each dosage and in total. The calculated values were present graphically and functional dependences were estab-lished.
During testing on model M-1, the first series included 27 tests [6]. There were three variations of values for block width (B = 12, 14 and 16 m) and spacing between lateral loading rooms (l = 8, 10 and 12 m). Test was repeated three times for each pair of values. Quantity of ore, stored into model, varied along with variations of width and spacing. The obtained data show clearly that quantity of clean ore strongly depends on spacing of the loading rooms. Consequently, the values of ore recovery also vary along with spacing.
Analysis of the results from the first se-ries of tests has shown that best results were obtained with 12 m spacing. In this case, the quantity of clean ore exceeds 22%. For total ore recovery of 89.94%, the ore dilution reaches 10.68% [1].
In the second series of tests, there were two draw points. Since 8 m spacing caused the worst results again, these results were excluded from further considerations. Again, the best results were obtained for B = 12 m and l = 12 m pair of values, so the results from the first series of tests were confirmed.
No. 3, 2013 Mining & Metallurgy Engineering Bor 101
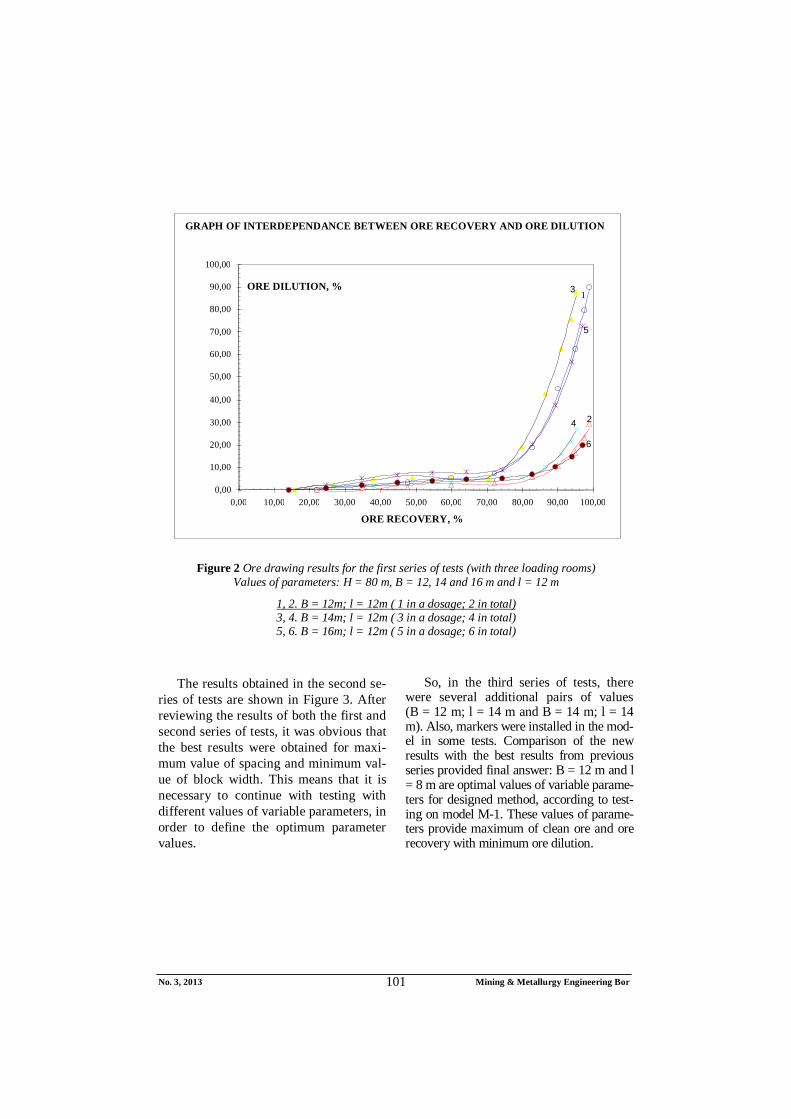
Figure 2 Ore drawing results for the first series of tests (with three loading rooms)
Values of parameters: H = 80 m, B = 12, 14 and 16 m and l = 12 m
1, 2. B = 12m; l = 12m ( 1 in a dosage; 2 in total) 3, 4. B = 14m; l = 12m ( 3 in a dosage; 4 in total) 5, 6. B = 16m; l = 12m ( 5 in a dosage; 6 in total)
The results obtained in the second se-
ries of tests are shown in Figure 3. After reviewing the results of both the first and second series of tests, it was obvious that the best results were obtained for maxi-mum value of spacing and minimum val-ue of block width. This means that it is necessary to continue with testing with different values of variable parameters, in order to define the optimum parameter values.
So, in the third series of tests, there were several additional pairs of values (B = 12 m; l = 14 m and B = 14 m; l = 14 m). Also, markers were installed in the mod-el in some tests. Comparison of the new results with the best results from previous series provided final answer: B = 12 m and l = 8 m are optimal values of variable parame-ters for designed method, according to test-ing on model M-1. These values of parame-ters provide maximum of clean ore and ore recovery with minimum ore dilution.
GRAPH OF INTERDEPENDANCE BETWEEN ORE RECOVERY AND ORE DILUTION
13
4
5
6
2
0,00
10,00
20,00
30,00
40,00
50,00
60,00
70,00
80,00
90,00
100,00
0,00 10,00 20,00 30,00 40,00 50,00 60,00 70,00 80,00 90,00 100,00 ORE RECOVERY, %
ORE DILUTION, %
No. 3, 2013 Mining & Metallurgy Engineering Bor 102
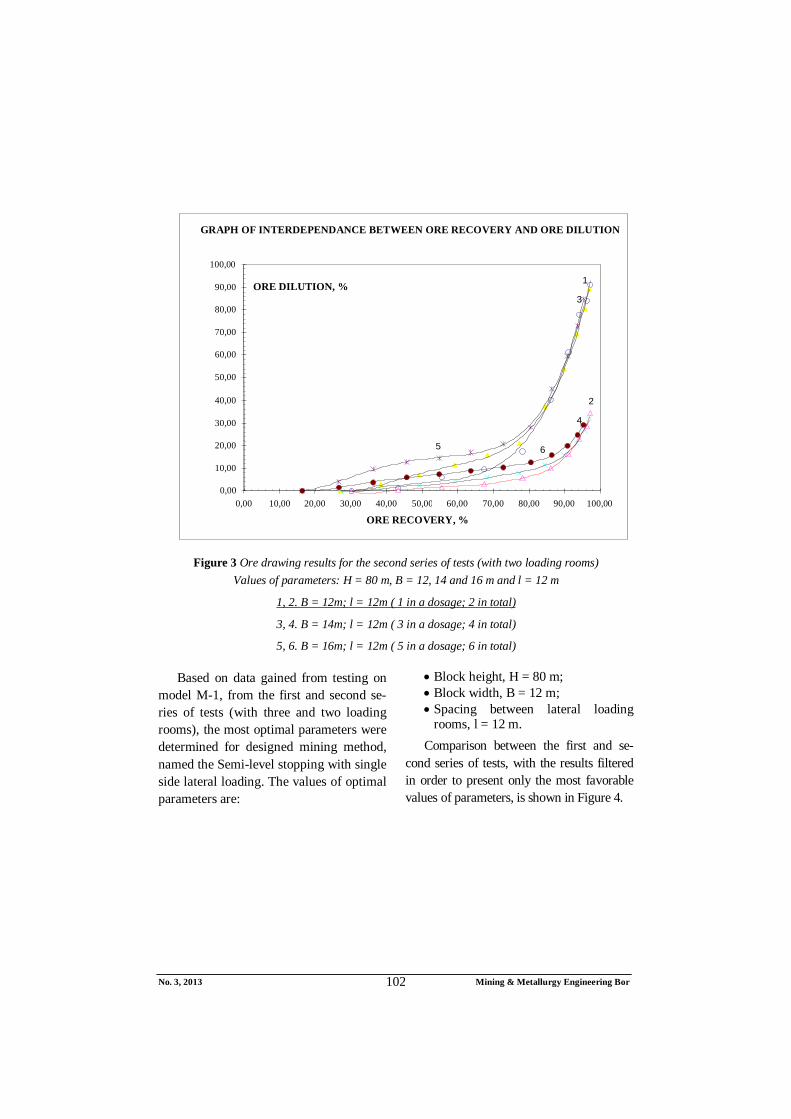
Figure 3 Ore drawing results for the second series of tests (with two loading rooms)
Values of parameters: H = 80 m, B = 12, 14 and 16 m and l = 12 m
1, 2. B = 12m; l = 12m ( 1 in a dosage; 2 in total)
3, 4. B = 14m; l = 12m ( 3 in a dosage; 4 in total)
5, 6. B = 16m; l = 12m ( 5 in a dosage; 6 in total) Based on data gained from testing on
model M-1, from the first and second se-ries of tests (with three and two loading rooms), the most optimal parameters were determined for designed mining method, named the Semi-level stopping with single side lateral loading. The values of optimal parameters are:
Block height, H = 80 m; Block width, B = 12 m; Spacing between lateral loading
rooms, l = 12 m. Comparison between the first and se-
cond series of tests, with the results filtered in order to present only the most favorable values of parameters, is shown in Figure 4.
GRAPH OF INTERDEPENDANCE BETWEEN ORE RECOVERY AND ORE DILUTION
2
1
3
4
5 6
0,00
10,00
20,00
30,00
40,00
50,00
60,00
70,00
80,00
90,00
100,00
0,00 10,00 20,00 30,00 40,00 50,00 60,00 70,00 80,00 90,00 100,00 ORE RECOVERY, %
ORE DILUTION, %
No. 3, 2013 Mining & Metallurgy Engineering Bor 103
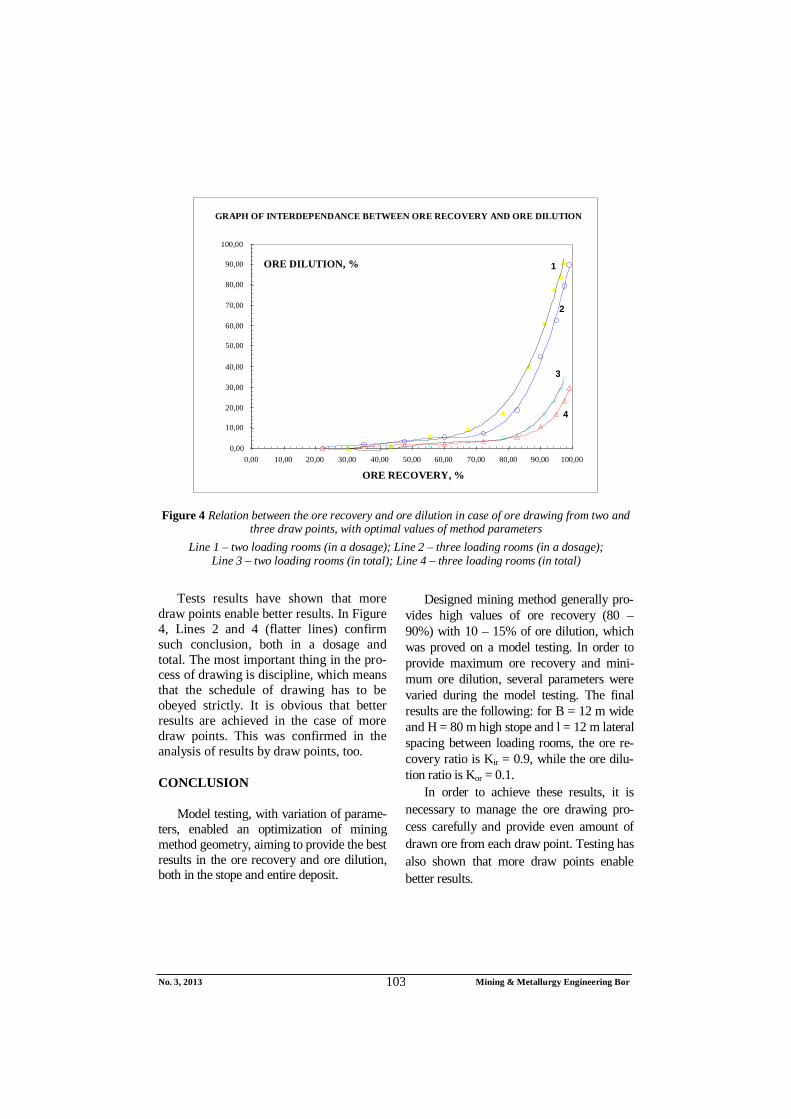
Figure 4 Relation between the ore recovery and ore dilution in case of ore drawing from two and three draw points, with optimal values of method parameters
Line 1 – two loading rooms (in a dosage); Line 2 – three loading rooms (in a dosage); Line 3 – two loading rooms (in total); Line 4 – three loading rooms (in total)
Tests results have shown that more
draw points enable better results. In Figure 4, Lines 2 and 4 (flatter lines) confirm such conclusion, both in a dosage and total. The most important thing in the pro-cess of drawing is discipline, which means that the schedule of drawing has to be obeyed strictly. It is obvious that better results are achieved in the case of more draw points. This was confirmed in the analysis of results by draw points, too.
CONCLUSION
Model testing, with variation of parame-ters, enabled an optimization of mining method geometry, aiming to provide the best results in the ore recovery and ore dilution, both in the stope and entire deposit.
Designed mining method generally pro-vides high values of ore recovery (80 – 90%) with 10 – 15% of ore dilution, which was proved on a model testing. In order to provide maximum ore recovery and mini-mum ore dilution, several parameters were varied during the model testing. The final results are the following: for B = 12 m wide and H = 80 m high stope and l = 12 m lateral spacing between loading rooms, the ore re-covery ratio is Kir = 0.9, while the ore dilu-tion ratio is Kor = 0.1.
In order to achieve these results, it is necessary to manage the ore drawing pro-cess carefully and provide even amount of drawn ore from each draw point. Testing has also shown that more draw points enable better results.
GRAPH OF INTERDEPENDANCE BETWEEN ORE RECOVERY AND ORE DILUTION
1
4
2
3
0,00
10,00
20,00
30,00
40,00
50,00
60,00
70,00
80,00
90,00
100,00
0,00 10,00 20,00 30,00 40,00 50,00 60,00 70,00 80,00 90,00 100,00
ORE RECOVERY, %
ORE DILUTION, %
No. 3, 2013 Mining & Metallurgy Engineering Bor 104
REFERENCES
1 V. Milić, The Research Basic Para-meters of New Methods Semilevel Caving for Excavation Deep Parts of the Bor Deposit, Ph D. Thesis, Bor, 1996. (in Serbian)
2 R. Kojdić, Contribution of the Determination the Most Appropriate Parametars of Excavation Methods, with the Techno-economic Aspects of Bor Copper Deposits in the Deep, Ph D. Thesis, Bor, 1991. (in Serbian)
3 V. Milić, Ž. Milićević, N. Atanasković, Determination of Parameters Blowing Down Method by Modeling, Underground Mining Engineering, Belgrade, 1994. (in Serbian)
4 V. Milić, Ž. Milićević, Determination of the Eccentricity of the Ellipsoid Flow of ore from the Bor Ore Deposits, Journal of Mining and Metallurgy, Bor, 1995. (in Serbian)
5 V. Milić, Ž. Milićević, The Basis of Exploitation Mineral Deposits, The University book, Bor, 2005. (in Serbian)
6 M. M. Protodjakonov, P. I. Teder. Metodika racionalnogo planirovanija eksperimentov fizičko-mehaničeskie gornye problemy, Moskva, ”Nauka”, 1971. (in Russian)
7 V. Milić, I. Svrkota, D. Petrović, Analysis of Block Stability for Semi – Level Caving Method With Lateral Loading, Mining and Metallurgy Engineering Bor, 2/2013, p. 21-26

Broj 3, 2013. Mining & Metallurgy Engineering Bor 105
INSTITUT ZA RUDARSTVO I METALURGIJU BOR ISSN: 2334-8836 UDK: 622
UDK: 622.271(045)=861 DOI:10.5937/MMEB1303097M
Vitomir Milić*, Igor Svrkota*, Dejan Petrović*
ODREDJIVANJE OPTIMALNIH PARAMETARA METODE BLOKOVSKOG OTKOPAVANJA**
Izvod
U ovom radu govori se novoj konstrukciji metode blokovskog otkopavanja sa zarušavanjem rude. Predložena varijanta metode otkopavanja je istaživana u okviru teorijskog razmatranja korišćenjem iskustva u praktičnoj primeni tehnologija otkopavanja iz iste grupe metoda. Sve prednosti metoda sa podetažnim zarušavanjem u velikom broju varijantnih rešenja spojeni su u novu konstrukciju koja nosi naziv “Metoda sa poluetažnim zarušavanjem“ [1]. Određivanje optimalnih parametara novopredložene konstrukcije izvršeno je u laboratroijskim uslovima na fizičkom modelu sličnosti.
Ključne reči: podzemna eksploatacija, metode otkopavanja, nove konstrukcije
* Univerzitet u Beogradu, Tehnički fakultet u Boru ** U ovom radu su prikazani rezultati projekta TR 33038 „Usavršavanje tehnologija eksploatacije i
prerade rude bakra sa monitoringom životne i radne sredine u RTB Bor Grupa“ koji se finansira od strane Ministarstva prosvete, nauke i tehnološkog razvoja Republike Srbije
UVOD
Podzemna eksploatacije rude u rudni-cima u Srbiji obavlja se na dubinama koje iznose i više od 500 m. Ležišta koja su za buduću eksploataciju nalaze se na znatno većim dubinama, a u borskom ležištu rude bakra rudno telo „Borska Reka“, koje je perspektiva podzemne eksplotacije, zaleže na dubini od 500 do 1200 m. Rudno telo ima rezerve rude od preko 600 milona tona rude sa sadžajem bakra od oko 0,6 % [2].
Izuzetno velike rezerve rude, na velikoj dubini predstavljaju glavni preduslov za nastavak podzemne eksploatacije u jami Bor. Za rudarske stručnjake iz oblasti podzemne eksploatacije to je veliki izazov, a za RTB Bor neophodnost nastavka tradicije rudarenja koja iznosi 110 godina.
Tehnologija otkopavanja koja se predlaže u ovom radu rezulatat je dugo-godičnjeg istraživanja, koja su sprovedena u cilju usavršavanja novih konstrukcija metoda otkopavanja iz grupe metoda sa
zarušavanjem rude i krovinskih stena. Korišćenjem rezultata iz primene podetažnih metoda u rudnim telima „Tilva Roš“ i „P2 A“ isvršeno je usavršavanje konstrukcija i predložena nova. Rezultati istraživanja optimalnih prametara, za najpovoljne pokazatelje daju se u ovom radu.
ISTRAŽIVANJE OPTIMALNIH PARAMATARA METODE OTKOPAVANJA U LABORATORIJSKIM USLOVIMA
Istraživanje parametara metode „Polu-etažnog prinudnog zarušavanja sa jedno-stranim bočnim utovarom rude“ izvršeno je u laboratorijskim uslovima na fizičkom modelu sličnosti. Pri izvodjenju ogleda ispoštovani su osnovni principi modeliranja i izvodjenje ogleda; geometrijska, kinama-tička i dinamička sličnost [3].
Izgled modela prikazan je na slici br. 1.
Broj 3, 2013. Mining & Metallurgy Engineering Bor 106
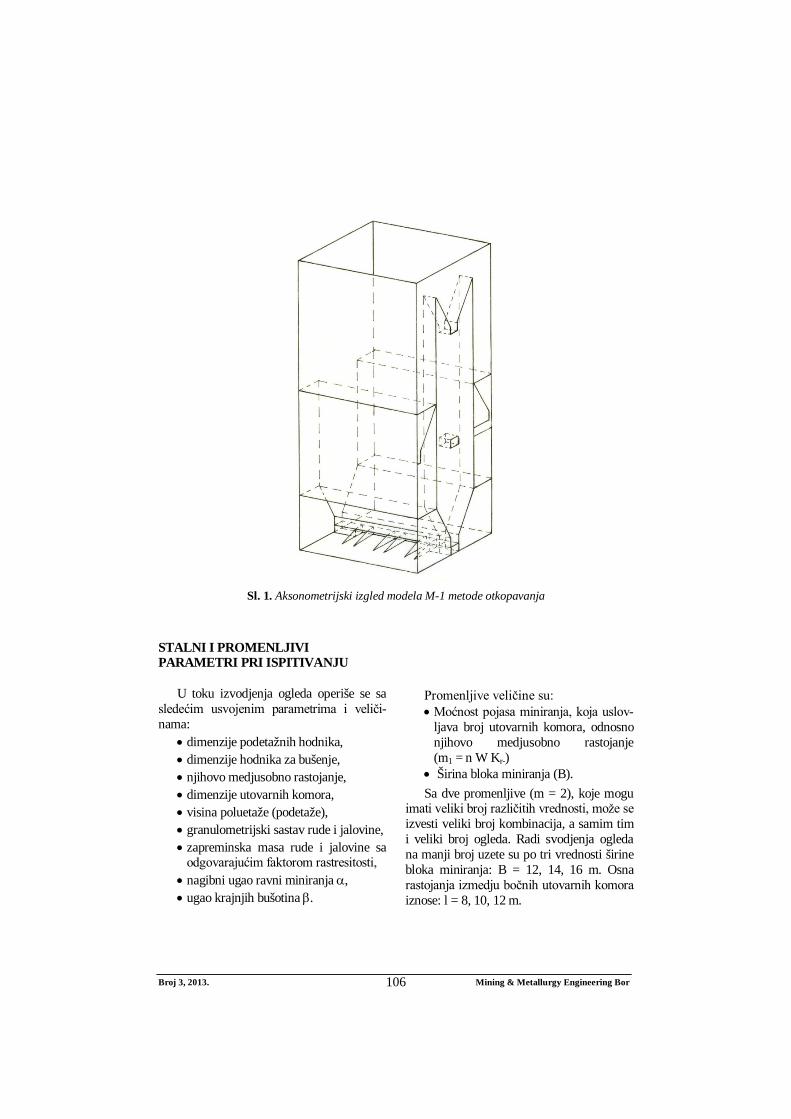
Sl. 1. Aksonometrijski izgled modela M-1 metode otkopavanja
STALNI I PROMENLJIVI PARAMETRI PRI ISPITIVANJU
U toku izvodjenja ogleda operiše se sa sledećim usvojenim parametrima i veliči-nama:
dimenzije podetažnih hodnika, dimenzije hodnika za bušenje, njihovo medjusobno rastojanje, dimenzije utovarnih komora, visina poluetaže (podetaže), granulometrijski sastav rude i jalovine, zapreminska masa rude i jalovine sa
odgovarajućim faktorom rastresitosti, nagibni ugao ravni miniranja , ugao krajnjih bušotina .
Promenljive veličine su: Moćnost pojasa miniranja, koja uslov-
ljava broj utovarnih komora, odnosno njihovo medjusobno rastojanje (m1 = n W Kr-)
Širina bloka miniranja (B). Sa dve promenljive (m = 2), koje mogu
imati veliki broj različitih vrednosti, može se izvesti veliki broj kombinacija, a samim tim i veliki broj ogleda. Radi svodjenja ogleda na manji broj uzete su po tri vrednosti širine bloka miniranja: B = 12, 14, 16 m. Osna rastojanja izmedju bočnih utovarnih komora iznose: l = 8, 10, 12 m.
Broj 3, 2013. Mining & Metallurgy Engineering Bor 107
Ovako izabrane vrednosti dobijene su na
osnovu izučavanja zakonitosti istakanja rude na modelima i na osnovu preliminarnih istraživanja parametra razmatrane metode.
Izmenom promenljivih veličina moguće je utvrditi pri kojim se parametrima postiže najveće iskorišćenje i zadovoljavajuće osiromašenje rude.
ISTAKANJE RUDE
Istakanje rude iz modela vršeno je na modelu M-1 iz tri utovarne komore sa jedne strane. Rezultati dobijeni iz izvedenih ogleda prikazani su tabelarno, a na osnovu sraču-natih vrednosti iskorišćenja i osiromašenja formirani su grafici funkcionalne zavisnosti Or = f ( Ir ).
Eksperimantalna laboratorijska istraži-vanja, koja se nalaze u osnovi ovoga rada, obavljena su u više etapa - serija.
1. Prva etapa istraživanja - preliminarana istraživanja
Za predloženu konstrukciju metode otkopavanja potrebno je bilo odrediti odgo-varajuće geometrijske parametre otkopne metode. Parametri čije su vrednosti tokom istraživanja menjane su: širina otkopnog bloka (B), osno rastojanje izmedju bočnih utovaranih komora (l), odnosno moćnost pojasa minirane rude (n x m1). Visina bloka (etaže, poluetaže (H = 2h = 80 m) u svim ogledima je imala istu vrednost od 80 m i zadržana je kao konstantna jer odgovara visini horizonta.
2. I serija ogleda
Na osnovu preliminarnih istraživanja [4] i utvrdjivanja oblika figure istakanja (ekscentriciteta elipsoida istakanja) odre-djene su granice u kojima će se kretati promenljivi paramatri predložene konstruk-cije metode otkopavanja. Svaki ogled je radjen za sve moguće kombinacije para-metara i po tri puta.
3. II serija ogleda
Parovi ispitivanih parametara gde su dobijeni loši rezultati su izbačeni iz daljih istraživanja:
Analizom dobijenih rezultata utvrdjeno je da su rezultati, kod razmatrane varijante (model M-1), za osna rastojanja utovarnih komora od 8 m i bilo koje razmatrane širine bloka od 12, 14 i 16 m lošiji od rezultata za osna rastojanja utovarnih komora od 10 i 12 m i bilo koje razmatrane širine bloka.
Povoljni parametri, koji su dali zado-voljavajuće rezultate su dalje istraživani. Dalja istraživanja su vršena sa dva ispusna otvora na modelu M-1. Ovi dopunski ogledi radjeni su sa ciljem da se potvrde rezultati iz prve serije ogleda.
4. III serija ogleda
U ovoj poslednjoj seriji ogleda ponov-ljeni su ogledi sa parametrima gde su dobijeni najpovoljniji odnosi iskorišćenja i osiromašenja rude. Ovi ogledi su radjeni sa žetonima i to na modelu M-1 sa 175 ugradjenih žetona. Ugradjeni žetoni omogu-ćuju vrlo preciznu interpretaciju rezultata istakanja kao i pojava koje se dešavaju u modelu pri istakanju.
Istakanje rude vršeno je u odredjenim dozama, redom iz svake utovarne komore. Prva doza istakanja izvlači se do pojave jalovine u jednoj od utovarnih komora. Jalovina će se prvo pojaviti u trećoj utovarnoj komori. Ovo je potpuno logično jer treća komora imaja čeoni kontakt sa jalovinom. Površina ovog kontakta jednaka je površini bloka rude koji se minira. Sledeće doze istakanja su po 2,5 kg (ravno-merno iz svake komore) do pojave jalovine u ostalim utovarnim komorama. Istakanje se dalje vrši sve do momenta kada osiroma-šenje u komorama predje 50 %. Medjutim, gotovo u svim ogledima istočena je i neka doza više da bi se dobio dovoljan broj tačaka za grafičko prikazivanje osiromašenja u

Broj 3, 2013. Mining & Metallurgy Engineering Bor 108
zavisnosti od iskorišćenja rude u analizama koja se odnose na ispusne otvore.
Pri interpretaciji rezultata formirani su tabelarni i grafički prikazi. U svakoj tabeli, za svaki izvedeni ogled, prikazan je bilans jednog ogleda iz kojeg se vidi, po dozama istakanja, količina istočene rudne mase (rovne rude) Qrm , čiste rude Qčr , i jalovine Qj u kg. Takodje, u tabeli je data i njihova kumulativna vrednost, kao i iskorišćenje rude Ir (%) i osiromašenje rude (%) u dozi i ukupno.
Na osnovu dobijene čiste rude Qčr (kg) iz svake doze deljenjem sa količinom ugra-djene rude Qr (kg) u modelu, za taj ogled dobija se iskorišćenje za svaku dozu [5] tj.
100~ r
rr Q
QI , % (1)
Ukupno iskorišćenje dobija se iz odnosa čiste rude Qčr i to kumulativno, prema ugradjenoj količini rude Qr u modelu.
Osiromašenje za svaku dozu predstavlja odnos količine jalovine Qj za svaku dozu posebno, prema ukupnoj količini rovne rude Qrm, za tu dozu [5] tj.
100rm
jr Q
QO , % (2)
Ukupno osiromašenje dobija se iz odnosa količina jalovine Qj kumulativno, prema količini rudne mase Qrm kumulativno za tu dozu.
INTERPRETACIJA DOBIJENIH REZULTATA
Pri izvodjenju ogleda dobijeni podaci su parcijalno upisivani za svaku utovarnu komoru i u dozama što omogućuje interpretaciju rezultata ukupno za svaki ogled i parcijalno po ispusnim otvorima (za sve serije ispitivanja).
Interpretacija rezultata je izvršena tabelarno i grafičkim prikazima. U tabelama su, za svaki izvedeni ogled, dati dobijeni
rezultati i sračunate vrednosti iskorišćenja i osiromašenja u dozi istakanja i ukupno. Na osnovu računatih vrednosti formirane su grafičke zavisnosti iskorišćenja i osiroma-šenja rude. Za svaku zavisnost data je jednačina, na osnovu teorije najmanjih kvadrata, kojom je opisana promena kao i koeficijent krivolinijske korelacije. Koefici-jentom krivolinijske korelacije je odredjen stepen tačnosti aproksimacije krivih nadjenim jednačinama regresije.
Visoke vrednosti koeficijenta krivo-linijske korelacije ukazuju na visok stepen tačnosti aproksimacije zavisnosti Or = f (Ir) i Or’ = f (Ir), jednačinama regresije. To znači da je pomoću jednačina moguće, sa dovoljno tačnosti, za svaku poznatu vrednost Ir izračunati odgovarajuću vrednost za Or i obrnuto.
Za svaki izvedeni ogled posebno su upisivane vrednosti istočene količine rude i jalovine po ispusnim otvorima. To omo-gućuje da se izvrši i interpretacija parcijalno po ispusnim otvorima. Takodje, na osnovu ovako prikazanih zavisnosti moguće je izvršiti uporedjenje dobijenih rezultata u zavisnosti od položaja ispusnih otvora (utovarnih komora).
ANALIZA DOBIJENIH REZULTATA
Na osnovu izmerenih količina čiste rude i jalovine pri istakanju (u dozama istakanja), za svaki ogled, izračunate su vrednosti iskorišćenja i osiromašenja rude u dozi i ukupno. Sračunate vrednosti su predstav-ljene grafički i dobijene su funkcionalne zavisnosti.
Na modelu M-1 u prvoj seriji ogleda uradjeno je 27 ogleda /6/. Tri puta su širina bloka miniranja (B = 12, 14, 16 m) i osno rastojanje izmedju bočnih utovarnih komora (l = 8, 10, 12 m) menjale svoju vrednost. Za svaki izabrani par ovih parametara ogled je ponavljan po tri puta. U zavisnosti od osnog rastojanja, znači i od moćnosti pojasa minirane rude, u model je ugradjivana
Broj 3, 2013. Mining & Metallurgy Engineering Bor 109
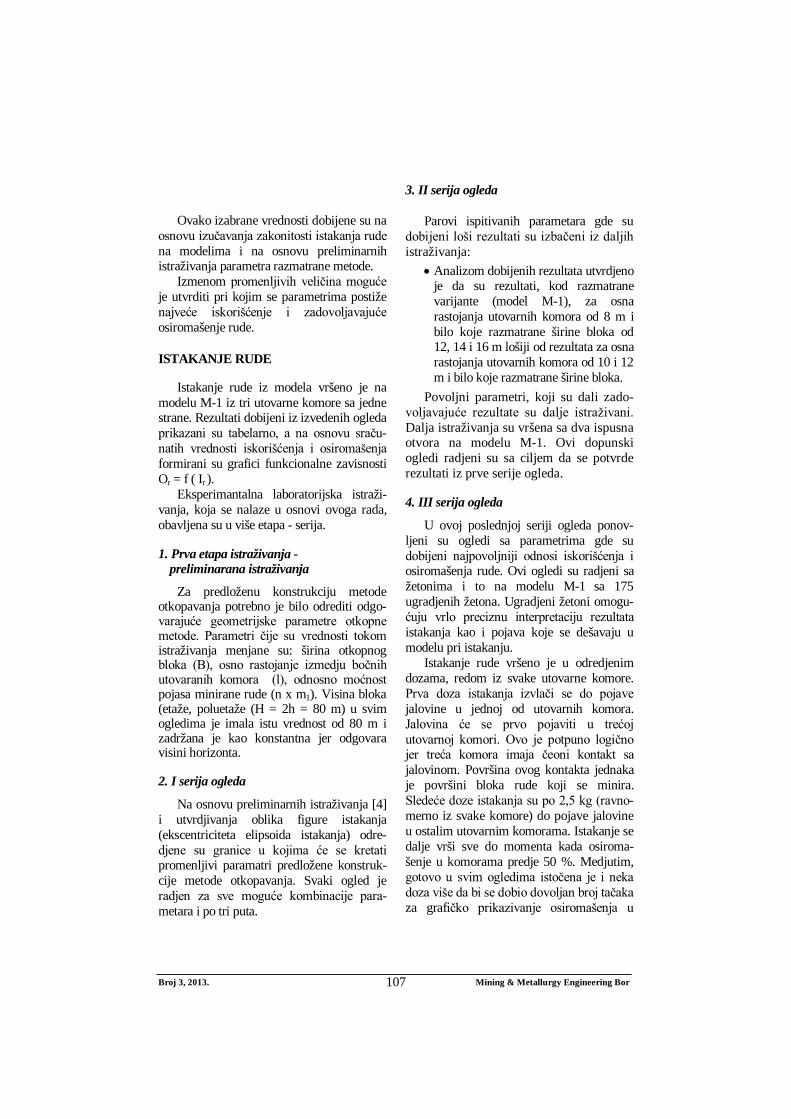
različita količina rude. Dobijeni rezultati jasno ukazuju da se pri promeni osnih rastojanja izmedju utovarnih komora dobijaju različite količine čiste rude. Isto tako za odgovarajuću vrednost osiromašenja različito je iskorišćenje rude kako u dozi tako i ukupno.
Dakle, očigledno je da u I seriji ogleda pri bilo kojoj promeni parametara naj-povoljniji se rezultati dobijaju kada je osno rastojanje l = 12 m. Pri ovim vrednostima parametara dobija se količina čiste rude od
preko 22 %. Za ukupno osiromašenje od 89,94 % dobija se osiromašenje od 10,68 % /1/.
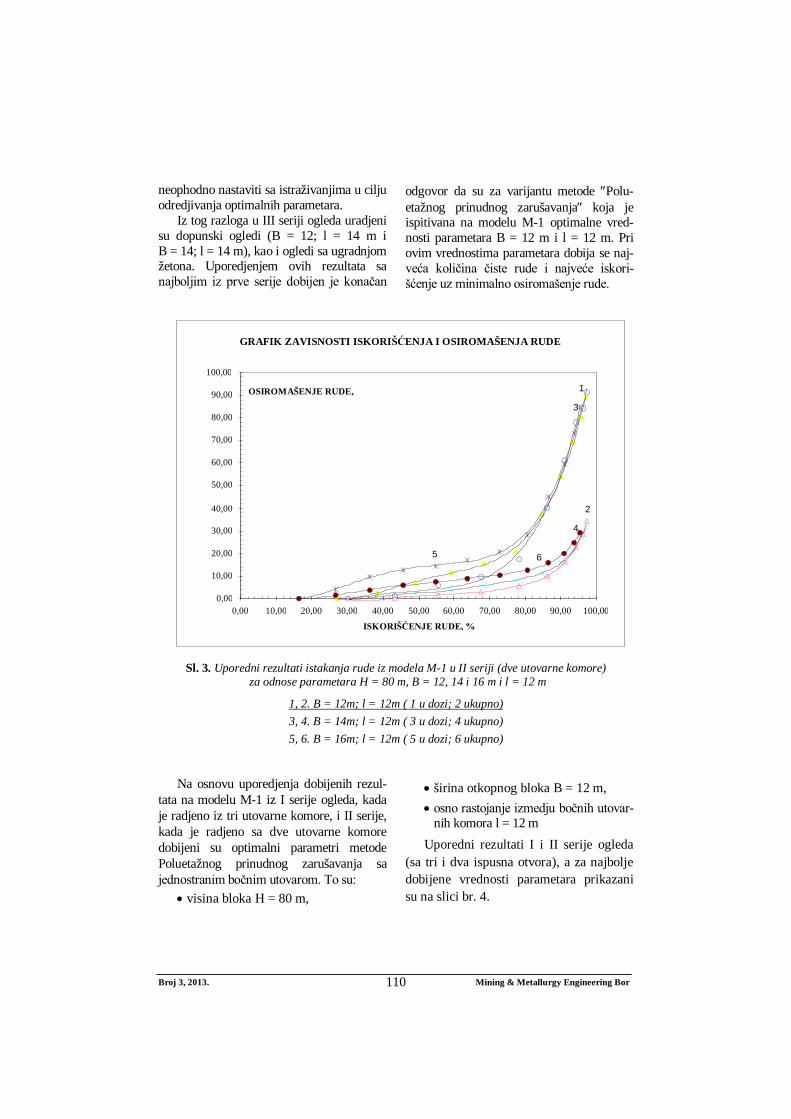
U drugoj seriji ogleda na modelu M-1 radjeni su ogledi za iste vrednosti para-metara koji su menjani, ali sa dva ispusna otvora. Osna rastojanja od l = 8 m, zbog očigledno najlošijih rezultata u ovoj seriji nisu razmatrana. I u ovoj seriji ogleda dobijeni su najpovoljniji rezutati za B = 12 m i l = 12 m, što je potvrdilo zaključke iz prve serije ogleda.
Sl. 2. Uporedni rezultati istakanja rude iz modela M-1 u I seriji (tri utovarne komore) za odnose
parametara H = 80 m, B = 12, 14 i 16 m i l = 12 m
1, 2. B = 12m; l = 12m ( 1 u dozi; 2 ukupno) 3, 4. B = 14m; l = 12m ( 3 u dozi; 4 ukupno) 5, 6. B = 16m; l = 12m ( 5 u dozi; 6 ukupno)
Rezultati istraživanja (uporedni za raz-
ličite širine bloka) za osno rastojanje od l = 12 m pri istakanju u II seriji, gde je radjeno sa dve bočne utovarne komore prikazani su na sl. br. 3.
Na osnovu ogleda iz I i II serije na mo-delu M-1 dobijeni su najpovoljniji rezultati za najveću ispitivanu vrednost osnog rasto-janja l i najmanju vrednost širine bloka B koja je ispitivana. Sve ovo ukazuje da je
GRAFIK ZAVISNOSTI ISKORIŠĆENJA I OSIROMAŠENJA RUDE
13
4
5
6
2
0,00
10,00
20,00
30,00
40,00
50,00
60,00
70,00
80,00
90,00
100,00
0,00 10,00 20,00 30,00 40,00 50,00 60,00 70,00 80,00 90,00 100,00
ISKORIŠĆENJE RUDE, %
OSIROMAŠENJE RUDE, %
Broj 3, 2013. Mining & Metallurgy Engineering Bor 110
neophodno nastaviti sa istraživanjima u cilju odredjivanja optimalnih parametara.
Iz tog razloga u III seriji ogleda uradjeni su dopunski ogledi (B = 12; l = 14 m i B = 14; l = 14 m), kao i ogledi sa ugradnjom žetona. Uporedjenjem ovih rezultata sa najboljim iz prve serije dobijen je konačan
odgovor da su za varijantu metode Polu-etažnog prinudnog zarušavanja koja je ispitivana na modelu M-1 optimalne vred-nosti parametara B = 12 m i l = 12 m. Pri ovim vrednostima parametara dobija se naj-veća količina čiste rude i najveće iskori-šćenje uz minimalno osiromašenje rude.
Sl. 3. Uporedni rezultati istakanja rude iz modela M-1 u II seriji (dve utovarne komore)
za odnose parametara H = 80 m, B = 12, 14 i 16 m i l = 12 m
1, 2. B = 12m; l = 12m ( 1 u dozi; 2 ukupno) 3, 4. B = 14m; l = 12m ( 3 u dozi; 4 ukupno) 5, 6. B = 16m; l = 12m ( 5 u dozi; 6 ukupno)
Na osnovu uporedjenja dobijenih rezul-
tata na modelu M-1 iz I serije ogleda, kada je radjeno iz tri utovarne komore, i II serije, kada je radjeno sa dve utovarne komore dobijeni su optimalni parametri metode Poluetažnog prinudnog zarušavanja sa jednostranim bočnim utovarom. To su:
visina bloka H = 80 m,
širina otkopnog bloka B = 12 m, osno rastojanje izmedju bočnih utovar-
nih komora l = 12 m Uporedni rezultati I i II serije ogleda
(sa tri i dva ispusna otvora), a za najbolje dobijene vrednosti parametara prikazani su na slici br. 4.
GRAFIK ZAVISNOSTI ISKORIŠĆENJA I OSIROMAŠENJA RUDE
2
1 3
4
5 6
0,00
10,00
20,00
30,00
40,00
50,00
60,00
70,00
80,00
90,00
100,00
0,00 10,00 20,00 30,00 40,00 50,00 60,00 70,00 80,00 90,00 100,00 ISKORIŠĆENJE RUDE, %
OSIROMAŠENJE RUDE,
Broj 3, 2013. Mining & Metallurgy Engineering Bor 111
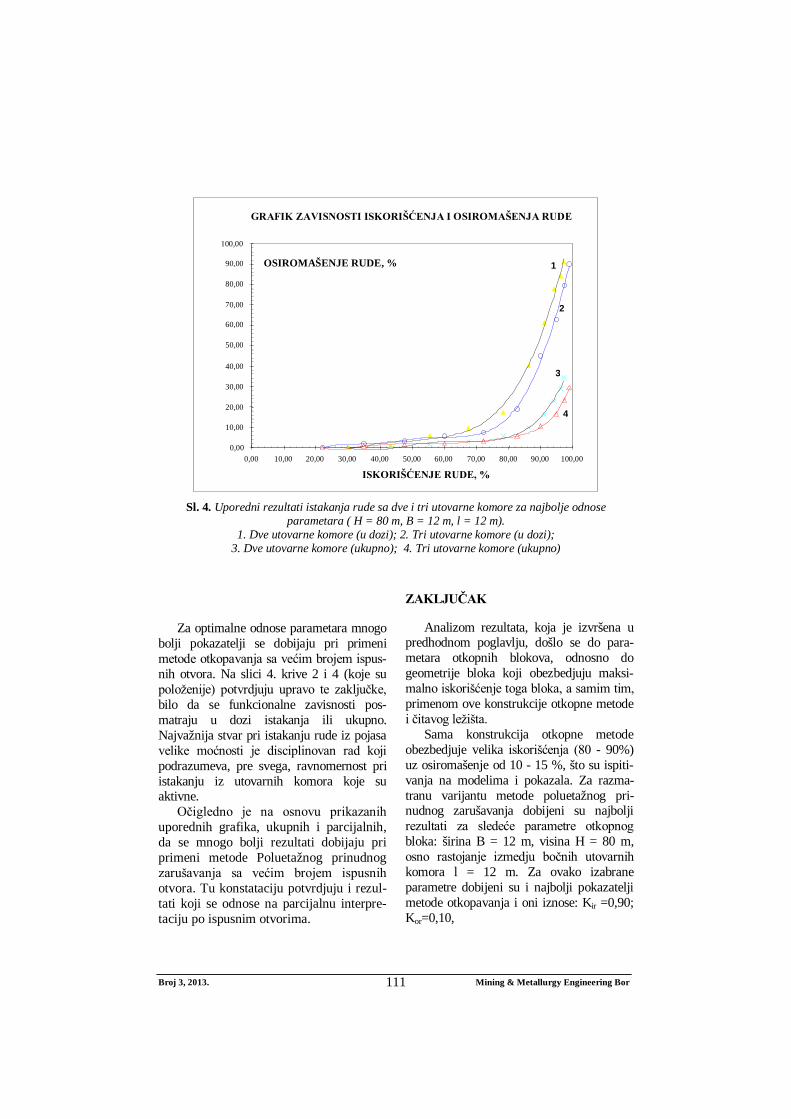
Sl. 4. Uporedni rezultati istakanja rude sa dve i tri utovarne komore za najbolje odnose
parametara ( H = 80 m, B = 12 m, l = 12 m). 1. Dve utovarne komore (u dozi); 2. Tri utovarne komore (u dozi);
3. Dve utovarne komore (ukupno); 4. Tri utovarne komore (ukupno)
Za optimalne odnose parametara mnogo
bolji pokazatelji se dobijaju pri primeni metode otkopavanja sa većim brojem ispus-nih otvora. Na slici 4. krive 2 i 4 (koje su položenije) potvrdjuju upravo te zaključke, bilo da se funkcionalne zavisnosti pos-matraju u dozi istakanja ili ukupno. Najvažnija stvar pri istakanju rude iz pojasa velike moćnosti je disciplinovan rad koji podrazumeva, pre svega, ravnomernost pri istakanju iz utovarnih komora koje su aktivne.
Očigledno je na osnovu prikazanih uporednih grafika, ukupnih i parcijalnih, da se mnogo bolji rezultati dobijaju pri primeni metode Poluetažnog prinudnog zarušavanja sa većim brojem ispusnih otvora. Tu konstataciju potvrdjuju i rezul-tati koji se odnose na parcijalnu interpre-taciju po ispusnim otvorima.
ZAKLJUČAK
Analizom rezultata, koja je izvršena u predhodnom poglavlju, došlo se do para-metara otkopnih blokova, odnosno do geometrije bloka koji obezbedjuju maksi-malno iskorišćenje toga bloka, a samim tim, primenom ove konstrukcije otkopne metode i čitavog ležišta.
Sama konstrukcija otkopne metode obezbedjuje velika iskorišćenja (80 - 90%) uz osiromašenje od 10 - 15 %, što su ispiti-vanja na modelima i pokazala. Za razma-tranu varijantu metode poluetažnog pri-nudnog zarušavanja dobijeni su najbolji rezultati za sledeće parametre otkopnog bloka: širina B = 12 m, visina H = 80 m, osno rastojanje izmedju bočnih utovarnih komora l = 12 m. Za ovako izabrane parametre dobijeni su i najbolji pokazatelji metode otkopavanja i oni iznose: Kir =0,90; Kor=0,10,
GRAFIK ZAVISNOSTI ISKORIŠĆENJA I OSIROMAŠENJA RUDE
1
4
2
3
0,00
10,00
20,00
30,00
40,00
50,00
60,00
70,00
80,00
90,00
100,00
0,00 10,00 20,00 30,00 40,00 50,00 60,00 70,00 80,00 90,00 100,00
ISKORIŠĆENJE RUDE, %
OSIROMAŠENJE RUDE, %

Broj 3, 2013. Mining & Metallurgy Engineering Bor 112
Da bi se ostvarila ovakva iskorišćenja, neophodno je pridržavati se režima utovara iz utovarnih komora, odnosno treba utova-rati iste ili približno iste količine rude iz svih utovarnih komora iz kojih se vrši utovar rude.
U ispitivanjima kod varijante razmatrane metode istakanje rude obavljano je iz dve i tri utovarne komore. Medjusobni odnos rezultata ukazuje da treba ići sa većim brojem utovarnih mesta. Na taj način postižu se bolji efekti odnosno dobijaju se veća iskorišćenja.
LITERATURA
[1] V. Milić, Istraživanje osnovnih para-metara novih metoda poluetažnog prinudnog zarušavanja za otkopavanje dubokih delova borskog ležišta. Doktorska disertacija, Bor, 1996.
[2] R. Kojdić, Prilog odredjivanju najpo-voljnijih parametara otkopne metode, sa tehno-ekonomskog aspekta, u uslo-vima eksploatacije bakarnog ležišta Bor na velikim dubinama, Doktorska disertacija, Bor, 1991.
[3] V. Milić, Ž. Milićević, N. Atanasković, Odredjivanje parametara metode polu-etažnog prinudnog zarušavanja mode-liranjem. Podzemni radovi. Beograd, 1994.
[4] V. Milić, Ž. Milićević, Odredjivanje ekscentriciteta elipsoida točenja rude iz Borskog ležišta. Glasnik rudarstva i metalurgije. Bor, 1995.
[5] V. Milić, Ž. Milićević, Osnovi eks-ploatacije ležišta mineralnih sirovina, Bor, 2005.
[6] M. M. Protodjakonov, P. I. Teder, Metodika racionalnogo planirovanija eksperimentov fizičko-mehaničeskie gornye problemy, Moskva, ”Nauka”, 1971.
[7] V. Milić, I. Svrkota, D., Istraživanje stabilnosti dna otkopnog bloka za metodu poluetažnog prinudnog zaruša-vanja sa jednostranim bočnim utova-rom rude, Mining and Metallurgy Engineering Bor, 2/2013, str. 27-32